Review

Use of Bioindication Methods in National, Regional and Local Monitoring in Poland—Changes in the Air Pollution Level over Several Decades

W. Szafer Institute of Botany, Polish Academy of Sciences, 31-512 Kraków, Poland
Atmosphere 2020, 11(2), 143; https://doi.org/10.3390/atmos11020143
Submission received: 27 December 2019 / Revised: 20 January 2020 / Accepted: 24 January 2020 / Published: 28 January 2020
(This article belongs to the Special Issue Biomonitoring of Air Pollution)

Abstract

:
In Poland, the first studies using mosses as indicators of the heavy metal air pollution level were carried out in national parks already in the 1970s. They were continued later in 10-year intervals. In 1990, when Poland join the European Heavy Metals Deposition Program, the entire area of the country was included in such research. Moss surveys were repeated at five-year intervals, to varying degrees. Pleurozium schreberi samples were collected from 150 (1990) to over 300 sites (1995 and 2015) throughout the country, either in selected regions diversified in terms of both the level of industrialization and urbanization (2001 and 2015), or only in national parks (2005). On a small scale, changes in the level of heavy metals were recorded in the period from 1975 to 2014 in the Niepołomice Forest located near Kraków. Concentrations of ten heavy metals were constantly monitored. Additionally, in some moss surveys, other elements or compounds, such as 137cesium, PAHs and nitrogen were analyzed. During the 1990s, in all of Europe, there was a significant decrease in the level of heavy metals. In Poland, the spatial patterns of metal accumulation in mosses were similar throughout the entire study period: The southern part of the country, more industrialized and densely populated, is still the most polluted, and the northeastern part belongs to the cleanest regions. In the Niepołomice Forest, emissions from the big steel mill and from the Kraków agglomeration had the greatest impact on pollution from the 1970s to the 1990s, but lately the impact of local emission sources is more visible. Compared to other European countries, Poland and neighboring countries of Central Europe are at the forefront of the most polluted areas in Europe.

Graphical Abstract

1. Introduction

The effect of human activity, especially in the period from the second half of the 20th century, is the increased supply of various pollutants in the environment. Large amounts of easily absorbable compounds of nitrogen, phosphorus, heavy metals, etc. that appear in the air, water and soil, disturb the proportions between the elements taken up by living organisms and lead to increased variability of their chemical composition. The reaction of organisms to changing environmental conditions, such as an increase of heavy metal levels in tissues, is a characteristic used in bioindication. Almost half a century has passed since the first pioneering works proposing the use of mosses as bioindicators of the level of heavy metal air pollution [1,2,3]. The ability of bryophytes to accumulate large amounts of heavy metals is very well-known today (among others [4,5,6,7]). Some species that have a wide geographical range are also common and abundant in various plant communities and therefore are convenient to use as bioindicators [4,7,8]. The advantage of this method is simplicity and low cost, which allows us to set up a dense sampling grid, which would be impossible with conventional analyses using automatic measuring devices [9].
The method of assessing air pollution by using bioindicators not only is in constant and widespread use, but is also continuously being developed. Originally adopted to control the degree of heavy metal air pollution, the method is currently being tested for the detection of other elements/compounds, e.g., nitrogen [10,11,12], organic air pollution [13,14,15,16,17,18,19], including dioxins [20] and radionuclides [21,22,23]. Its variants, such as moss transplants and moss-bag methods [24,25,26,27,28] are developed and improved. Different species of mosses are tested [24,29,30,31]. Using moss for biomonitoring has become an important element of air assessment programs on different scales: regionally (e.g., [32,33,34,35,36]), in countries (e.g., [37,38]) and even over continents (e.g., [39,40,41,42,43]). In the early 1980s, a group of Scandinavian ecologists (Nordic Expert Group for Heavy Metal Deposition) created a heavy metal monitoring program, aiming to learn about the spatial and temporal dynamics of environmental pollution levels on a European scale. Since 1995, such monitoring has been carried out over Europe as a part of the International Cooperation Program on the Impact of Air Pollution on Natural Ecosystems and Crops (ICP Vegetation, Working Group on Effects and Long-Range Transboundary Air Pollution Convention). Air quality is assessed by measuring the accumulation of trace metals and other elements in moss growing in the field [9,42,43,44]. As part of ICP Vegetation, mosses are collected every five years from several thousand locations throughout Europe (one sample/1000 km2). The data obtained from such studies allow us to formulate conclusions that are important on a national and transnational scale. Many studies show that mosses also work well in small-scale monitoring—they are useful in detecting and monitoring pollution from local point sources, such as cities [31,45,46,47], factories and steel works [48,49,50], and landfills [27]. To know the extent of air pollution produced from local emission sources, it is recommended to increase the sampling density.
Studies initiated in Scandinavia that were using mosses as bioindicators have also been developed in Poland. Two species of mosses (Pleurozium schreberi and Hylocomium splendens) were used to determine the level of heavy metal air pollution in national parks, and one moss species (Pleurozium schreberi) was used in the Niepołomice Forest (small forest complex near Kraków), already, in the second half of the 1970s [51,52]. Since the beginning of the 1990s (1990, 1995, 2000, 2005, 2010 and 2015) Poland has participated in the European monitoring of metal deposition in the environment [35,39,40,41,42,43]. Data from Poland are systematically published, primarily in European reports [40,41,42,43]. There was also a report on the area of the Visegrad Group countries [36], as well as numerous individual publications [12,37,38,51,53,54,55,56,57,58].
The article includes the results of research using mosses as bioindicators that were performed throughout Poland, in Polish national parks and an exemplary model area, the Niepołomice Forest—a small forest complex located near Krakow. These data cover a period of time from the mid-1970s to 2015 (last moss survey under ICP Vegetation program).

2. Materials and Methods

2.1. Study Area

Pleurozium schreberi samples were collected from 150 (1990) to over 300 sites (1995 and 2015) throughout the country. Twice (2001 and 2015), research was carried out only within four large areas (each about 100 × 100 km2). The results of research carried out in these four regions are discussed in detail in the article by Kapusta and Godzik, called “Biomonitoring of Air Pollution”, in Atmosphere, Special Issue. From the 1970s, pollution monitoring was carried out in national parks (1975 in 12 then-existing parks; currently in 23), as well as in the Niepołomice Forest—a small forest complex located near Kraków (Table 1).

2.2. Materials and Sample Collection

A terrestrial, carpet forming, pleurocarpous and endohydric moss species—Pleurozium schreberi (Brid.) Mitt.—was mainly used for the research. In a lot of regions in Europe, this species is most commonly used as an indicator of air quality (e.g., [36,43]). In Poland, this species is common and occurs in various types of forests, although it prefers coniferous habitats.
Moss samples were collected in summer (August) or early autumn (September), according to a standard protocol used with heavy metals in the moss-monitoring network in Europe (e.g., [39,40]). Five-year intervals for research carried out all over Poland were implemented to follow the guidelines of the ICP Vegetation program. Moss samples throughout Poland are first collected in the lowland part of the country (Central and Northern Poland), and finally in the mountains, because, in all sites, mosses are collected at the same phenological stage. At each site, moss samples were taken from an area of approximately 200 m2, from several carpets under small gaps in the tree canopy (for a reduction of effect of throughfall), and then prepared into a composite sample. The samples were taken at least 300 m from highways and 100 m from smaller communication routes and away from local emission sources. Moss samples were cleaned from mechanical impurities, after transporting to the laboratory. Except for the two first moss campaign in national parks (1976 and 1986), chemical analyses were performed only in the green parts of the gametophyte, representing their growth of about 3 years.

2.3. Laboratory Work

Table 1 shows the scope of analyses performed for sets in individual years of research.
Plant materials were homogenized, using a rotor mill, and dried at 70–80 °C. Samples were digested in a mixture of acids (1 HNO3:4 HClO3 vol.), and then the content of elements was measured depending of concentration, either by flame atomic absorption spectrometry (during the 1970s till the end of the 1990s: Perkin Elmer 403, Varian Techtron 1000, Varian 20BQ, and since 2000: Varian AA280FS) or by graphite furnace atomic absorption spectrometry (GTA 110 of Varian AA220FS). To control the quality of chemical analysis, the reference materials no. M2 and M3 (prepared for European moss monitoring, [59]) were used. Concentrations were calculated on a dry-weight basis.
Total nitrogen was measured by using Kjeldahl method (Foss Tecator Kjeltec 2300 Analyzer Unit) after dry moss material digestion in H2SO4 (detailed methodology is given in the publication by [12]).
Moss samples collected for analysis of the polycyclic aromatic hydrocarbons (PAHs) content were prepared for analyses, using the ASE-200 extractor (Dionex), and the concentrations of individual 16 hydrocarbons were determined by chromatography method on HPLC Dionex-500 (detailed methodology is given in the publication by [18]).
137Cs activity in Pleurozium schreberi (1986, national parks) was determined by using high-resolution radiation spectrometry γ.
All chemical analyzes, except for the first research in national parks [51], were carried out at the Ecotoxicological Laboratory of the Department of Ecology IB PAS.

3. Results and Discussion

3.1. A Large Spatial Scale—The Whole Area of Poland

The aim of the research conducted in Poland was to identify the most polluted areas, as well as to compare the level of environmental burden (forests) in our country to the rest of Europe. Research on a large spatial scale, i.e., throughout the whole country, began in 1990. The variability of natural environmental conditions and, at the same time, a significant diversity of anthropogenic influences (the industry is located mainly in the southern part of the country) implied high density of sampling. Samples of Pleurozium schreberi moss were then collected at 150 sites, which were quite regularly distributed over the country [55]. The second collection took place in 1995, at 297 sites. For the first time, the results of research carried out in our country were forwarded to the European center conducting the research within ICP Vegetation (International Cooperative Program on Effects of Air Pollution on Natural Vegetation and Crops), where WGE (Working Group on Effects) coordinates research within Convention on Long-Range Transboundary Air Pollution (LTRAP). Since 2000, the research has been managed by the Center for Ecology and Hydrology (CEH), Bangor, UK. The moss collection in 2010 was carried out throughout the country, at 320 sites. Twice, i.e., in 2001 and 2015, research was carried out only within four large areas (each of about 100 × 100 km2) located on the transect from the southwest and south (heavily industrialized and urbanized part of the country) to the northeast (clean area). Two of these areas were located in contaminated regions (Lower Silesia—area under the impact of Legnica–Głogów Copper Basin, with copper mines and smelters, and Upper Silesia–Kraków Industrial District, with coal mines, coal-based facilities, zinc-lead ore mines and smelters, and steelworks), one area included a moderately contaminated region (Mazovia Lowland, Central Poland), and one was regarded as the reference area (northeastern part of Poland).
The systematic reduction of emissions in Europe and, consequently, the deposition of metals resulted in a lower concentration of those elements in mosses. Generally, the largest decreases in metal concentrations in mosses were recorded between 1990 and 1995 (or 2000). For mosses collected in 1990 and 2005, the most visible decrease was in lead and arsenic (about 72%), and in vanadium, cadmium and iron concentrations (45–60%). Average decreases were recorded for zinc, copper and nickel (about 20–30%), while there was no significant change in chromium concentration [42]. Considering the longer, 20-year period (1990–2010), mean cadmium concentrations decreased by about 50%, and concentrations of lead close to 80%, chromium about 40%, while zinc, nickel and iron decreased by about 30%. Only the decrease in the level of copper was lower and amounted to about 10% [9,43].
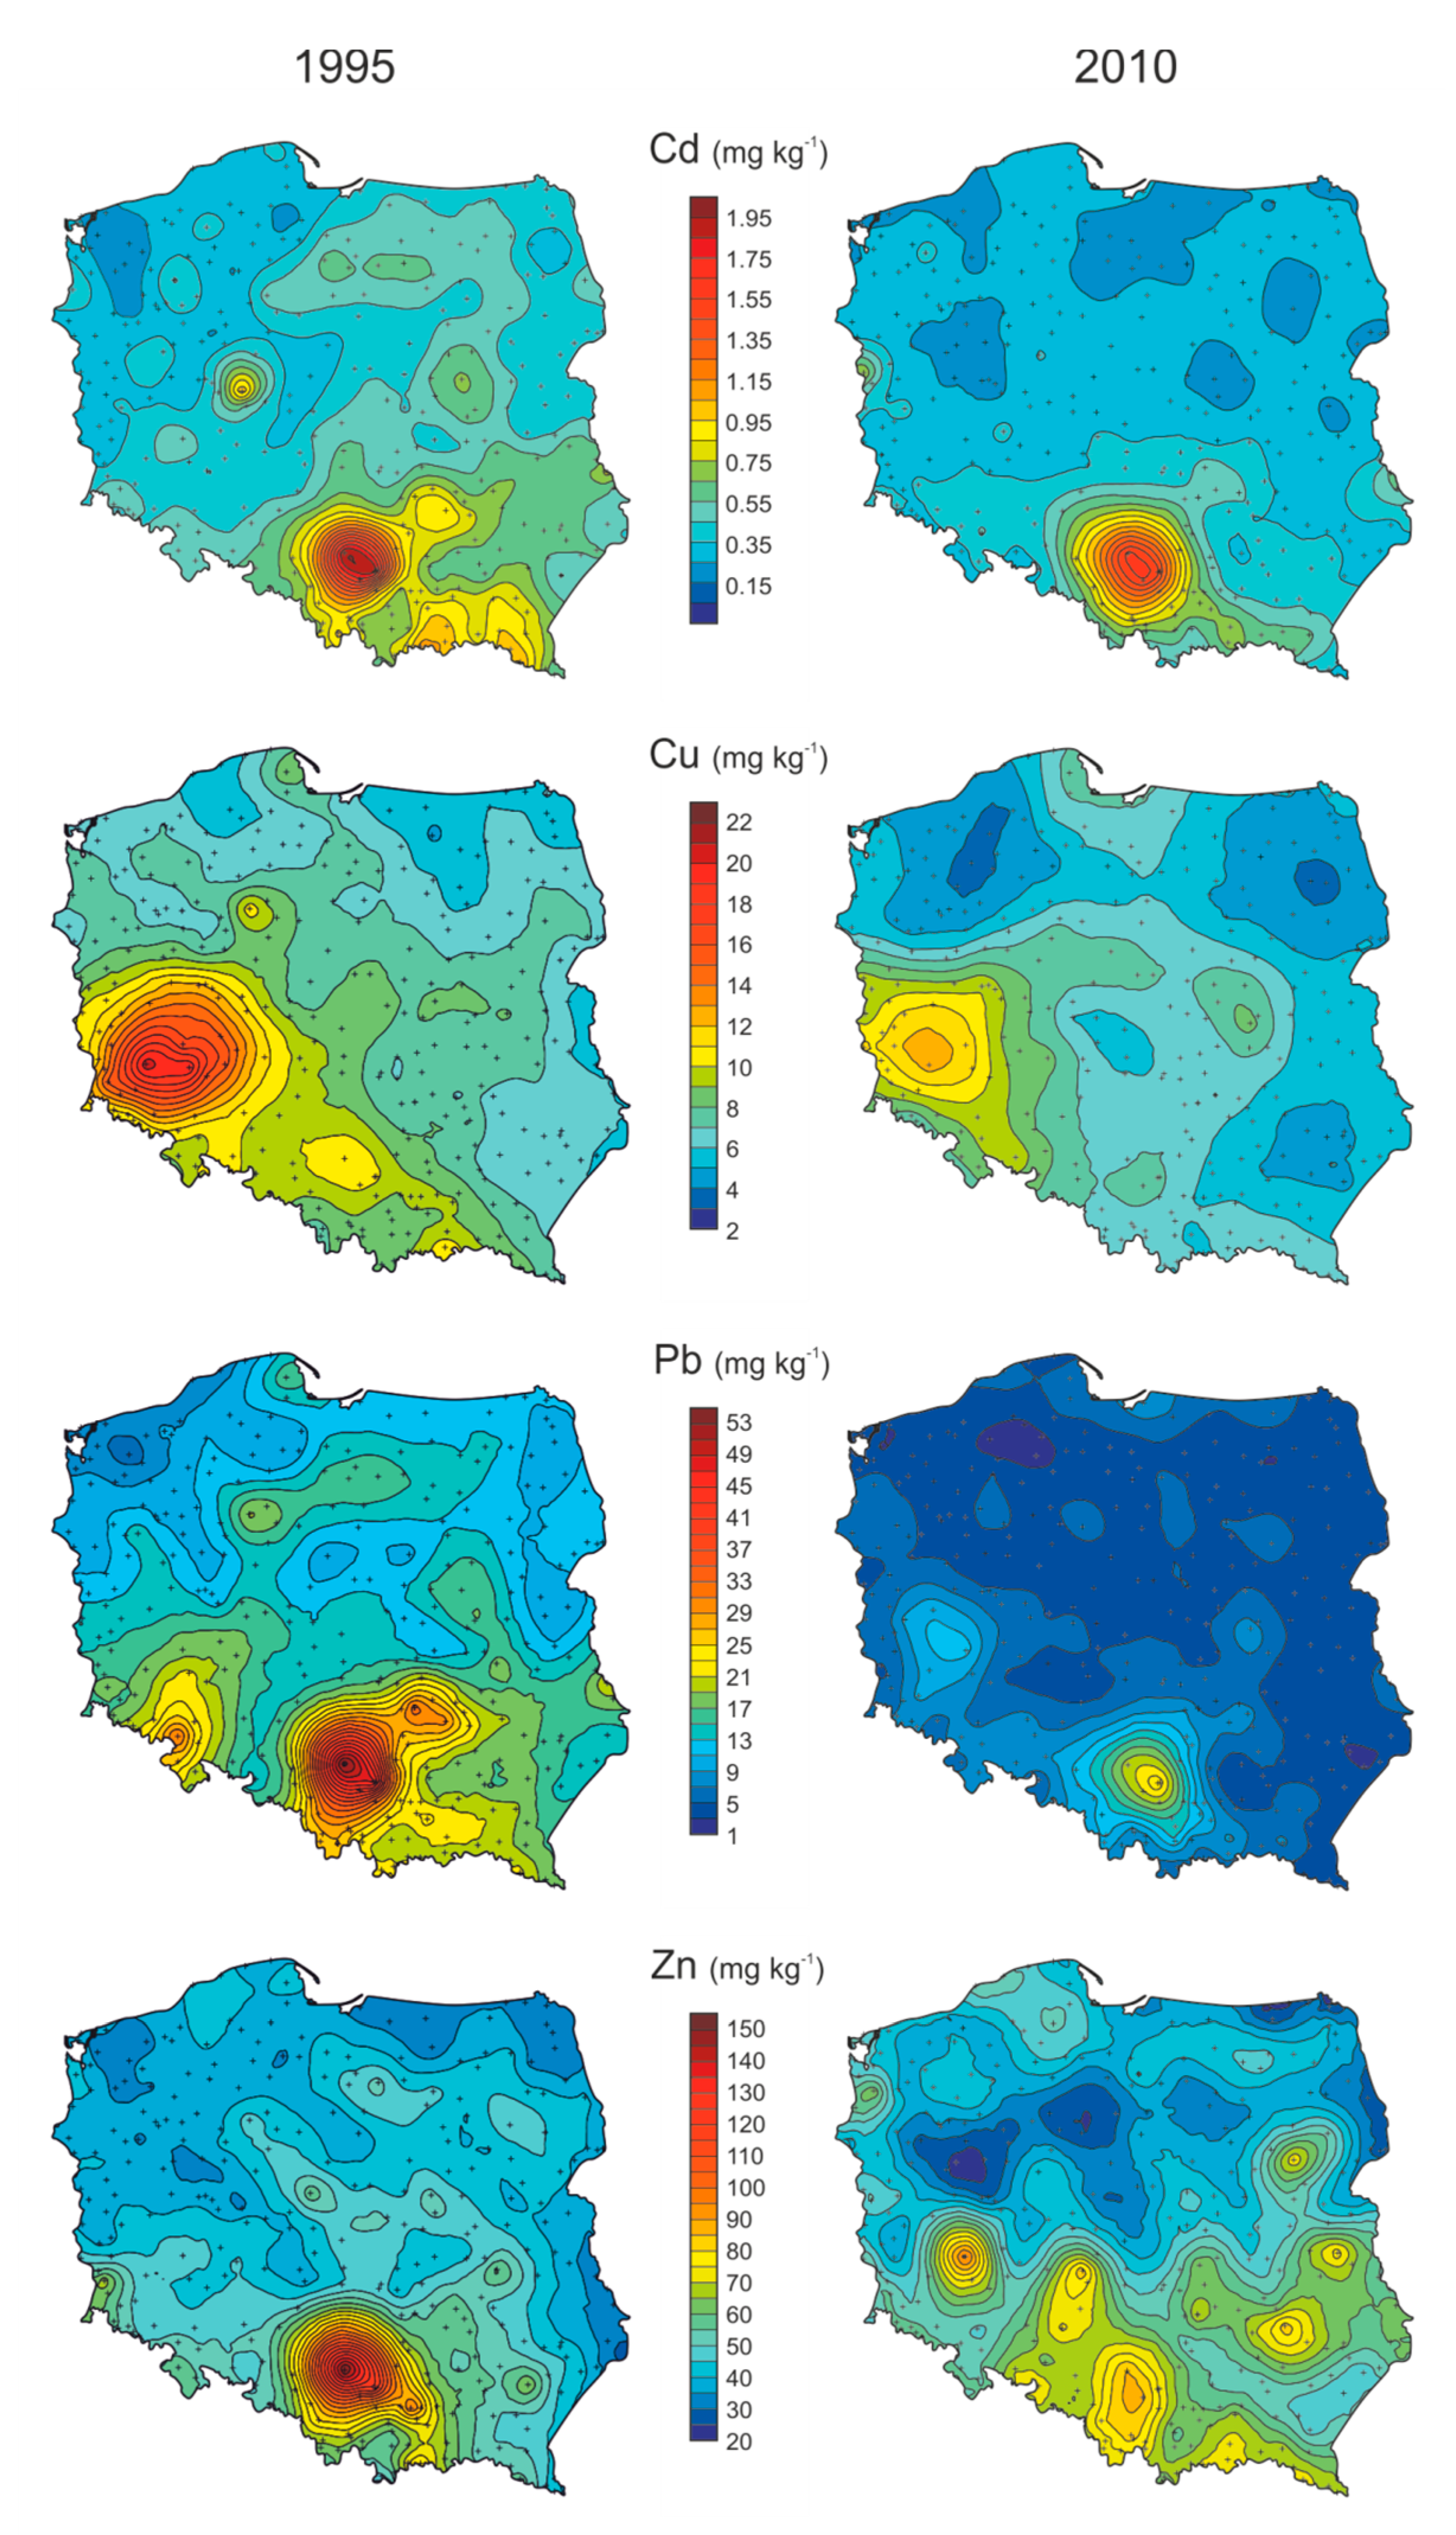
During the period from 1990 to 2010, the reduction of metal emissions to the atmosphere in Poland was significant and amounted to about 30% for copper, 40% for lead and 50% for cadmium and zinc [60,61]. The average metal concentrations in Pleurozium schreberi were lower in 2010 compared to 1995, but these differences were not always statistically significant for individual voivodeships [38]. Compared to the rest of Europe, Poland ranks among the countries that still have a fairly high level of pollution, e.g., our country ranks sixth due to the cadmium load, and seventh in terms of lead level (out of 24 countries) (Figure 1; [43]).
Research conducted in Poland indicates that the most industrialized centers are still the largest sources of pollution. The spatial distribution pattern of the areas most loaded with metals is associated with ore mines and metallurgical processing plants located in Southern Poland. The most polluted regions include the Lower Silesia (with the Legnica–Głogów Copper Basin) and the Upper Silesia–Kraków Industrial District (including numerous industrial plants and mines located in Upper Silesia, as well as the mines and zinc smelter in Bukowno near Olkusz in the Małopolska Voivodeship). The highest copper concentrations were recorded in the Lower Silesia, where the copper mines and smelters are located, whereas the highest cadmium, lead, zinc and iron concentrations were noted in the Małopolska Voivodeship, both in 1995 and 2010 (Figure 2; [38]).
Mosses were not only efficient indicators of heavy metals (HM) environmental load, but also of nitrogen (N) and polycyclic aromatic hydrocarbons (PAHs). Various species were tested as indicators of nitrogen levels in the environment. For example, it was found that Hypnum cupressiforme accumulated more nitrogen than Pleurozium schreberi [62]. It was also found that there is a statistically significant relationship between nitrogen concentration in H. cuppressiforme’s tissues and nitrogen concentration in atmospheric precipitation [62].
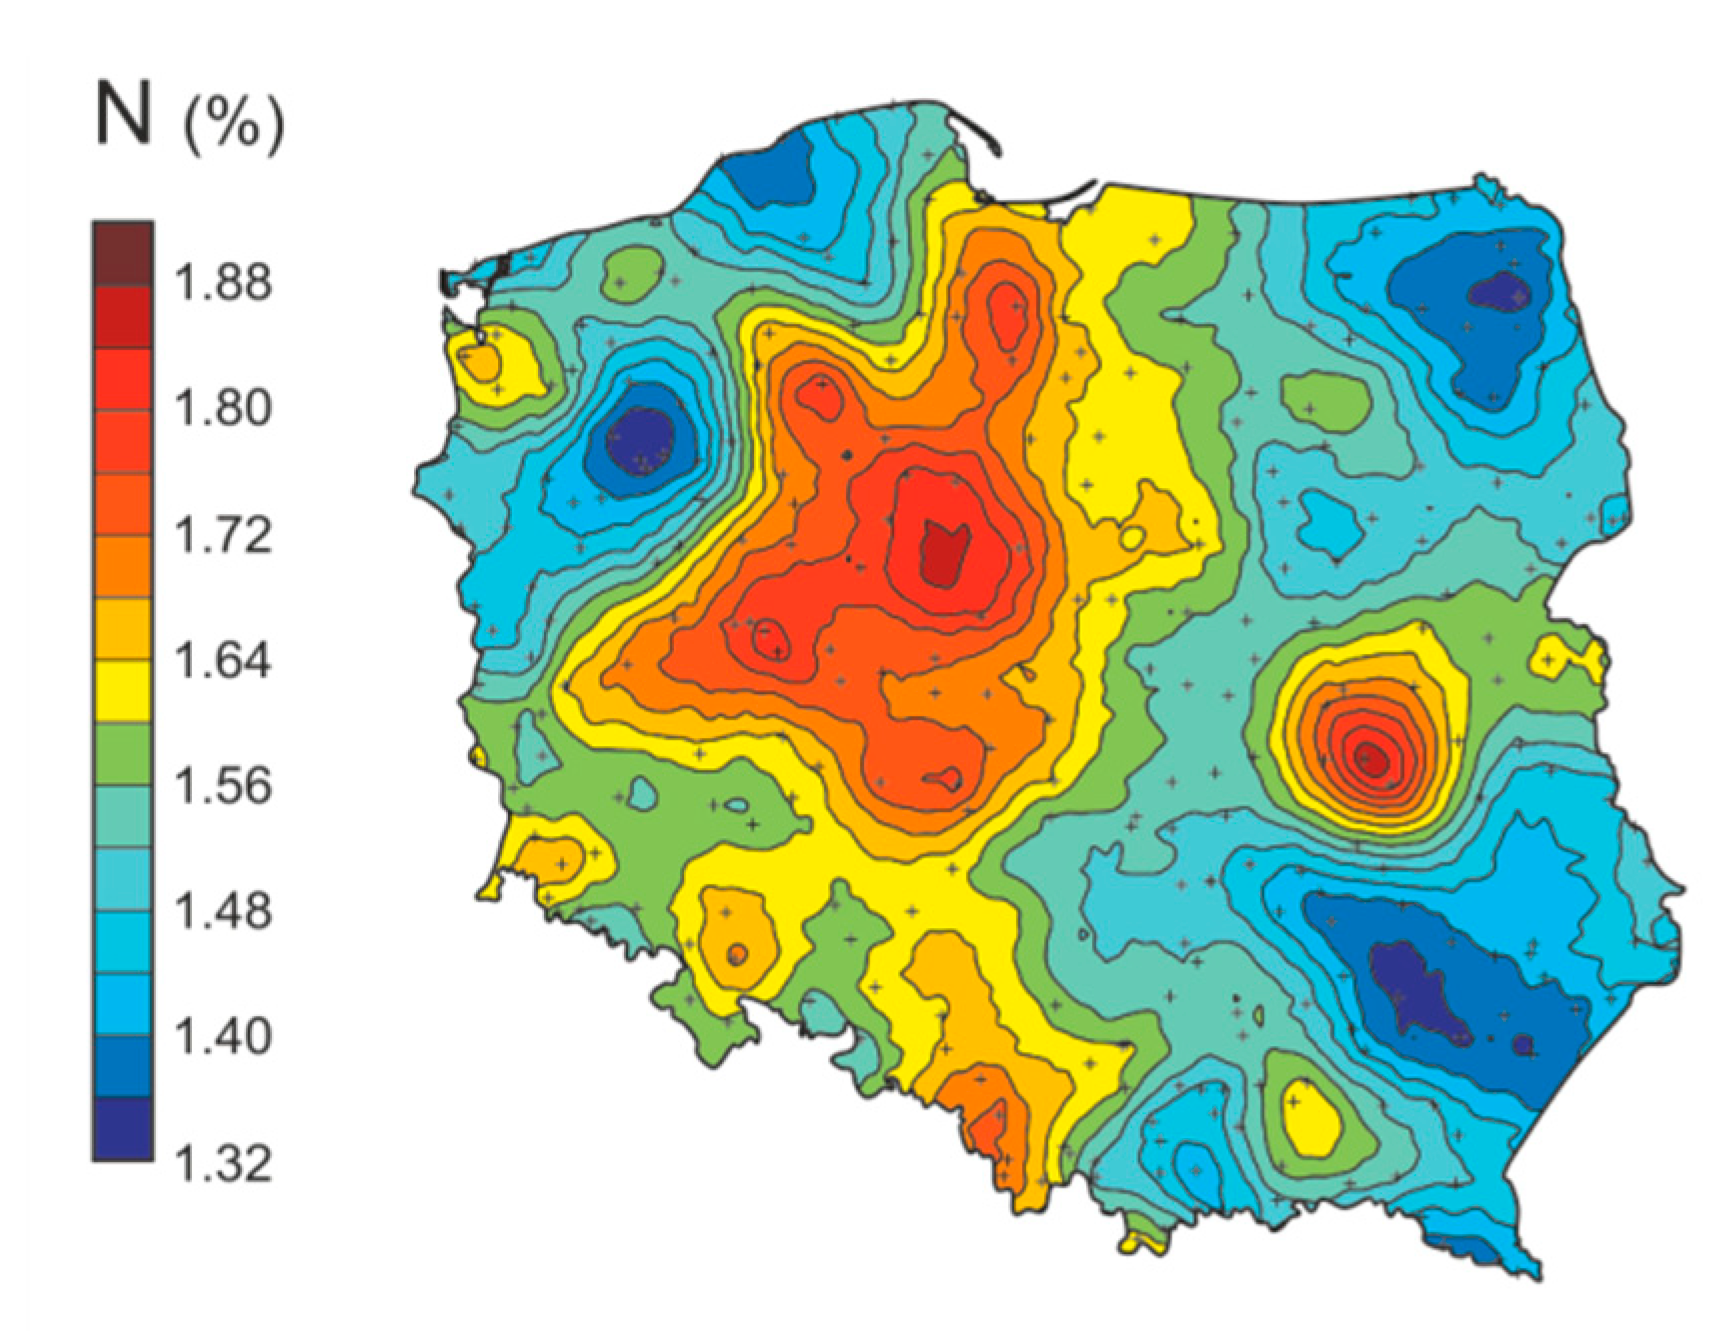
Pleurozium schreberi samples collected in Poland in 2010 (320 sites evenly distributed throughout country) were tested to determine the nitrogen levels. The concentration of total nitrogen in mosses ranged from 0.78% to 2.86%, reaching an average value of 1.56% (Figure 3; [12]). Although the differences between individual voivodeships (provinces) were not statistically significant, nitrogen concentrations corresponded to the intensity of fertilization of agricultural land and the volume of particulate emissions. These independent variables explained nearly 66% of the nitrogen content variation in mosses. The spatial pattern of nitrogen distribution in Poland, in addition to the intensity of agricultural production (= the amount of fertilizers used) and livestock farming, is superimposed on the presence of large point sources of nitrogen emissions, such as chemical plants producing fertilizers [12]. Compared to other European countries, the level of nitrogen was similar to the levels found in highly industrialized countries, but much higher than in Scandinavia [9,43]. There is no clear trend of temporal changes of the nitrogen level in mosses. In European countries where the analyses were carried out in 2005 and 2010, the average median value decreased (Slovenia), while the concentration of nitrogen in mosses from other countries (Czech Republic and France) increased during the five-year study period [9]. In Poland, due to the high level of nitrogen concentration detected in the analysis carried out in 2010, such tests should be repeated.
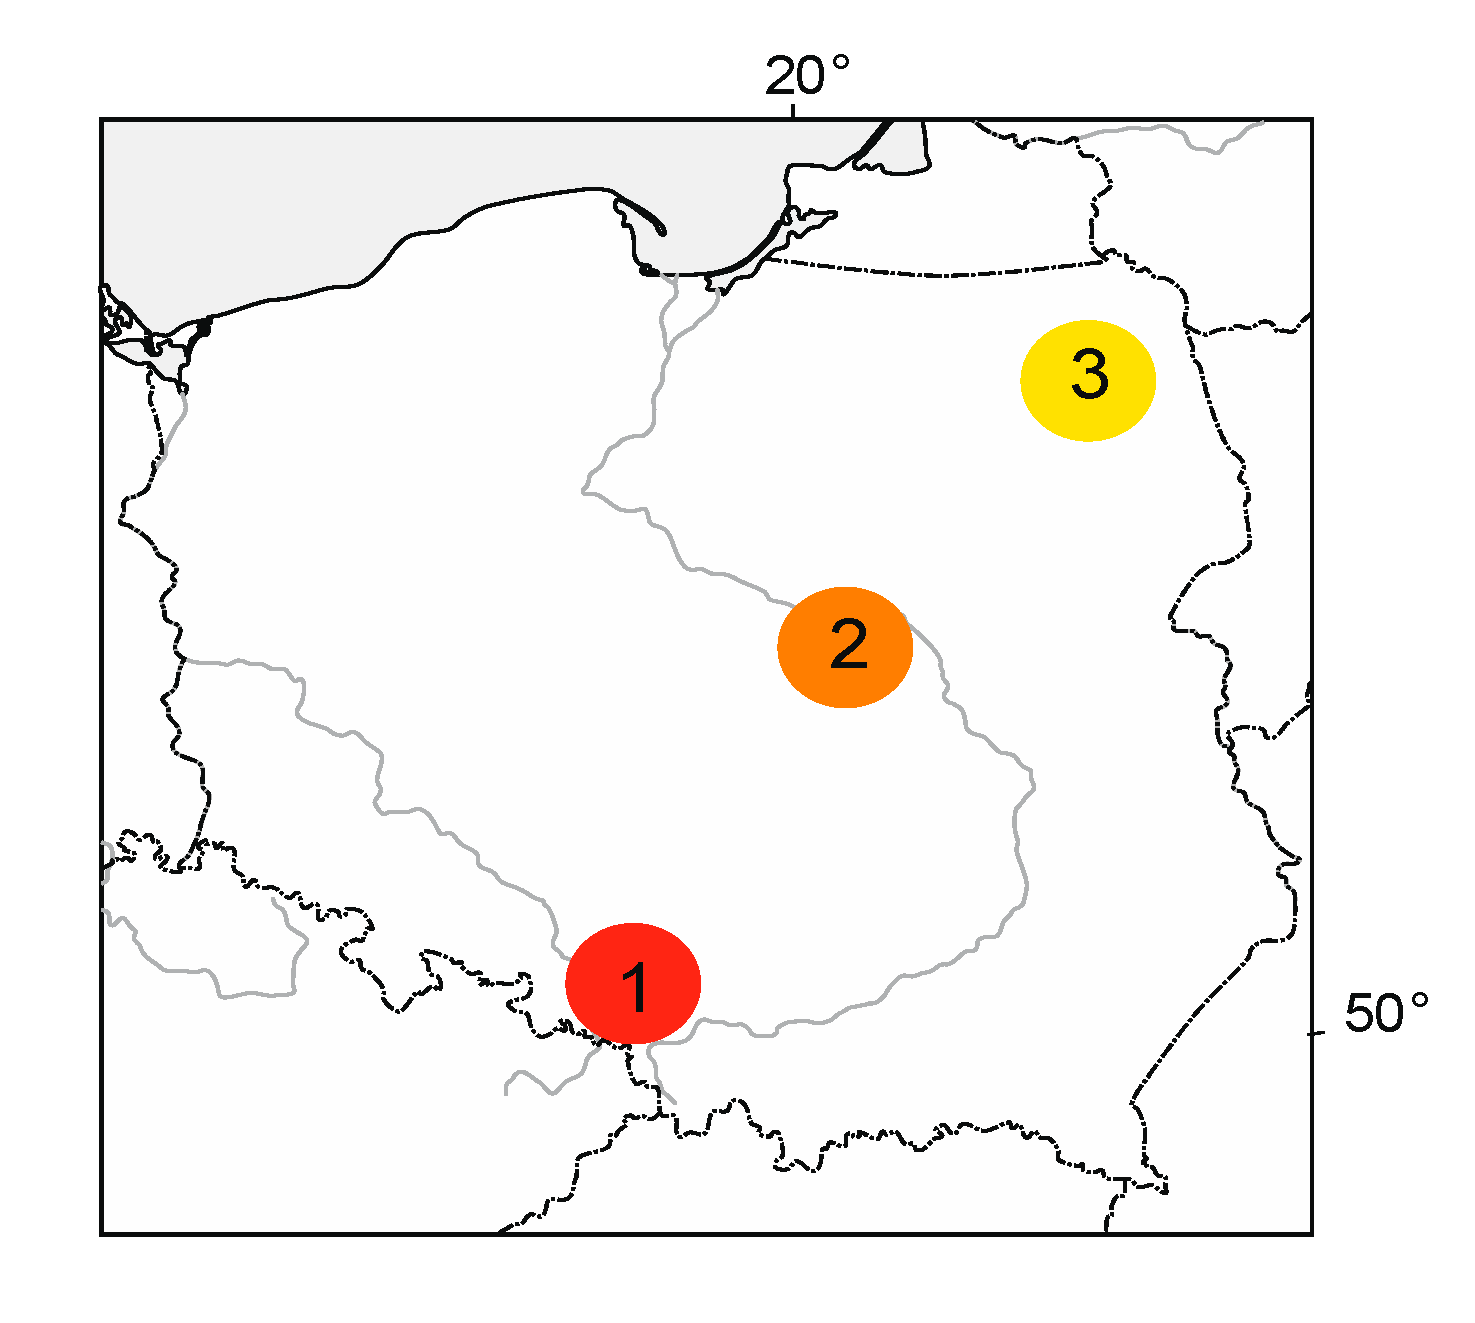
The sources of PAHs emissions are natural (volcanic emissions and forest fires), as well as anthropogenic processes (pyrolysis and incomplete combustion of organic substances). Although they are emitted in much smaller amounts than, e.g., dusts or gases (SO2 and NOx), they belong to the group of compounds that are the most toxic to living organisms (carcinogenic and mutagenic effects). In 2010, PAHs analyses in mosses were carried out in Poland for three areas located on the transect, from southwest to northeast, i.e., in the Silesia–Kraków region, the Mazovia region and the Podlasie region (Figure 4). Ten samples were collected in each of these areas. The sum of PAHs (calculated for all detected compounds), as well as the number of compounds detected in individual samples, was highest in the Silesia–Kraków region (7350 ng kg−1 d. wt.), which is the most industrialized and urbanized area of our country. The average values were determined in Central Poland (2127 ng kg−1 d. wt.), where the main emitter is the Warsaw agglomeration, and the lowest for the area located in the northeastern part of the country (848 ng kg−1 d. wt.), located far from pollution sources (Table 2). These differences were statistically significant between regions (one-way ANOVA, p < 0.05) (Figure 5; [18]).

3.2. Air Pollution in the Area of Polish National Parks

In 1975, the studies of air pollution that were using bioindicators were carried out in 12 Polish national parks that existed at the time. In 1986, such studies were carried out in 14 parks. Since 1990, within the subsequent ICP Vegetation campaigns, mosses were collected at five-year time intervals in 23 national parks. In the first two periods of research, two species of mosses were used: Pleurozium schreberi and Hylocomium splendens. Because Pleurozium schreberi accumulated higher levels of some elements than Hylocomium splendens [53], in subsequent studies, only the first species was used as an indicator of metal air pollution. During the entire study period (1975–2015), concentrations of eight metals (Cd, Cr, Ni, Cu, Pb, Zn, Mn and Fe) were constantly analyzed. In 1986, additionally, analyses of the levels of an anthropogenic radionuclide 137Cs were carried out.
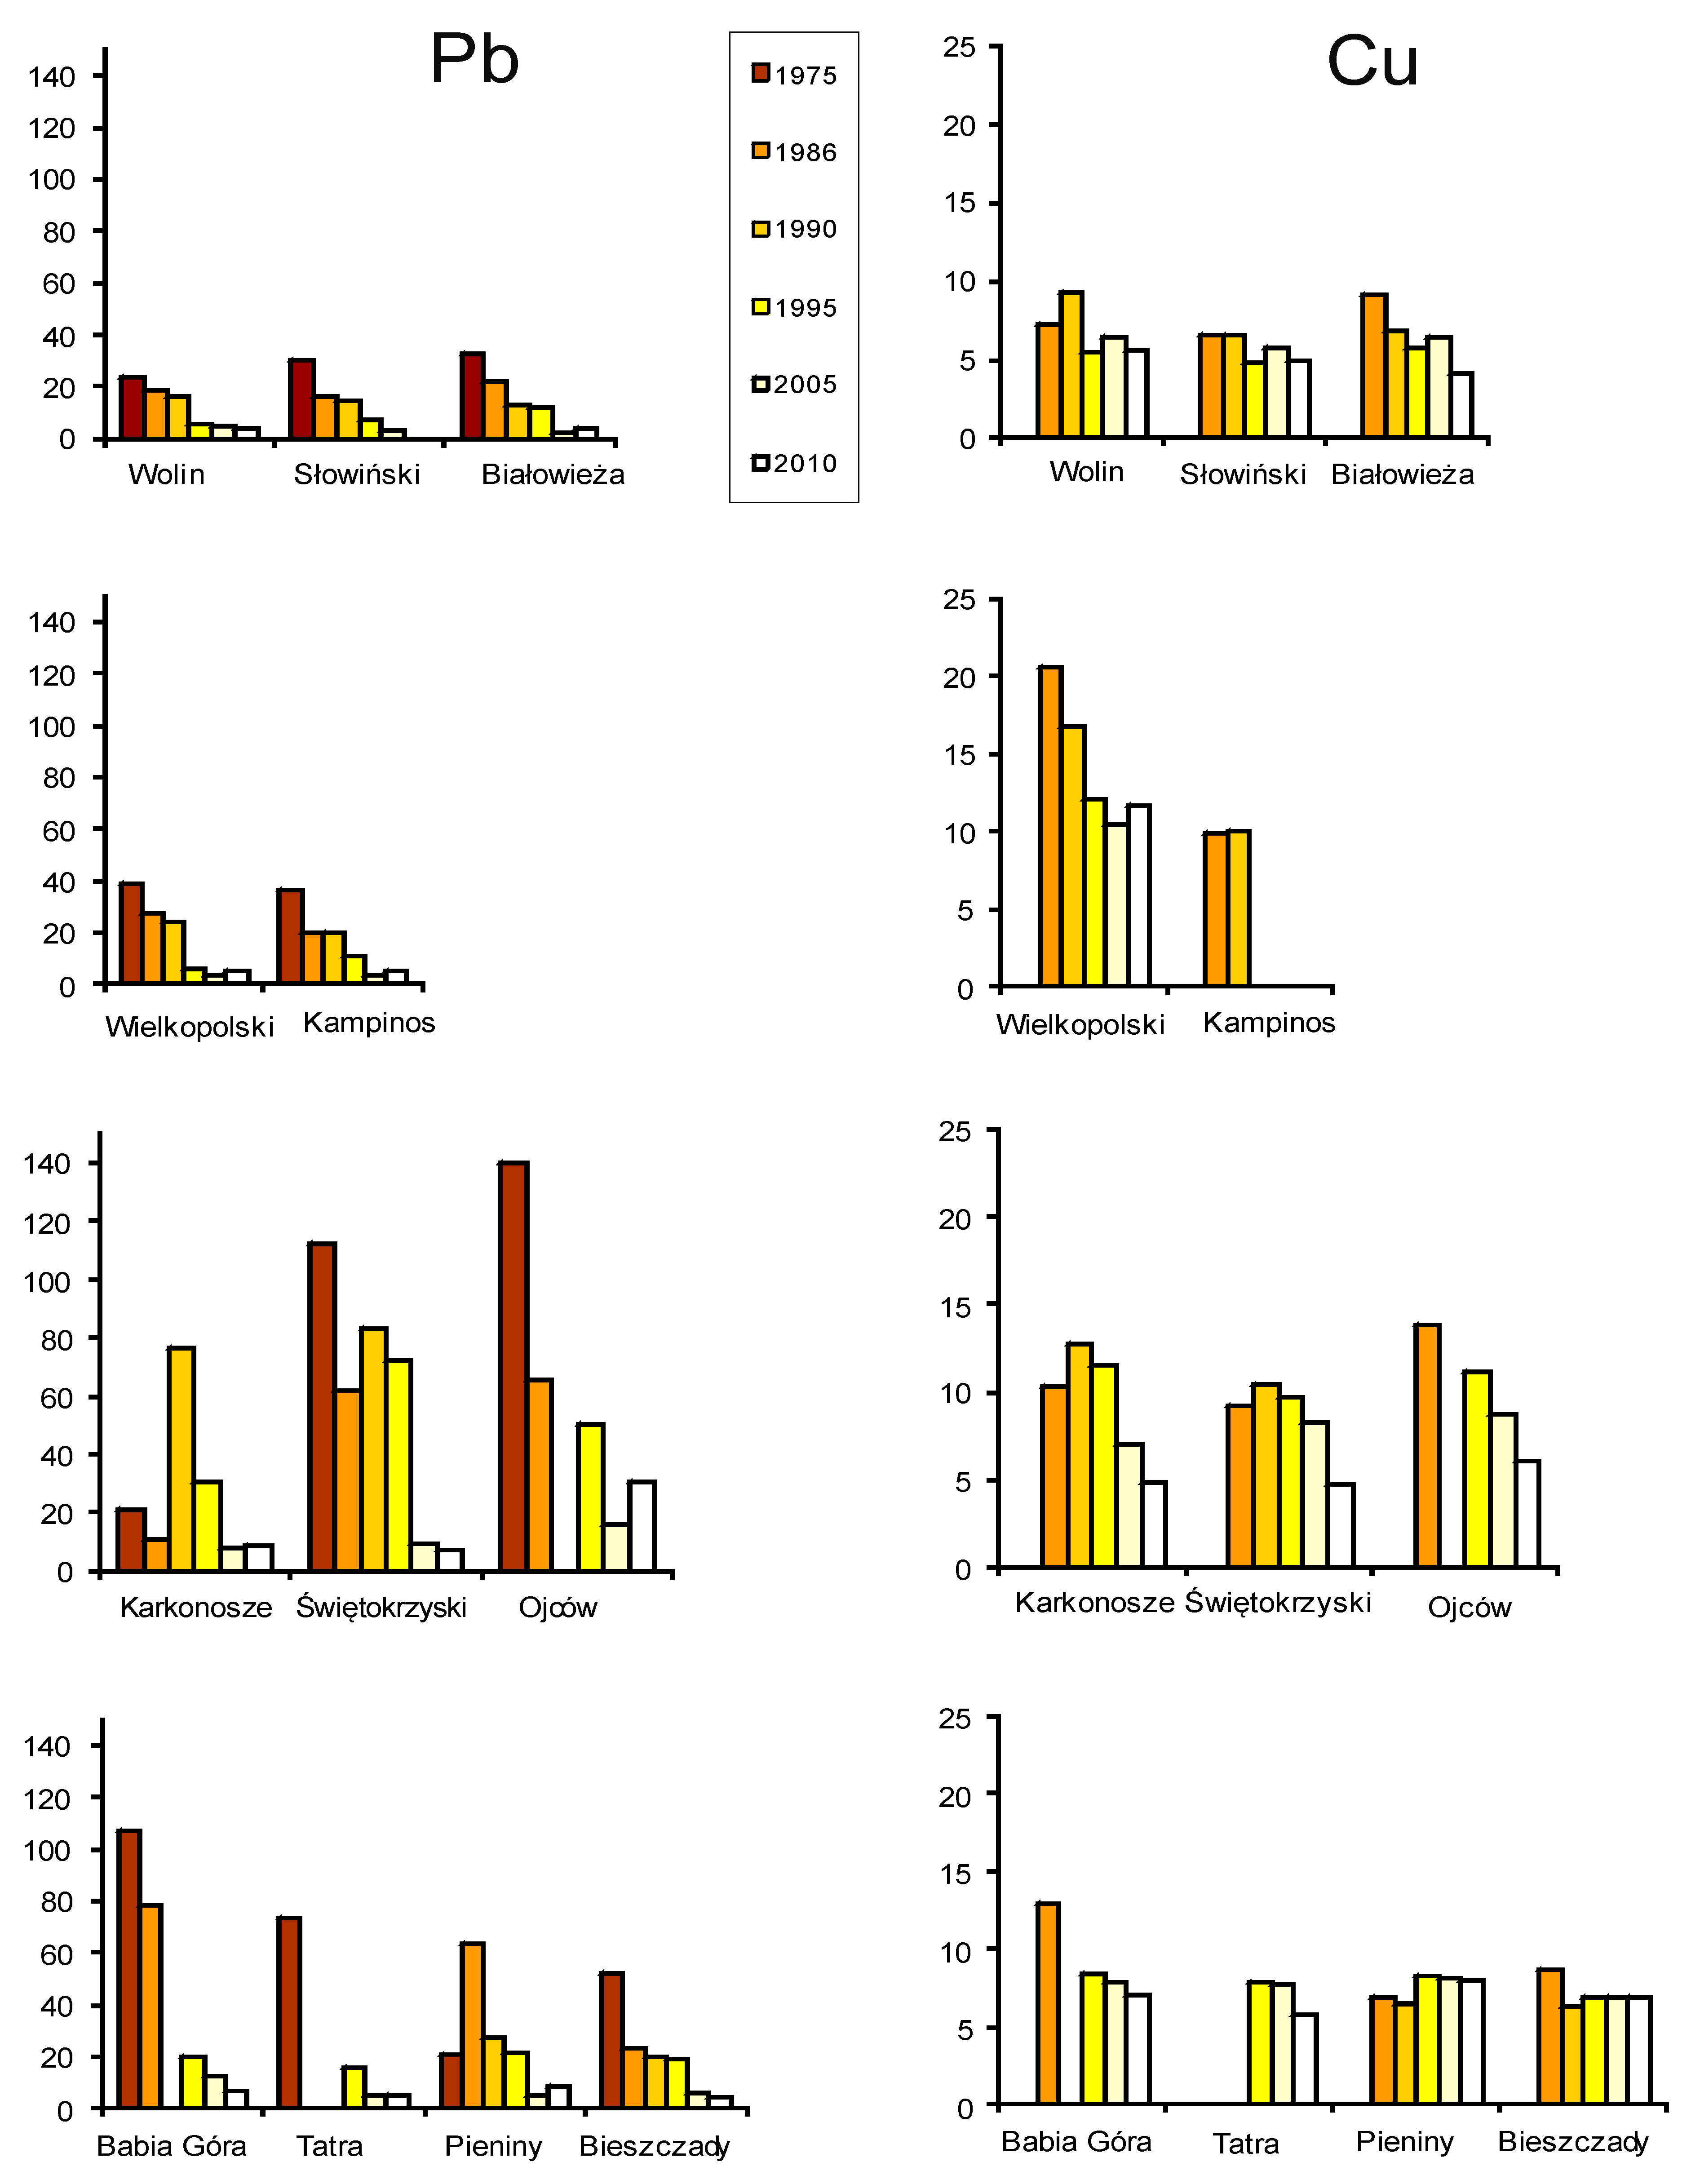
Research conducted over the entire 40-year period indicates that environmental pollution of national parks caused by heavy metals varies significantly. The largest differences between the parks were recorded for the levels of lead, manganese, zinc and cadmium, and smaller differences in the concentration of iron, chromium and copper [51,53]. The research has shown that national parks located in the northern part of Poland (Wolin, Słowiński and Białowieża National Parks) are among the cleanest in terms of heavy metal load. Parks located in the central part of our country (Wielkopolski and Kampinos National Parks) are moderately polluted, and parks located in southern Poland (Świętokrzyski, Ojców and some of the mountain parks, such as Karkonosze, Babia Góra and Tatra National Parks) are characterized by the highest levels of metals. This image is consistent with the distribution of minerals, and thus the location of industrial mining and processing plants, which are the main sources of pollution.
The following years of research clearly indicate a gradual decrease in the level of metals in most national parks, although this trend is most visible for parks located far away from national, as well as long-range, sources of pollution [51,53] (Figure 6). During the first two periods of research (1976 and 1986), when due to the economic collapse in Poland, the drastic decline in industrial emissions was recorded, the concentration of metals in mosses decreased significantly, especially in parks located close to industrial centers, such as Ojców, Świętokrzyski and Karkonosze National Parks. Ojców National Park is exposed to the influx of pollution from both the region of Upper Silesia and Kraków (Southern Poland), while Świętokrzyski National Park lies within the emission range of the Staropolski Industrial District (Central Poland). Karkonosze National Park is in the region of “Black Triangle” (southwestern part of the country), where the environment was polluted by the mining industry and lignite-fired power plants located at the border of three countries: Poland, the Czech Republic and Germany. A significant reduction in metal concentrations in mosses collected within these parks was associated with a decrease of industrial dust emissions in Central and Eastern Europe that could be correlated with the recession that affected the heavy metals industry during that time. A similar decrease in air pollution was also recorded in Northern Europe at the time [34,63]. Despite the decrease in industrial emissions, the concentration of metals in mosses collected in Polish national parks was several times higher (depending on the element), than in mosses collected in Scandinavia [53].
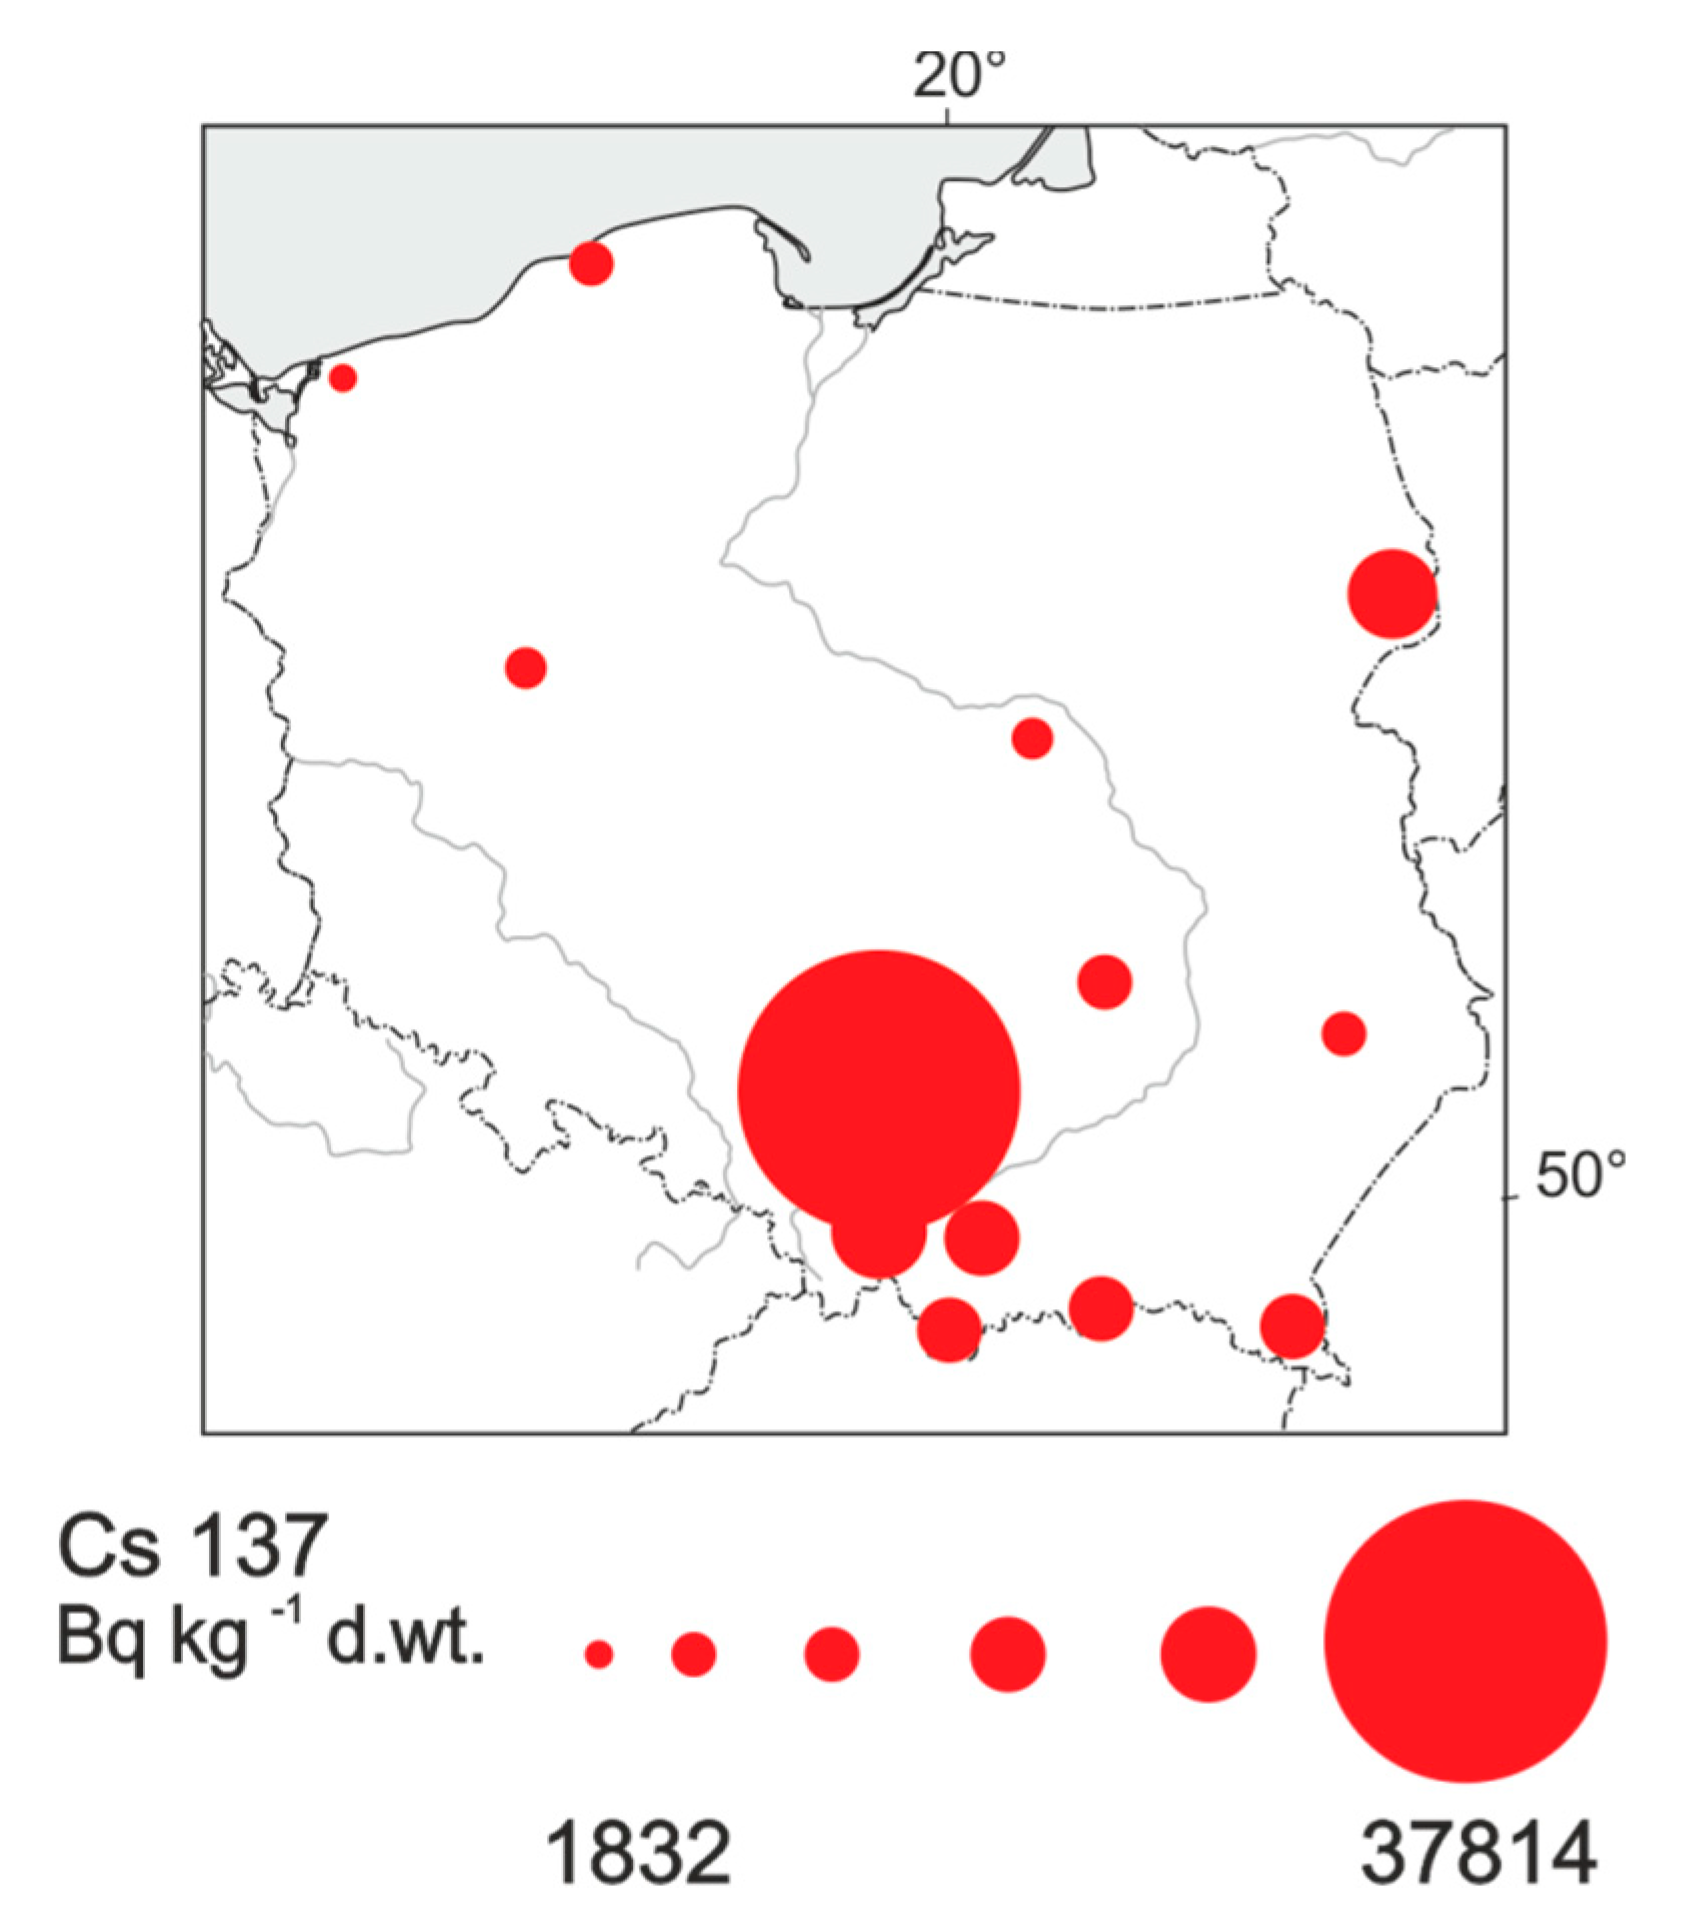
The breakdown of the Chernobyl power plant (at the end of April 1986) coincided with the moss campaign in Polish national parks; therefore, the level of radioactive cesium (137Cs) was also determined in Pleurozium schreberi. The level of 137Cs ranged from 1832 to 37,814 Bq kg−1 d. wt. (Figure 7). The smallest contamination was found in the following parks: Wolin, Wielkopolski, Kampinos and Roztocze (1832–3369 Bq kg−1 d. wt.). Higher cesium concentrations were found in mosses from the following parks: Białowieża, Bieszczady Babia Góra (9000–14,000 Bq kg−1 d. wt.). Moreover, the highest value was recorded in Ojców National Park (37,814 Bq kg−1 d. wt.) [65]. These results reflect the direction of radioactive clouds moving immediately after the Chernobyl accident, from the southeast to the north (Scandinavia), hence the higher cesium level in parks located in the east (Białowieża and Bieszczady National Parks). A change in the wind direction from north to south, with simultaneous precipitation at the time, in Southern Poland, resulted in higher pollution of Ojców National Park and protected areas located at the southern border of the country. Currently, due to the half-life of cesium of about 30 years, the environmental contamination is low.

3.3. The Niepołomice Forest—A Model Research Area on a Small Spatial Scale

The Niepołomice Forest, with an area of 110 km2, is located to the east of Kraków agglomeration (10–30 km), in the western part of the Sandomierska Valley (49°59’–50°07´ N and 20°13´–20°28´ E), at the Vistula and Raba rivers fork. It is divided into northern (2000 ha) and southern (8500 ha) parts, which differ in geological structure, terrain, soil and vegetation. Since the creation of a large steel mill in Nowa Huta (eastern margins of Kraków) in 1950, the Niepołomice Forest has been exposed to the industrial emissions from this source and from the city, with which prevailing winds from the west to east carry heavy metal dust toward this forest complex. In the 1970s, the steel mill achieved the highest production value of over 7 mln tons/year. Then the dust emissions were at the level of 140,000 tons, and SO2 emissions were at the level of 160,000 tons [66]. As a result of political and economic transformations in Poland at the end of 1980s, industrial production has significantly decreased in recent years. At this time, the steel production in steelwork in Nowa Huta was about 3 mln tons/year, and dust emissions decreased by 29% [66]. The second significant reduction in pollutant emissions took place ten years later, as a consequence of the economic processes accompanying the political transformation in 1989, when environmental policy gained importance. A number of technological processes have also been changed to be more environmentally friendly, and thus emissions of gaseous and particulate pollutants from both the steelworks and the city are now significantly lower [58].
To assess the degree of environmental pollution in the Niepołomice Forest, Pleurozium schreberi moss was first collected in 1975 [52], at 15 sites. The next collections took place in 1992 (15 sites, [54]), 1998 (77 sites, [57]) and 2014 (95 sites, [58]). Six elements were determined in mosses collected during the first three years of research, and eighteen elements were determined in Pleurozium schreberi from the last collection. The purpose of this research was to follow the spatial and temporal changes in heavy metal levels (i.e., from the period when pollutant emissions were very high, till now), to identify the sources of pollution and to assess the impact of pollution on the condition of the Niepołomice Forest stands. The use of GPS for determining the locations of moss collecting sites allows for further analysis of this type in the future.
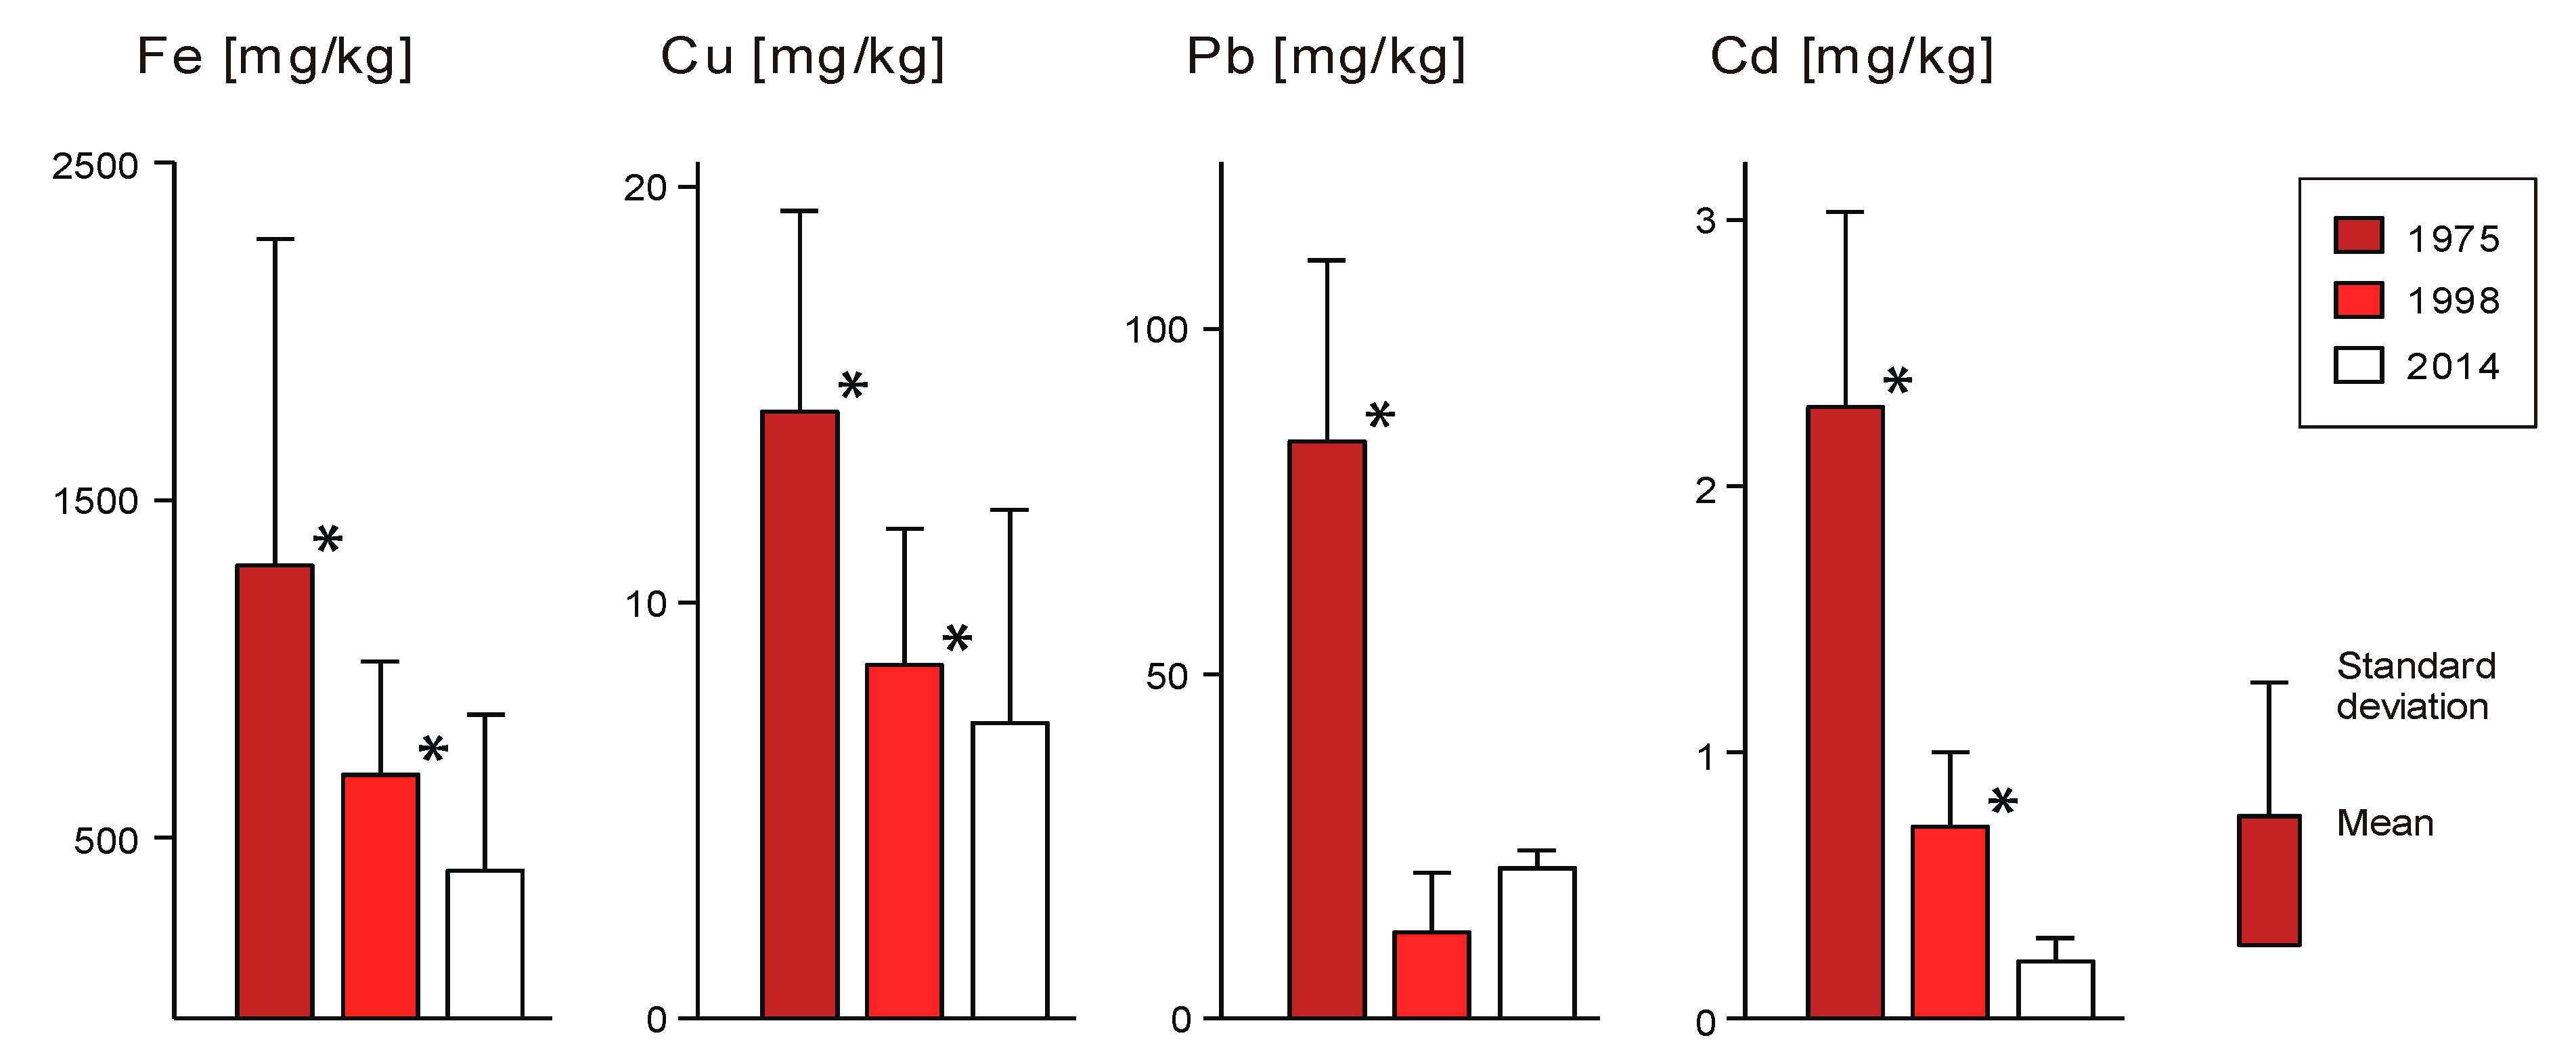
Research that used mosses as bioindicators in the Niepołomice Forest shows statistically significant changes over the last 40 years and a significant reduction in the level of air pollution in this region. Such a trend is consistent not only with the situation in the immediate vicinity of this forest complex, but also with the general trend observed throughout Europe. The largest decrease in metal concentrations was recorded between the mid-1970s and the end of the 1990s, i.e., during a period when steel production in Tadeusz Sendzimir Steelworks (now Mittal S.A. Stal Polska, formerly Lenin Steelworks), as well as a reduction in dust emissions from the Kraków agglomeration [57,66]. Good environmental policy after a period of political transformation resulted in the closure of a number of industrial plants based on old technologies throughout Poland. In consequence, this led to a reduction in the inflow of pollutants to the Niepołomice Forest, but also outside the Kraków agglomeration, such as Upper Silesia (located to the west of this forest complex). At the same time, as the level of metals decreased over time, the pattern of metal distribution in space changed. In the early years of the study, a significant variability in cadmium, copper, manganese, iron, lead and zinc concentrations was observed in the Niepołomice Forest (Figure 8). The most polluted was the western part of the forest, which is closest to the city and steelworks [52,54,57]. In the recent years, this pattern is less visible, and the differences between the western and eastern parts of the forest complex are currently not significant [58]. Recent studies also indicate that the level of some elements not only does not show a downward trend (zinc, chromium and manganese), but their concentrations even increased when compared to previous years [58]. At present, with a significant reduction in the inflow of pollutants from large emitters (Kraków and Upper Silesia), the impact of local small-emission sources is increasingly visible. The main reason for this deterioration of air quality in the Niepołomice Forest is probably the road transport and domestic ovens. Currently, the highway adjoins the forest complex from the southeast. Buildings (single-family houses) in formerly agricultural areas have also increased significantly. Although the level of heavy metals in the Niepołomice Forest is currently relatively lower than in previous years (1970s–1990s), it is still higher than in clean areas [58].

4. Conclusions

Research using mosses as bioindicators is very helpful in determining the current level of air pollution with heavy metals (HM), other elements (N) or compounds (PAHs), as well as their distribution in a given area. Thanks to this research, it is also easy to observe the direction of long-term changes.
Research carried out in Poland, both in the whole country and in selected areas (national parks and a small forest complex—Niepołomice Forest) show a gradual improvement in air quality, even though this progress is still too slow compared to Western European countries. In terms of heavy metal load, Poland still remains at the forefront of the most polluted countries.
Research should be continued to document changes that occur as a result of the emergence of new sources of air pollution in specific areas. They should be expanded to include analyses of those elements that currently prevail in industrial emissions or arise as a result of increasing car traffic.

Funding

This work was supported by the statutory fund of the W. Szafer Institute of Botany of the Polish Academy of Sciences.

Acknowledgments

The author would like to thank Ula Korzeniak for her great help in the graphic supplement of the text, and Paweł Kapusta for sharing maps.

Conflicts of Interest

The author declares no conflicts of interest. The funders had no role in the design of the study; in the collection, analyses, or interpretation of data; in the writing of the manuscript; or in the decision to publish the results.

References

  1. Rűhling, Å.; Tyler, G. Ecological approach to the lead problem. Bot. Notiser 1968, 121, 321. [Google Scholar]
  2. Rűhling, Å.; Tyler, G. Heavy metal deposition in Scandinavia. Water Air Soil Pollut. 1973, 2, 445–455. [Google Scholar] [CrossRef]
  3. Tyler, G. Moss analysis–a method for surveying heavy metal deposition. In The Second International Clean Air Congress; Englund, H.M., Berry, W.T., Eds.; Academic Press: New York, NY, USA, 1970; pp. 129–132. [Google Scholar]
  4. Kovács, K. Biological Indicators in Environmental Protection; Akademiai Kiado: Budapest, Hungary, 1992; pp. 1–207. [Google Scholar]
  5. Tyler, G. Bryophytes and heavy metals: A literature review. Bot. J. Linn. Soc. 1990, 104, 231–253. [Google Scholar] [CrossRef]
  6. Markert, B. Plants as Biomonitors: Indicators for Heavy Metals in the Terrestrial Environment, 1st ed.; Wiley-Blackwell: Hoboken, NJ, USA, 1993; pp. 1–645. [Google Scholar]
  7. Markert, B.; Breure, A.M.; Zehmeister, H.G. Bioindicators/Biomonitors–Principles, Assessment, Concepts; Elsevier Science: Amsterdam, The Netherlands, 2003. [Google Scholar]
  8. Maschke, J. Moose als Bioindikatoren von Schwermetall-Imissionen. Eine Übersicht der bereits untersuchten lokalen und regionalen Gebiete. Bryophytorum Bibliotheca 1981, 22, 1–492. [Google Scholar]
  9. Harmens, H.; Norris, D.A.; Sharps, K.; Mills, G.; Alber, R.; Aleksiayenak, Y.; Blum, O.; Cucu-Man, S.-M.; Dam, M.; De Tammerman, L.; et al. Heavy metal and nitrogen concentrations in mosses are declining across Europe whilst some “hotspots” remain in 2010. Environ. Pollut. 2015, 200, 93–104. [Google Scholar] [CrossRef] [Green Version]
  10. Harmens, H.; Norris, D.A.; Cooper, D.M.; Mills, G.; Steinnes, E.; Kubin, E.; Thöni, L.; Aboal, J.R.; Alber, R.; Carballeira, A.; et al. Nitrogen concentrations in mosses indicate the spatial distribution of atmospheric nitrogen deposition in Europe. Environ. Pollut. 2011, 159, 2852–2860. [Google Scholar] [CrossRef]
  11. Harmens, H.; Schnyder, E.; Thöni, L.; Cooper, D.M.; Mills, G.; Leblond, S.; Mohr, K.; Poikolainen, J.; Santamaria, J.; Skudnik, M.; et al. Relationship between site-specific nitrogen concentrations in mosses and measured wet bulk atmospheric nitrogen deposition across Europe. Environ. Pollut. 2014, 194, 50–59. [Google Scholar] [CrossRef] [Green Version]
  12. Kapusta, P.; Szarek-Łukaszewska, G.; Godzik, B.; Łopata, B. Recent nitrogen deposition in Poland monitored with moss Pleurozium schreberi. Pol. Bot. J. 2014, 59, 131–135. [Google Scholar] [CrossRef] [Green Version]
  13. Ares, A.; Aboal, J.R.; Fernandez, J.A.; Real, C.; Carballeira, A. Use of the terrestrial moss Pseudoscleropodium purum to detect sources of small scale contamination by PAHs. Atmos. Environ. 2009, 43, 5501–5509. [Google Scholar] [CrossRef]
  14. Dołęgowska, S.; Migaszewski, Z.M. PAH concentrations in the moss species Hylocomium splendens (Hedw.) B.S.G. and Pleurozium schreberi (Brid.) Mitt. from the Kielce area (south-central Poland). Ecotox. Environ. Safe. 2011, 74, 1636–1644. [Google Scholar] [CrossRef]
  15. Foan, L.; Domercq, M.; Bermejo, R.; Santamaría, J.M.; Simon, V. Mosses as an integrating tool for monitoring PAH atmospheric deposition: comparison with total deposition and evaluation of bioconcentration factors. A year-long case-study. Chemosphere 2015, 119, 452–458. [Google Scholar] [CrossRef] [PubMed] [Green Version]
  16. Gałuszka, A. Distribution patterns of PAHs and trace elements in mosses Hylocomium splendens (Hedw.) B.S.G. and Pleurozium schreberi (Brid.) Mitt. from different forest communities: A case study, south-central Poland. Chemosphere 2006, 67, 1415–1422. [Google Scholar] [CrossRef] [PubMed]
  17. Gerdol, R.; Bragazza, L.; Marchesini, R.; Medici, A.; Pedrini, P.; Benedetti, S.; Bovolenta, A.; Coppi, S. Use of moss (Tortula muralis Hedw.) for monitoring organic and inorganic air pollution in urban and rural sites in Northern Italy. Atmos. Environ. 2002, 36, 4069–4075. [Google Scholar] [CrossRef]
  18. Godzik, B.; Szarek-Łukaszewska, G.; Kapusta, P.; Stępień, K. PAHs concentrations in Poland using moss Pleurozium schreberi as bioindicator. Pol. Bot. J. 2014, 59, 137–144. [Google Scholar] [CrossRef] [Green Version]
  19. Harmens, H.; Foan, L.; Simon, V.; Mills, G. Terrestrial mosses as biomonitors of atmospheric POPs pollution: A review. Environ. Pollut. 2013, 173, 245–254. [Google Scholar] [CrossRef] [Green Version]
  20. Carballeiraa, A.; Fernandeza, J.A.; Aboala, J.R.; Realb, C.; Couto, J.A. Moss: A powerful tool for dioxin monitoring. Atmos. Environ. 2006, 40, 5776–5786. [Google Scholar] [CrossRef]
  21. Ugur, A.; Ozden, B.; Sa, M.M.; Yener, G. Biomonitoring of 210Po and 210Pb using lichens and mosses around a uraniferous coal-fired power plant in western Turkey. Atmos. Environ. 2003, 37, 2237–2245. [Google Scholar] [CrossRef]
  22. Krmar, M.; Wattanavatee, K.; Radnovic, D.; Slivka, J.; Bhongsuwan, T.; Frontasyeva, M.V.; Pavlov, S.S. Airborne radionuclides in mosses collected at different latitudes. J. Environ. Radioactiv. 2013, 117, 45–48. [Google Scholar] [CrossRef]
  23. Kosior, G.; Dołhańczuk-Śródka, A.; Ziembik, Z. The use of moss Pleurozium schreberi (Brid.) Mitt. as bioindicator of radionuclide contamination in industrial areas Upper Silesia. Ecol. Chem. Eng. 2017, 24, 19–29. [Google Scholar] [CrossRef] [Green Version]
  24. Castello, M. A comparison between two moss species used as transplants for airborne trace element biomonitoring in NE Italy. Environ. Monit. Assess. 2007, 133, 267–276. [Google Scholar] [CrossRef]
  25. Iodice, P.; Adamo, P.; Capozzi, F.; Di Palma, A.; Senatore, A.; Spagnuolo, V.; Giordano, S. Air pollution monitoring using emission inventories combined with the moss bag approach. Sci. Tot. Environ. 2016, 541, 1410–1419. [Google Scholar] [CrossRef] [PubMed]
  26. Kosior, G.; Samecka-Cymerman, A.; Kolon, K.; Kempers, A.J. Bioindication capacity of metal pollution of native and transplanted Pleurozium schreberi under various levels of pollution. Chemosphere 2010, 81, 321–326. [Google Scholar] [CrossRef] [PubMed]
  27. Samecka-Cymerman, A.; Kempers, A.J. Differences in concentrations of heavy metals between native and transplanted Pohlia nutans (Hedw.) Lindb.–a case study from a dump exposed to industrial emissions in Poland. Pol. J. Environ. Stud. 2007, 16, 251–258. [Google Scholar]
  28. Sun, S.-Q.; Wang, D.-Y.; He, M.; Zhang, C. Monitoring of atmospheric heavy metal deposition in Chongqing, China–based on moss bag technique. Environ. Monit. Assess. 2009, 148, 1–9. [Google Scholar] [CrossRef] [PubMed]
  29. Ares, A.; Aboal, J.R.; Carballeira, A.; Giordano, S.; Adamo, P.; Fernández, J.Á. Moss bag biomonitoring: A methodological review. Sci. Tot. Environ. 2012, 432, 143–158. [Google Scholar] [CrossRef] [PubMed]
  30. Varela, Z.; Carballeira, A.; Fernandez, J.A.; Aboal, J.R. On the use of epigeic mosses to biomonitor atmospheric deposition of nitrogen. Arch. Environ. Contam. Toxicol. 2013, 64, 562–572. [Google Scholar] [CrossRef] [PubMed]
  31. Gerdol, R.; Marchesini, R.; Iacumin, P.; Brancaleoni, L. Monitoring temporal trends of air pollution in an urban area using mosses and lichens as biomonitors. Chemosphere 2014, 108, 388–395. [Google Scholar] [CrossRef]
  32. Herpin, U.; Berlekamp, J.; Markert, B.; Wolterbeek, B.; Grodzińska, K.; Siewers, U.; Lieth, H.; Weckert, V. The distribution of heavy metals in a transect of the three states the Netherlands, Germany and Poland, determined with the aid of moss monitoring. Sci. Tot. Environ. 1996, 187, 185–198. [Google Scholar] [CrossRef]
  33. Kłos, A.; Rajfur, M.; Sramek, I.; Wacaławek, M. Use of lichen and moss in assesment of forest contamination with heavy metals in Paraded and Glacensis Euroregions (Poland and Czech Republic). Water Air Soil Pollut. 2011, 222, 367–376. [Google Scholar] [CrossRef] [Green Version]
  34. Rűhling, Å.; Tyler, G. Recent changes in the deposition of heavy metals in Northern Europe. Water Air Soil Pollut. 1984, 22, 173–180. [Google Scholar] [CrossRef]
  35. Rűhling, Å.; Rasmussen, L.; Pilegaard, K.; Makinen, A.; Steinnes, E. Atmospheric heavy metal deposition in northern Europe 1995. Nord 1997, 37, 1–46. [Google Scholar]
  36. Suchara, I.; Florek, M.; Godzik, B.; Mankovska, B.; Rabnecz, G.; Sucharova, J.; Tuba, Z.; Kapusta, P. Part I: Eight toxic metals. In Mapping of Main Sources of Pollutants and Their Transport in the Visegrad Space; KLEMO Zvolen: Průhonice, Czech Republic, 2007; pp. 1–127. [Google Scholar]
  37. Grodzińska, K.; Szarek-Łukaszewska, G.; Godzik, B. Survey of heavy metal deposition in Poland using mosses as indicators. Sci. Tot. Environ. 1999, 229, 41–51. [Google Scholar] [CrossRef]
  38. Kapusta, P.; Szarek-Łukaszewska, G.; Godzik, B. Present and past deposition of heavy metals in Poland as determined by moss monitoring. Pol. J. Environ. Stud. 2014, 23, 2047–2053. [Google Scholar] [CrossRef]
  39. Rűhling, Å. Atmospheric heavy metal deposition in Europe–estimations based on moss analysis. Nord 1994, 9, 1–53. [Google Scholar]
  40. Rűhling, Å.; Steiness, E. Atmospheric heavy metal deposition in Europe 1995–1996. Nord 1998, 15, 1–67. [Google Scholar]
  41. Buse, A.; Norris, D.; Harmens, H.; Buker, P.; Ashenden, T.; Mills, G. Heavy Metals in European Mosses 2000/2001 Survey; Centre for Ecology and Hydrology: Bangor, UK, 2003; pp. 1–45. [Google Scholar]
  42. Harmens, H.; Norris, D. Spatial and Temporal Trends in Heavy Metal Accumulation in Mosses in Europe (1990–2005); Centre for Ecology & Hydrology: Bangor, UK, 2008; pp. 1–51. [Google Scholar]
  43. Harmens, H.; Norris, D.; Mills, G. Heavy Metals and Nitrogen in Mosses: Spatial Patterns in 2010/2011 and Long-Term Temporal Trends in Europe; Centre for Ecology & Hydrology: Bangor, UK, 2013; pp. 1–63. [Google Scholar]
  44. Schröder, W.; Nickel, S.; Schönrock, S.; Meyer, M.; Wosniok, W.; Harmens, H.; Frontasyeva, M.V.; Alber, R.; Aleksiayenak, J.; Barandovski, L.; et al. Spatially valid data of atmospheric deposition of heavy metals and nitrogen derived by moss surveys for pollution risk assessments of ecosystems. Environ. Sci. Pollut. Res. 2016, 23, 1–20. [Google Scholar]
  45. Cao, T.; An, L.; Wang, M.; Lou, Y.; Yu, Y.; Wu, J.; Zhu, Z.; Quing, Y.; Glime, J. Spatial and temporal changes of heavy metal concentrations in mosses and its indication to the environments in the past 40 years in the city of Shanghai, China. Atmos. Environ. 2008, 42, 5390–5402. [Google Scholar] [CrossRef]
  46. Liu, C.; Zhou, P.; Fang, Y. Monitoring airborne heavy metal using mosses in the city of Xuzhou, China. Bull. Environ. Contam. Toxicol. 2016, 96, 638–644. [Google Scholar] [CrossRef]
  47. Sardans, J.; Peñuelas, J. Trace element accumulation in the moss Hypnum cupressiforme Hedw. and the trees Quercus ilex L. and Pinus halepensis Mill. in Catalonia. Chemosphere 2005, 60, 1293–1307. [Google Scholar] [CrossRef]
  48. Brumelis, G.; Brown, D.H.; Nikodemus, O.G.; Tjarve, D. The monitoring and risk assessment of Zn deposition around a metal smelter in Latvia. Environ. Monit. Assess. 1999, 58, 201–212. [Google Scholar] [CrossRef]
  49. Goodarzi, F.; Sanei, H.; Garrett, R.G.; Labonté, M.; Duncan, W.F. A review of the moss-monitoring survey around the Trail smelter, British Columbia. Geochem. Explora. Environ. Anal. 2006, 6, 249–257. [Google Scholar] [CrossRef]
  50. Bačeva, K.; Stafilov, T.; Šajn, R.; Tănăselia, C. Moss biomonitoring of air pollution with heavy metals in the vicinity of a ferronickel smelter plant. J. Environ. Sci. Health Part A 2012, 47, 645–656. [Google Scholar] [CrossRef] [PubMed]
  51. Grodzińska, K. Mosses as bioindicators of heavy metal pollution in Polish National Parks. Water Air Soil Pollut. 1978, 9, 83–97. [Google Scholar] [CrossRef]
  52. Makomaska, M. Heavy metal contamination of pinewoods in the Niepołomice Forest (Southern Poland). Bull. Pol. Sci. Sér. Sci. Biol. Cl. II 1978, 26, 679–685. [Google Scholar]
  53. Grodzińska, K.; Szarek, G.; Godzik, B. Heavy metal deposition in Polish national parks–changes during ten years. Water Air Soil Pollut. 1990, 49, 409–419. [Google Scholar] [CrossRef] [Green Version]
  54. Godzik, B.; Szarek, G. Heavy metals in mosses from the Niepołomice Forest, southern Poland–changes in 1975–1992. Fragm. Flor. Geobot. 1993, 38, 199–208. [Google Scholar]
  55. Grodzińska, K.; Szarek, G.; Godzik, B.; Braniewski, S.; Chrzanowska, E. Mapping air pollution in Poland by measuring heavy metal concentration in mosses. In Climate and Atmospheric Deposition Studies in Forests; Solon, J., Roo-Zielińska, E., Bytnerowicz, A., Eds.; IGSO PAS: Warszawa, Poland, 1994. [Google Scholar]
  56. Grodzińska, K.; Szarek-Łukaszewska, G.; Godzik, B.; Braniewski, S.; Budziakowska, E.; Chrzanowska, E.; Pawłowska, B.; Zielonka, T. Assessment of Heavy Metal Pollution in Poland Using the Moss Monitoring Method; Państwowa Inspekcja Ochrony Środowiska: Warszawa, Poland, 1997; pp. 1–83. [Google Scholar]
  57. Szarek-Łukaszewska, G.; Grodzińska, K.; Braniewski, S. Heavy metal concentration in moss Pleurozium schreberi in the Niepołomice Forest, Poland: Changes during 20 years. Environ. Monit. Assess. 2002, 79, 1231–1237. [Google Scholar] [CrossRef]
  58. Kapusta, P.; Stanek, M.; Szarek-Łukaszewska, G.; Godzik, B. Long-term moss monitoring of atmospheric deposition near a large steelworks reveals the growing importance of local non-industrial sources of pollution. Chemosphere 2019, 230, 29–39. [Google Scholar] [CrossRef]
  59. Steinnes, E.; Rühling, A.; Lippo, H.; Makinen, A. Reference materials for large –scale metal deposition surveys. Accredit. Qual. Assur 1997, 2, 243–249. [Google Scholar] [CrossRef]
  60. Środowisko. Rocznik statystyczny; Główny Urząd Statystyczny: Warszawa, Poland, 1998. (In Polish)
  61. Środowisko. Rocznik statystyczny; Główny Urząd Statystyczny: Warszawa, Poland, 2012. (In Polish)
  62. Kosonen, Z.; Thimonier, A.; Schnyder, E.; Thoni, L. Nitrogen concentration in moss compared with N load in precipitation and with total N deposition in Switzerland. Environm. Pollut. 2018, 239, 169–178. [Google Scholar] [CrossRef]
  63. Gydersen, H.; Pilegaard, K.; Rasmussen, L.; Rűhling, Å. Mosses analyses used as a mean of surveying the atmospheric heavy metal deposition in Sweden, Denmark, and Greenland in 1980. National Swedish Environment Protection Board. Bulletin 1983, 1670, 1–144. [Google Scholar]
  64. Godzik, B.; Kapusta, P. Long-term studies on the level of environmental pollution using bioindicative properties of forest species of mosses. In Proceedings of the Trees and Forests in a Changing Environment, Kórnik, Poland, 17–19 October 2016. (In Polish). [Google Scholar]
  65. Grodzińska, K.; Godzik, B.; Szarek, G. Skażenie polskich parków narodowych metalami ciężkimi, siarka i radionuklidami [Heavy metals, sulphur and radioactive Cs137 pollution of Polish national parks]. Prądnik. Prace i materiały Muzeum im. Prof. Władysława Szafera 1993, 7–8, 153–158. (In Polish) [Google Scholar]
  66. Weiner, J.; Fredro-Braniecki, S.; Reed, D.; Maclean, A.; Strong, M. Niepołomice Forest–a GIS analysis of ecosystems response to industrial pollution. Environ. Pollut. 1997, 98, 381–388. [Google Scholar] [CrossRef]
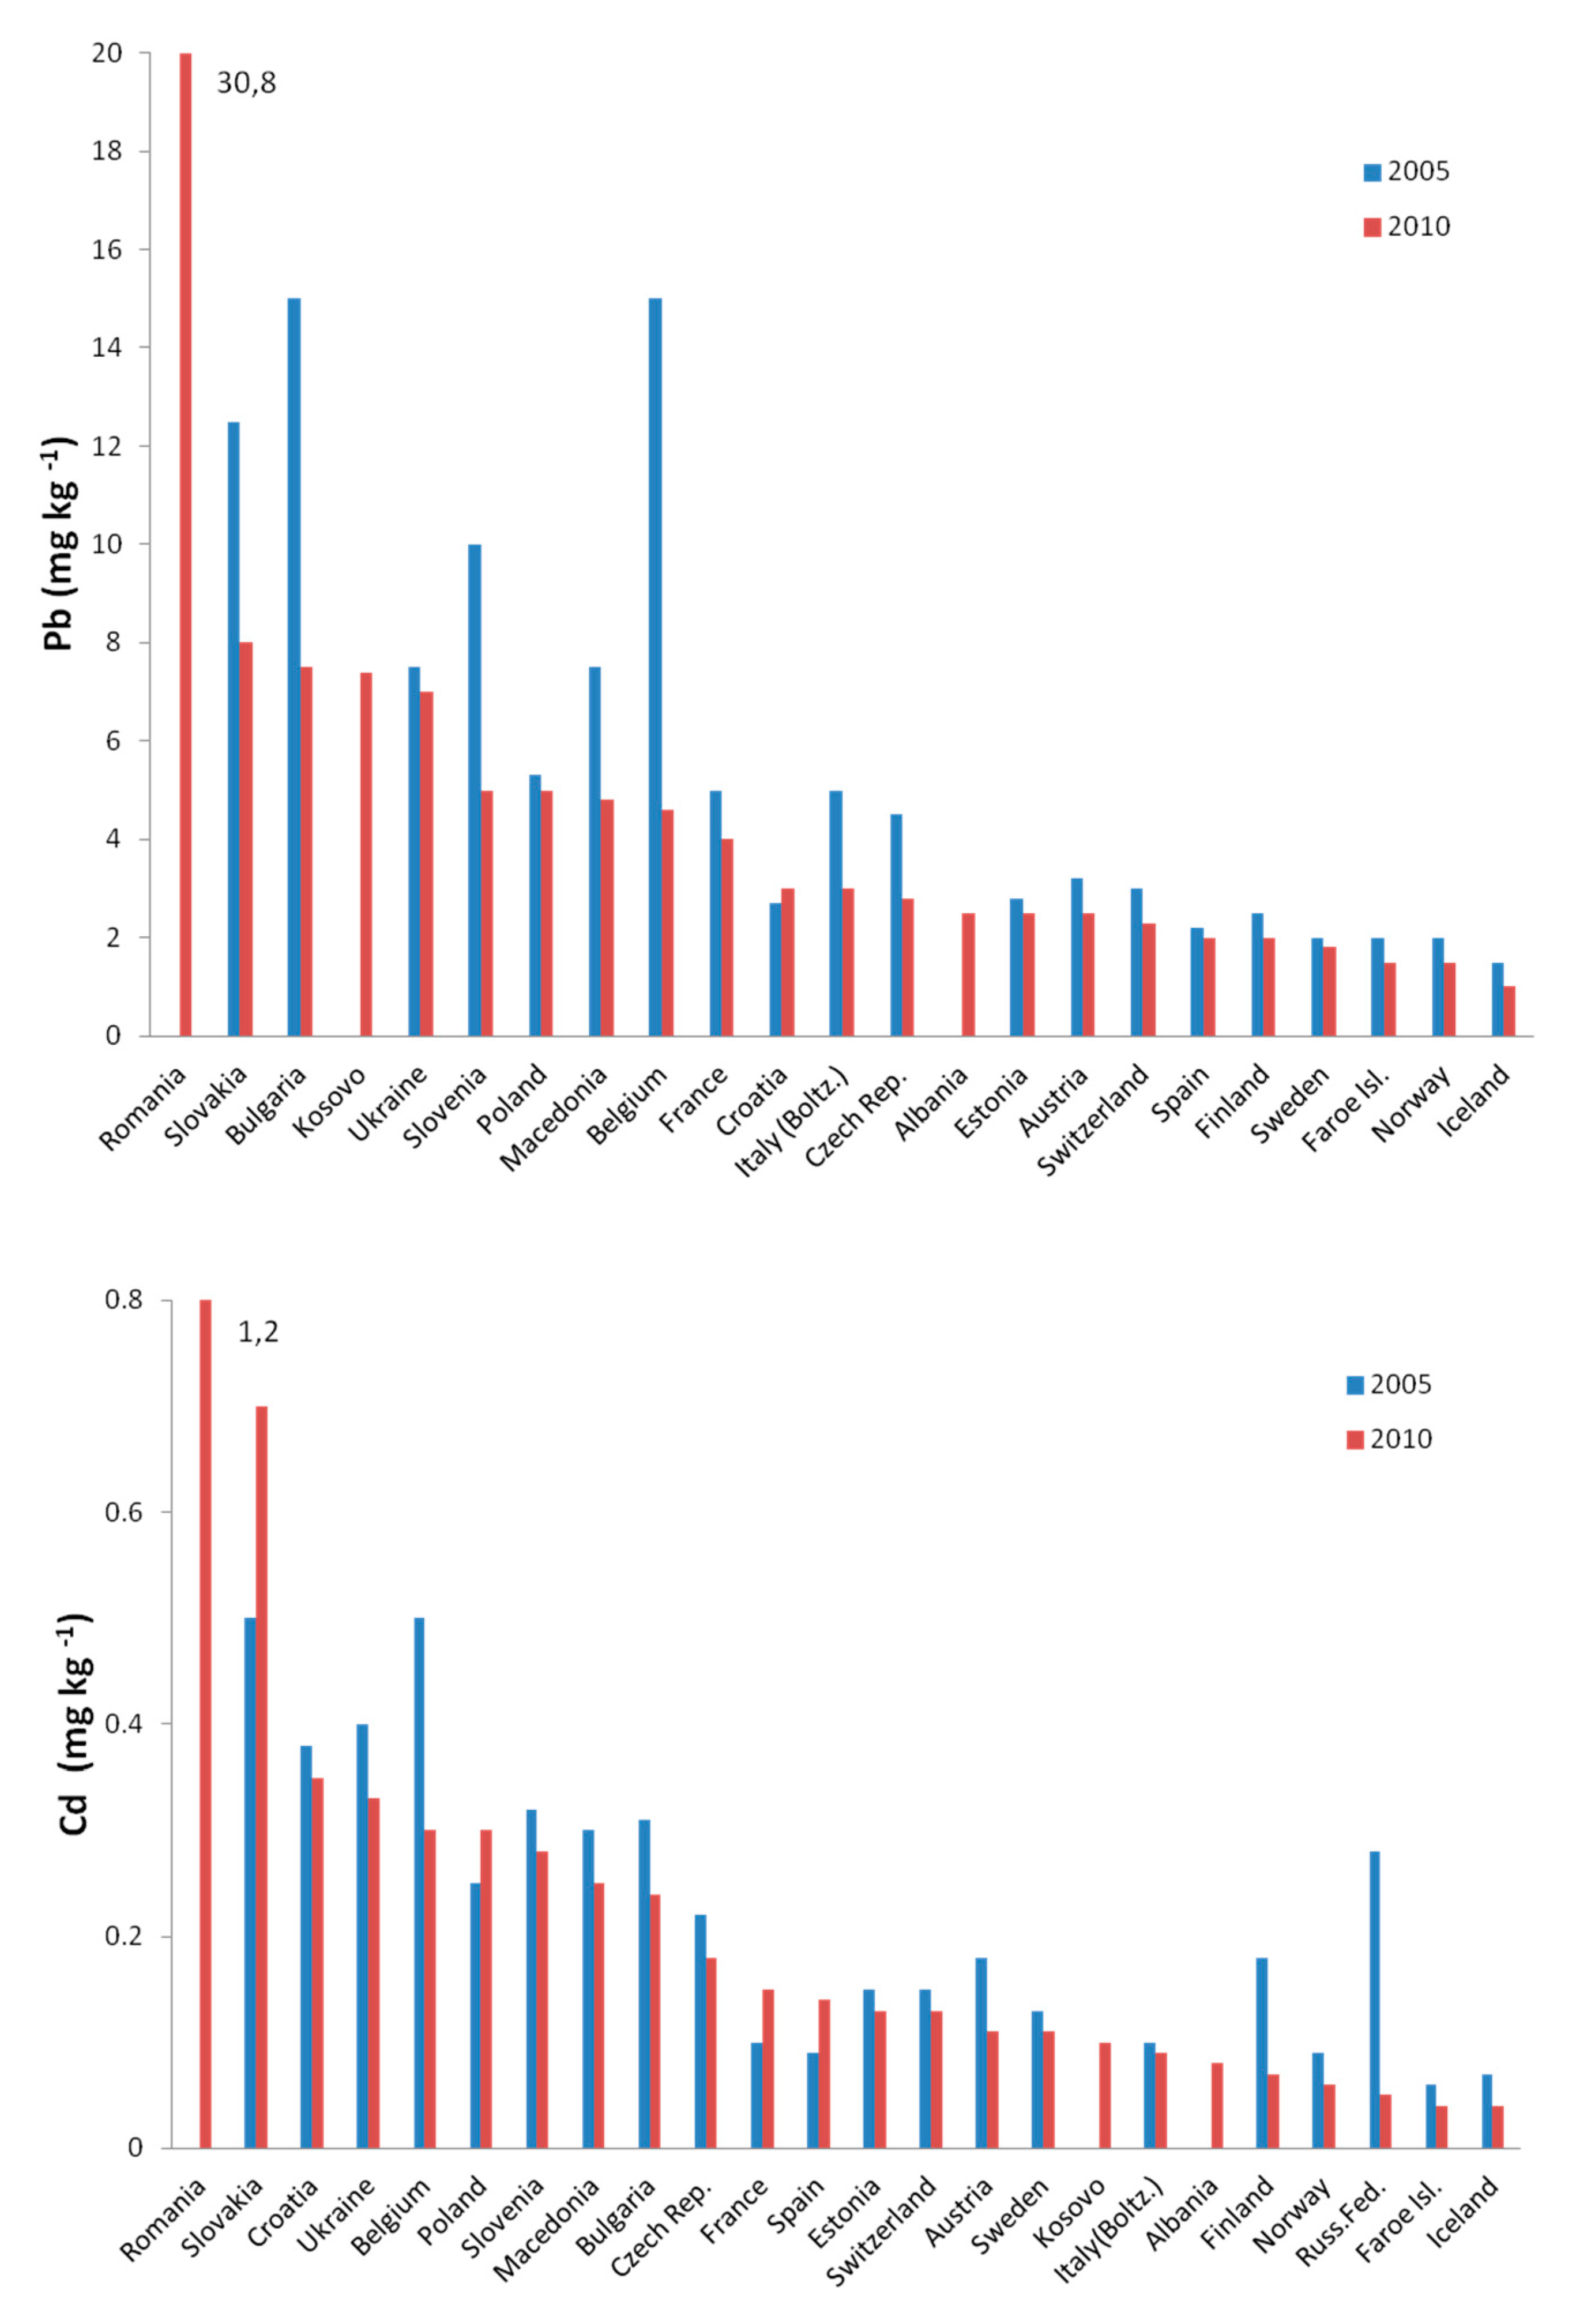
Figure 1. Comparison of lead and cadmium concentrations in mosses (median) in 2005 and 2010, in European countries (adapted from [43]).
Atmosphere 11 00143 g001
Figure 2. Spatial pattern of heavy metals distribution in Poland, based on the concentration of cadmium, copper, lead and zinc in Pleurozium schreberi (adapted from [38]).
Atmosphere 11 00143 g002
Figure 3. Spatial pattern of atmospheric nitrogen deposition in Poland, based on the concentration of nitrogen in Pleurozium schreberi (adapted from [12]).
Atmosphere 11 00143 g003
Figure 4. Location of Pleurozium schreberi sampling sites in Poland in 2010 for PAHs analysis. (1) Silesia–Kraków region, (2) Mazovia region and (3) Podlasie region (adapted from [18]).
Atmosphere 11 00143 g004
Figure 5. Concentrations (ng kg−1 d. wt.) of sum of PAHs in Pleurozium schreberi in 2010. Medians (horizontal lines), quartiles (boxes), minimum and maximum values (whiskers) are shown.
Atmosphere 11 00143 g005
Figure 6. Comparison of average concentrations (mg kg−1 d. wt.) of lead and copper in Pleurozium schreberi, in 1975–2010, collected in Polish national parks (adapted from [64]).
Atmosphere 11 00143 g006
Figure 7. Level of radioactive cesium (Bq kg−1 d. wt.) in Pleurozium schreberi collected in 1986, in Polish national parks.
Atmosphere 11 00143 g007
Figure 8. Temporal changes in concentration of heavy metals in Pleurozium schreberi from Niepołomice Forest. * Statistically significant differences; p = 0.05, Wilcoxon test (after [64], changed).
Atmosphere 11 00143 g008
Table 1. Sampling scheme for Pleurozium schreberi in Poland (area, years and number of sampling sites) and a range of performed chemical analyzes.
AreaYearSampling SitesElement
Poland1990150Cd, Cr, Cu, Ni, Pb, Zn, Fe, Hg, V
1995297Cd, Cr, Cu, Ni, Pb, Zn, Fe, V, Hg
2001116Cd, Cr, Cu, Ni, Pb, Zn, Fe, V
2010320 (PAHs–30)Cd, Cr, Cu, Ni, Pb, Zn, V, Hg, N, 16 PAHs
2015117Cd, Cr, Cu, Co, Ni, Pb, Zn, Fe, Mo, Hg, V, As, N, P, Ca, K, Mg
National parks (NP)197512 NP–24Cd, Co, Cr, Cu, Ni, Pb, Zn, Mn, Fe, K, Ca, Mg, Na
198614 NP–28Cd, Co, Cr, Ni, Cu, Pb, Zn, Mn, Fe, K, Ca, Mg, Na, 137Cs
200523 NP–272Cd, Cu, Ni, Pb, Fe, Zn
201023NP–46Cd, Cr, Cu, Ni, Pb, Zn, V, Hg, N
The Niepołomice Forest197515Cd, Cu, Pb, Zn, Fe, Mn
199215Cd, Cu, Pb, Zn, Fe, Mn
199877Cd, Cr, Cu, Pb, Zn, Fe
201495Cd, Cr, Cu, Co, Ni, Pb, Zn, Fe, Mn, Mo, V, As, Ca, K, Mg, Na, N, P
Table 2. Number of samples (N), sum of PAHs (ng kg−1 d. wt.) and SD calculated for Pleurozium schreberi collected in three regions in Poland.
RegionNSum of PAHsSD
Silesia–Kraków107.3504.075
Mazovia102.1271.686
Podlasie100.8380.943