Article

Comparison of the Madden–Julian Oscillation-Related Tropical Cyclone Genesis over the South China Sea and Western North Pacific under Different El Niño-Southern Oscillation Conditions

1
College of Ocean and Meteorology, Guangdong Ocean University, Zhanjiang 524088, China
2
Department of Earth Sciences, National Taiwan Normal University, Taipei 11677, Taiwan
3
Collaborative Innovation Center on Forecast and Evaluation of Meteorological Disasters, Nanjing University of Information Science and Technology, Nanjing 210044, China
*
Author to whom correspondence should be addressed.
Atmosphere 2020, 11(2), 183; https://doi.org/10.3390/atmos11020183
Submission received: 2 January 2020 / Revised: 2 February 2020 / Accepted: 5 February 2020 / Published: 9 February 2020
(This article belongs to the Section Climatology)

Abstract

:
This paper explores the Madden–Julian Oscillation (MJO) modulation of tropical cyclone (TC; hereafter, MJO-TC) genesis over the South China Sea (SCS) and Western North Pacific (WNP) under different El Niño-Southern Oscillation (ENSO) conditions. Analyses used Joint Typhoon Warning Center (JTWC) best-track data, the Real-Time Multivariate MJO (RMM) index, and European Center for Medium-Range Weather Forecasts (ECMWF) Interim (ERA-Interim) reanalysis data. The results showed that the MJO has significant modulation on both the SCS and WNP TC genesis in neutral years, with more (fewer) TCs forming during the active (inactive) MJO phases. However, during the El Niño and La Niña years, the MJO-TC genesis modulation over the two regions differs from each other. Over the SCS, the MJO modulation of TC genesis is stronger in the La Niña years, while it becomes weaker in the El Niño years. Over the WNP, the MJO has a stronger influence on TC genesis in the El Niño years compared to that in the La Niña years. Related Genesis Potential Index (GPI) analysis suggests that midlevel moisture is the primary factor and vorticity is the secondary factor, for the MJO-TC genesis modulation over the SCS in the La Niña years. Over the WNP, midlevel moisture is the dominant factor for the MJO-TC genesis modulation during the El Niño years. These results can be explained by increased water vapor transport from the Bay of Bengal, associated with enhanced westerly wind anomalies, during the active phases relative to the inactive MJO phases; these conditions prevail over the SCS during the La Niña years, and over the WNP during the El Niño years.
Keywords:
SCS; WNP; TC genesis; MJO; ENSO

1. Introduction

Tropical cyclones (TCs), accompanied by heavy rainfall and strong winds, are extreme weather events that can cause disasters for the affected areas [1,2]. The Western North Pacific (WNP) (0–30° N, 120° E–180; green boxed area in Figure 1) and the South China Sea (SCS), (0–25° N, 100° E–120° E; blue boxed area in Figure 1) are among the most affected regions due to about 30% of global TCs forming in these two areas [3]. Additionally, as the SCS is semienclosed (surrounded by land, peninsulas and islands), it is easier for TCs formed in this region to make landfall when compared to TCs formed over the WNP [4]. Atmospheric variability can affect TC genesis over the SCS and the WNP at various timescale ranges [2,5,6,7,8,9,10,11]. On the intraseasonal time scale, many studies suggested that Madden–Julian Oscillation (MJO) has a strong influence in modulating TC genesis over the SCS and the WNP [12,13,14,15,16].
The MJO, which is a strong tropical signal of intraseasonal variability, has a 30- to 90-day oscillation period [17,18,19]. The MJO-related convection usually forms in the tropical Indian Ocean, moves eastward across the maritime continent to the Pacific Ocean, and then disappears in the central Pacific Ocean along the equator with a speed of about 5 m·s−1, however, the MJO-related divergent circulation still propagates over South America and Africa with a faster propagation speed [20,21,22,23,24]. In addition, the MJO triggers tropical–extratropical teleconnections around the globe, particularly when its convection anomalies are over the central Pacific before disappearing over the eastern Pacific cold pool [25]. Gray [26] first illustrated the relationship between the MJO and TC activities, and suggested that TC genesis tends to be clustered in 1- to 2-week active periods, followed by 2- to 3-week periods of quiescence. Since then, strong TC genesis modulation by the MJO (hereafter, MJO-TC genesis) has been confirmed in many studies [8,12]. They suggested that more (less) TC genesis appears in active (inactive) MJO phases. Sobel and Maloney [27] suggested that the reason for an increased number of TCs over the WNP during the active MJO phases may be the accumulation of wave energy. In addition, the MJO can affect TC genesis by changing related atmospheric conditions (e.g., vertical wind shear, moisture, and vorticity) [8,28,29], even though the major atmospheric factor by which the MJO modulates TC genesis is not the same in different ocean basins. Zhao and Li [28] proposed that the largest effect of MJO modulation on TC genesis over the WNP comes from midlevel relative humidity. However, for the SCS, there is no comprehensive qualitative and quantitative discussion of which atmospheric factor (e.g., vertical wind shear, moisture, and vorticity) is likely to contribute most to MJO impact on TC genesis [29]. Examining this issue was one of the objectives of this study.
The MJO-TC genesis relationship might be different under different El Niño-Southern Oscillation (ENSO) backgrounds. For example, Hall et al. [30] suggested that TC genesis over the Australian region is strongly modulated by the MJO, especially during El Niño periods. For the Atlantic basin, Klotzbach et al. [31] recently found that there is strengthened (weakened) MJO modulation of TC activities during La Niña (El Niño) events. For the WNP, Li et al. [32] indicated that enhanced modulation occurs during the El Niño years compared to that in other years. As the SCS is a semienclosed sea which is different from the WNP (Figure 1), it is important to understand the differences between the impact of the MJO-TC genesis modulation over the SCS and over the WNP under different ENSO conditions. Examining this issue was the main objective of this study.
The paper is divided into the following sections. The data and methods used in this study are described in Section 2. In Section 3, the mean state of WNP and SCS TC genesis under different ENSO conditions is examined. In Section 4, the statistical results for the examination of MJO-TC genesis relationship over the WNP and the SCS under different ENSO years are provided. In Section 5, MJO-related thermodynamic and dynamic environmental parameters associated with TC genesis over the SCS and the WNP under different ENSO conditions are discussed to obtain a more thorough understanding. Our conclusions are given in Section 6.

2. Data and Methodology

2.1. Data

This study focused on the months of June–November, which is the TC season over the SCS (0–25° N, 100° E–120° E) and the WNP (0–30° N, 120° E–180), during 1979–2016. The selection of June–November as the TC season follows Li et al. [32]. The information of TCs (including date, location, maximum surface wind speed, etc.) was obtained from best-track data provided by the Joint Typhoon Warning Center (JTWC).
Daily atmospheric and oceanic datasets, such as wind, air temperature, relative humidity, relative vorticity, omega, and sea surface temperature (SST), were downloaded from the European Center for Medium-Range Weather Forecasts (ECMWF) Interim reanalysis (ERA-Interim) dataset [33], which has a 0.5° × 0.5° horizontal resolution. The used pressure levels of the atmospheric variables include 1000, 925, 850, 700, 600, 500, 400, 300, 250, 200, 150, and 100 hPa. The daily interpolated outgoing longwave radiation (OLR) dataset, with a 2.5° × 2.5° horizontal resolution, was obtained from the National Oceanic and Atmospheric Administration (NOAA) (https://www.esrl.noaa.gov/psd/data/gridded/data.interp_OLR.html) [34]. The selection of ERA-Interim and NOAA reanalyses follows Ling et al. [29]. The Oceanic Niño Index (ONI) from the NOAA Climate Prediction Center (CPC) for the active TC season (June–November) was used in this study to define the ENSO conditions.

2.2. Methods

2.2.1. Identification of the Madden–Julian Oscillation (MJO)-Related Activity

The Real-Time Multivariate MJO (RMM) Index, which was provided by the Australian Bureau of Meteorology and consisted of two leading principal-components’ time series, named as RMM1 and RMM2, was used to determine the MJO phases [35]. On the basis of RMM1 and RMM2, the MJO life cycle was divided into eight phases (referred to as MJO phases 1 to 8). In this study, the definition of phases 1 to 8 of the MJO follows Wheeler and Hendon [35]. The center of the MJO convections is over the Western Hemisphere and Africa during phases 8 and 1, the Indian Ocean during phases 2 and 3, the Maritime Continent during phases 4 and 5, and the Western Pacific during phases 6 and 7 [35].
To obtain the MJO signal, we applied a 30- to 90-day bandpass filter (Lanczos filter [36]) on the daily anomalies of atmospheric variables. The daily climatological mean, which was each day’s average during June–November over the period of 1979–2016, was removed to obtain daily anomalies for the composite analysis in the later examinations. Hereafter, if the Lanczos filter is applied to variables, it is referred to as “filtered” data. In addition, we used the root mean square (RMS) values of filtered OLR anomalies to represent MJO activity [32].

2.2.2. Classification of Different El Niño-Southern Oscillation (ENSO) Conditions

The different ENSO conditions are defined by using the ONI. If more than five consecutive ONI values for the active TC season were > 0.5 °C (< −0.5 °C), the year was defined as an El Niño (La Niña) year [37]. On the basis of this definition, 1982, 1987, 1991, 1997, 2002, 2004, 2009, and 2015 were defined as the El Niño years, and 1988, 1998, 1999, 2000, 2007, 2010, and 2011 were defined as the La Niña years; the 23 remaining years were considered as neutral years.

2.2.3. Definition of Tropical Cyclone (TC) Genesis and Related Index

Based on the best-track data from the JTWC, the date and position of TC genesis were defined when the maximum surface wind speed of TC was 34 knots or above. The selection of “34 knots” as the threshold is based on the minimum standard for reaching the grade of tropical storm (TS). In total, there were 900 TCs that formed in the TC season (June–November) over two analyzed regions during the period of 1979–2016. Following Li et al. [32], we calculate the daily genesis rate (DGR) only for the TCs that occurred on a day of strong MJO signal (i.e., ( R M M 1 2 + R M M 2 2 ) 1 ) . The observed DGR is defined as the percentage ratio of the TC genesis number in each MJO phase to the days in each MJO phase with ( R M M 1 2 + R M M 2 2 ) 1 , and the expected DGR is defined as the percentage ratio of the total TC genesis number to the total phases’ days with ( R M M 1 2 + R M M 2 2 ) 1 . Additionally, following Li et al. [32], the ratio of maximum DGR to minimum DGR was defined as an enhancement to suppression ratio (ESR). The larger an ESR is, the stronger the MJO-TC genesis modulation.

2.2.4. Statistical Testing

Similar to previous studies [8,12,38], we used Z-test to measure the significance of the DGR and the composites of DGR (explained later in Section 4), following Equation (1).
Z = ( p p e ) p e ( 1 p e ) / N ,
where N is the number of days in a particular MJO phase, P is the observed DGR (defined in Section 2.2.3), and Pe is the expected DGR (defined in Section 2.2.3). In this study, 90% confidence level with critical value of Z = ±1.64 in a two-tailed test is selected for defining Z-test related statistically significant values. In addition, t-test is used to determinate all other statistical significances at the 90% confidence level [39].

2.2.5. Genesis Potential Index (GPI)

A widely used Genesis Potential Index (GPI) was applied to quantitatively evaluate the relative contributions of thermodynamic and dynamic conditions to TC genesis [40,41,42]. The index was proposed by Emanuel and Nolan [43], and it can be written as:
G P I = T 1 × T 2 × T 3 × T 4 ,
where T 1 = | 10 5 η | 3 2 , T 2 = ( R H 50 ) 3 , T 3 = ( V p o t 70 ) 3 , and T 4 = ( 1 + 0.1 V s h e a r ) 2 . η represents the 850 hPa absolute vorticity (units: s−1). RH represents the relative humidity (units: %) at 600 hPa. The selection of relative humidity at 600 hPa follows Camargo et al. [41,42]. V s h e a r represents the magnitude of the 200–850 hPa vertical wind shear (units: m·s−1). V p o t represents the potential intensity (PI; units: m·s−1) [44], which is written as:
V p o t 2 = T s T 0 C k C D [ C A P E * C A P E ] M ,
where Ts is the sea surface temperature, T0 is the temperature of the TC outflow, Ck is the exchange coefficient for enthalpy, and CD is the drag coefficient. CAPE* is the convective available potential energy of air lifted from saturation at sea level in reference to the environmental sounding, and CAPE is that of the boundary layer air. Both CAPE and CAPE* are evaluated near the radius of maximum wind.
By definition, the GPI is a positive value. Referring to the methods of Li et al. [45], contributions of each individual term to changes of the total GPI were written as follows:
δ G P I = T e r m 1 + T e r m 2 + T e r m 3 + T e r m 4 = α 1 δ T 1 + α 2 δ T 2 + α 3 δ T 3 + α 4 δ T 4 ,
where α 1 = T 2 ¯ T 3 ¯ T 4 ¯ , α 2 = T 1 ¯ T 3 ¯ T 4 ¯ , α 3 = T 1 ¯ T 2 ¯ T 4 ¯ , and α 4 = T 1 ¯ T 2 ¯ T 3 ¯ . The seasonal mean is denoted by (   ) ¯ , and the difference of the daily value from the seasonal mean is denoted by δ. Absolute vorticity is represented by Term1, relative humidity by Term2, maximum potential intensity by Term3, and vertical wind shear by Term4.

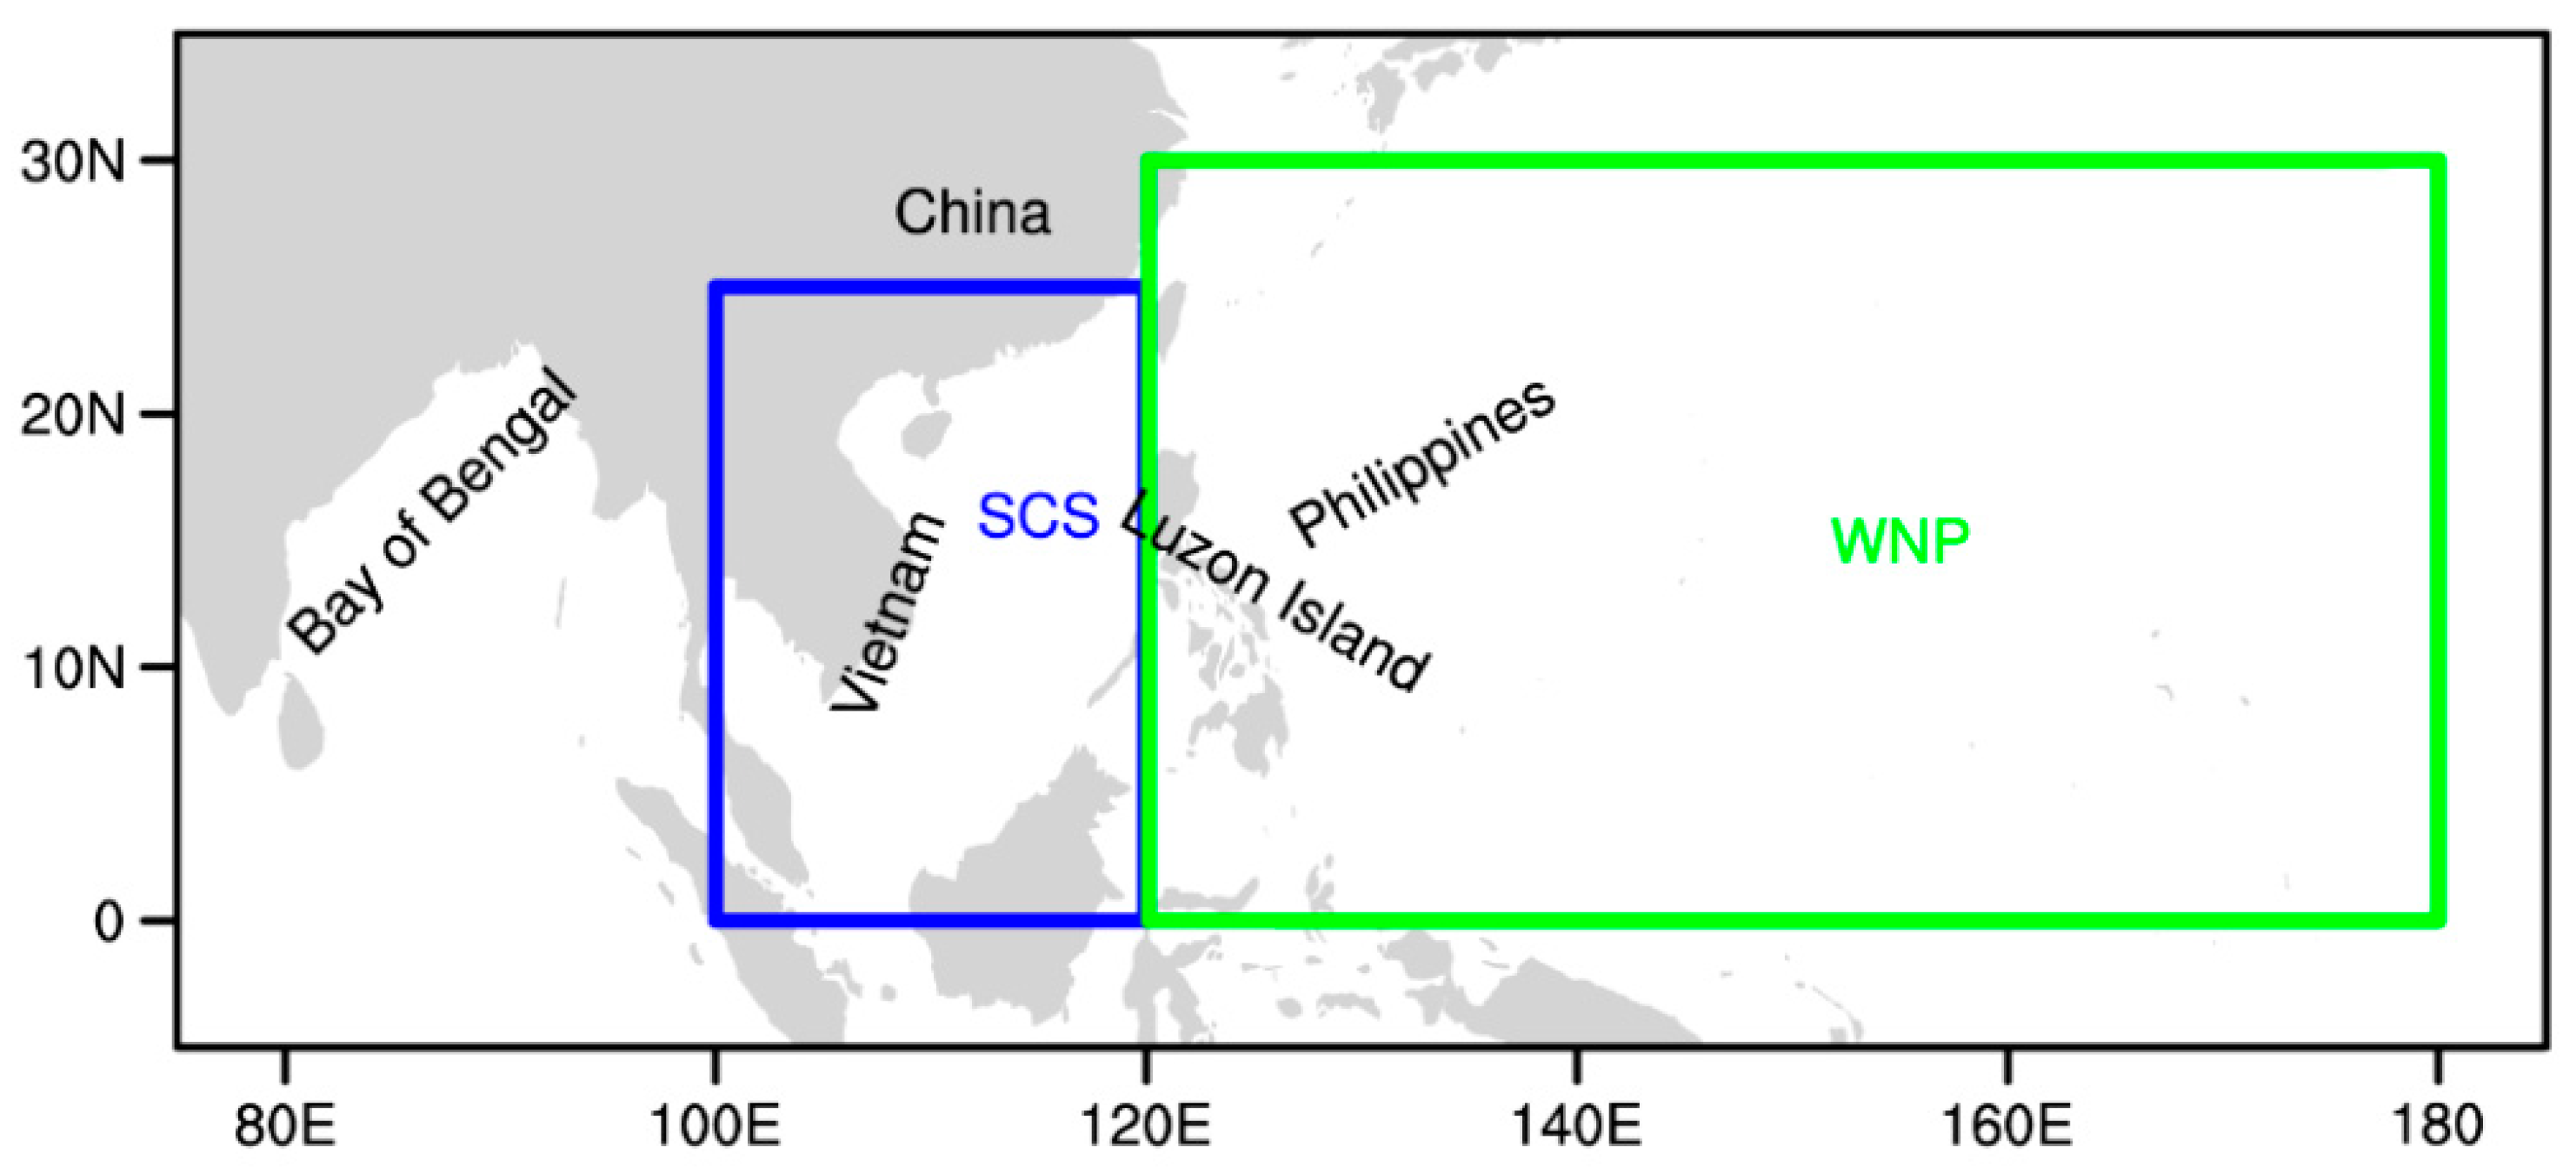
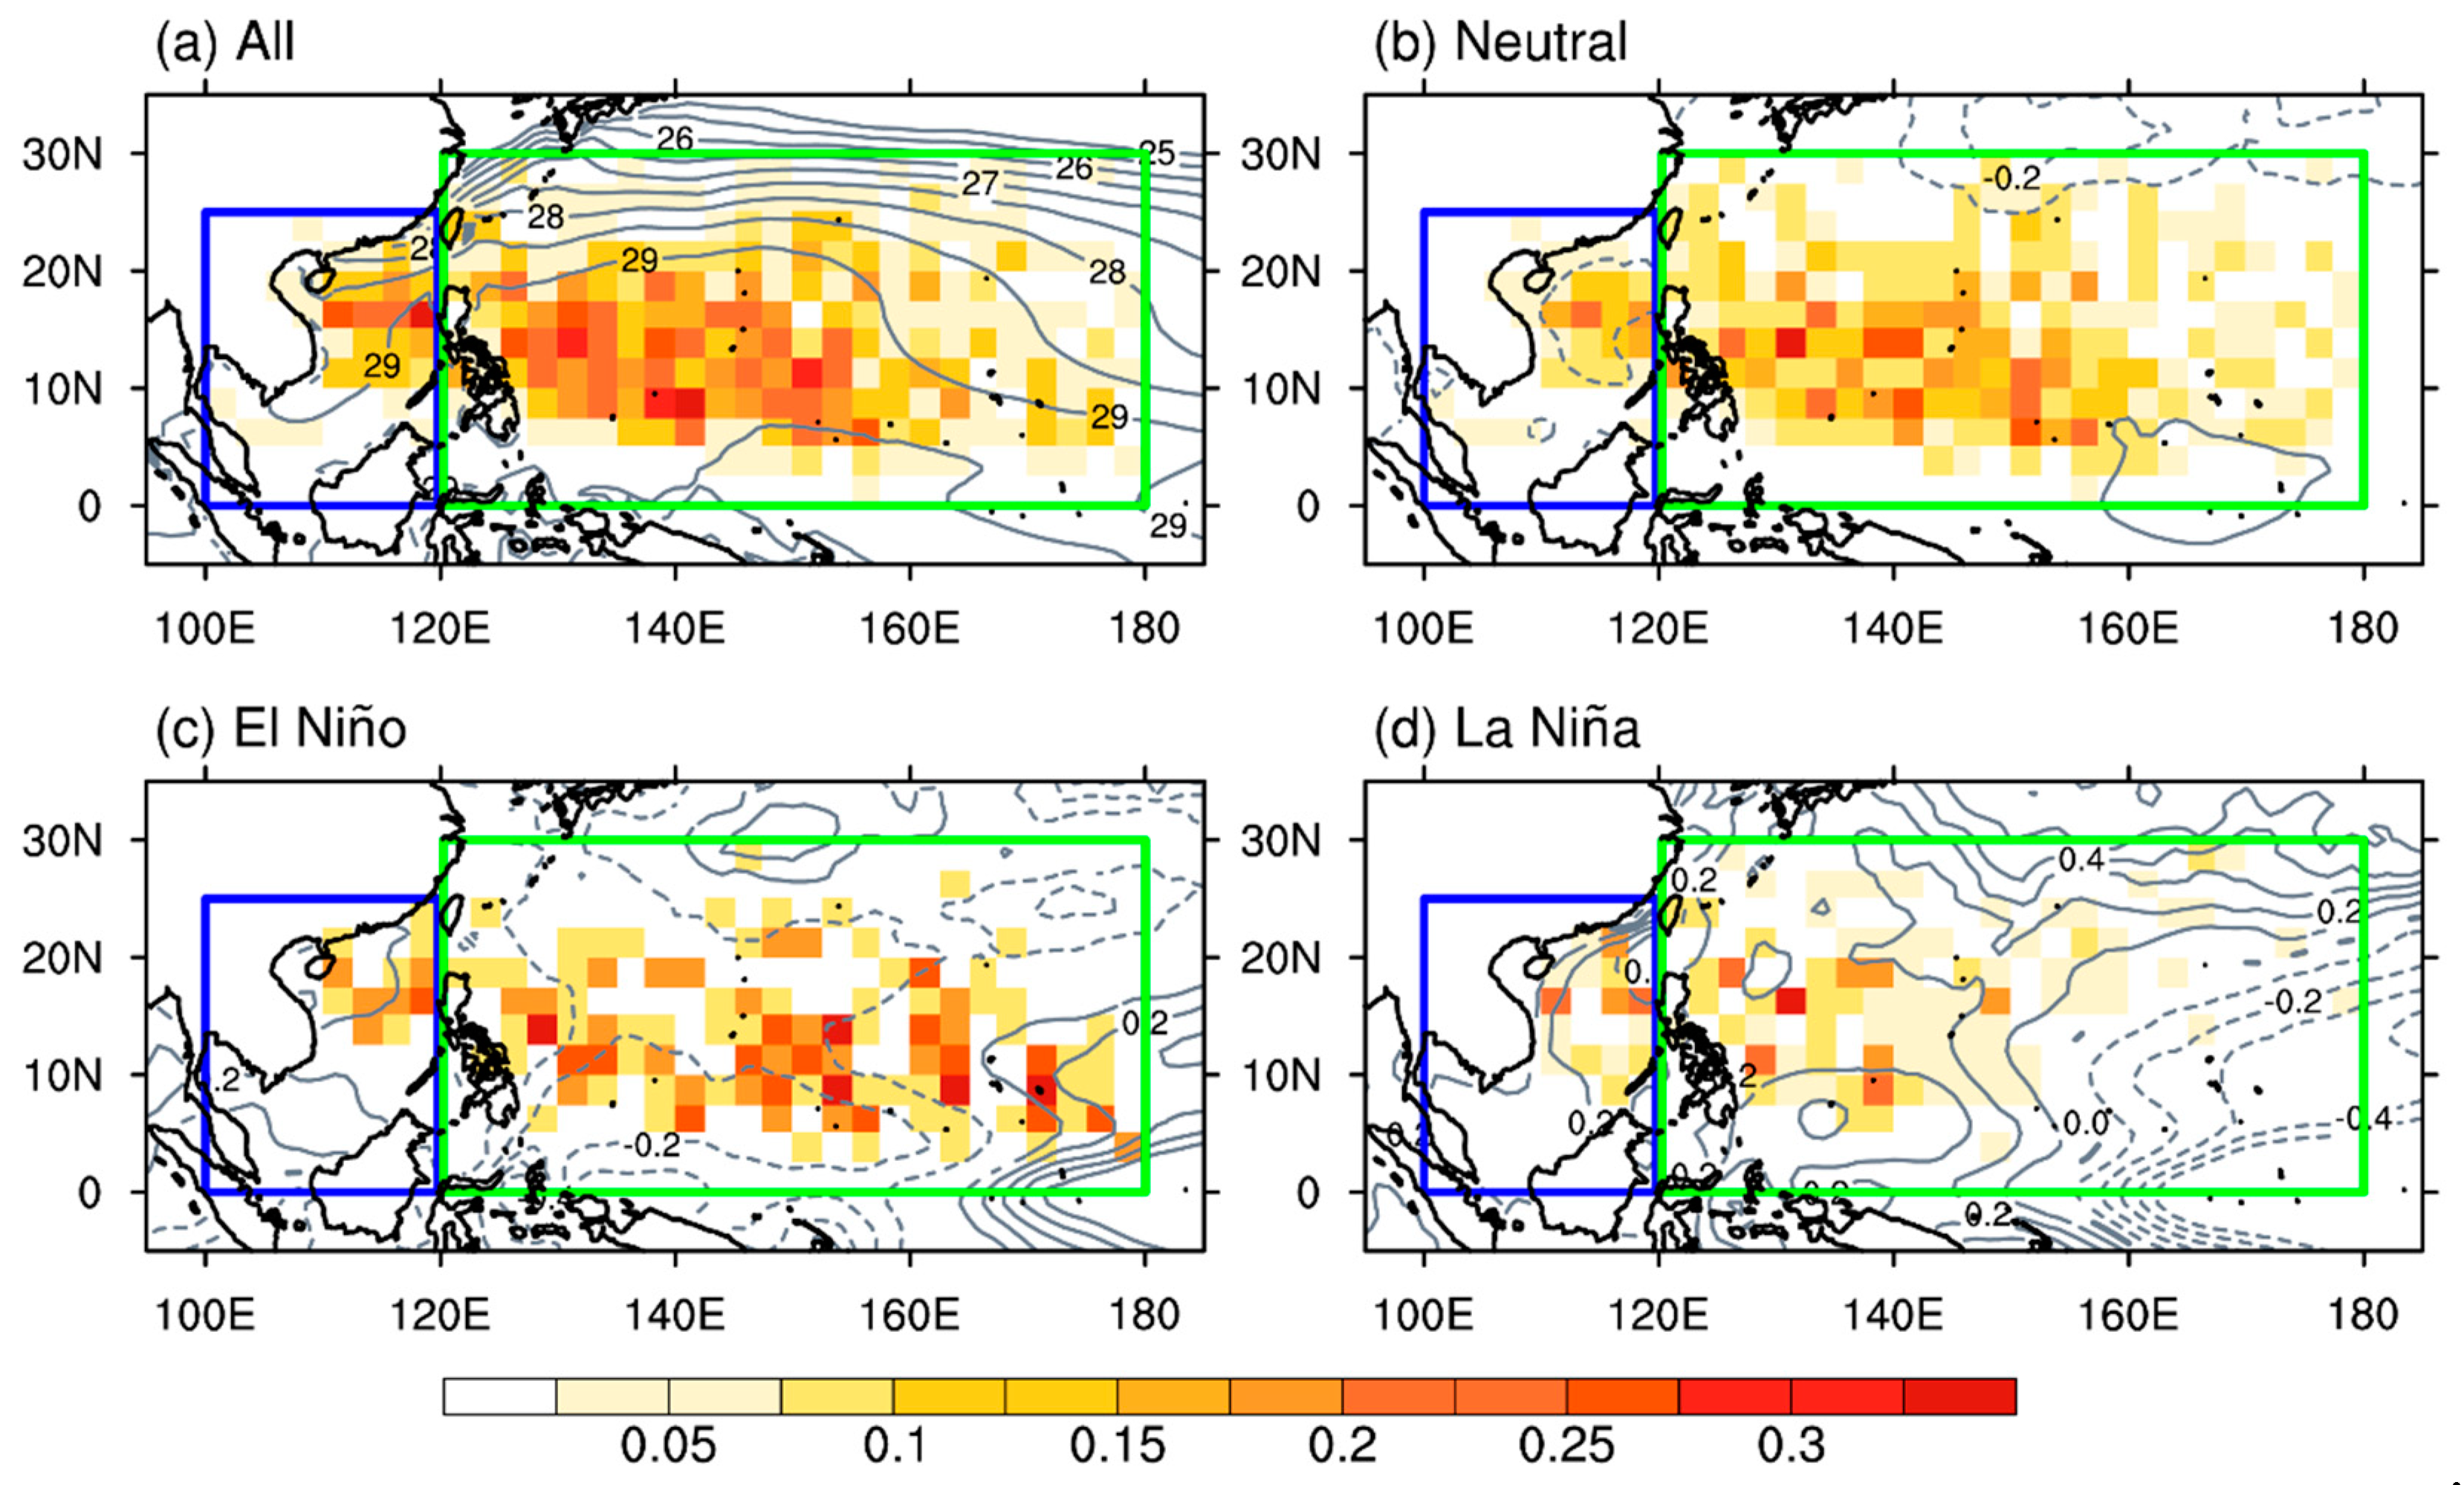
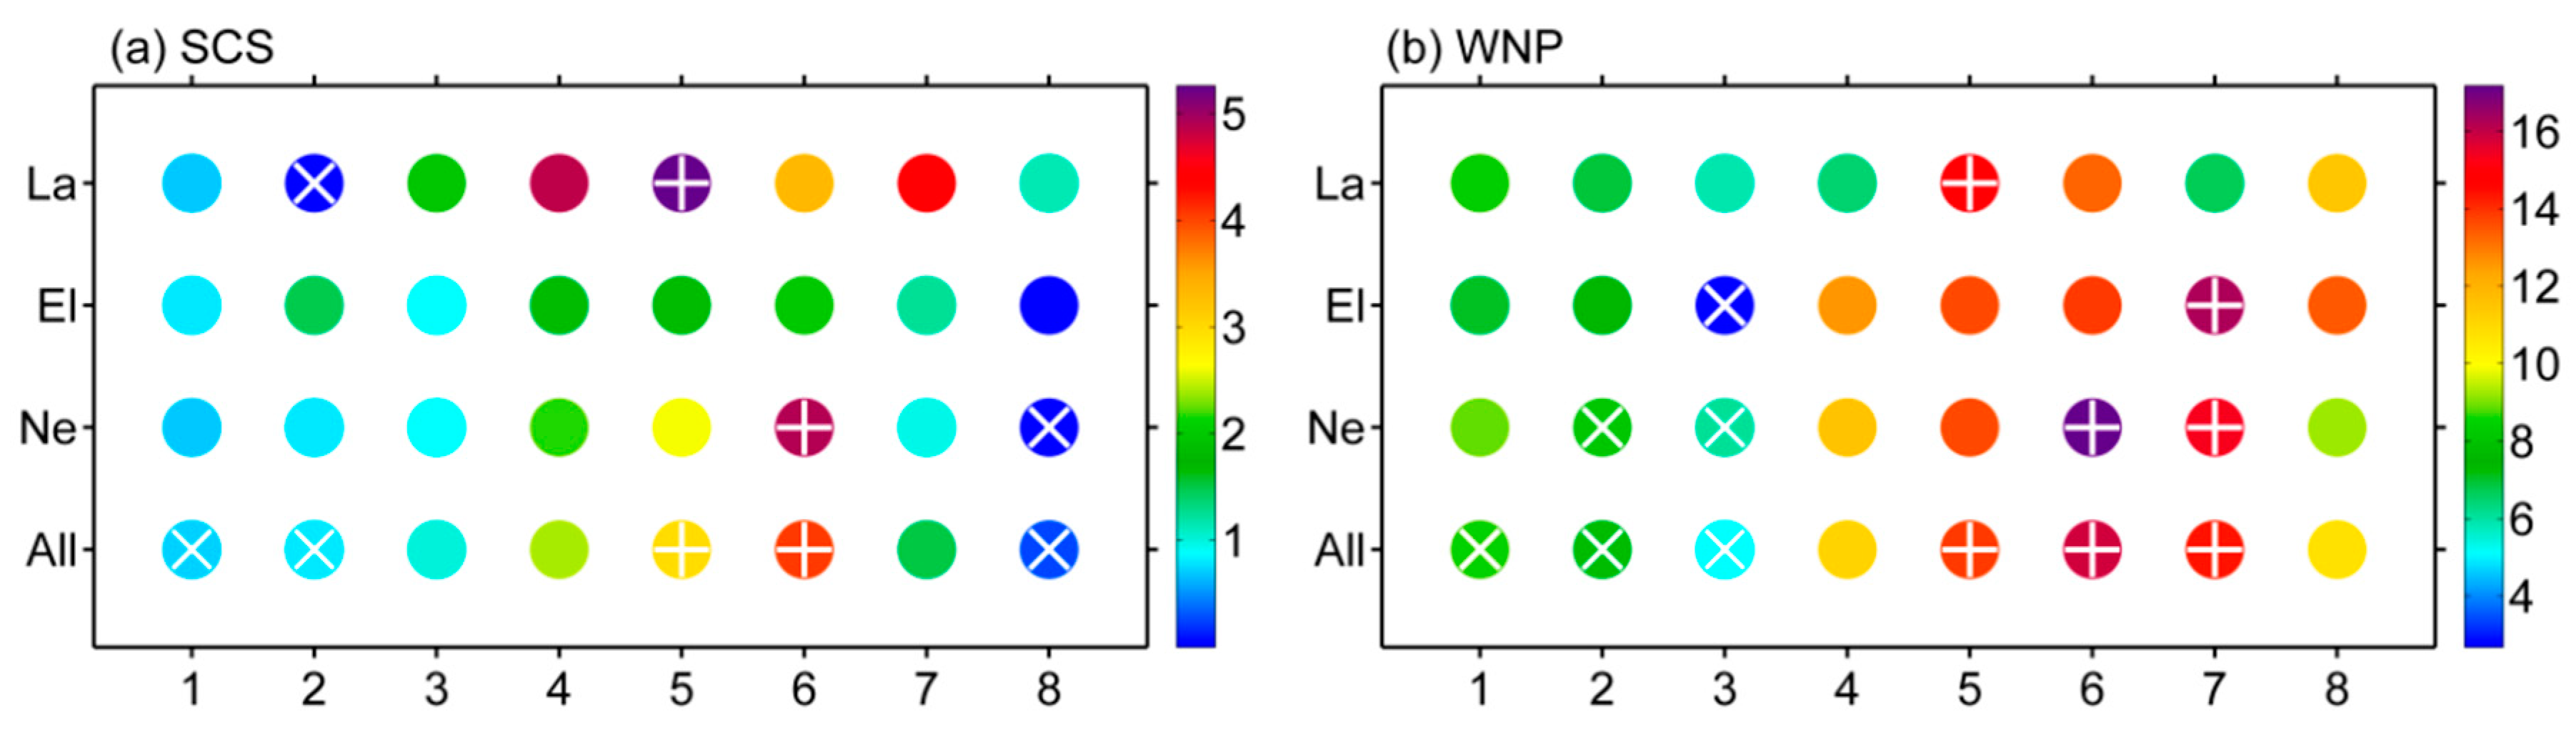
3. South China Sea (SCS) and Western North Pacific (WNP) TC Genesis Characteristics under Different ENSO Conditions

Before exploring the difference in the MJO-related TC genesis between the WNP and SCS, we examined the general characteristics of TC genesis over both regions under different ENSO backgrounds. The spatial distribution of TC genesis frequencies (average number per year) and composites of the SST anomaly (with daily climatological mean removed) over the SCS and the WNP under different ENSO conditions are shown in Figure 2. There were 900 TCs that formed in the two regions from June to November during 1979–2016, of which 119 formed over the SCS and 781 over the WNP. Generally, the locations of frequent TC genesis were mainly clustered into two regions: the north-central SCS and east of the Luzon island (Figure 2a). Over the SCS, most TCs that formed in neutral years tended to be north of 10° N (Figure 2b). During the El Niño years (Figure 2c), the positions of formed SCS TCs were closer to Southeast China (north of 12° N) compared to those in neutral years, which likely increased the probability of TC landfall along the Southeast China coast. During the La Niña years (Figure 2d), frequent locations of SCS TC genesis were closer to the offshore area of southern China when compared to either the El Niño years or neutral years (Figure 2b,c).
Relatively strong positive SST anomalies appear in the southeastern portion of the WNP during the El Niño years (Figure 2c), and WNP TC genesis also expands toward the east. During the La Niña years, positive SST anomalies show a westward shift (west of 160° E), and TC genesis appears to shrink back to the west of the WNP (Figure 2d). This agrees with the result obtained by Wang and Chan [7], who suggested that the positions of WNP TC genesis show a southeastward (northwestward) shift during the El Niño (La Niña) years.
To illustrate the relationship of TC genesis with large-scale background features, especially the monsoon trough, Figure 3 shows the 850 hPa streamlines for the active TC season under different ENSO conditions, overlaid with positions of TC genesis in the corresponding periods. The monsoon trough and the location of TC genesis undergo few changes between all years and neutral years (Figure 3a,b). However, the location of SCS and WNP TC genesis displays in-phase shifts associated with the monsoon trough, when it extends eastward during the El Niño years, but retreats westward during the La Niña years. These results are consistent with previous studies [46,47] that more (less) TC genesis is found over the southeastern quadrant of the WNP when the monsoon trough shows an eastward extension (westward retreat). During the La Niña years, TC formation along the coast of the Philippine Islands is also obviously enhanced compared to that in the El Niño years, and many TCs are generated over the western area of the WNP.

4. MJO-Related TC Genesis over the SCS and WNP under Different ENSO Conditions

Before examining the MJO-related impact on TC genesis, we analyzed the characteristics of MJO activity during the TC season. The MJO activity represented by the RMS values of filtered OLR anomalies [32] during the TC season under different ENSO conditions are shown in Figure 4. Climatologically, there are two maximum RMS centers, one over the SCS and the other over the WNP (Figure 4a). Such patterns can also be seen in neutral years (Figure 4b). During the El Niño years (Figure 4c), the MJO activity over the WNP is stronger than that over the SCS. This finding agrees well with the results of Li et al. [32], who also suggested that eastward-extending MJO activity favors WNP TC formation during the El Niño years. Figure 4d shows that the MJO activity over the SCS is stronger than that over the WNP during the La Niña years, which suggests that the MJO-related TC genesis over the SCS is stronger than over the WNP during the La Niña years.
In order to compare the differences in the MJO effect on SCS and WNP TC genesis among different ENSO conditions, we quantified the MJO impact in Figure 5. There, we calculated the DGR and Z-test statistics of SCS and WNP TC genesis in each MJO phase during TC season for different ENSO backgrounds. The definition of DGR and the MJO phases are provided in Section 2. It is noted that during all years over the SCS (Figure 5a), significantly higher (lower)-than-average DGR in MJO phases 5–6 (8–2); this means that TC genesis is enhanced (suppressed) in MJO phases 5–6 (8–2) compared to the other MJO phases. In contrast, WNP TC genesis displays significant enhancement (suppression) in phases 5–7 (1–3) (Figure 5b). The aforementioned features are also observed during neutral years (Figure 5). As for the El Niño years, each MJO phase’s DGR of SCS TCs had no significant difference from the average DGR (see Figure 5a). However, over the WNP, TC genesis is significantly enhanced in phase 7 and suppressed in phase 3 in the El Niño years (Figure 5b). In the La Niña years, SCS TC genesis (with a DGR of 5.26%) and WNP TC genesis (with a DGR of 14.91%) in phase 5 display significant enhancements at a 90% confidence level.
Based on the DGR values in Figure 5, we have tested various combinations of MJO phases to obtain the ESR value (defined in Section 2) as large as possible; this is done for each of the ENSO conditions, and for each of the analyzed areas (the SCS and the WNP). For example, Figure 5a shows that in the La Niña years, larger DGR values are in phases 4–7 and smaller DGR values are in phases 8–3 over the SCS. So we have combined phases with larger DGR (i.e., phases 4 + 5, phases 4 + 5 + 6, phases 5 + 6, phases 5 + 6 + 7, etc.) to obtain a new DGR value (named DGRmax) and phases with smaller DGR (e.g., phases 8 + 1 + 2, phases 1 + 2, phases 2 + 3, phases 1 + 2 + 3, etc.) to obtain a new DGR value (named DGRmin), and use a set of DGRmax and a set of DGRmin to generate a set of ESR (i.e., ESR = DGR max DGR min ). After the maximum value of ESR is decided depending on a set of testings, we treat the related combinations of the MJO phases with DGRmax (DGRmin) as the active (inactive) MJO-TC modulation phases [hereafter, active (inactive) MJO phases]; this is also done for each of the ENSO conditions, and for each of the analyzed areas. As the larger ESR indicates a stronger MJO-TC genesis modulation [32], the maximum ESR built in this way could indicate the strongest MJO-TC genesis modulation and include more TC genesis samples due to more involved MJO phases.
Table 1 documents the information of maximum ESR and the related definition of the active and inactive MJO phases. For the SCS, phases 5 + 6 (8 + 1) are the active (inactive) phases during neutral and the El Niño years, which results in an ESR of 7.77 for neutral years and 4.09 for the El Niño years (Table 1). During the La Niña years, SCS TC genesis is active in phases 4 + 5 and inactive in phases 8 + 1 + 2. This result yielded an ESR of 9.2, which is larger than that in neutral years (7.77) or the El Niño years (4.09). This finding indicates the strongest MJO modulation of SCS TC genesis occurs in the La Niña years. For the WNP (Table 1) in neutral and the El Niño years, phases 2 + 3 were defined as inactive phases, and phases 6 + 7 as active phases. Additionally, during La Niña years, phases 3 + 4 and 5 + 6 are the inactive and active MJO phases, respectively. The El Niño years’ ESR (2.82) over the WNP is slightly larger than the neutral years’ 2.24 and the La Niña years’ 2.29. This suggests stronger MJO-TC genesis modulation over the WNP during the El Niño years.
The above analysis clearly illustrates that the MJO-TC genesis modulation for different ENSO backgrounds differs between the two analyzed regions. During the La Niña years, the MJO-related SCS TC genesis is stronger than that during neutral and the El Niño years, whereas the MJO modulation of TC genesis over the WNP seems to be more relevant in the El Niño years. The WNP results agree with those obtained by Li et al. [32], who suggest asymmetric MJO modulation on TC genesis over the whole WNP under different ENSO conditions, with a strengthened modulation in the El Niño years compared with that in the La Niña years. In the next section, we explore the possible mechanism for the MJO-TC genesis modulation over the SCS and the WNP under different ENSO backgrounds.

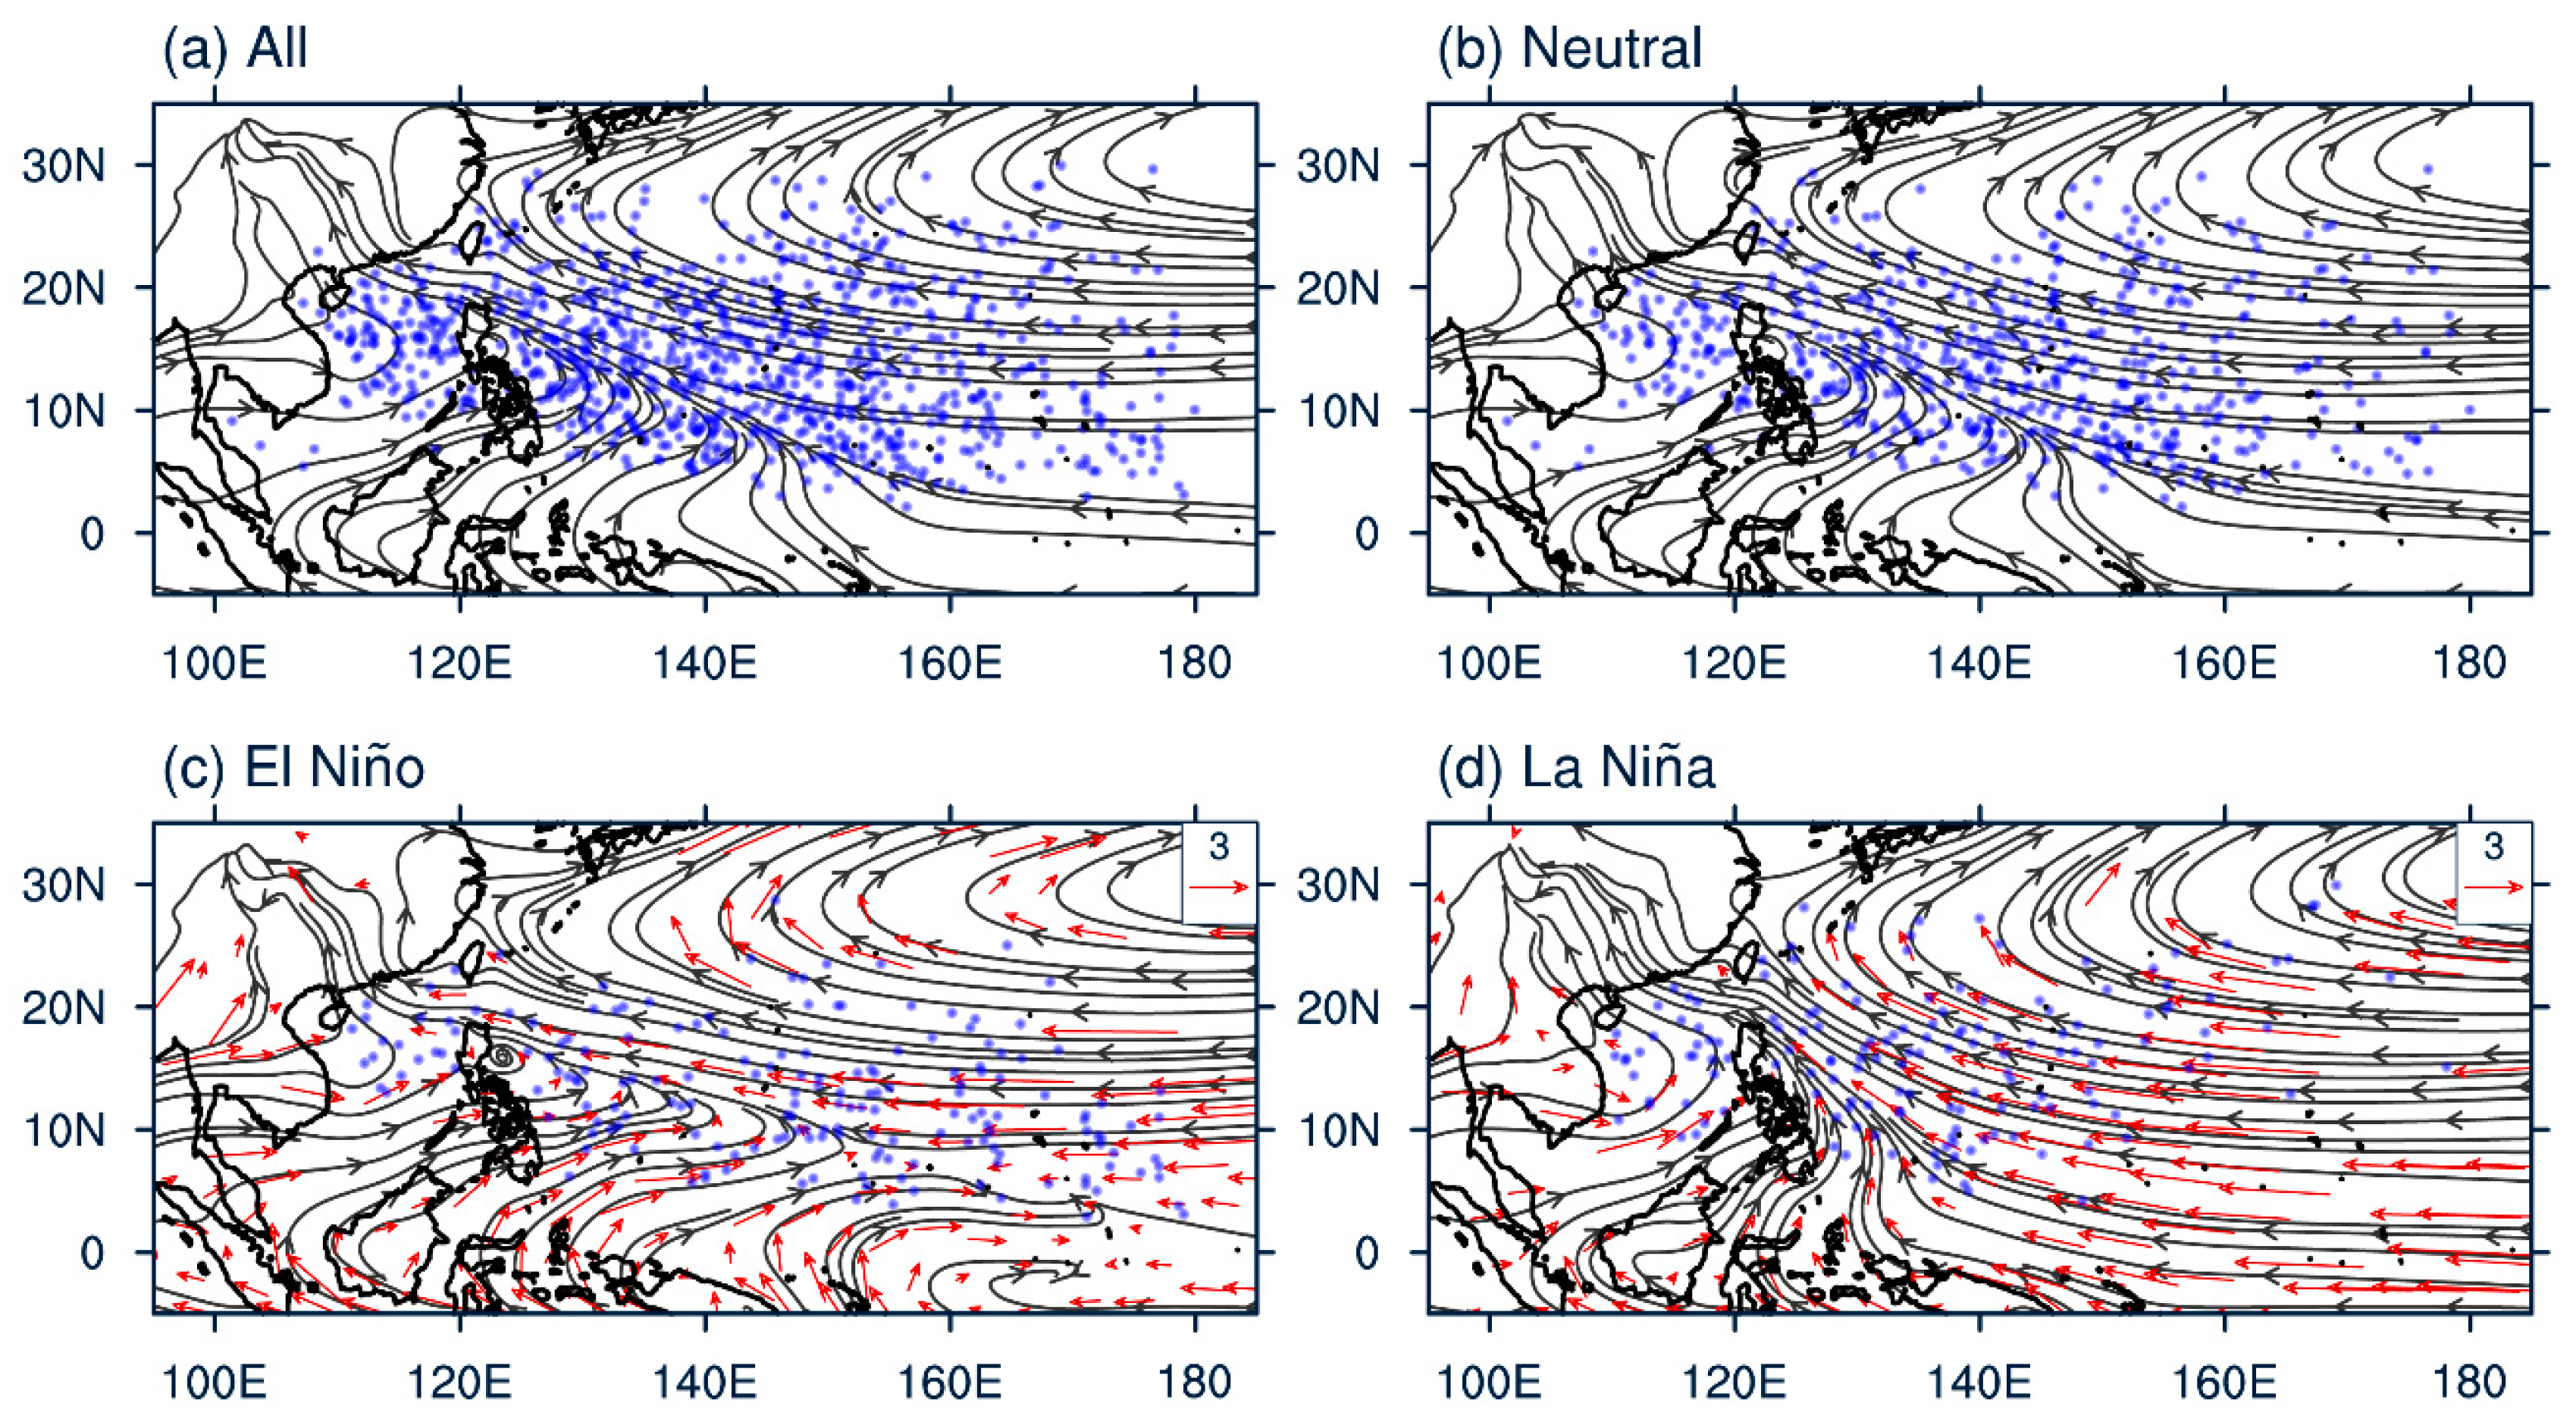
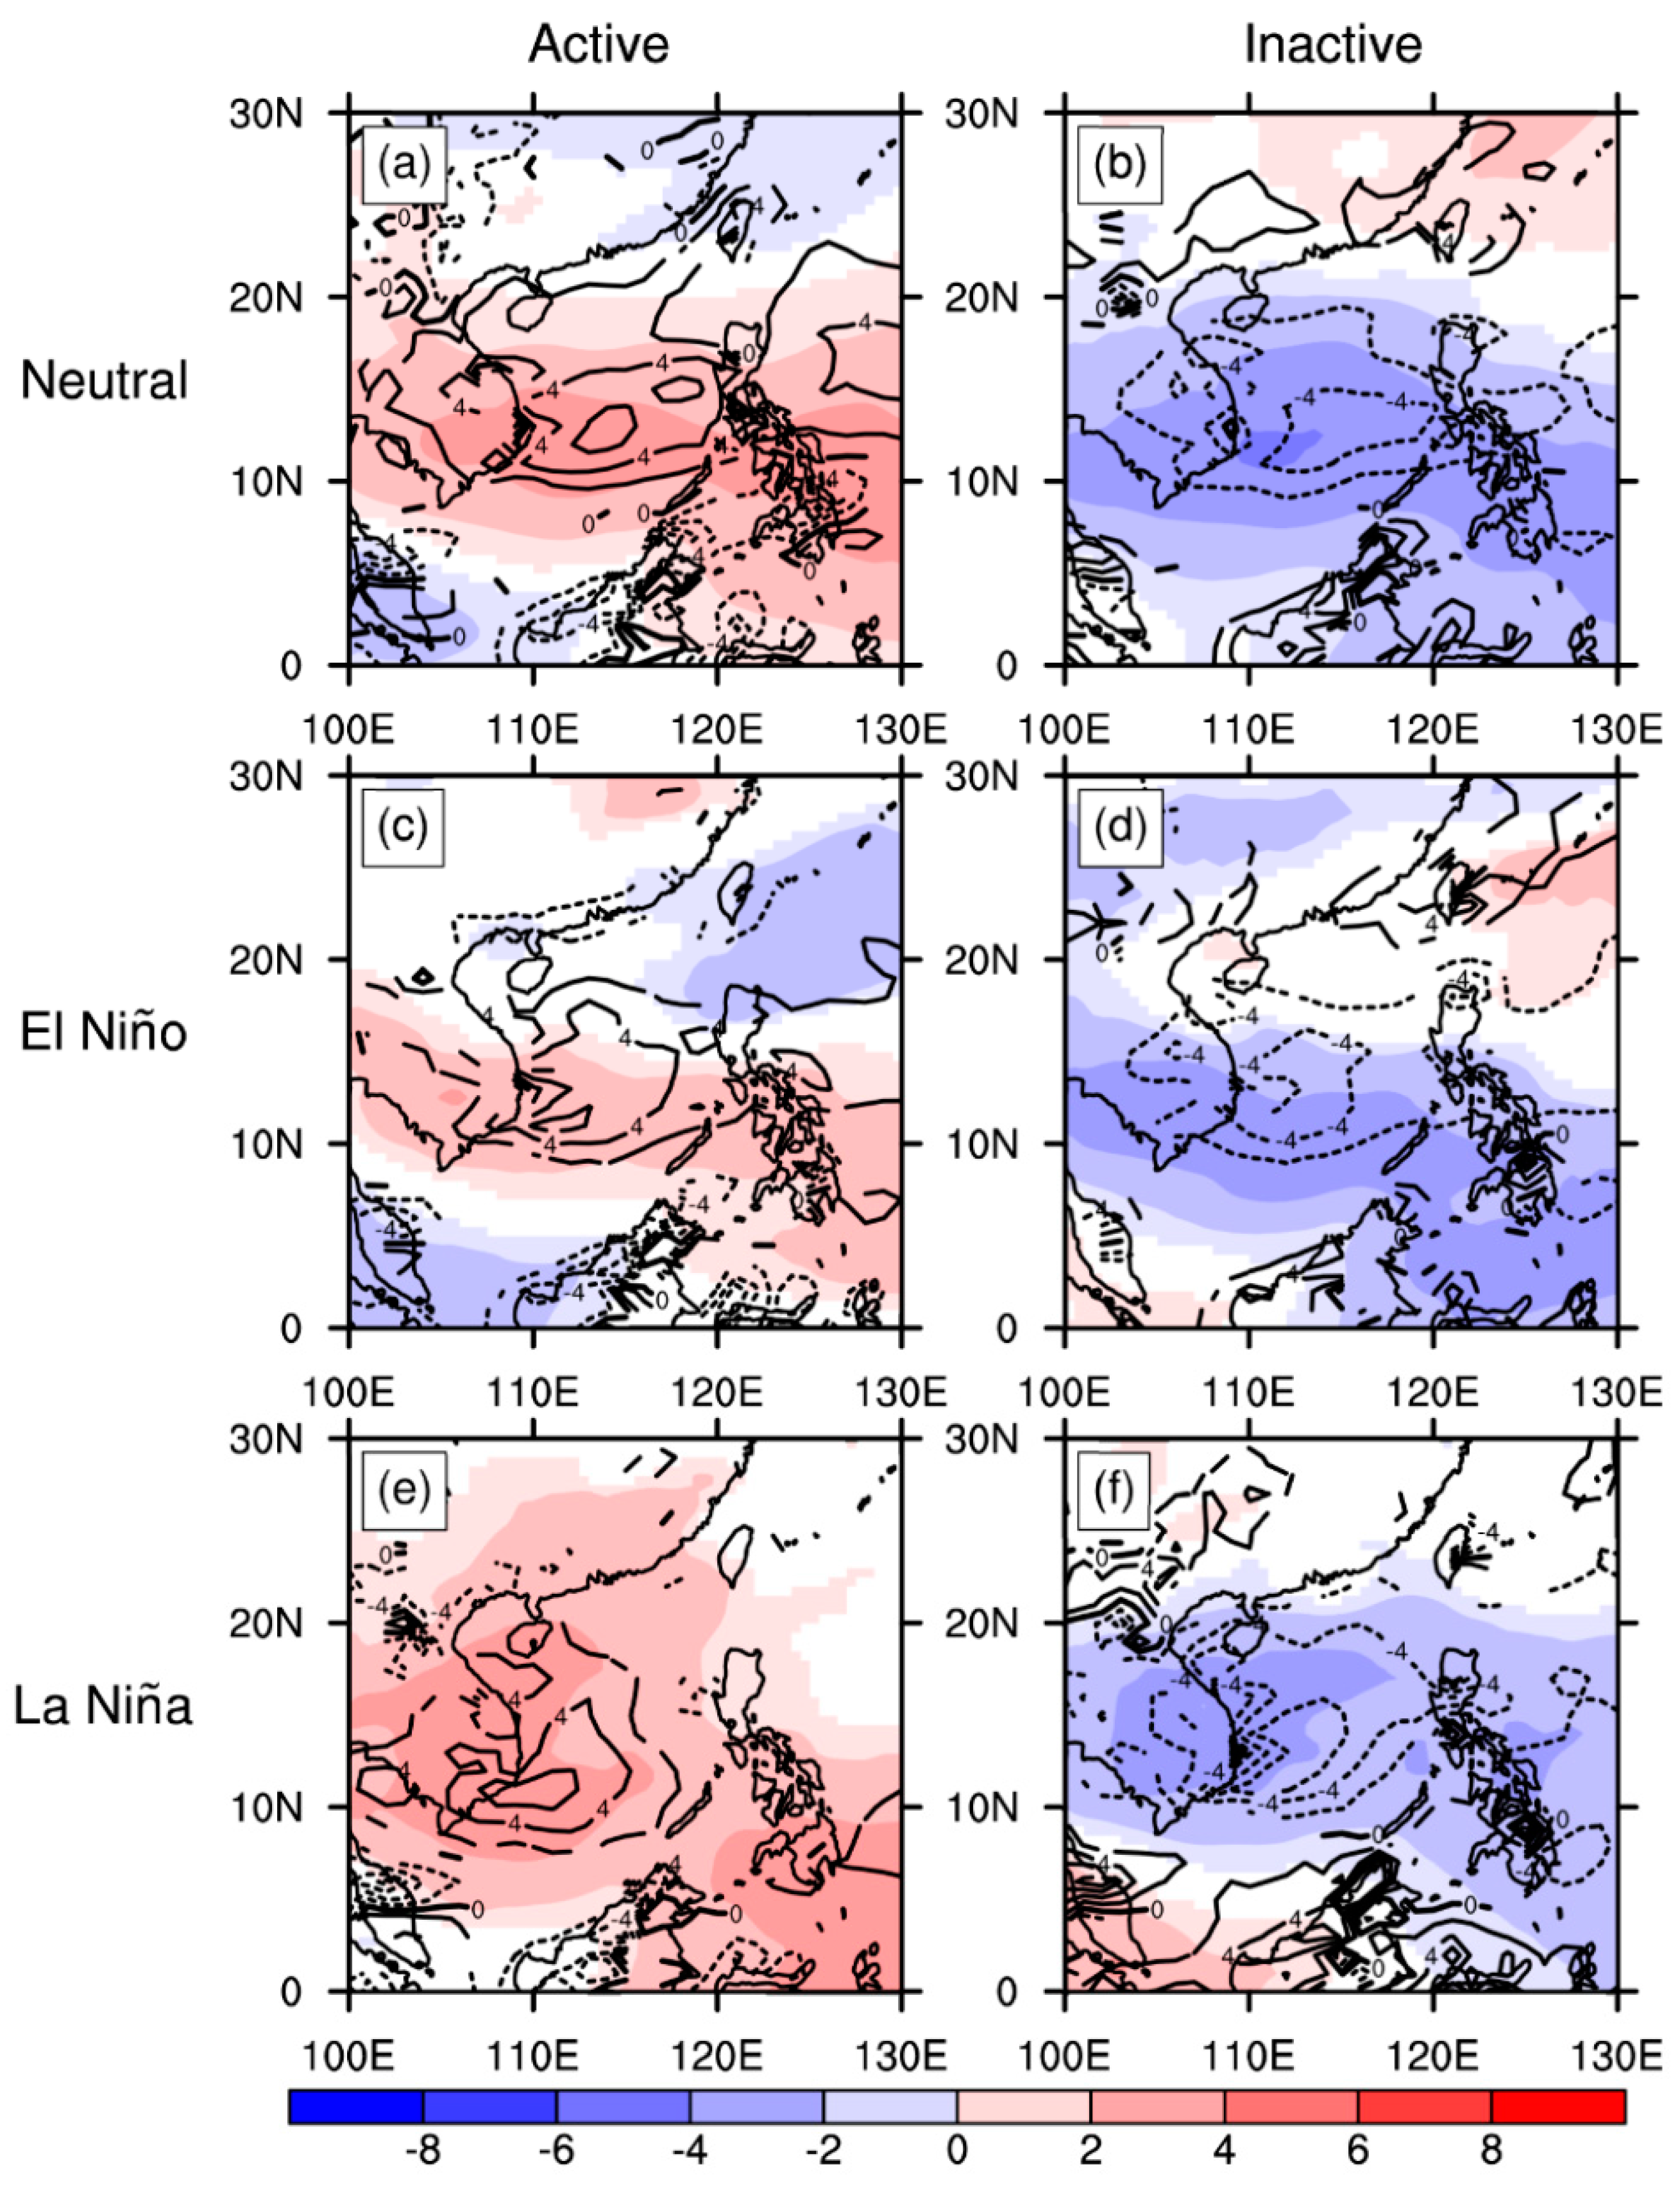
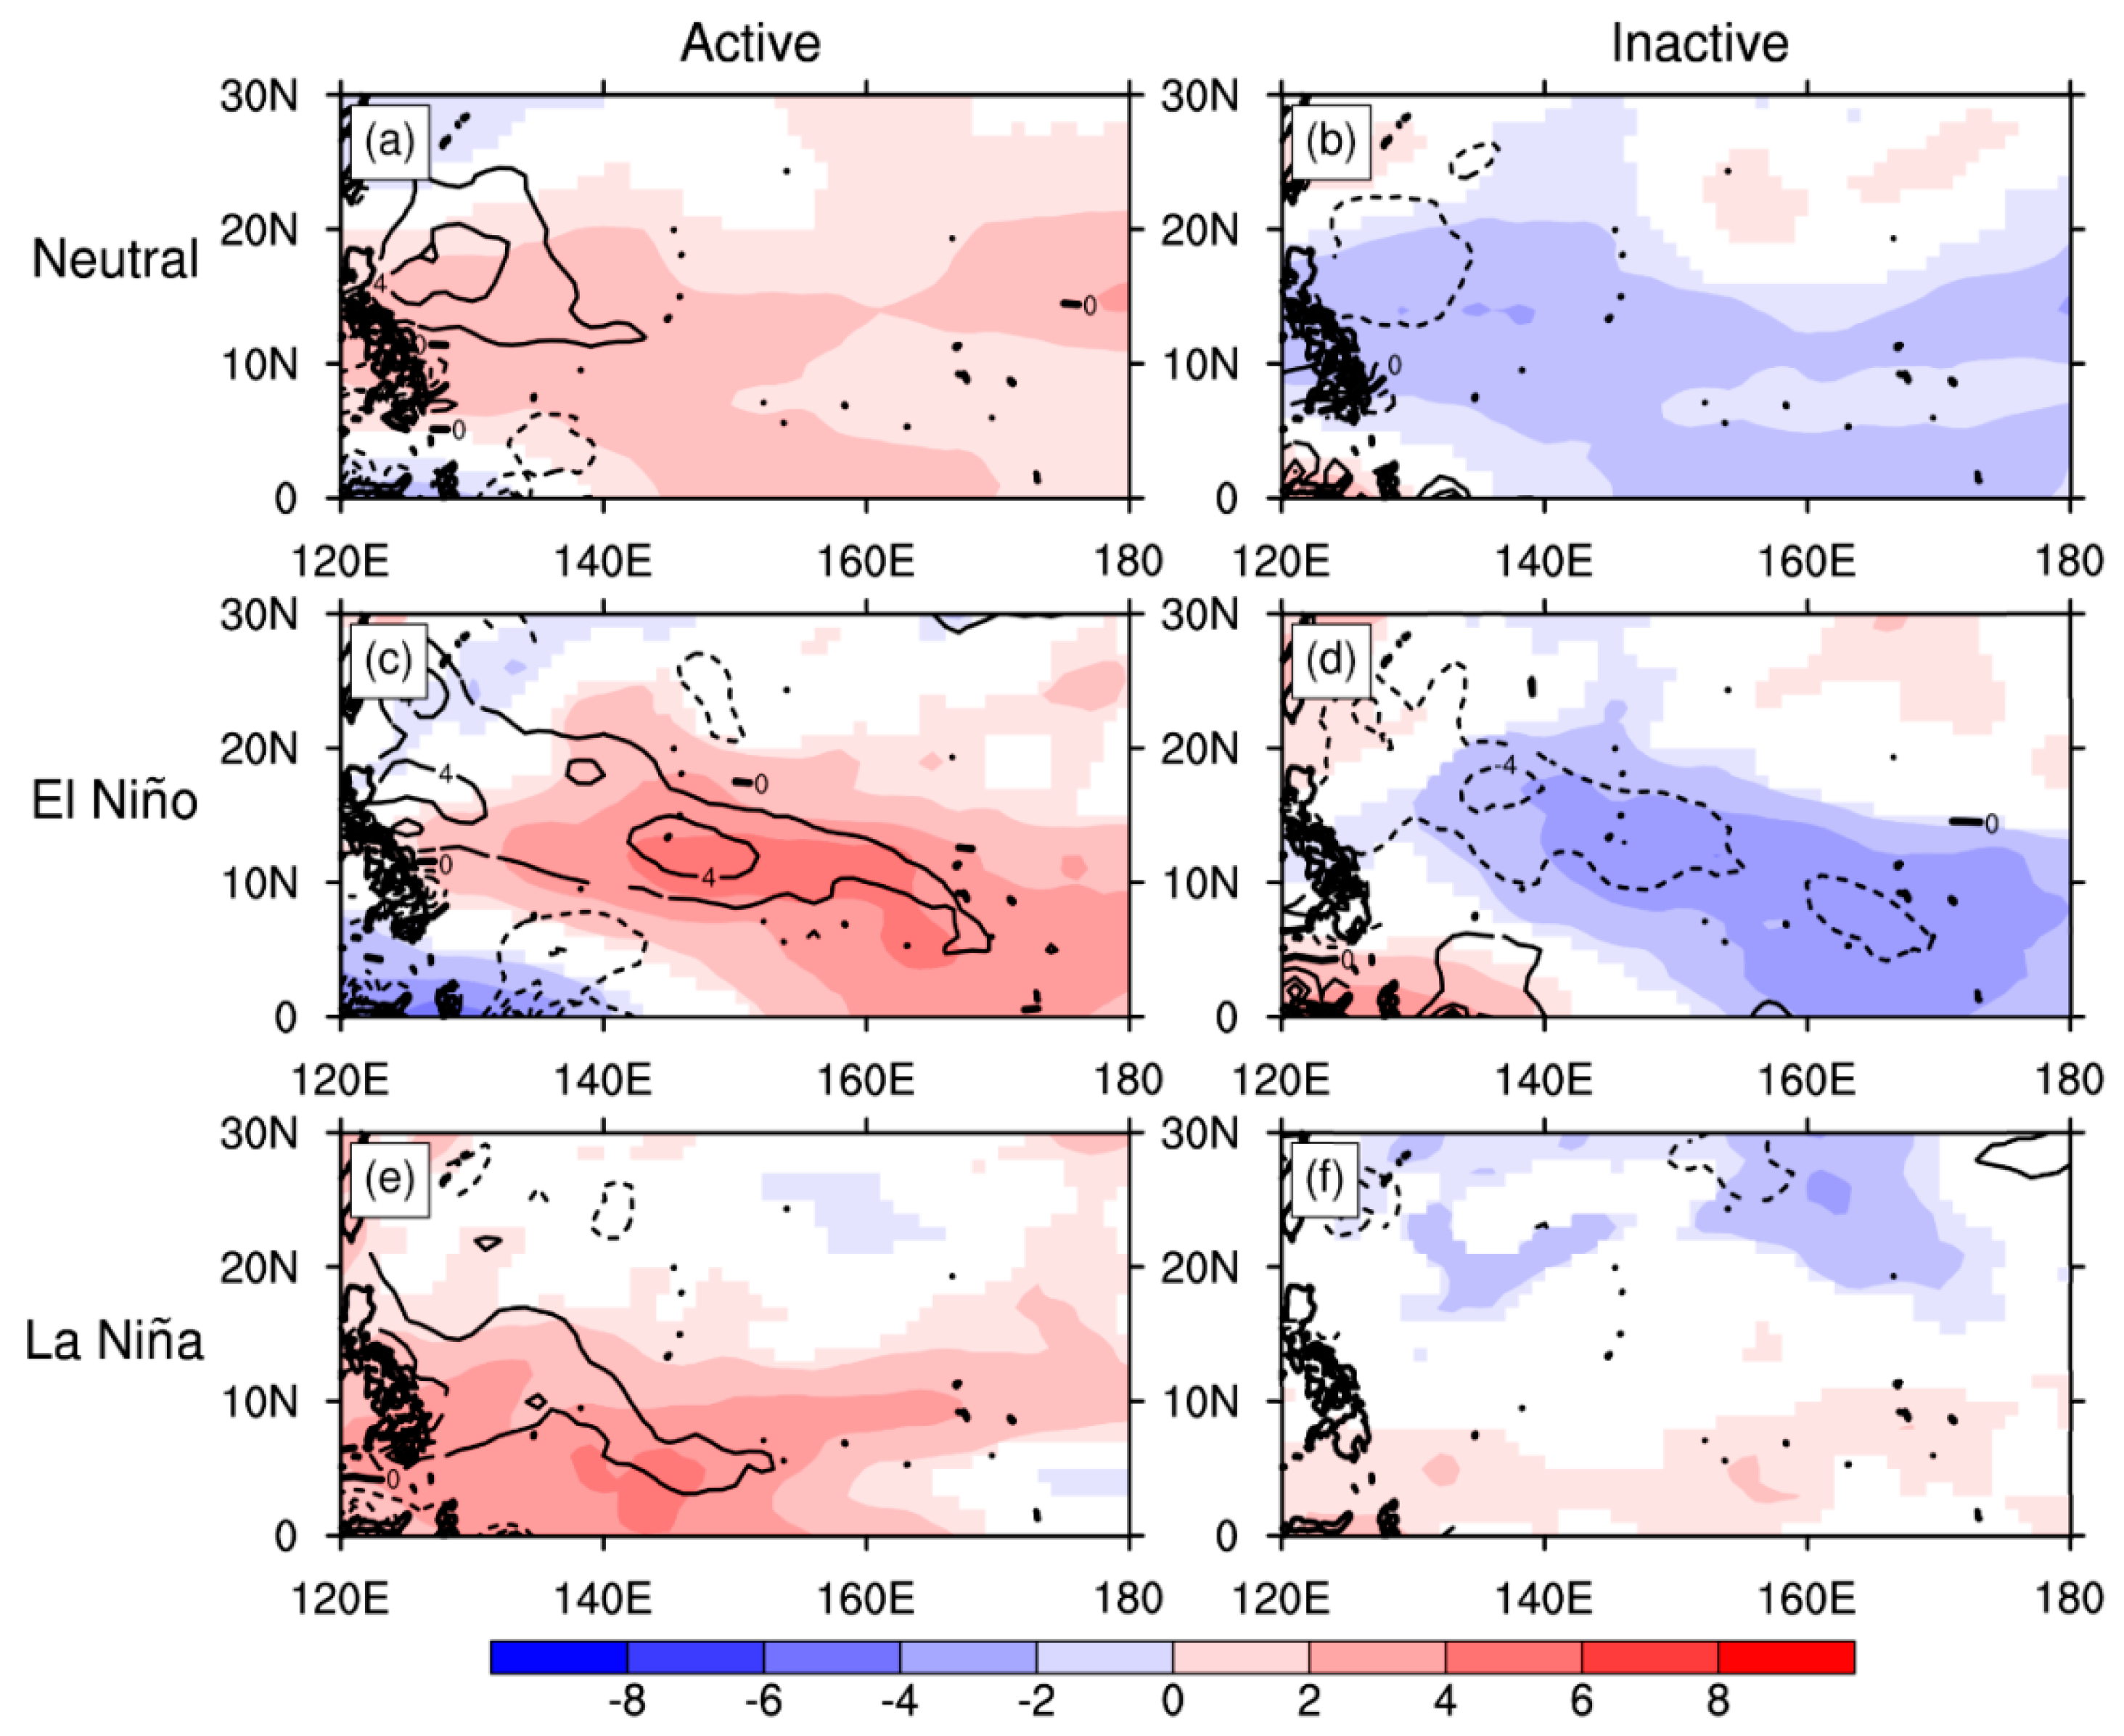
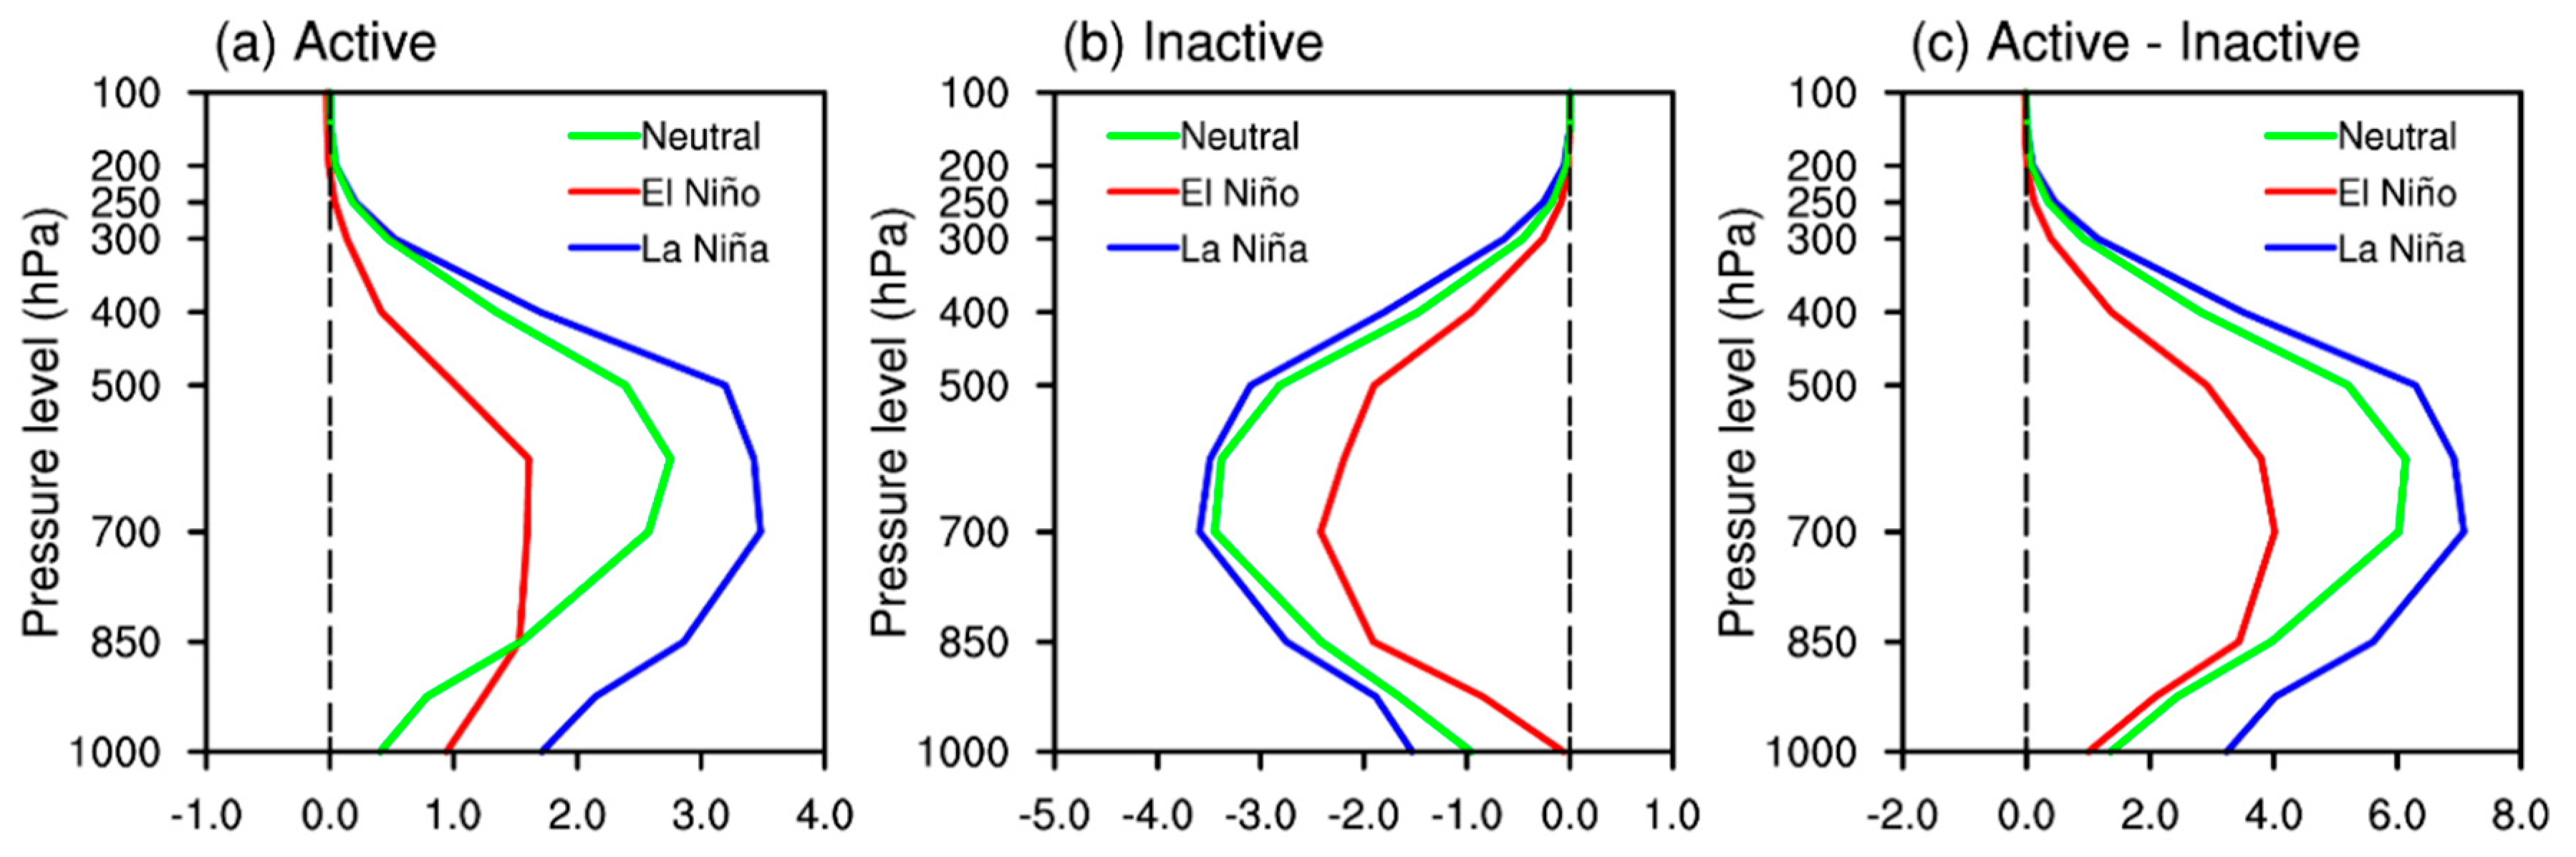
5. Mechanism of MJO-Related TC Genesis over the SCS and WNP under Different ENSO Conditions

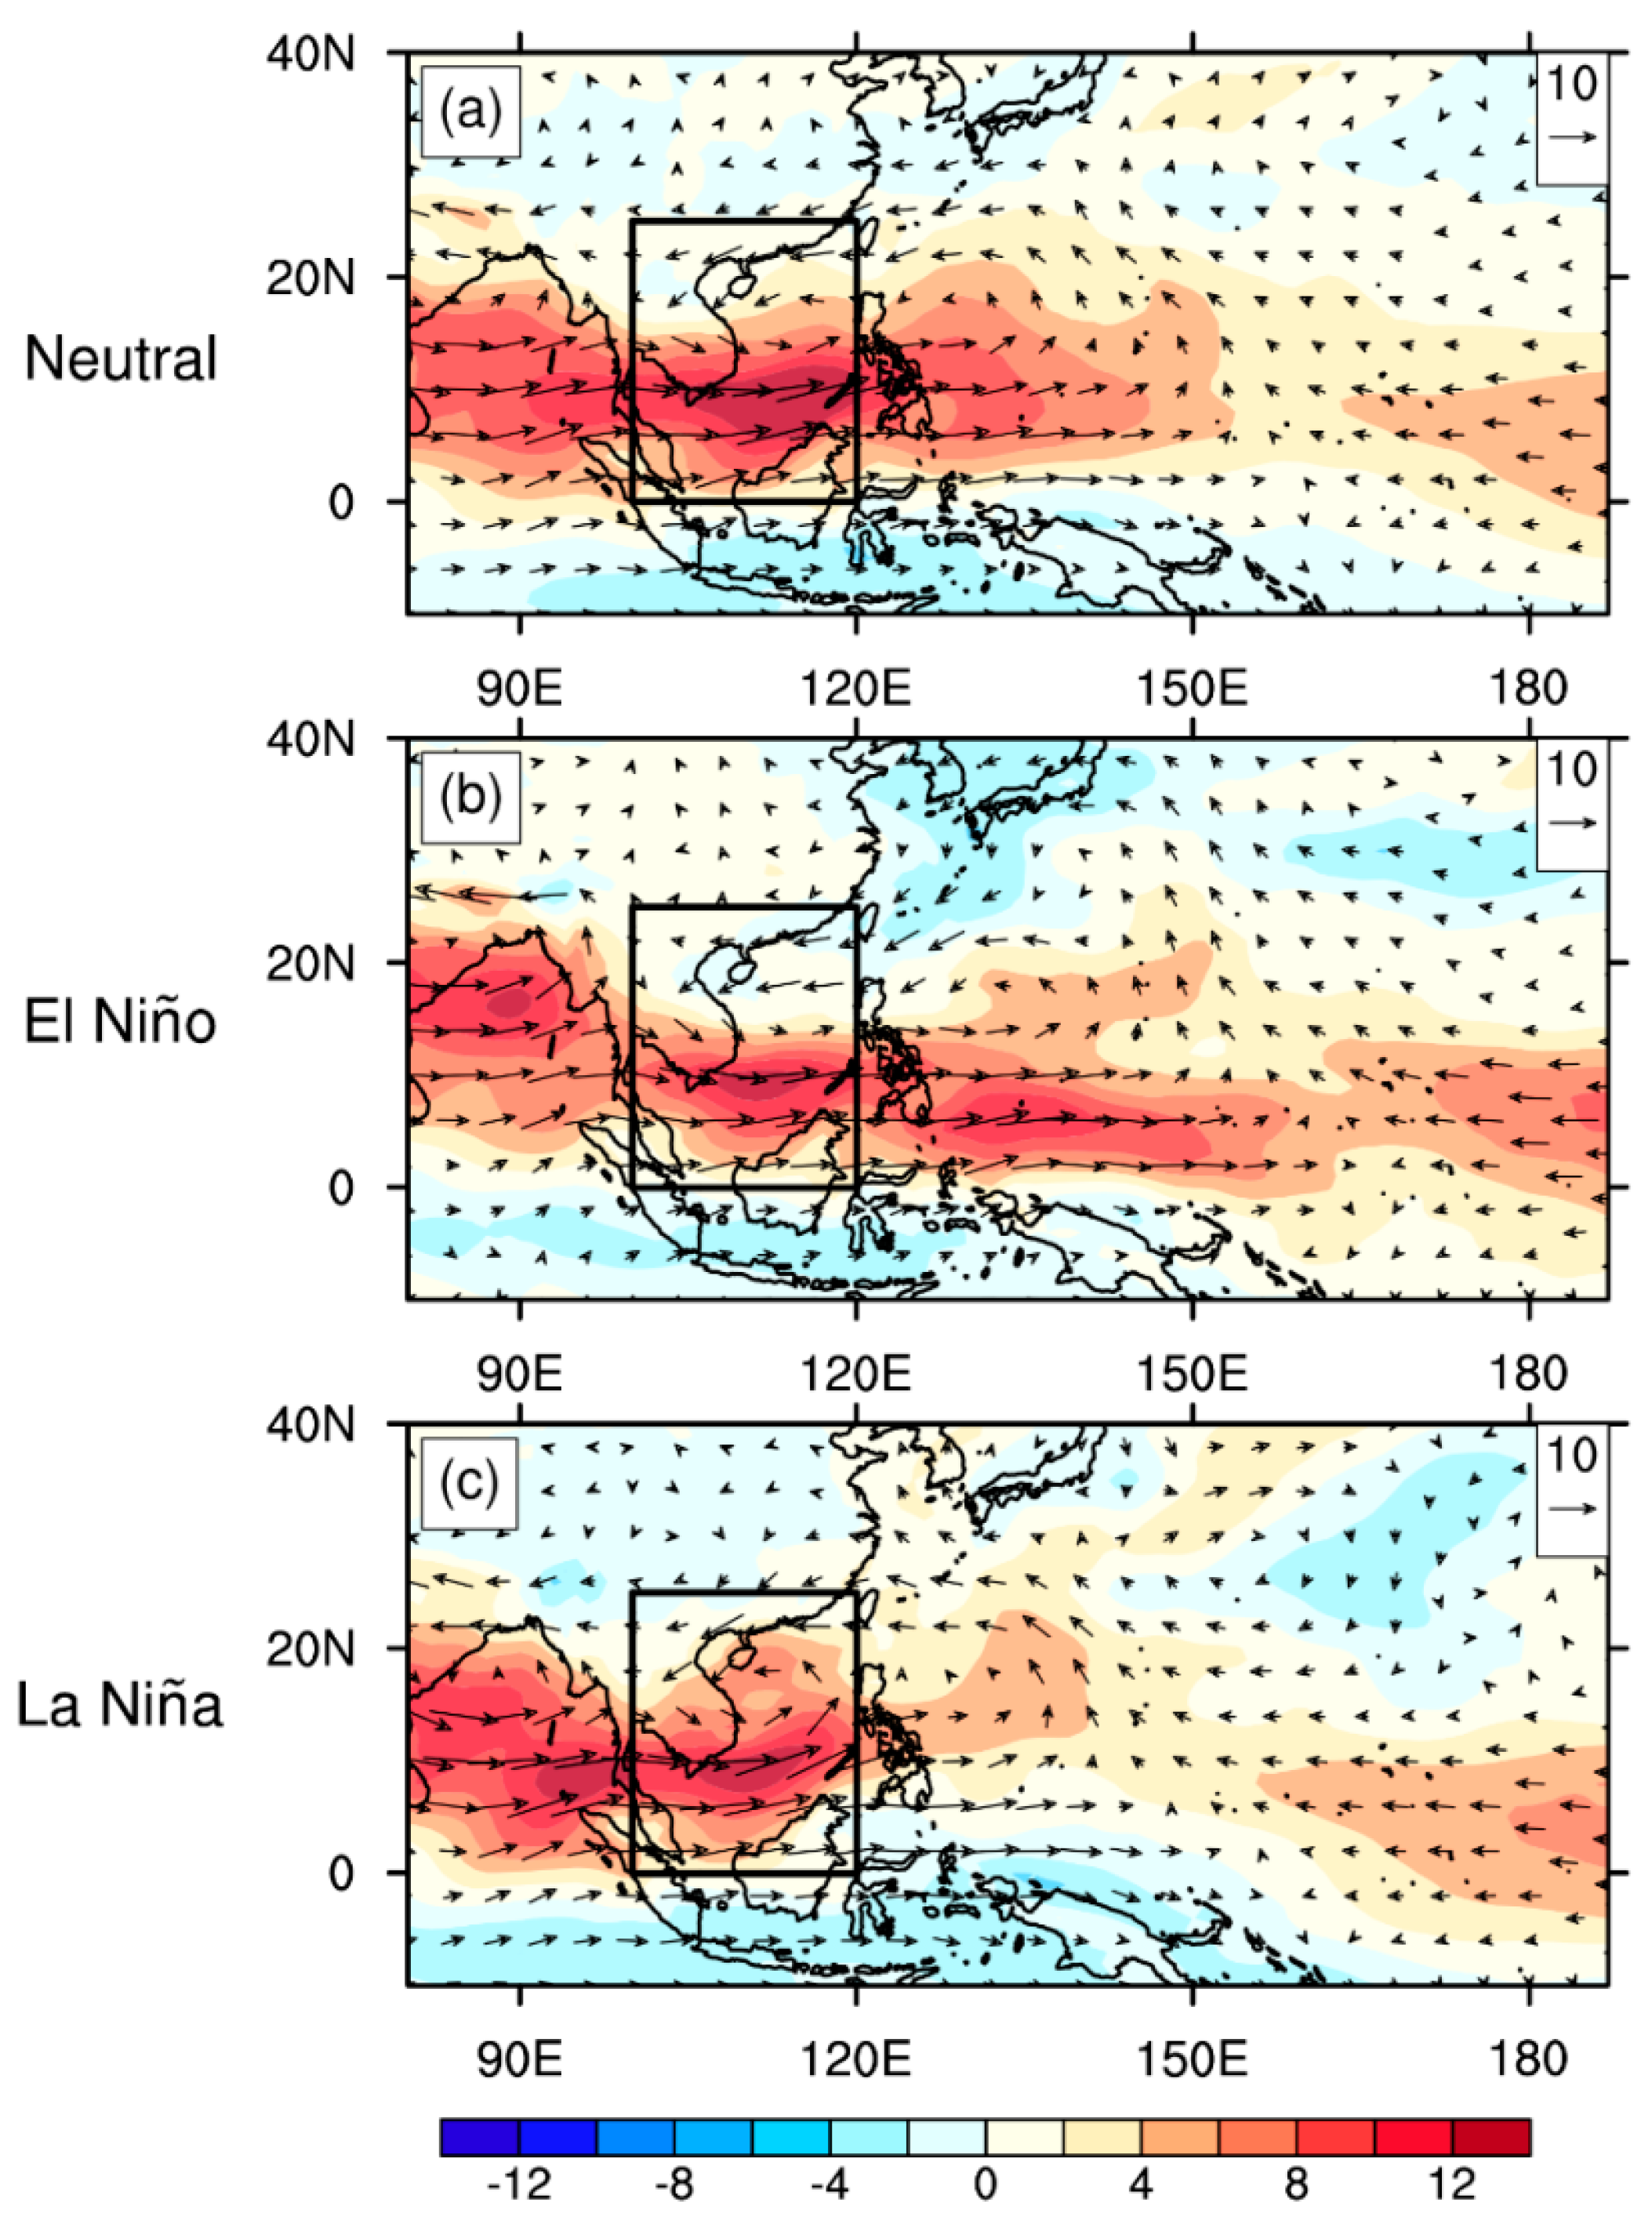
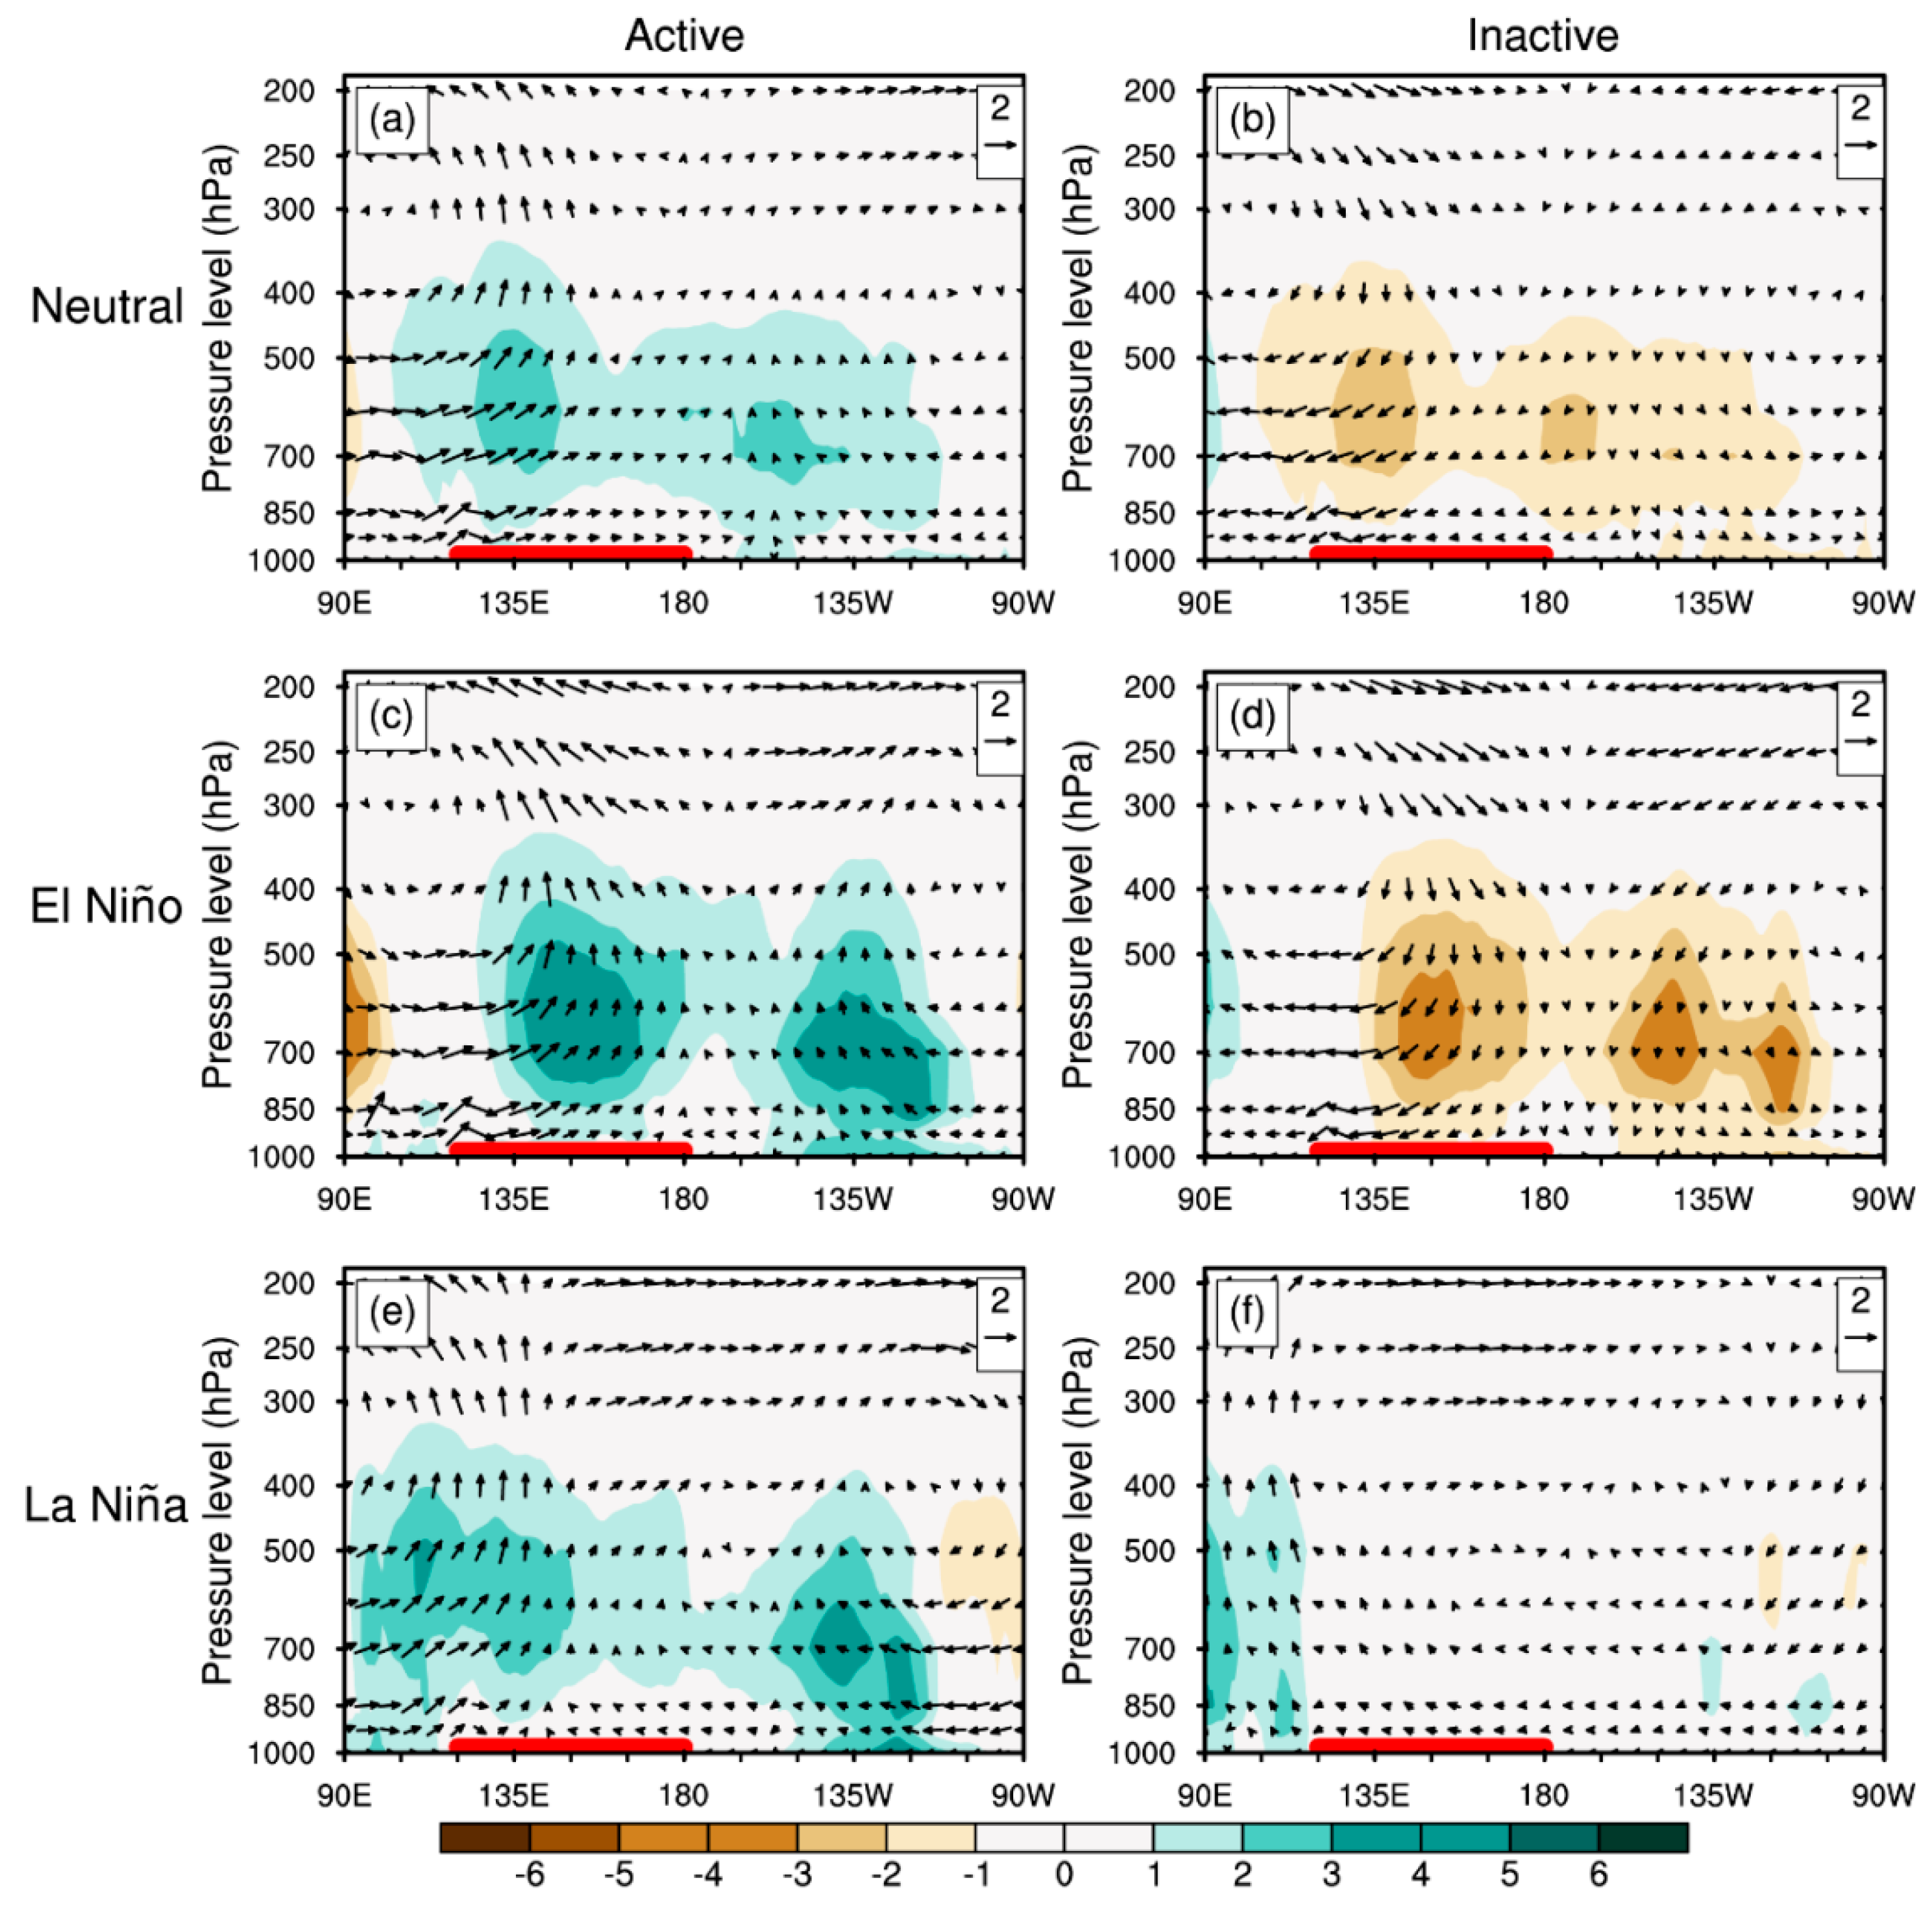
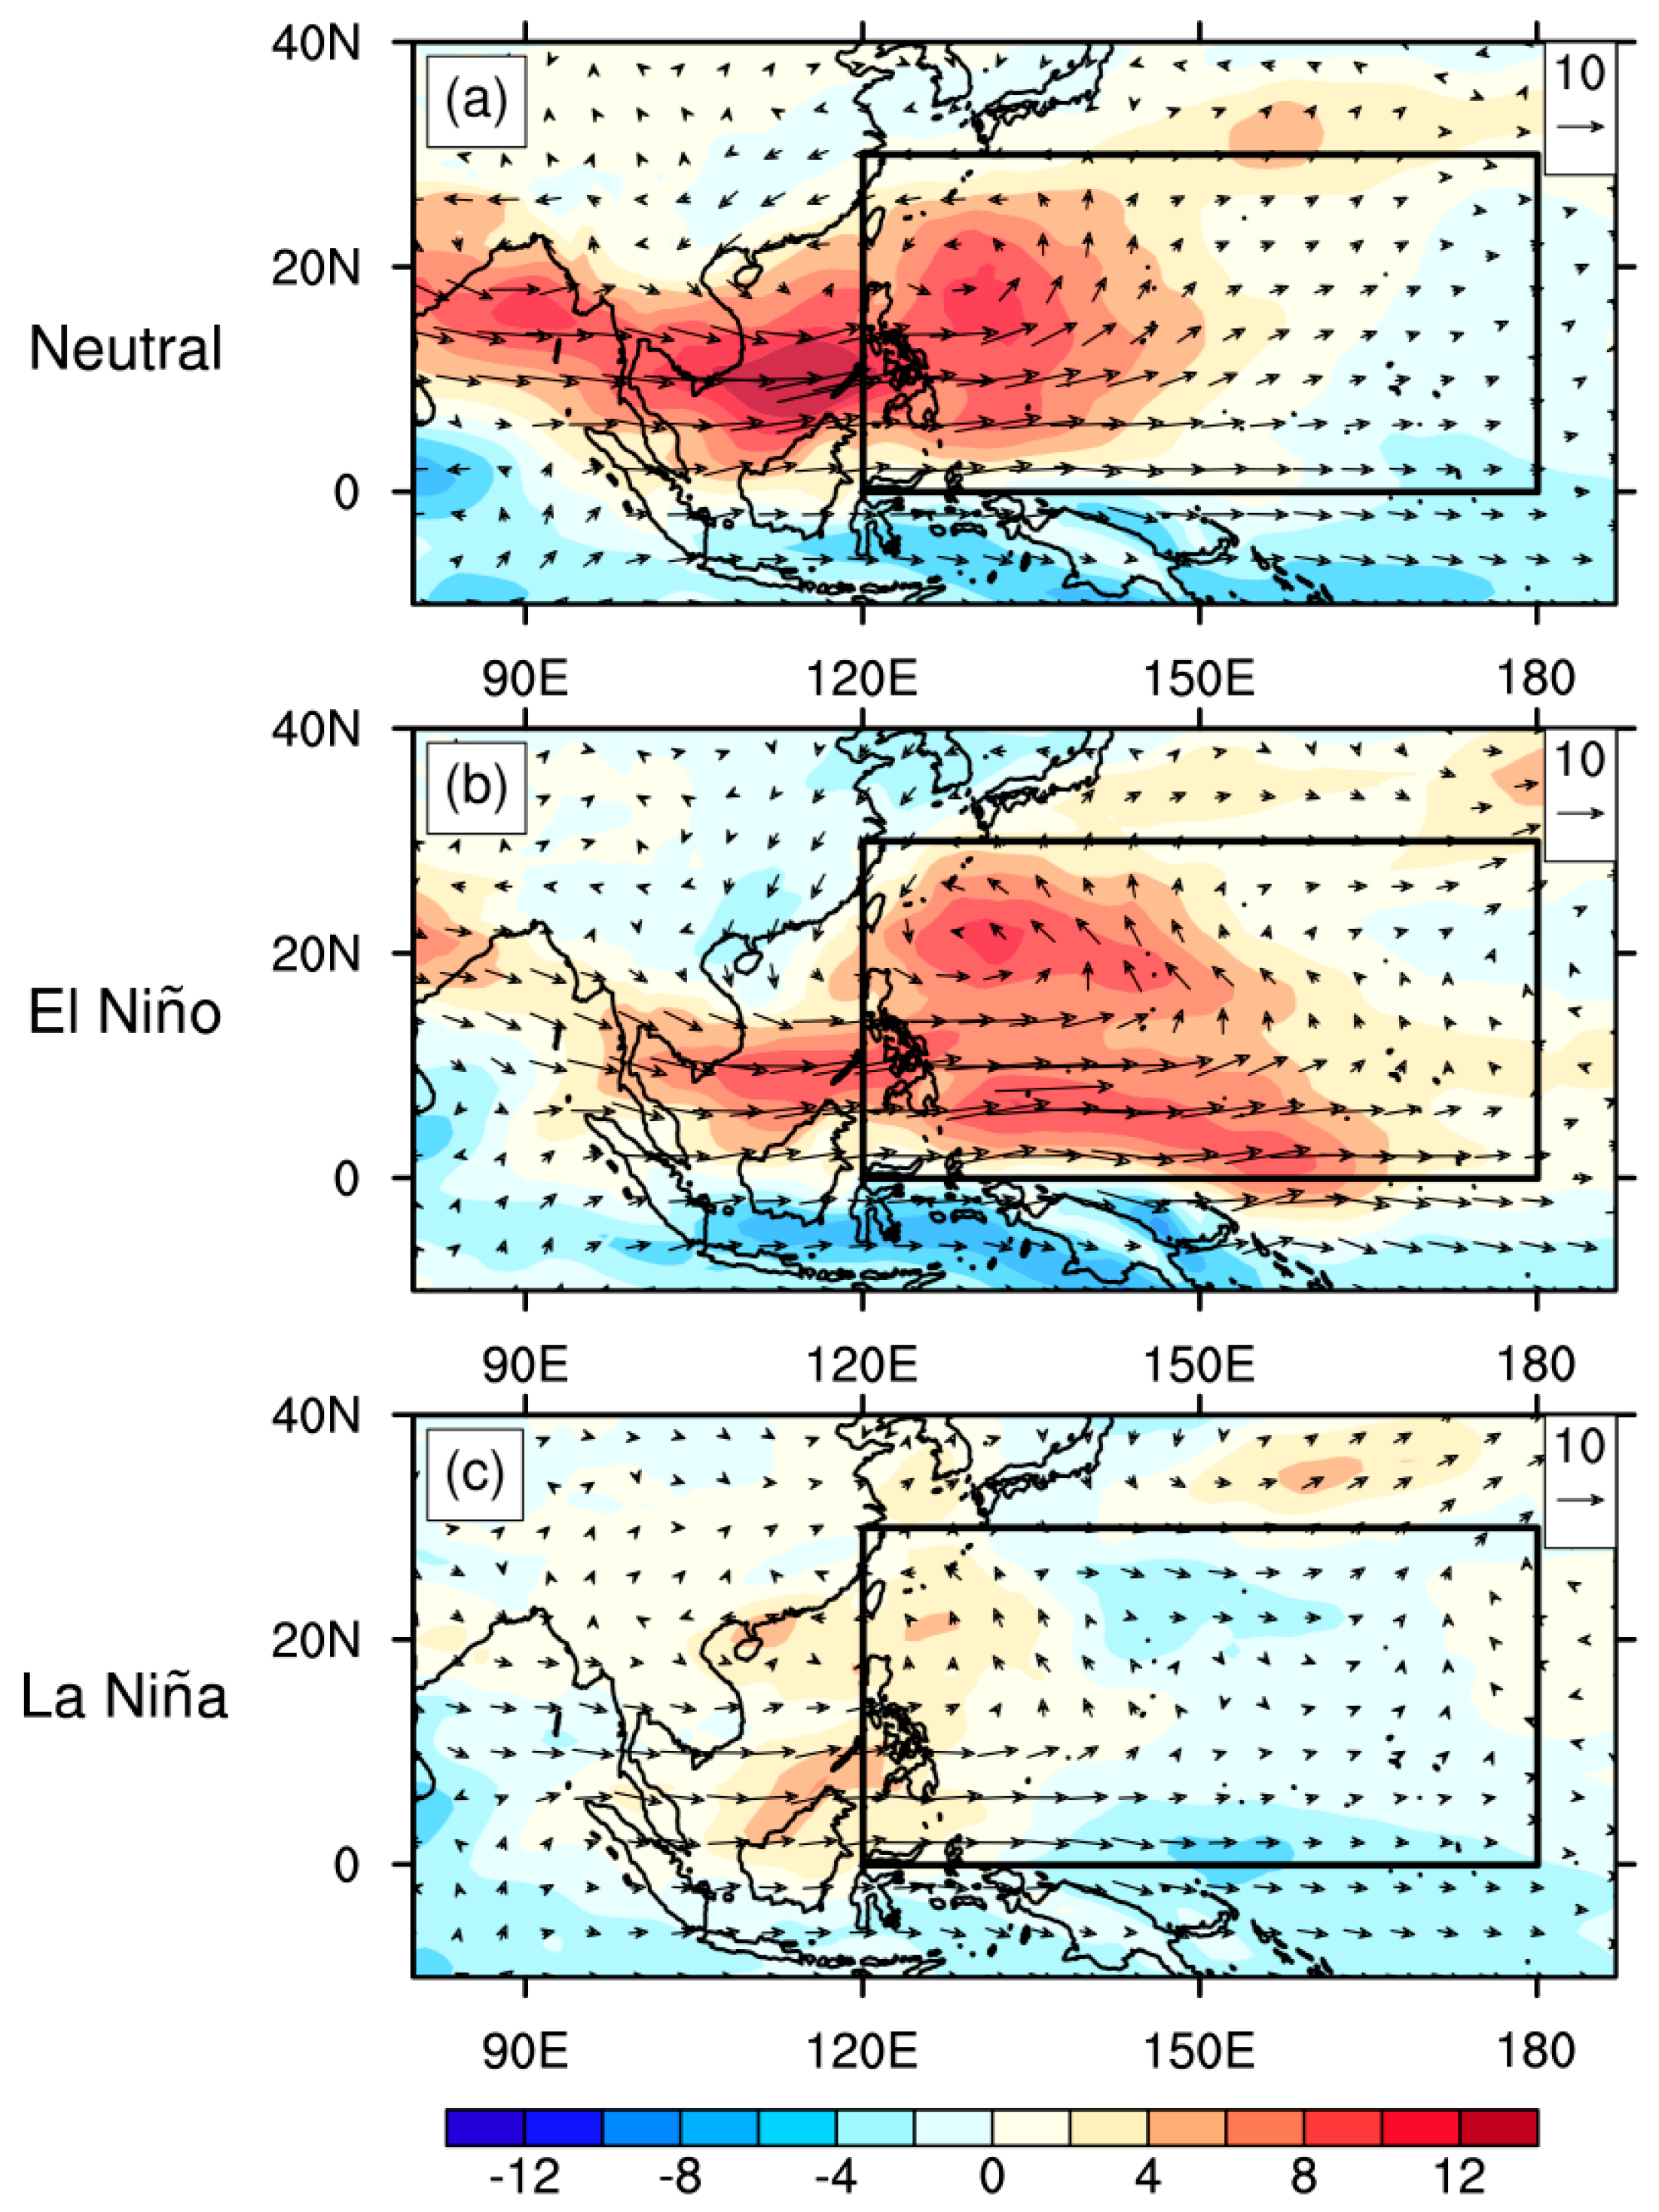
5.1. Environmental Factors for TC Genesis Considering MJO Modulation

As GPI can be applied to test the relative importance of thermodynamic and dynamic fields for TC genesis, we used it to further explore the possible mechanisms of TC genesis associated with the MJO modulation over the SCS and the WNP. A quantitative assessment of the relative contributions of each term to GPI anomaly changes between the active and inactive MJO phases over the two regions for different ENSO backgrounds is listed in Table 2 and Table 3 (detailed information on GPI and Terms 1 to 4 is in Section 2.2.5). The relative contribution of each term is defined as the percentage ratio of GPI anomalies induced by each term to the total GPI anomalies.
Over the SCS (Table 2), the factor that contributes the most to GPI anomalies in the El Niño years is the absolute vorticity (i.e., Term1: 68%); in neutral years, it is the midlevel relative humidity (i.e., Term2: 60%); and in the La Niña years it is also the midlevel relative humidity (65%). However, absolute vorticity still contributes 45% to GPI anomalies during neutral years, and 48% in the La Niña years. Over the WNP (Table 3), the midlevel relative humidity (−110%) has a weaker impact on GPI anomalies than vorticity (270%) in the La Niña years, however, the midlevel relative humidity plays a dominant role in the change of GPI anomalies during neutral years (127%) and the El Niño years (111%).
Also noted from Table 2, when considering the difference between the active and inactive MJO phases, the contributions of vertical wind shear (Term 4) and PI (Term3) are not comparable to contributions of Term1 and Term2 over the SCS in the La Niña years. By combing the information shown in Table 1 and Table 2, it can be inferred that the midlevel relative humidity plays a primary role, and absolute vorticity plays a secondary role, for the explanation of “strongest” MJO-TC genesis modulation (ESR = 9.2; Table 1) over the SCS in the La Niña years. By combing the information shown in Table 1 and Table 3, it can also be inferred that over the WNP, the dominant contributor to the “strongest” MJO-TC genesis modulation in the El Niño years (ESR = 2.82; Table 1) is the midlevel relative humidity, which is in agreement with the results of Camargo et al. [41,42], who indicated that the largest contribution to MJO-related GPI anomalies comes from the midlevel moisture field. In the following sections, we explore the main processes related to these parameters.

5.2. Environmental-Factor-Related Processes

To further understand the MJO-related modulation processes, composites of filtered anomalous 850 hPa relative vorticity and filtered anomalous of 600 hPa relative humidity during the inactive and active MJO phases are displayed in Figure 6 (for the SCS) and Figure 7 (for the WNP); these two figures only show values statistically significant at the 90% level. In the middle of the SCS, cyclonic relative vorticity anomalies and positive moisture anomalies occur during the active MJO phases (Figure 6a,c,e), and are conducive to TC genesis. The opposite situation appears in the inactive MJO phases (Figure 6b,d,f): Associated negative relative humidity and anticyclonic relative vorticity anomalies are unfavorable for TC genesis, resulting in fewer TCs forming over the SCS. In the active phases during the La Niña years, the whole SCS area is covered by positive relative humidity anomalies, and the peak value can reach 6% (Figure 6e). These features are weaker in neutral (Figure 6a) and El Niño years (Figure 6c). This suggests a stronger MJO modulation over the SCS during the La Niña years compared to that in neutral and the El Niño years, and this also matches very well with the previous statistical results that the MJO has stronger modulation of SCS TC genesis in the La Niña years (ESR = 9.2) than that in neutral years (ESR = 7.77) or the El Niño years (ESR = 4.09; Table 1). In addition, negative relative vorticity anomalies (with a peak value of −6 × 10⁻⁶ s−1) are significant in the central SCS during the inactive MJO phases in the La Niña years (Figure 6f) which, combined with the positive vorticity anomaly in the active MJO phases (Figure 6e), showed good agreement with the GPI analysis that low-level vorticity also contributes 48% (Table 2) to strong SCS TC genesis modulation during the La Niña years.
Similar moisture and vorticity patterns could be found over the WNP (Figure 7), especially during the El Niño years (Figure 7c,d). The magnitude of anomalous relative humidity peaks in the El Niño years (Figure 7c,d) are much larger than that in neutral years (Figure 7a,b), and the related positive (negative) anomaly center value could reach 6% (−4%), which indicates a stronger MJO modulation of WNP TC genesis during the El Niño years. Positive relative vorticity anomaly is also significant in the active MJO phases during the El Niño years, with a peak value of 4 × 10⁻⁶ s−1 (Figure 7c), and corresponding negative anomaly center value during the inactive MJO phases were up to −4 × 10⁻⁶ s−1 (Figure 7d). It appears that vorticity has a certain impact on modulating WNP TC genesis during the El Niño years, and makes less contribution (46% in Table 3) to such modulation when compared to the relative humidity (110% in Table 3). In addition, during the La Niña years, the anomalous negative relative humidity and vorticity were not remarkable in the inactive MJO phases (Figure 7f) when compared to that in neutral and El Niño years (Figure 7b,d), which indicates that TC genesis over the WNP in the La Niña years is not as sensitive to the MJO modulation. These findings confirm earlier results that the MJO-TC genesis modulation over the WNP is stronger during the El Niño years than in other years.

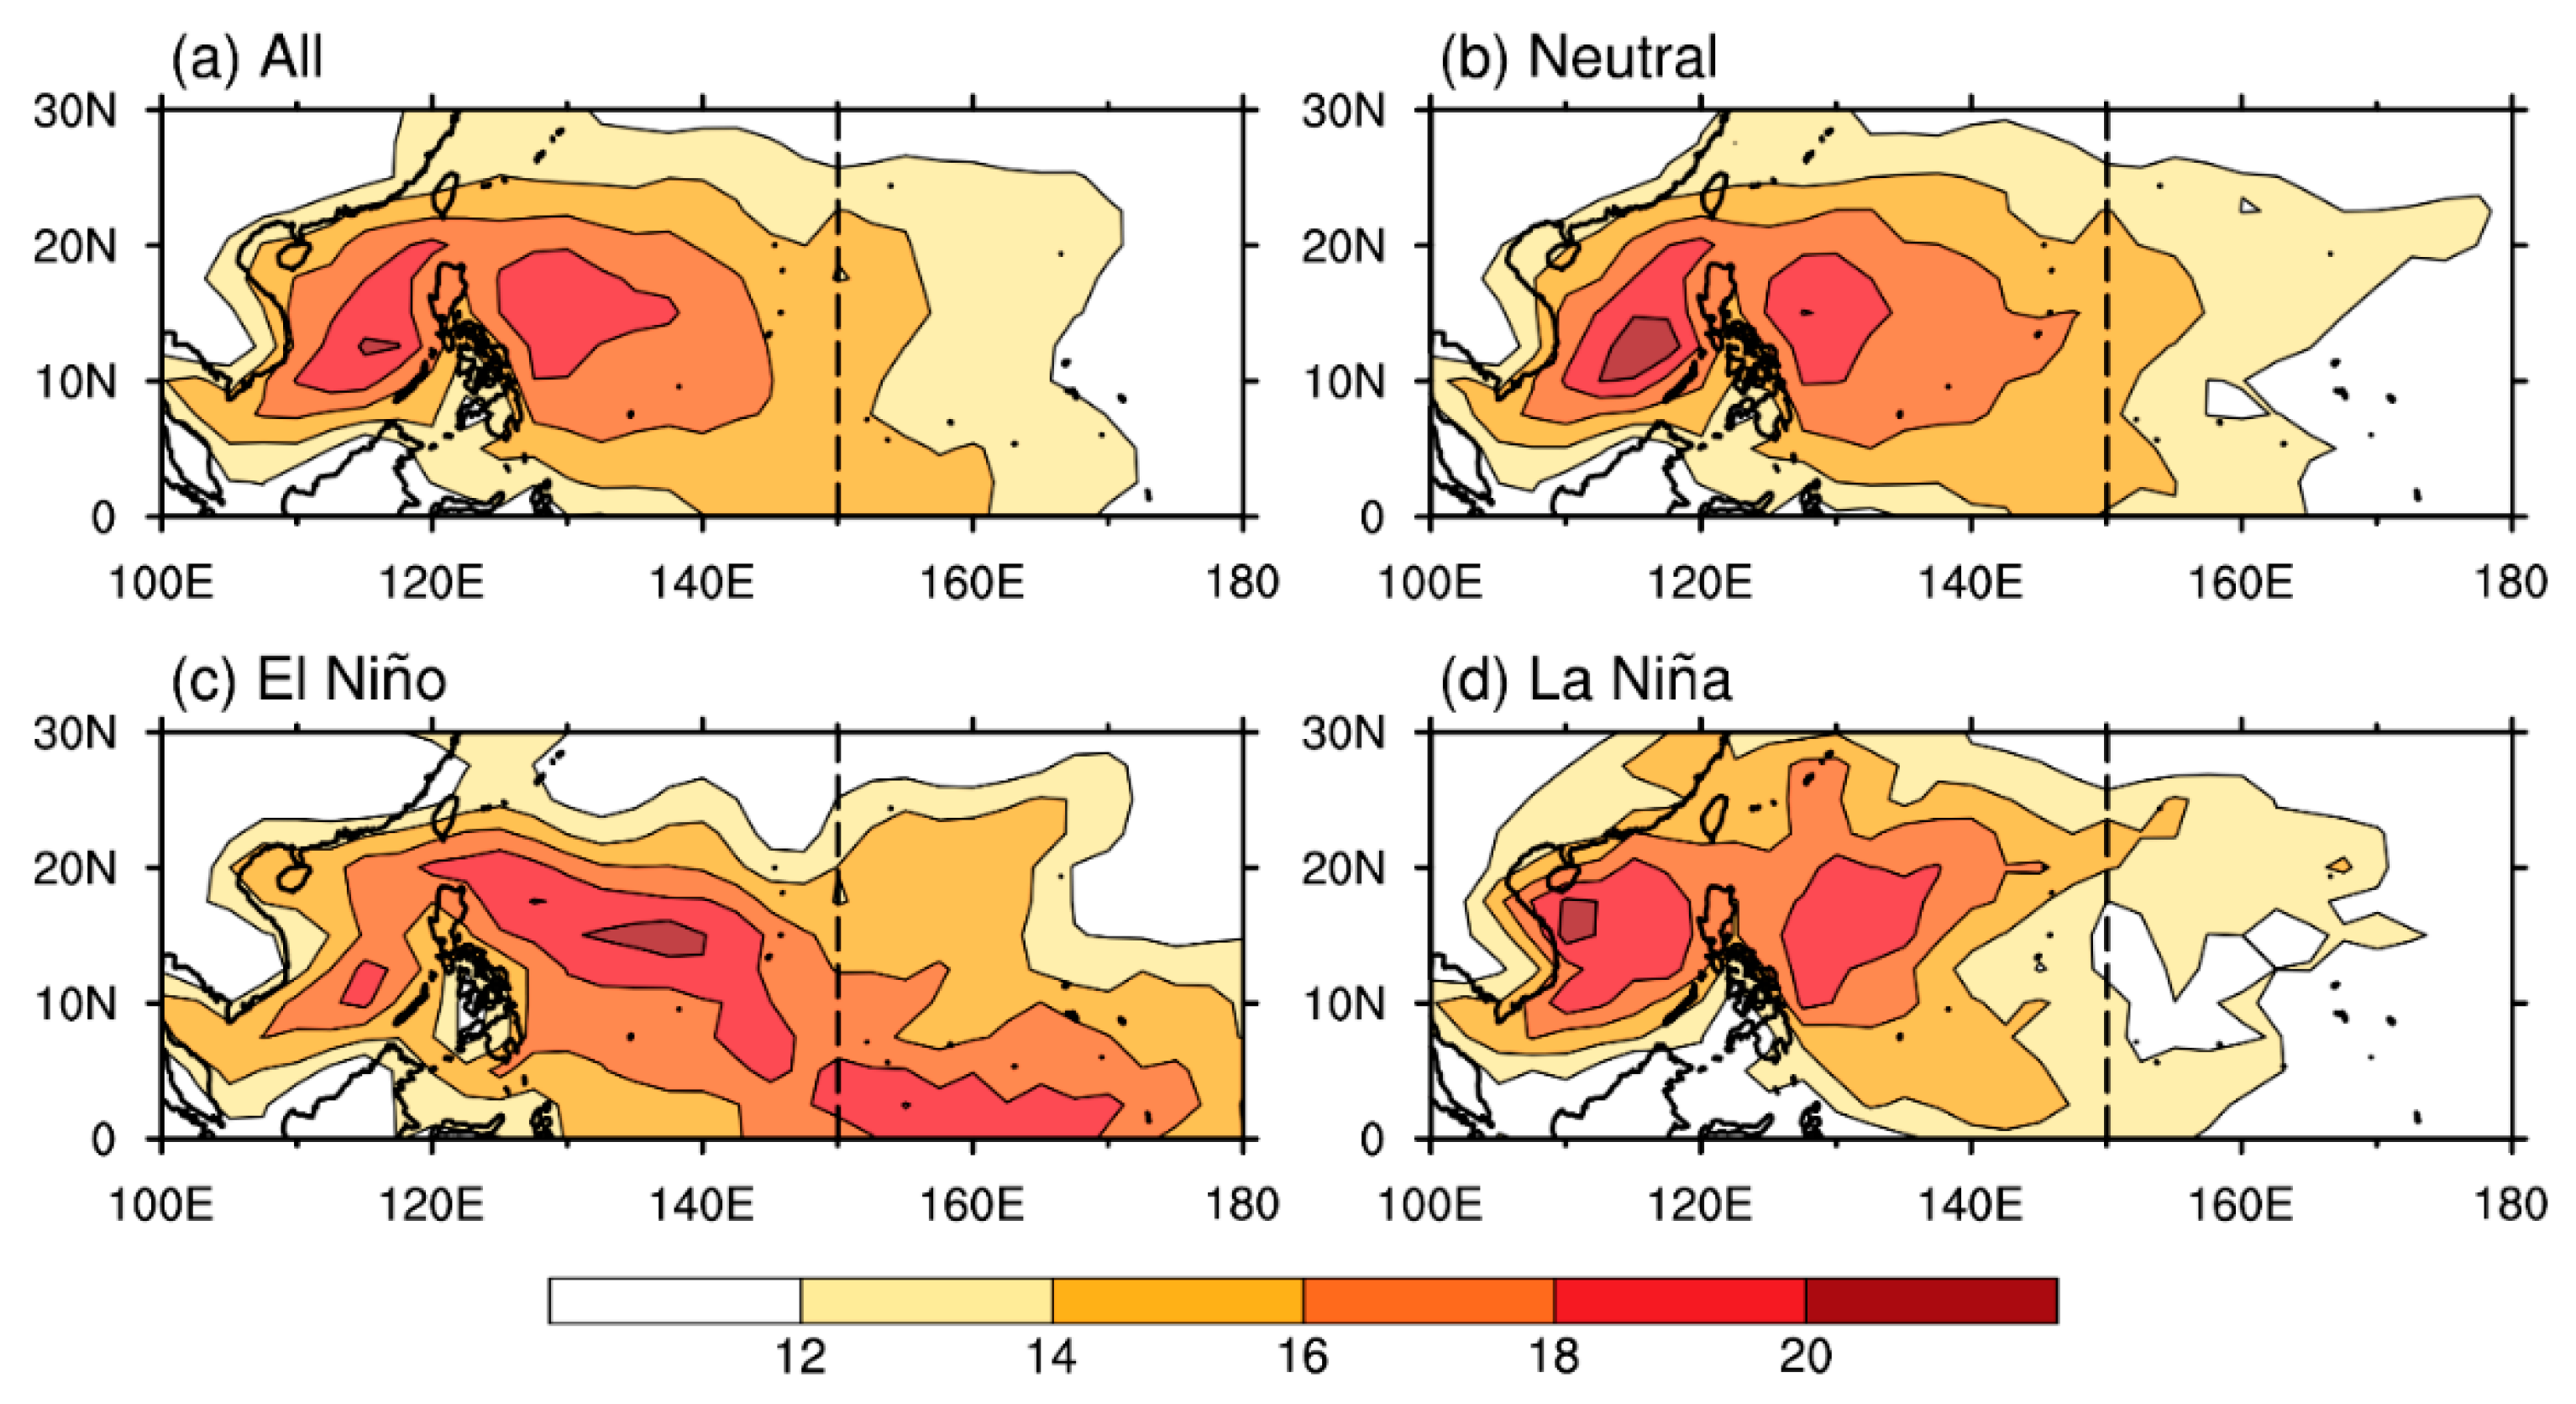
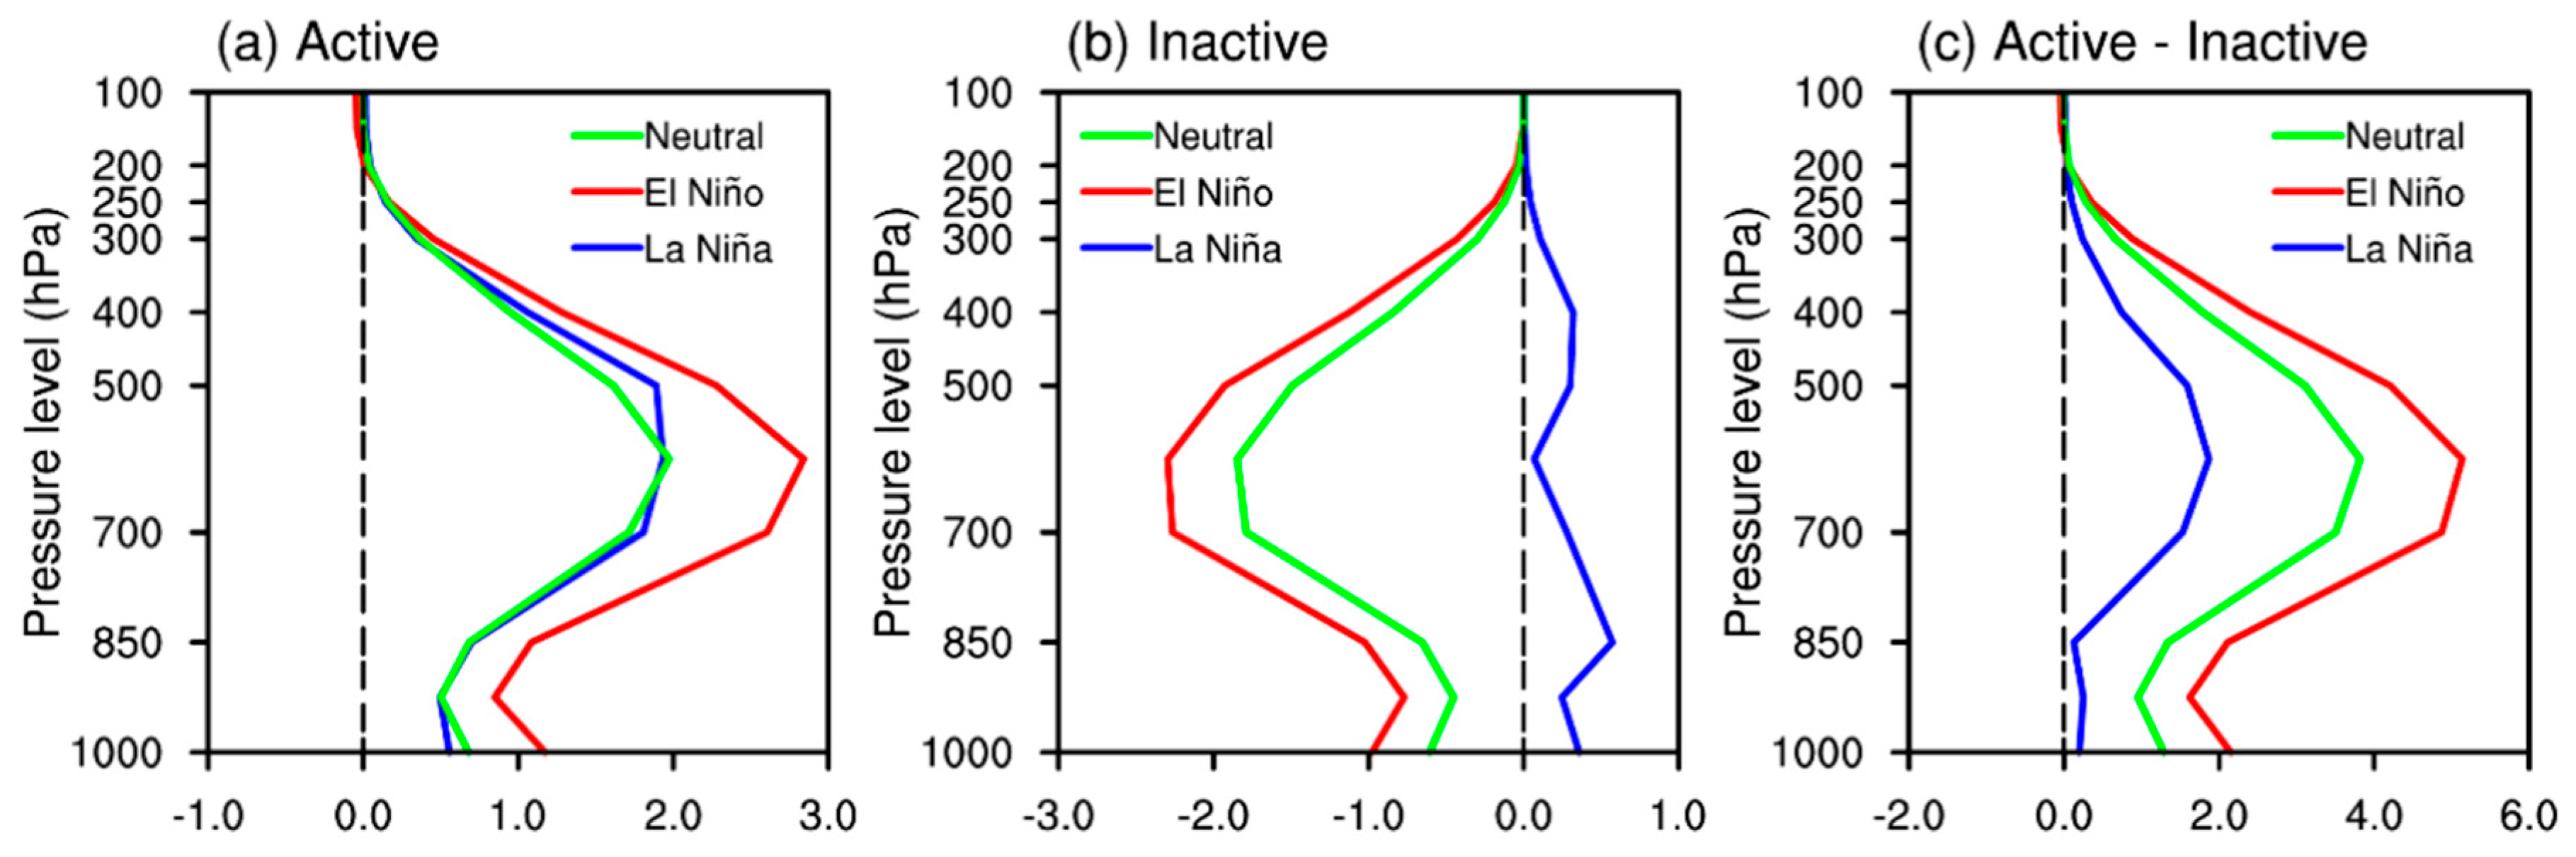
5.3. Primary Environmental Factor over the SCS and the WNP

5.3.1. SCS

To further explore the possible processes by which the MJO modulates SCS and WNP TC genesis through the primary factor, we examined and compared large-scale vertical circulations and moisture anomalies during the active and inactive MJO phases under different ENSO backgrounds. Considering that most SCS TC genesis occurs over the north-central SCS (around 10° N–20° N), the filtered vertical circulation anomaly, averaged over 10° N–20° N, is given in Figure 8; the shaded area is the related filtered moisture anomaly.
Over the SCS (thick red line in Figure 8), during neutral years, there is an anomalous ascending motion associated with a positive moisture anomaly centered at 500–700 hPa during the active MJO phases (Figure 8a), and a negative specific humidity anomaly center and a strong band of anomalous downward motion in the inactive MJO phases (Figure 8b). Such in-phase features are remarkable in the La Niña years (Figure 8e). The strongest anomalous upward (downward) vertical motion with positive (negative) moisture anomalies is clear over the SCS during the active (inactive) MJO phases (Figure 8e,f). This indicates a strong MJO-TC genesis modulation over the SCS in the La Niña years. During the El Niño years, the positive-moisture and upward-motion anomaly centers show an eastward shift from the SCS to 150° E during the active MJO phase (Figure 8c), which may be due to background warming related to the El Niño in the eastern equatorial Pacific, this result suggests that El Niño can disturb the MJO modulation of TC genesis over the SCS when compared to other ENSO conditions.
The region-averaged (10° N–20° N, 100° E–120° E) filtered specific humidity anomaly profiles over the SCS under different ENSO conditions are provided in Figure 9 to quantitatively describe the influence of the moisture field on the MJO-TC genesis modulation. All levels showed positive specific humidity anomalies in the active MJO phase during the La Niña years, and the maximal value could be as high as 0.35 g·kg−1 around 700 hPa, which is larger than in other years (Figure 9a). Meanwhile, all levels show negative moisture anomalies during the inactive MJO phases, and the peak values are in the middle troposphere (Figure 9b). Over the SCS, the evident difference in moisture anomalies between the active and inactive phases is between 700 and 500 hPa (Figure 9c), and the related peak value during the La Niña years (0.71 g·kg−1) is larger than that for neutral (0.61 g·kg−1) and the El Niño years (0.4 g·kg−1). This implies that MJO-related midlevel moisture may play an important role in strong TC genesis modulation in the La Niña years, which also agrees with midlevel moisture being the primary factor.
To find the source of midlevel moisture anomalies, the filtered water vapor flux anomaly difference between the active and inactive MJO phases vertically integrated between 1000 and 500 hPa is shown in Figure 10. Figure 10 is constructed following three steps: (1) the filtered water vapor flux is calculated by applying a 30- to 90-day Lanczos filter on the related daily anomaly data, (2) the active MJO phases days and inactive MJO phases days are selected to do the composites from the filtered water vapor flux data under different ENSO conditions (here, the selection of the active and inactive phases follows Table 1), and (3) the difference between the composites of the active and inactive MJO phases is constructed.
As noted from Figure 10, the differences in filtered water vapor flux anomalies between the active and inactive phases showed positive values over the SCS, which suggested that MJO-related moisture transport is stronger during the active phases than during the inactive phases. Over the SCS, there are strong southwesterly water vapor fluxes that lead to anomalous water vapor flux convergence over the northern SCS (around 15° N–20° N), especially in the La Niña years (Figure 10c). Perhaps this is due to the MJO-related Westerly Wind Burst (WWB) that carries more moisture from the Bay of Bengal (BoB), providing sufficient moisture for SCS TC genesis in the La Niña years during the active phases compared to the inactive phases. Consistent with features shown in Figure 10, one can also infer from Table 1 that MJO-TC genesis modulation over the SCS is stronger in the La Niña years (ESR = 9.2) than in the other years based on the fact that the larger the ESR, the larger the MJO-TC genesis modulation.

5.3.2. WNP

The filtered vertical circulations anomalies and moisture anomalies averaged over 5° N–20° N (most WNP TCs are formed in this latitudinal belt) for the WNP are shown in Figure 11; the selection of the active and inactive phases for the WNP under different ENSO backgrounds are listed in Table 1. Over the WNP (thick red line in Figure 11), general features in neutral years (Figure 11a,b) are similar to the SCS (Figure 8): There are anomalous upward (downward) motions and positive (negative) moisture anomalies during the active (inactive) MJO phases. Such an in-phase relationship is not obvious over the WNP in the La Niña years (Figure 11e,f): The moisture anomaly center in the active MJO phases is in the west of the WNP (Figure 11e), and this westward shift may be due to La Niña-related background cooling in the eastern equatorial Pacific. However, in the El Niño years (Figure 11c,d), the strong upward (downward) motion and positive (negative) moisture anomalies during the active (inactive) MJO phases suggest that the WNP has a stronger ascending (descending) motion and a wetter (dryer) middle-to-lower troposphere (from 500 to 850 hPa) compared with that in neutral and the La Niña years. This agrees with the results in Table 1 that there is a stronger WNP TC genesis modulation by the MJO in the El Niño years compared to other years.
Furthermore, region-averaged (5° N–20° N, 120° E–180) anomalous moisture in the midtroposphere during the active MJO phases is much larger in the El Niño years than in neutral and La Niña years, with a maximum near 600 hPa (Figure 12a). In contrast, during the inactive phase, the negative specific humidity anomaly in the El Niño years is smaller than that in neutral and La Niña years (Figure 12b). It is obvious that the difference in moisture between the active and inactive phases during the El Niño years is stronger than that during neutral and La Niña years, with the largest difference (0.52 g·kg−1) in the midtroposphere (700 to 500 hPa; Figure 12c). This agrees with GPI results (Table 3) that showed that midlevel moisture is the dominant factor in strong MJO modulation of WNP TC genesis during the El Niño years.
In addition, considering the moisture source for the midtroposphere, MJO-related westerly wind anomaly and water vapor transport also play important roles over the WNP. There is a strong westerly water vapor transport belt coming from the BoB and the SCS to the WNP (Figure 13), especially over the southeast quadrant of the WNP during the El Niño years (Figure 13b). This means that the WNP gets more water vapor in the active MJO phases compared to the inactive MJO phases in the El Niño years, which is favorable for WNP TC genesis in the active MJO phases during the El Niño years, particularly in the east of the WNP.
It should be mentioned that Mujumdar et al. [48] examined the low-level summer atmospheric circulation pattern and noted that the anticyclonic anomaly over the WNP during the La Niña years is stronger than the climatology. Similar to Mujumdar et al. [48], we do note that there is a strong anticyclonic anomaly over the WNP in both the composites of water vapor fluxes during the active and inactive MJO phases in the La Niña years (not shown). However, such a strong anticyclonic anomaly has been cancelled out when considering the difference between the active and inactive MJO phases, and thus there is no obvious patterns over the WNP in Figure 10c and Figure 13c. This might be one of the reasons to explain why the water vapor transports do not play a dominant role in affecting the MJO-related TC genesis in the La Niña years over the WNP.

6. Conclusions

This study investigated the MJO-TC genesis modulation over the SCS and the WNP under different ENSO conditions, and examined the relative contributions of various large-scale environmental factors associated with the MJO’s impact on TC genesis using the JTWC best-track data, the RMM index and ERA-Interim reanalysis data.
By analyzing DGR and the related ESR, we find that the MJO has a stronger modulation on TC genesis over the SCS during the La Niña years (ESR = 9.2) compared to neutral years (ESR = 7.77) and the El Niño years (ESR = 4.09). For the WNP, it is noted that a stronger MJO-TC genesis modulation occurs in the El Niño years (ESR = 2.82) compared with neutral years (ESR = 2.24) and the La Niña years (ESR = 2.29).
By analyzing GPI, we find that midlevel moisture is the primary factor and vorticity is the secondary contributor for explaining why the MJO-TC genesis modulation over the SCS is stronger during the La Niña years. It is noted that compared to the inactive MJO phases, southwesterly water vapor transport from the BoB is larger in the active MJO phases, which could promote more moisture gathering in the middle troposphere and favors TC genesis over the SCS during the La Niña years. In addition, the analysis of GPI also suggests that the midlevel moisture is the dominant factor for explaining why the strength of MJO modulation on WNP TC genesis is larger during the El Niño years. Compared to the inactive MJO phases, westerly vapor transport from the BoB and the SCS to the WNP is noted to be stronger in the active MJO-TC genesis modulation phases over the WNP during the El Niño years.
Our finding about the major contributor of the MJO-TC genesis modulation has a potential application on the improvement of the TC forecast over the SCS and the WNP. However, while this paper has obtained some meaningful results, further research is still needed, such as using the Sub-seasonal to Seasonal (S2S) predication project models to discuss the MJO modulation of TC genesis under different ENSO backgrounds. Also, this study has not compared whether the MJO’s impact or the ENSO’s impact on TC genesis is more important over the two analyzed regions. However, one might find from Figure 8 that specific humidity and vertical wind over the SCS are more strongly associated with MJO fluctuations than ENSO fluctuations. For example, irrespective of the ENSO conditions, specific humidity is anomalously positive (negative) along most of the atmospheric column during the active (inactive) MJO phases. The direction of vertical wind anomalies also does not change considerably with changes in ENSO conditions. More detailed analyses are required to compare the contributions of ENSO and the MJO on TC genesis; this is suggested as the future work.

Author Contributions

Conceptualization, L.D.; investigation, C.Y. and L.D.; data curation, C.Y.; writing—original-draft preparation, C.Y.; writing—review and editing, L.D., W.-R.H., J.C., and C.Y. All authors have read and agreed to the published version of the manuscript.

Funding

This study was funded by the National Natural Science Foundation of China (grants no. 41875071 and 41705118), the Yangfan Talent Project of Guangdong Province (grant no. 000001005), and a Doctoral Fund of Guangdong Ocean University (grant no. R17002). W.-R. Huang was supported by the Ministry of Science and Technology of Taiwan under MOST 106-2628-M-003-001-MY4 and MOST 108-2625-M-003-004.

Acknowledgments

The TC dataset used in this paper can be downloaded from http://www.usno.navy.mil/NOOC/nmfc-ph/RSS/jtwc/best_tracks/. We thank Prof. Kerry Emanuel for providing his code of calculating potential intensity (available at ftp://texmex.mit.edu/pub/emanuel/TCMAX/). In this study, ERA-Interim reanalysis data were obtained from https://apps.ecmwf.int/datasets/data/interim-full-daily/.

Conflicts of Interest

The authors declare no conflicts of interest.

References

  1. Zhu, Q.; Lin, J.; Shou, S. Synoptic Meteorology Principles and Methods, 3rd ed.; China Meteorology Press: Beijing, China, 2000; pp. 154–196. [Google Scholar]
  2. Chan, J.C. Interannual and interdecadal variations of tropical cyclone activity over the western North Pacific. Meteorol. Atmos. Phys. 2005, 89, 143–152. [Google Scholar] [CrossRef]
  3. Neumann, C.J. Global Overview: Global Guide to Tropical Cyclone Forecasting; World Meteorological Organization Rep: Geneva, Switzerland, 1993. [Google Scholar]
  4. Zhang, Q.; Wu, L.; Liu, Q. Tropical cyclone damages in China: 1983–2006. Bull. Am. Meteorol. Soc. 2009, 90, 489–495. [Google Scholar] [CrossRef] [Green Version]
  5. Chan, J.C. Tropical cyclone activity in the northwest Pacific in relation to the El Niño/Southern Oscillation phenomenon. Mon. Weather Rev. 1985, 113, 599–606. [Google Scholar] [CrossRef]
  6. Chan, J.C. Tropical cyclone activity over the western North Pacific associated with El Niño and La Niña events. J. Clim. 2000, 13, 2960–2972. [Google Scholar] [CrossRef]
  7. Wang, B.; Chan, J.C. How strong ENSO events affect tropical storm activity over the western North Pacific. J. Clim. 2002, 15, 1643–1658. [Google Scholar] [CrossRef]
  8. Huang, P.; Chou, C.; Huang, R. Seasonal modulation of tropical intraseasonal oscillations on tropical cyclone geneses in the western North Pacific. J. Clim. 2011, 24, 6339–6352. [Google Scholar] [CrossRef]
  9. Wang, C.; Li, C.; Mu, M.; Duan, W. Seasonal modulations of different impacts of two types of ENSO events on tropical cyclone activity in the western North Pacific. Clim. Dyn. 2013, 40, 2887–2902. [Google Scholar] [CrossRef]
  10. Cao, X.; Wu, R.; Bi, M. Contributions of Different Time-Scale Variations to Tropical Cyclogenesis over the Western North Pacific. J. Clim. 2018, 31, 3137–3153. [Google Scholar] [CrossRef]
  11. Zhao, J.; Zhan, R.; Wang, Y.; Xu, H. Contribution of the Interdecadal Pacific Oscillation to the Recent Abrupt Decrease in Tropical Cyclone Genesis Frequency over the Western North Pacific since 1998. J. Clim. 2018, 31, 8211–8224. [Google Scholar] [CrossRef]
  12. Li, R.C.; Zhou, W. Modulation of Western North Pacific Tropical Cyclone Activity by the ISO. Part I: Genesis and Intensity. J. Clim. 2013, 26, 2904–2918. [Google Scholar] [CrossRef]
  13. Crosbie, E.; Serra, Y. Intraseasonal Modulation of Synoptic-Scale Disturbances and Tropical Cyclone Genesis in the Eastern North Pacific. J. Clim. 2014, 27, 5724–5745. [Google Scholar] [CrossRef]
  14. Zhao, H.; Yoshida, R.; Raga, G.B. Impact of the Madden–Julian Oscillation on Western North Pacific Tropical Cyclogenesis Associated with Large-Scale Patterns. J. Appl. Meteorol. Climatol. 2015, 54, 1413–1429. [Google Scholar] [CrossRef]
  15. Wang, Q.; Li, J.; Li, Y.; Zhang, J.; Zheng, J. Modulation of Tropical Cyclogenesis Location and Frequency over the Indo-Western North Pacific by the Intraseasonal Indo-Western Pacific Convection Oscillation during the Boreal Extended Summer. J. Clim. 2018, 31, 1435–1450. [Google Scholar] [CrossRef]
  16. Chen, J.; Wu, C.; Chung, P.; Sui, C. Influence of Intraseasonal–Interannual Oscillations on Tropical Cyclone Genesis in the Western North Pacific. J. Clim. 2018, 31, 4949–4961. [Google Scholar] [CrossRef]
  17. Madden, R.A.; Julian, P.R. Description of Global-Scale Circulation Cells in the Tropics with a 40–50 Day Period. J. Atmos. Sci. 1972, 29, 1109–1123. [Google Scholar] [CrossRef]
  18. Deng, L.; Wu, X. Physical mechanisms for the maintenance of GCM-simulated Madden–Julian oscillation over the Indian Ocean and Pacific. J. Clim. 2011, 24, 2469–2482. [Google Scholar] [CrossRef]
  19. Huang, W.; Chang, Y. Impact of boreal summer intra-seasonal oscillations on warm season diurnal convection activity in Taiwan. Int. J. Climatol. 2018, 38, 2187–2200. [Google Scholar] [CrossRef] [Green Version]
  20. Weickmann, K.M.; Lussky, G.R.; Kutzbach, J.E. Intraseasonal (30–60 day) fluctuations of outgoing longwave radiation and 250 mb stream function during northern winter. Mon. Weather Rev. 1985, 113, 941–961. [Google Scholar] [CrossRef] [Green Version]
  21. Knutson, T.R.; Weickmann, K.M.; Kutzbach, J.E. Global-scale intraseasonal oscillations of outgoing longwave radiation and 250 mb zonal wind during Northern Hemisphere summer. Mon. Weather Rev. 1986, 114, 605–623. [Google Scholar] [CrossRef] [Green Version]
  22. Knutson, T.R.; Weickmann, K.M. 30–60 day atmospheric oscillations: Composite life cycles of convection and circulation anomalies. Mon. Weather Rev. 1987, 115, 1407–1436. [Google Scholar] [CrossRef]
  23. Deng, L.; Wu, X. Effects of convective processes on GCM simulations of the Madden–Julian oscillation. J. Clim. 2010, 23, 352–377. [Google Scholar] [CrossRef]
  24. Deng, L.; McFarlane, S.A.; Flaherty, J.E. Characteristics Associated with the Madden–Julian Oscillation at Manus Island. J. Clim. 2013, 26, 3342–3356. [Google Scholar] [CrossRef]
  25. Zhang, C. Madden-Julian Oscillation. Rev. Geophys. 2005, 43, RG2003. [Google Scholar] [CrossRef] [Green Version]
  26. Gray, W.M. Hurricanes: Their formation, structure and likely role in the tropical circulation. In Meteorology over the Tropical Oceans; Shaw, D.B., Ed.; Royal Meteorological Society: Bracknell, UK, 1979; pp. 155–218. [Google Scholar]
  27. Sobel, A.H.; Maloney, E.D. Effect of ENSO events affect tropical storm activity over the Western North Pacific. Geophys. Res. Lett. 2000, 27, 1739–1742. [Google Scholar] [CrossRef] [Green Version]
  28. Zhao, C.; Li, T. Basin dependence of the MJO modulating tropical cyclone genesis. Clim. Dyn. 2019, 52, 6081–6096. [Google Scholar] [CrossRef]
  29. Ling, Z.; Wang, Y.; Wang, G. Impact of Intraseasonal Oscillations on the Activity of Tropical Cyclones in Summer over the South China Sea. Part I: Local Tropical Cyclones. J. Clim. 2016, 29, 855–868. [Google Scholar] [CrossRef]
  30. Hall, J.D.; Matthews, A.J.; Karoly, D.J. The modulation of tropical cyclone activity in the Australian region by the Madden–Julian oscillation. Mon. Weather Rev. 2001, 129, 2970–2982. [Google Scholar] [CrossRef]
  31. Klotzbach, P.J.; Oliver, E.C. Modulation of Atlantic Basin Tropical Cyclone Activity by the Madden–Julian Oscillation (MJO) from 1905 to 2011. J. Clim. 2015, 28, 204–217. [Google Scholar] [CrossRef] [Green Version]
  32. Li, R.C.; Zhou, W.; Chan, J.C.; Huang, P. Asymmetric Modulation of Western North Pacific central by the Madden–Julian Oscillation under ENSO Conditions. J. Clim. 2012, 25, 5374–5385. [Google Scholar] [CrossRef]
  33. Dee, D.P.; Uppala, S.M.; Simmons, A.J.; Berrisford, P.; Poli, P.; Kobayashi, S.; Bechtold, P. The ERA-Interim reanalysis: Configuration and performance of the data assimilation system. Q. J. R. Meteorol. Soc. 2011, 137, 553–597. [Google Scholar] [CrossRef]
  34. Liebmann, B.; Smith, C.A. Description of a complete (interpolated) outgoing longwave radiation dataset. Bull. Am. Meteorol. Soc. 1996, 77, 1275–1277. [Google Scholar] [CrossRef] [Green Version]
  35. Wheeler, M.; Hendon, H.H. An all-season real-time multivariate MJO index: Development of the index for monitoring and prediction in Australia. Mon. Weather Rev. 2004, 132, 1917–1932. [Google Scholar] [CrossRef]
  36. Lanczos, C. Applied Analysis; Prentice-Hall: Upper Saddle River, NJ, USA, 1956; p. 539. [Google Scholar]
  37. Arguez, A.; Inamdar, A.; Palecki, M.A.; Schreck, C.J.; Young, A.H. ENSO Normals: A New U.S. Climate Normals Product Conditioned by ENSO Phase and Intensity and Accounting for Secular Trends. J. Appl. Meteorol. Climatol. 2019, 58, 1381–1397. [Google Scholar] [CrossRef]
  38. Kim, J.H.; Ho, C.H.; Kim, H.S.; Sui, C.H.; Park, S.K. Systematic Variation of Summertime Tropical Cyclone Activity in the Western North Pacific in Relation to the Madden–Julian Oscillation. J. Clim. 2008, 21, 1171–1191. [Google Scholar] [CrossRef]
  39. Wilks, D.S. Statistical Methods in the Atmospheric Sciences, 1st ed.; Academic Press: Cambridge, MA, USA, 1995; p. 467. [Google Scholar]
  40. Camargo, S.J.; Robertson, A.W.; Gaffney, S.J.; Smyth, P.; Ghil, M. Cluster Analysis of Typhoon Tracks. Part I: General Properties. J. Clim. 2007, 20, 3654–3676. [Google Scholar] [CrossRef]
  41. Camargo, S.J.; Emanuel, K.A.; Sobel, A.H. Use of a Genesis Potential Index to Diagnose ENSO Effects on Tropical Cyclone Genesis. J. Clim. 2007, 20, 4819–4834. [Google Scholar] [CrossRef]
  42. Camargo, S.J.; Wheeler, M.C.; Sobel, A.H. Diagnosis of the MJO Modulation of Tropical Cyclogenesis Using an Empirical Index. J. Atmos. Sci. 2009, 66, 3061–3074. [Google Scholar] [CrossRef]
  43. Emanuel, K.A.; Norlan, D.S. Tropical cyclone activity and global climate. In Proceedings of the 26th Conference on Hurricanes and Tropical Meteorology, Miami, FL, USA, 2–7 May 2004. [Google Scholar]
  44. Emanuel, K.A. Sensitivity of tropical cyclones to surface exchange coefficients and a revised steady-state model incorporating eye dynamics. J. Atmos. Sci. 1995, 52, 3969–3976. [Google Scholar] [CrossRef] [Green Version]
  45. Li, Z.; Yu, W.; Li, T.; Murty, V.S.; Tangang, F. Bimodal character of cyclone climatology in the Bay of Bengal modulated by monsoon seasonal cycle. J. Clim. 2013, 26, 1033–1046. [Google Scholar] [CrossRef]
  46. Chen, T.; Tsay, T.; Yen, M.; Cayanan, E.O. Formation of the Philippine Twin Tropical Cyclones during the 2008 Summer Monsoon Onset. Weather Forecast. 2010, 25, 1317–1341. [Google Scholar] [CrossRef]
  47. Wu, L.; Wen, Z.; Huang, R.; Wu, R. Possible Linkage between the Monsoon Trough Variability and the Tropical Cyclone Activity over the Western North Pacific. Mon. Weather Rev. 2012, 140, 140–150. [Google Scholar] [CrossRef]
  48. Mujumdar, M.B.; Preethi, T.P.; Sabin, K.; Ashok, S.; Saeed, D.S.; Pai, K.R. The Asian summer monsoon response to the La Nina event of 2010. Meteorol. Appl. 2012, 19, 216–225. [Google Scholar] [CrossRef]
Figure 1. The locations of the Bay of Bengal, Vietnam, China, the South China Sea (SCS), Luzon Island, Philippines and the Western North Pacific (WNP). Blue box, the SCS area; green box, the WNP area.
Atmosphere 11 00183 g001
Figure 2. Average frequency of tropical cyclone (TC) genesis (shaded; units: average number per year) and average sea surface temperature (SST) anomaly (contours; interval, 0.05 °C) during June–November season over the period of 1979–2016. (a) All years (contours are sea surface temperature (SST)); (b) neutral years; (c) the El Niño years; (d) the La Niña years. Blue box, the South China Sea (SCS) area; green box, the Western North Pacific (WNP) area. Only SST anomalies values that exceeded a 90% confidence level are plotted.
Atmosphere 11 00183 g002
Figure 3. Composites of 850 hPa streamline during the TC season (June–November) for 1979–2016: (a) all years, (b) neutral years, (c) the El Niño years, and (d) the La Niña years. TC genesis locations are denoted by filled blue circles. The streamlines show the whole picture of the atmosphere circulation (no statistical significance test was applied), while the wind vectors show the areas where wind anomalies are statistically significant at the 90% confidence level. The unit of the wind vectors is m·s−1.
Atmosphere 11 00183 g003
Figure 4. Composites of seasonal-mean Madden–Julian Oscillation (MJO) activity represented by the root mean square (RMS) value of filtered outgoing longwave radiation (OLR) anomalies (unit: W·m−2) for (a) all years, (b) neutral years, (c) the El Niño years, and (d) the La Niña years during the TC season (June–November) over the period of 1979–2016.
Atmosphere 11 00183 g004
Figure 5. Daily genesis rate (DGR; unit: %) in each MJO phase for all years (All), neutral years (Ne), the El Niño years (El), and the La Niña years (La) over the (a) SCS and the (b) WNP during June–November over the period of 1979–2016. The phases in which TC numbers were statistically enhanced (suppressed) at the 90% significance level are indicated by + (×).
Atmosphere 11 00183 g005
Figure 6. Composite of filtered 600 hPa relative humidity anomalies (shaded; unit: %) and filtered 850 hPa relative vorticity anomalies (contours; unit: 10−6 s−1) during the (a,c,e) active and (b,d,f) inactive MJO phases for neutral years (top panels), the El Niño years (middle panels), and the La Niña years (bottom panels) over the SCS during June–November over the period of 1979–2016. Dashed (solid) contours, negative (positive) filtered anomalies of relative vorticity (interval 2 × 10⁻⁶ s−1). Only values that exceeded the 90% confidence level are plotted. The definition of the active and inactive phases for the MJO-related TC genesis over the SCS under different ENSO conditions is in Table 1.
Atmosphere 11 00183 g006
Figure 7. Composite of filtered 600 hPa relative humidity anomalies (shaded; unit: %) and filtered 850 hPa relative vorticity anomalies (contours; unit: 10−6 s−1) during the (a,c,e) active and (b,d,f) inactive MJO phases for neutral years (top panels), the El Niño years (middle panels), and the La Niña years (bottom panels) over the WNP during June–November over the period of 1979–2016. Dashed (solid) contours, negative (positive) filtered anomalies of relative vorticity (interval 2 × 10⁻⁶ s−1). Only values that exceeded the 90% confidence level are plotted. The definition of the active and inactive phases for the MJO-related WNP TC genesis under different ENSO conditions is in Table 1.
Atmosphere 11 00183 g007
Figure 8. Composite longitude-height section of filtered wind anomalies (vectors; unit: m·s−1) and filtered specific humidity anomalies (shaded; unit: 10−1 g·kg−1) averaged over 10° N–20° N in the (left) active and (right) inactive MJO phases for (a,b) neutral, (c,d) the El Niño, and (e,f) the La Niña years during June–November over the period of 1979–2016. Thick red line on abscissas is the SCS location. The definition of the active and inactive phases for the MJO-related SCS TC genesis under different ENSO conditions is in Table 1.
Atmosphere 11 00183 g008
Figure 9. Composite vertical profiles of region-averaged filtered specific humidity anomaly (unit: 10−1 g·kg−1) during the (a) active and (b) inactive MJO phases; (c) differences between phases in neutral years (green), the El Niño years (red), and the La Niña years (blue) over the SCS during June–November over the period of 1979–2016. The definition of the active and inactive phases for the MJO-related SCS TC genesis under different ENSO conditions is in Table 1.
Atmosphere 11 00183 g009
Figure 10. Differences between the composites of filtered water vapor flux anomaly vertically integrated from 1000 to 500 hPa (vectors; unit: kg·m−1·s−1) for the active and inactive MJO phases over the SCS during June–November over the period of 1979–2016, overlaid with the related magnitude of filtered water vapor flux anomaly (shaded; unit: kg·m−1·s−1) in (a) neutral years, (b) the El Niño years, and (c) the La Niña years. The definition of the active and inactive phases for the MJO-related SCS TC genesis under different ENSO conditions is in Table 1.
Atmosphere 11 00183 g010
Figure 11. Composite longitude-height section of filtered wind anomalies (vectors; unit: m·s−1) and filtered specific humidity anomalies (shaded; unit: 10−1 g·kg−1) averaged over 5° N–20° N in the (left) active and (right) inactive MJO phases for (a,b) neutral, (c,d) the El Niño, and (e,f) the La Niña years during June–November over the period of 1979–2016. Thick red line on abscissas, the WNP location. The definition of the active and inactive phases for the MJO-related WNP TC genesis under different ENSO conditions is in Table 1.
Atmosphere 11 00183 g011
Figure 12. Composite vertical profiles of region-averaged filtered specific humidity anomalies (unit: 10−1 g·kg−1) during the (a) active and (b) inactive MJO phases; (c) differences between phases in neutral years (green), the El Niño years (red), and the La Niña years (blue) over the WNP during June–November over the period of 1979–2016. The definition of the active and inactive phases for the MJO-related WNP TC genesis under different ENSO conditions is in Table 1.
Atmosphere 11 00183 g012
Figure 13. Differences between the composites of filtered water vapor flux anomaly vertically integrated from 1000 to 500 hPa (vectors; unit: kg·m−1·s−1) for the active and inactive MJO phases over the WNP during June–November over the period of 1979–2016, overlaid with the related magnitude of filtered water vapor flux anomaly (shaded; unit: kg·m−1·s−1) in (a) neutral years, (b) the El Niño years, and (c) the La Niña years. The definition of the active and inactive phases for the MJO-related WNP TC genesis under different ENSO conditions is in Table 1.
Atmosphere 11 00183 g013
Table 1. Daily genesis rate (DGR) of tropical cyclone (TC) genesis during the active and inactive Madden–Julian Oscillation (MJO) phases, and related enhancement-to-suppression ratio (ESR) over the South China Sea (SCS) and Western North Pacific (WNP) for different El Niño-Southern Oscillation (ENSO) conditions during June–November over the period of 1979–2016.
SCSNeutralEl NiñoLa Niña
Active phases5 + 6 (3.68% *)5 + 6 (1.90%)4 + 5 (5.11% *)
Inactive phases8 + 1 (0.47% *)8 + 1 (0.46%)8 + 1 + 2 (0.56% *)
ESR (active/inactive)7.774.099.2
WNPNeutralEl NiñoLa Niña
Active phases6 + 7 (16.45% *)6 + 7 (14.92% *)5 + 6 (14.22% *)
Inactive phases2 + 3 (7.35% *)2 + 3 (5.28% *)3 + 4 (6.19%)
ESR (active/inactive)2.242.822.29
* statistically significant result at the 90% confidence level.
Table 2. Relative contributions to the genesis potential index (GPI) anomaly changes between the active and inactive MJO phases of absolute vorticity (Vort), relative humidity (Rhum), potential intensity (PI), and wind shear (Vshear) over the SCS for different ENSO conditions during June–November over the period of 1979–2016.
Neutral
(Active–Inactive)
El Niño
(Active–Inactive)
La Niña
(Active–Inactive)
Term1 (Vort)2.59 (45%) s2.55 (68%) p2.73 (48%) s
Term2 (Rhum)3.42 (60%) p1.99 (53%) s3.73 (65%) p
Term3 (PI)−0.14 (−2%)−0.18 (−5%)0 (0%)
Term4 (Vshear)−0.16 (−3%)−0.61 (−16%)−0.73 (−13%)
GPI5.713.755.73
p primary term; s secondary term.
Table 3. Relative contributions to the GPI anomaly changes between the active and inactive MJO phases of Vort, Rhum, PI, and Vshear over the WNP for different ENSO conditions during June–November over the period of 1979–2016.
Neutral
(Active–Inactive)
El Niño
(Active–Inactive)
La Niña
(Active–Inactive)
Term1 (Vort)0.54 (54%)0.70 (46%)0.27 (270%) d
Term2 (Rhum)1.07 (127%) d1.67 (111%) d−0.11 (−110%)
Term3 (PI)−0.14 (−17%)−0.3 (−20%)0.12 (120%)
Term4 (Vshear)−0.54 (−64%)−0.56 (−37%)−0.18 (−180%)
GPI0.841.510.1
d dominant term.

