Article

Indoor Air Quality Improvement by Simple Ventilated Practice and Sansevieria Trifasciata

by
Kanittha Pamonpol
1,*,
Thanita Areerob
2 and
Kritana Prueksakorn
2,3,*
1
Environmental Science and Technology Program, Faculty of Science and Technology, Valaya Alongkorn Rajabhat University under the Royal Patronage, 1 Moo 20 Paholyothin Road, Klong Nueng, Khlong Luang, Pathum Thani 13180, Thailand
2
Faculty of Technology and Environment, Prince of Songkla University, Phuket Campus 83120, Thailand
3
Andaman Environment and Natural Disaster Research Center, Faculty of Technology and Environment, Prince of Songkla University, Phuket Campus 83120, Thailand
*
Authors to whom correspondence should be addressed.
Atmosphere 2020, 11(3), 271; https://doi.org/10.3390/atmos11030271
Submission received: 21 January 2020 / Revised: 28 February 2020 / Accepted: 3 March 2020 / Published: 9 March 2020

Abstract

:
Optimum thermal comfort and good indoor air quality (IAQ) is important for occupants. In tropical region offices, an air conditioner is indispensable due to extreme high temperatures. However, the poor ventilation causes health issues. Therefore, the purpose of this study was to propose an improving IAQ method with low energy consumption. Temperature, relative humidity, and CO2 and CO concentration were monitored in a poorly ventilated office for one year to observe seasonal variation. The results showed that the maximum CO2 concentration was above the recommended level for comfort. Simple ventilated practices and placing a number of Sansevieria trifasciata (S. trifasciata) plants were applied to improve the IAQ with the focus on decreasing CO2 concentration as well as achieving energy saving. Reductions of 19.9%, 22.5%, and 58.2% of the CO2 concentration were achieved by ventilation through the door during lunchtime, morning, and full working period, respectively. Placing S. trifasciata in the office could reduce the CO2 concentration by 10.47%–19.29%. A computer simulation was created to observe the efficiency of simple practices to find the optimum conditions. An electricity cost saving of 24.3% was projected for the most feasible option with a consequent reduction in global warming potential, which also resulted in improved IAQ.

1. Introduction

In tropical regions, where the mean annual temperature (T) exceed 30 °C, [1,2], air conditioning (AC) is often used in buildings to make the conditions more comfortable for occupants and it can be found in commercial buildings, government buildings, factories, universities, schools, and homes. AC is often used in closed rooms with low ventilation in order to prevent ambient air pollution [3], caused by high occupancy [4] as well as to maintain low T and save energy [5]. The desire to save energy and a lack of awareness regarding health and safety issues relating to indoor air quality (IAQ) have resulted in rooms being designed in tropical countries, including Thailand, which allow for all doors and windows to be closed, causing poor ventilation, particularly in hotels [6]. Gases that are generated in closed rooms, which cannot be effectively ventilated can increase to harmful levels, resulting in negative health effects [7], especially for office workers, who spend most of their working hours inside buildings [8].
Keeping windows open or using a ventilation fan can improve IAQ, but energy consumption is thereby increased, since AC systems have to work harder to maintain the indoor T within a comfortable range. Therefore, an important aspect of room design is how to sustain good IAQ and thermal comfort with low energy consumption. An additional benefit from low energy use is the reduction of greenhouse gas (GHG) emissions due to human activities, which are a cause of climate change. It is now generally accepted that GHG emissions have a considerable impact by raising ambient T [9], which results in higher energy use for air conditioning to make rooms comfortable for their occupants, thus creating a vicious circle.
However, poor indoor air quality is not only associated with closed rooms, but it can also result from errors in the design of ventilation systems, which can introduce pollutants from outside into indoor areas [10]. Major indoor air pollutants that have been studied include PM2.5, PM10, O3, CO2, CO, NO2, NH3, volatile organic compounds (VOCs), and aldehydes, which can be derived from a number of potential sources [11,12,13,14,15]. Moreover, in addition to physical pollutants, biological pollutants, such as bacteria, fungi, and mold, can be suspended in indoor air in the form of particles and they are considered to be indoor air pollutants [16,17], and people in buildings affected by indoor air pollutants are at risk of acquiring sick building syndrome (SBS). The symptoms of SBS are various and non-specific, but they include tiredness, feeling unwell, itching skin, high blood pressure, and heart rate, and even difficulty in concentrating. Sometimes, these effects are rapidly relieved after leaving the building [11,15,18], but this may not be an option for those affected.
In this study, the air quality and comfort parameters that were selected for study were relative humidity (RH), T and CO2 concentration, and how they affect the proper design of rooms [19]. Also included is the CO concentration as a representative outdoor air pollutant generated by incomplete combustion of fossil fuels [9], being mostly derived from automotive exhaust fumes from roads and parking areas around buildings.
A high RH content in the ambient air can result in the low evaporation of perspiration from the surface of human skin with a consequent reduction in the excretion of substances by evaporation [20]. Further, exposure to high T has been found to not only affect work performance, but also to result in symptoms, such as mental fatigue and changes in blood pressure [21]. In addition, inhaling excessive amounts of CO2 above 10,000 ppm can cause a condition that is known as acidosis (low pH of blood: <7.35), in which the body’s defense mechanisms are stimulated, resulting in, e.g., an increase in breathing rate and volume and high blood pressure and heart rate [12]. Exposure to CO2 levels of approximately 50,000 ppm can lead to the failure of the central nervous system (brain and spinal cord), possibly causing death [22]. On the other hand, breathing high levels of CO can lead to death due to tissue hypoxia, as CO can bind to hemoglobin more effectively than oxygen [23].
The results of research that was conducted by NASA’s environmental scientists into the improvement of IAQ while using plants was published in 1989, with a number of houseplants being tested as a means of treating indoor air pollution by removing trace organic pollutants from the air in closed environments in energy-efficient buildings. The organic chemicals tested consisted of benzene, trichloroethylene, and formaldehyde, and the scientific names of the plants investigated were Chamaedorea seifritzii, Aglaonema modestum, Hedera helix, Ficus benjamina, Gerbera jemesonii, Deacaena deremensis, Deacaena marginata, Dracaena massangeana, Sansevieria laurentii, Spathiphyllum, Chrysanthemum morifollum, and Dracaena deremensis [24]. Among the plants that are generally found in tropical regions is Sansevieria laurentii (mother-in-law’s tongue), which is a size that is suitable for a small office and it was selected in this study to test its effect on IAQ improvement.
IAQ has been an important issue in Europe and America since the 18th century [4]. However, there has been relatively limited research on the topic in Association of South East Asean Naitons (ASEAN) countries [15,25] and few long-term studies have been conducted [26]. The main aim of this research was to improve the IAQ of an air-conditioned office in Thailand with a poor ventilation system by practicing simple ventilation operations and locating the mother-in-law’s tongue plants in the office, with the second aim of achieving lower energy consumption. Another beneficial outcome of this study was finding ways of reducing GHG emissions that are associated with the use of electricity. In this paper, alternative energy-saving scenarios are presented to demonstrate the effectiveness of simple operations in reducing GHG emissions and improving IAQ for office workers.

2. Experiments

2.1. Studied Site

The study site was an air-conditioned office in Valaya Alongkorn Rajabhat University under the Royal Patronage (VRU), which is located in Pathum Thani province, a suburban area 15 km north of Bangkok, Thailand at 14°8.004′ north latitude and 100°36.961′ east longitude, with the site, on average, 5 m above sea level. The office was located on the second floor of a four-story building that was surrounded by a parking area. The room dimensions were: Length × Width × Height of around 4 m × 10 m × 3 m for six occupants. The office was air conditioned with the only means of ventilation being a door, leading to open corridor, which was generally closed to maintain a low T and save energy. The air conditioner was a wall mounted type with cooling capacity 36,000 Btu/hour (Daisenko International Co., LTD., Thailand). Figure 1 presents a diagram of the office.

2.2. Measurement of IAQ Parameters

Data were collected in the air-conditioned office for approximately one year from May 2017 to May 2018 to indicate the quality of the indoor air by the recommended levels of the American Society of Heating, Refrigerating, and Air-conditioning Engineers (ASHRAE) [27]. RH, T, CO, and CO2 were monitored every minute using a FLUKE 975 AirMeter, a portable device for the measurement of IAQ. The specifications of the measurement device are, as follows; CO2: accuracy ± 2.75%, range 0 to 5000 ppm; CO: accuracy ± 5% or ± 3 ppm at 20 °C and 50% RH, range 0 to 500 ppm; T: accuracy ± 0.5 °C from 5 °C to 40 °C, range −20 °C to 50 °C; and, RH: accuracy ± 2%, range 10% to 90% RH [28]. The device was installed on the desk in the middle of the room, at the same height as the breathing zone during working hours.

2.3. Simple Ventilation Practices for Improving IAQ

After obtaining the results of the one-year observation, four different systems were implemented in June 2018 during working hours (9:00–17:00) to discover the simplest and most efficient means of removing stale air from inside the room, and introducing fresh air from outside. The experimental condition was conducted in real practice where people in the office were working and doing activities as usual. The four systems tested were as follows: Case 1: the AC was turned on all day (normal case) from 1–7 June, Case 2: the AC was turned off during the lunch hour (12:00–13:00) from 8–14 June, Case 3: the AC was turned off for half a day (9:00–13:00) from 15–21 June, and Case 4: the AC was turned off all day (9:00–17:00) from 22–28 June. The statistical analysis was analyzed by one way ANOVA to consider among four cases at confidential level 95% (p < 0.05) by Statistic 8 Software (Version 8, USA).
For Case 3, it was decided to turn off the AC in the morning, because the high T in the afternoon [2] had a negative effect on work efficiency. Turning off the AC all day (Case 4) could not realistically be applied, since it would probably result in problems, such as heat strain. This system was included to establish the maximum rate of full-day ventilation with the AC turned off, the door constantly opened, and an electric fan mounted on the ceiling turned on.
An assessment of the envelope air permeability of the room was obtained by the infiltration rate, which was calculated by the following equation:
Q = V t × ln [ C t C e x t C 0 C e x t ]
where, Q is infiltration rate of air entering the room, V is volume of air in the office (m3), t is time interval (s), Ct is indoor concentration of CO2 at time t (ppm), Cext is concentration of CO2 in the ambient air (ppm), and C0 is indoor CO2 concentration at time 0 (ppm) [29,30].
The volume of air in the office (V) was calculated from the size of the room (4 m x 10 m x 3 m), Interval (t) was 3600 seconds from hourly average data, Cext was average monitoring outdoor CO2 concentration at 430 ppm, Ct was the monitored CO2 concentration at time t (i.e., 18:00), and C0 was the monitored CO2 concentration at one hour before t (i.e., 17:00). The frequency of measurement was every one minute, so the raw data were calculated to hourly data for both indoor and outdoor CO2 concentration. The indoor CO2 concentration was obtained by monitoring inside the office at 1 m height or nose level while people were sitting. The condition in the room was no plant and no ventilation for a long period. The door was opened when people came in and went out in a short time, not over one minute. The outdoor CO2 concentration was monitored at 1.5 m above ground level in the ambient air.

2.4. Sansevieria Trifasciata for IAQ Improvement

Another option tested for improving IAQ was locating the mother-in-law’s tongue plants in the office to reduce the CO2 concentration in the ambient air through their photosynthesis. In this experiment, the S. trifasciata was put in a pot that contained soil. The plant was watered twice a week. The experiments were conducted by monitoring the air quality for six conditions, as follows: 0, 2, 3, 4, 5, and 6 Mother-in-law’s tongue plants with three replicates for each case. The plants were placed on the floor near the desks where people worked, as shown in Figure 1. The number of plants was limited by the space of the rooms in which they were located. The IAQ was monitored from March to April 2019 for 24 hours each day to observe the amount of CO2 that the plants consumed for photosynthesis during the daytime and to establish the amount that they released through respiration at night. RH, T, CO, and CO2 were monitored by indoor air meter (FLUKE 975 AirMeter, USA) every minute. We monitored CO2 in a real situation to represent working activities or business as usual in tropical areas. Only the room temperature was controlled by air conditioner to comfort people at 25-degree Celsius, which was the general setting temperature in tropical countries.

2.5. Numerical Study

In addition to the measurement of the IAQ, a simulation was performed to estimate the efficiency of the office ventilation while using the computational fluid dynamics (CFD) software system, ANSYS Airpak 3.0.16 (Fluent Inc., Lebanon, NH, USA). Airpak simulation software has been broadly applied for numerical simulation of the indoor air alteration under conditions [31,32,33,34]. Based on the finite volume method, Airpak uses the FLUENT CFD solver engine for the thermal and fluid-flow calculations to solve equations for the conservation of mass, energy, and momentum of air. The two-equation K-epsilon turbulence model was chosen to solve turbulent flow equations. The number of cells in the domain was approximately 1.5 million, while using hexa-unstructured geometry to discretize. For this function, all of the element types were used to fit the mesh to the geometry. The simulation was iterated to a convergence level of 10−3 until the solutions were stable. Additionally, a mesh refinement study was conducted for quantifying and minimizing the error due to discretization. Four different mesh systems, i.e., coarser, course, medium, and fine were generated, to perform the test.
The investigated parameter was the mean age of the air, indicating the average time taken for the air to pass through the room, with a shorter time denoting higher air freshness [35]. A three-dimensional (3D) simulation of an experimental room with the same dimensions as that shown in Figure 1 was constructed using the ANSYS Airpak software and it is illustrated in Figure 2. Section 3.4 presents the results of numerical study.

2.6. Estimation of Mitigation of Electricity Use and GHG Emissions

Electricity usage directly impacts the increases in GHG emissions. Reducing electricity consumption not only helps decrease GHG emissions, but also reduces the cost of electricity. Table 1 presents the possible options for electricity saving scenarios.
The different options that are shown in Table 1 were designed in collaboration with the room occupants, who were interested in the effect on the cost of electricity and global warming potential (GWP) if they all agreed to try them. The duration of working without AC for Cases A, B, and C were aligned with Cases 1, 2, and 3 in Section 2.3, respectively. Case 4 (no AC) was not re-assessed, since its results could be estimated from the other cases and its application was, in any event, not realistic. Case A was a typical case, whereas Cases B and C for other appliances represented situations that were not convenient, but feasible in practice.

3. Results and Discussion

3.1. Results of Monthly Monitoring Data

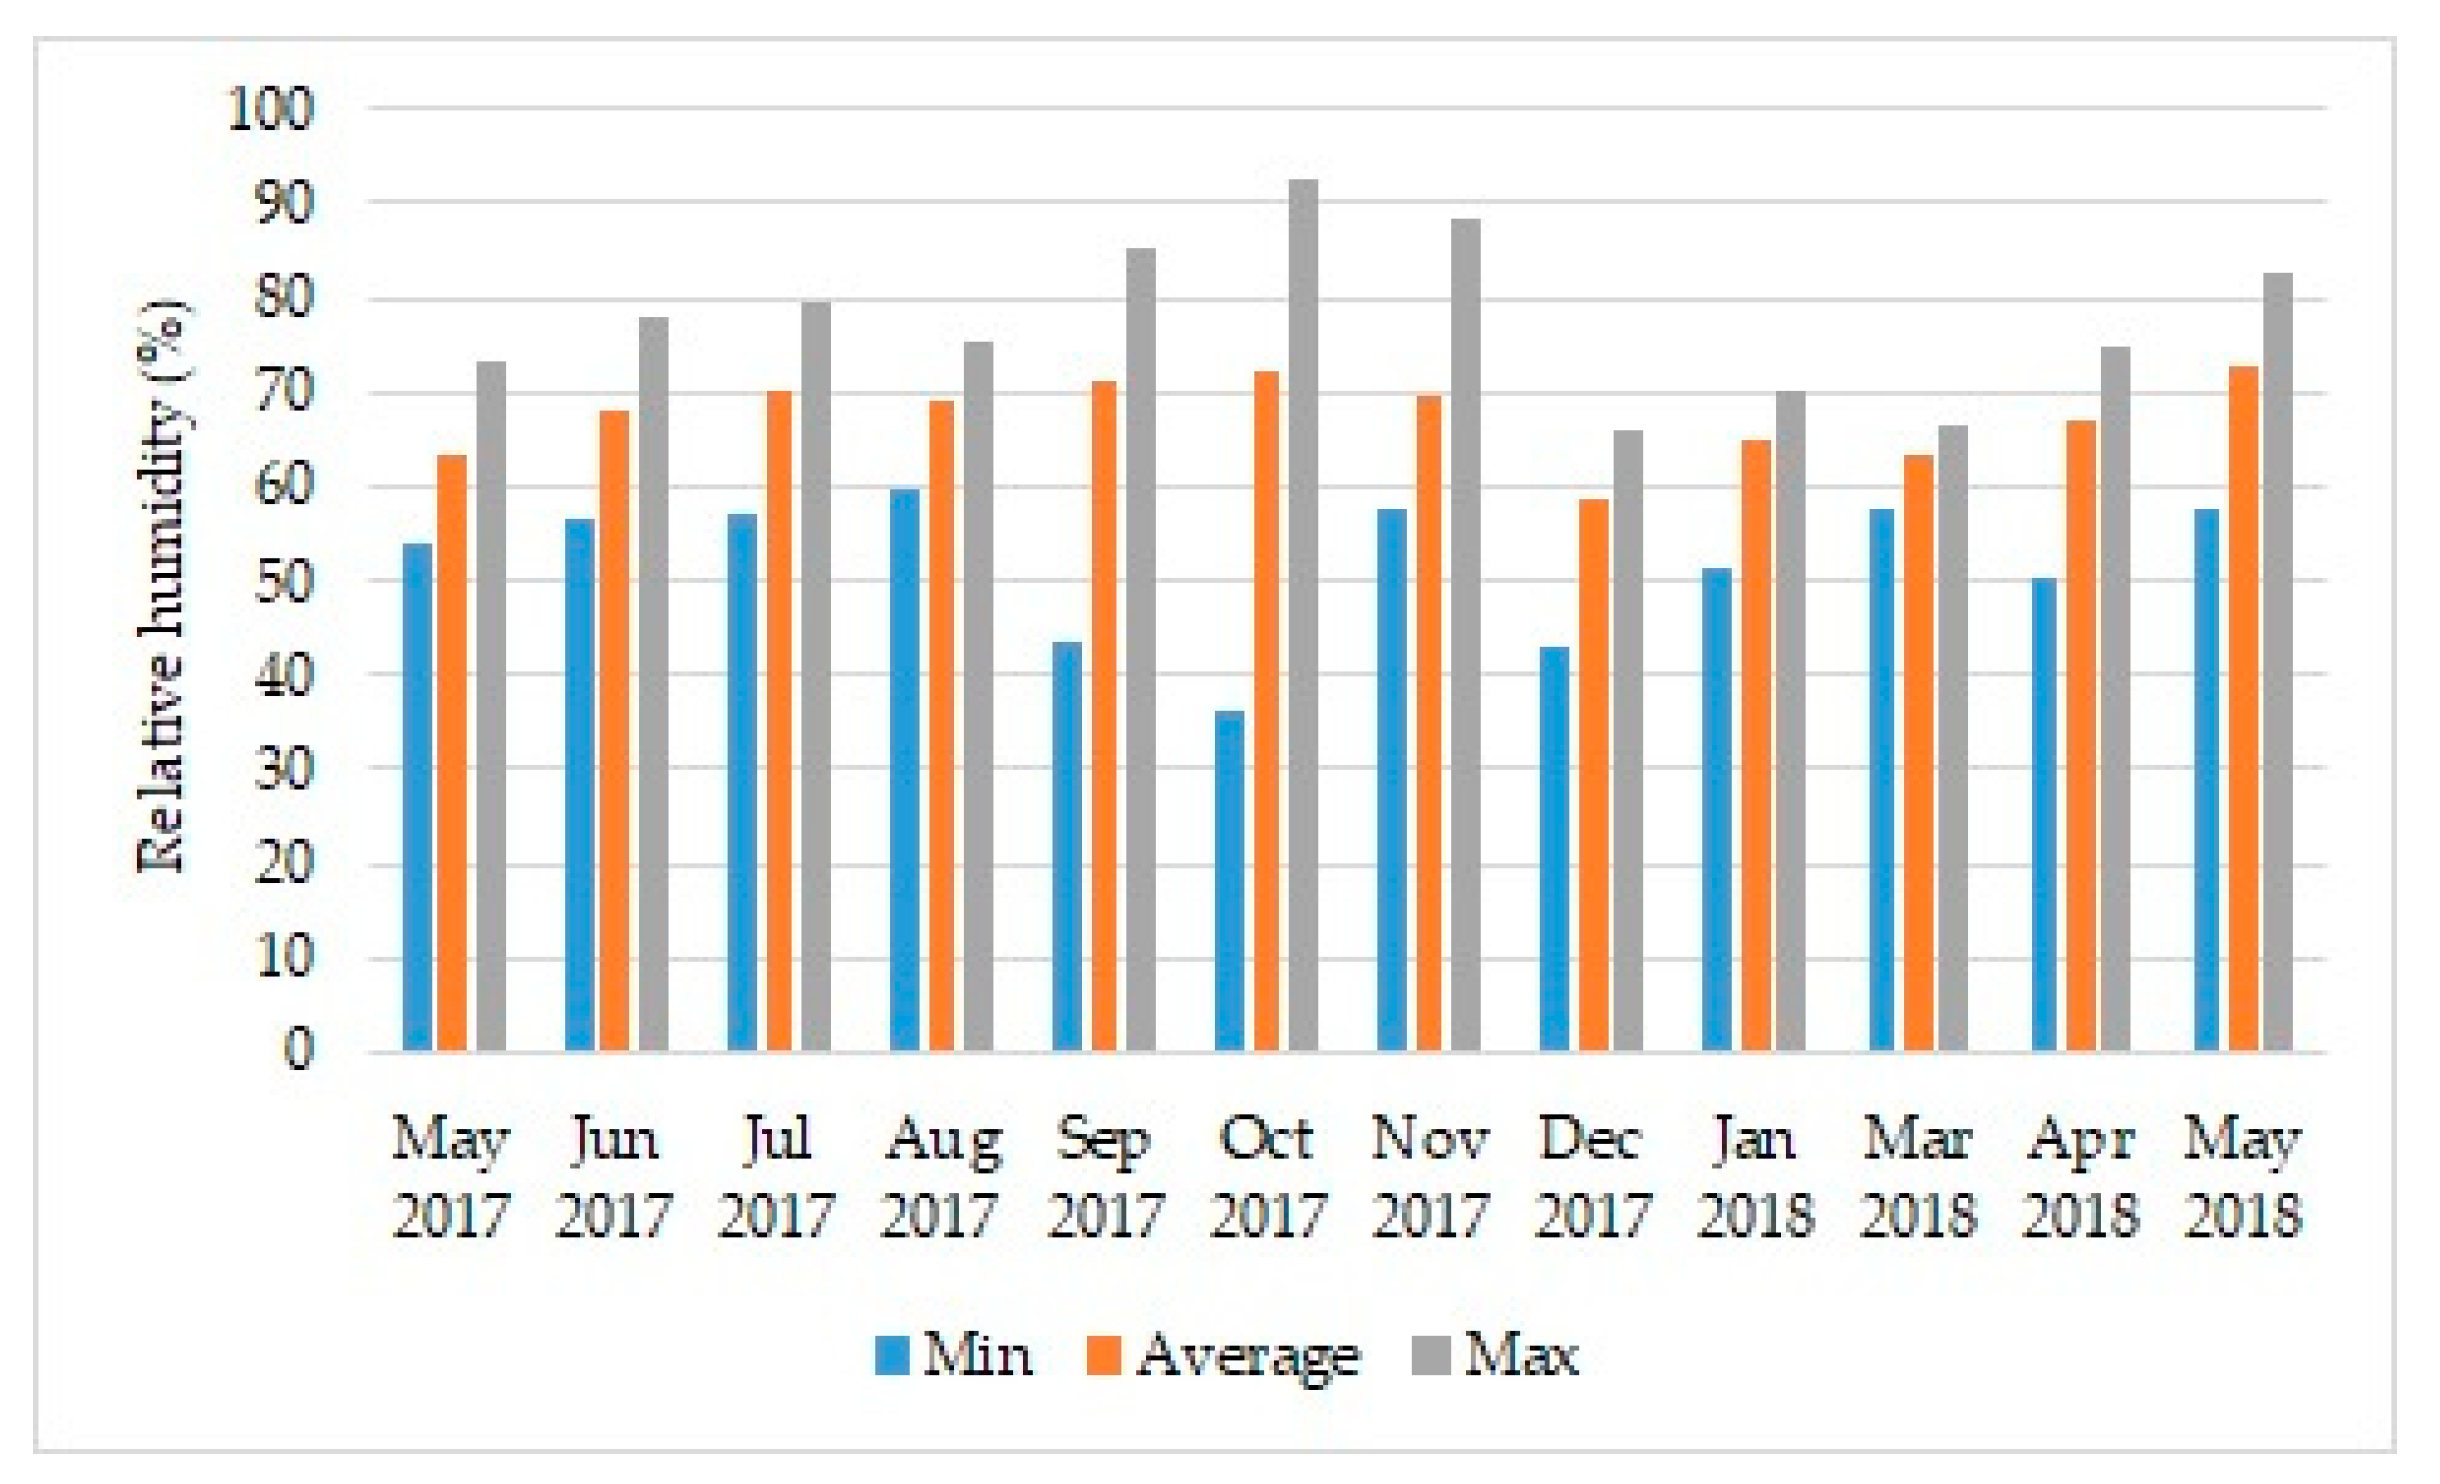
The data from 24-hour monitoring of IAQ at one-minute intervals were converted into monthly results, as presented in Figure 3. The average RH of the office was 67.50% ± 3.98%, which was a little over the range of the recommended standard of 65% or less [36]. Thailand is located in a tropical zone and Thais are accustomed to a hot-humid climate, so the ambient humidity can be higher than the recommended level for the USA [37]. However, a T of 26 °C and an RH of 50–60% were preferred, according to the results of a survey of thermal comfort for air conditioned buildings in Thailand [25]. During the period studied, the Bangkok’s mean annual RH was 74% [38], which was consistent with the wide range of outdoor RH between 34 and 78% RH, detected at 17 locations referred by the study of Ongwandee et al. [25]. Therefore, opening the office door might only be helpful in reducing the RH at some times.
Figure 3 shows that the greatest variation in RH was apparent for the minimum values during September and October 2017, because of the influence of outdoor air that is caused by various groups visiting the office at that time. Reducing the RH by introducing ambient air is only practicable while taking that the RH value can vary diurnally or hourly into consideration.
The room T was maintained close to the comfortable standard (23 to 26 °C) [39], consistent with the preferred environmental conditions for Thailand established in the thermal comfort survey (26 °C at 50–60% RH) [25], through the use of the AC, as shown in Figure 4. The annual country average outside T was 27.61 ± 1.31 °C and high temperature was found to be higher than usual during August to November in 2017, because of rain, so the winter started late in December [40]. The outdoor T was usually higher, reaching more than 40 °C in the afternoon. The highest indoor T was detected during September and October 2017, which was consistent with the variation in the minimum RH data, and it was also possibly due to the number of visitors entering and leaving the office during that period.
The CO concentrations were measured and the data were analyzed by converting from ppm at the local T, to the standard ppm at 25 °C. Figure 5 shows that the average CO concentration was 1.32 ± 0.29 ppm, while the maximum concentrations were 4.57 ppm, 4.91 ppm in September, and October 2017, respectively. The CO detected must have originated from the ambient air outside the room with the probability that this was associated with the parking outside the room with the probability that this was associated with the parking area surrounding the building, since there was no source of CO generation in the room and the minimum values were close to zero. Moreover, the findings are also consistent with the findings related to T and RH in September and October. Further, while fluctuations can be observed between the minimum, maximum, and average levels of CO, these three parameters were closest in March 2018, because there were no events scheduled in that month. Nevertheless, although the ambient air outside the office probably influenced the concentration of CO, the level was not a significant factor in the IAQ, because it was lower than the indoor air quality standard, (9 ppm for eight hours and 35 ppm for one hour) [37].
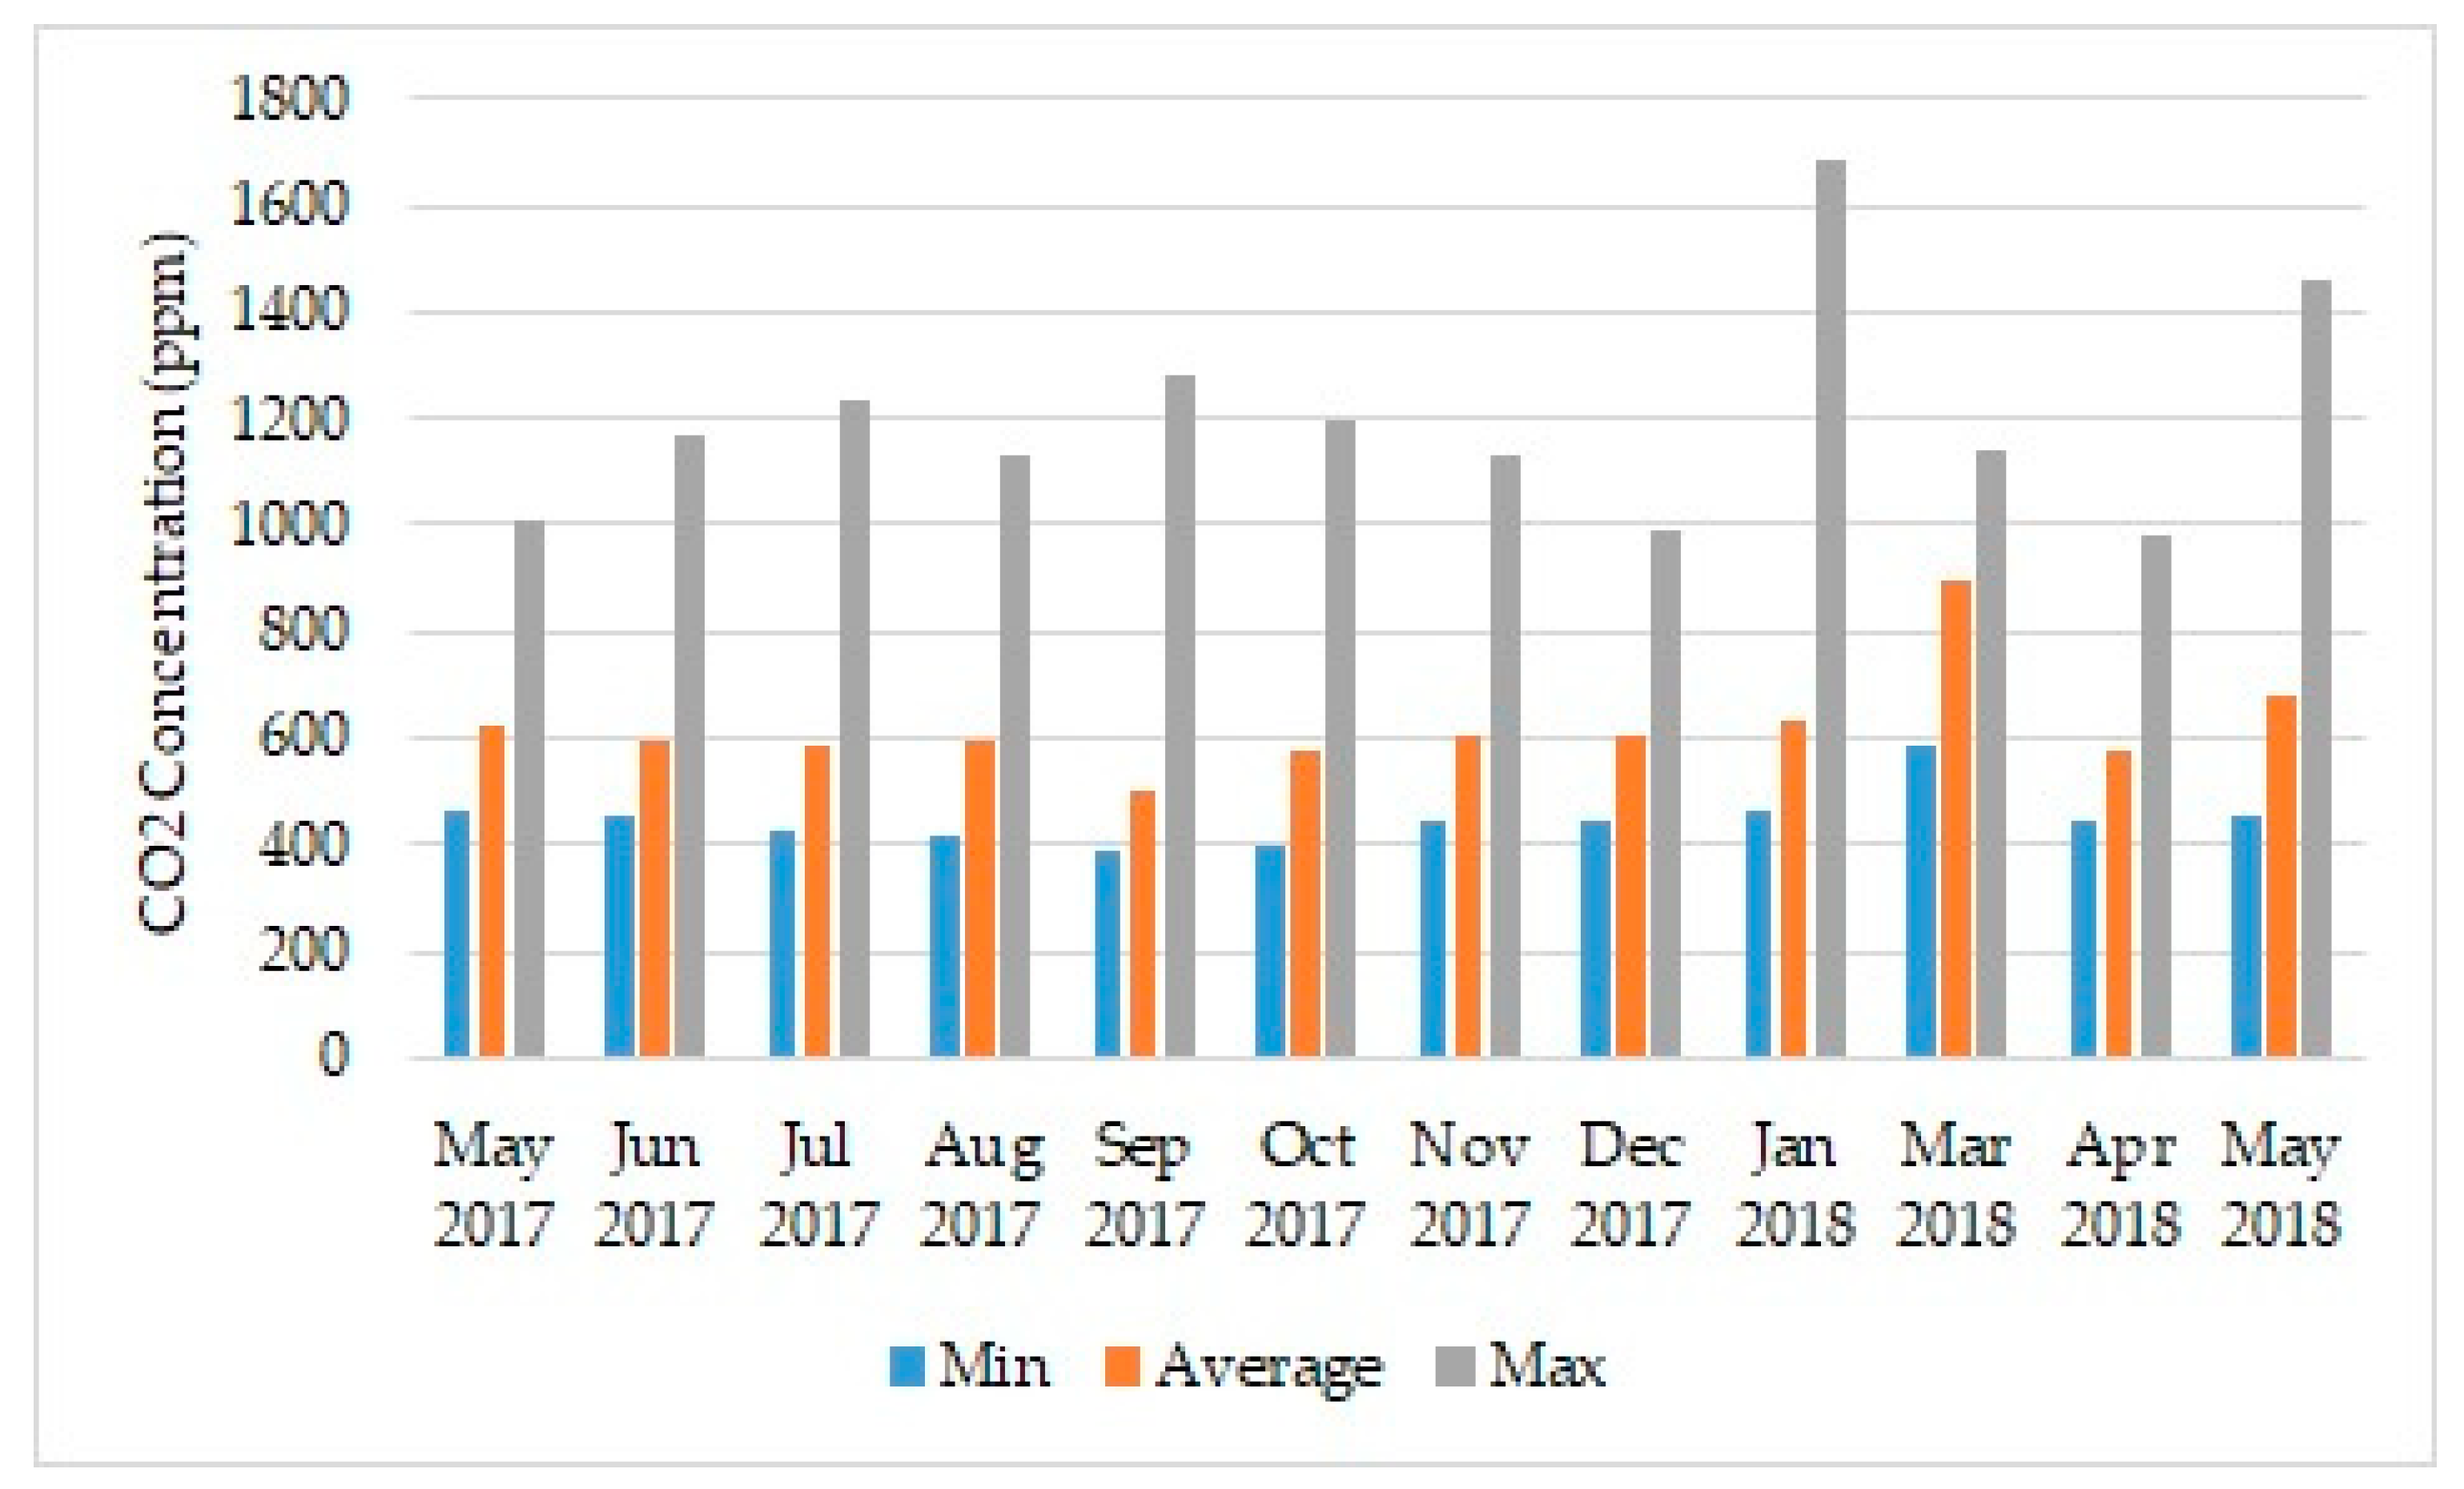
Figure 6 shows that, from May 2017 to May 2018, the maximum, average (± standard deviation), and minimum indoor CO2 concentrations were 1456.79 ppm, 600.67 ± 42.80 ppm, and 387.32 ppm, respectively. The maximum level of CO2 was found to be above the comfortable level of 1000 ppm—as recommended by various standards [4,11,12] in every month, except December 2017 and April 2018 (maximum values, 987 ppm and 977 ppm, respectively). The maximum 24-hour CO2 concentration was found in January 2018, on a day when all staff members (six people) were in the office together with an additional four people attending a long meeting. This emphasizes that human respiration was a significant source of indoor CO2 (generally two pounds of CO2 per day) [22]. There were no significant fluctuation in the level of CO2 detected during September and October 2017, which implied that the exchange of air between inside and outside the office only occurred in the area near the door, and the stale air inside was not effectively removed, due to the lack of a ventilation system to support the exchange process.

3.2. Results of Simple Ventilated Practices for The Improvement of IAQ

Based on the measurements for the entire year, CO2 was the parameter that most obviously exceeded the comfortable standard and there was no obvious method of solving this problem, which did not involve reconstruction and the installation of a ventilation system. Therefore, this was the chosen parameter for the experiment to test the performance of simple ventilation practices. The results for the IAQ improvement in June 2017 between Cases A, B, and C that are shown in Table 1 corresponding to Cases 2–4 in Section 2.3, respectively, and Case 1 (normal case) are presented in Table 2.
Reductions of 19.9%, 22.5%, and 58.2% of the maximum CO2 concentrations were found by turning off the AC during lunchtime (12:00–13:00, Case 2); in the morning (9:00–13:00, Case 3); and. during the full working time (9:00–17:00, Case 4), respectively, as can be deduced from Table 2. In all cases, the concentrations of CO2 were reduced below the comfortable standard (1000 ppm) [4,11,12]. Cases 2 and 3 were able to reduce the maximum concentration of CO2 by almost the same amount. The concentration of CO2 was being reduced when the air conditioning was more time inactive because the air inside and outside the room could be exchanged due to the door leading to the opened corridor. More time opening the door resulted in more time for air to be exchanged. Higher CO2 in the room was released into the ambient air then plants could lower CO2 in the ambient air through photosynthesis process.
The measured values are in agreement with research that was conducted in 21 offices, in Taiwan in which the CO2 levels were measured while using a Q-TRAK indoor air quality tester (Model 7575, TSI Corporation, Bangkok, Thailand)) with an average level of 708.2 ± 190.5 ppm, a maximum level of 1193.6 ppm, and a minimum level 464.0 ppm [11]. The normal case results were consistent with the indoor CO2 level in Thai classrooms, which was measured by the similar method using Indoor Air Quality Meters (IAQ-CALCTM) Model 8760/876, a real time monitoring device that used a dual wavelength non-dispersive infrared sensor (NDIR) for CO2 and Electro chemical sensor for CO by frequency of five minutes. The average CO2 concentration in classroom 1 (carpet) was 711 ± 272 ppm and classroom 2 (wooden) was 1332 ± 609 ppm [41].
The statistical analysis results by One-Way ANOVA found that the result was significant at p = 0.002223 (p < 0.05) and the f-ratio value was 5.18726. This result means concentrations of CO2 were different among four cases.
The T and RH were also measured to check whether they aligned with the comfort standards. Figure 7 and Figure 8 present the results of T and RH, respectively.
From Figure 7, case 2 would be the optimum choice if the occupants of the room preferred not to work under hot condition. The T in Case 3 exceeded the comfortable standard, but it did not reach 28 °C, the level with which 80% of Thai workers have been found to be comfortable [42]. Thus, the adoption of Case 3 would have to be based upon the agreement of all the occupants of the room. The values of T between Cases 3 and 4 are visibly different because the ambient T in the afternoon is higher than that in the morning. Certainly, the greatest saving of electricity can be achieved by not using AC at all during working hours, but it is not a realistic option with a working temperature of over 30 °C for 7–8 hours [35], which would be likely to affect work performance. From Figure 8, the RH was lower in the air conditioned room, so the skin would be dried when you stayed for a long time. If the door was opened in Case 2–4, the RH was increased in the room to be more comfortable. The monitored wind velocity in front of the room was 0.05 ± 0.04 m/s, which was calm wind that mostly blew from southwest and west direction. The door was in the west, so the mild wind entered the room to comfort people and exchanged the air between inside and outside the room to reduce CO2.
Energy saving from turning off air conditioner was calculated. The air conditioner size 36,000 BTU/Hour (international) was converted into 10.55056 kWh. For case 2, the air conditioner was turned off one hour for 238 working days (not including special holiday 24 days and weekend 104 days in Thailand 2020). The conversion factor of Thailand grid mixed electricity year 2016–2018 was 0.5986 kg CO2eq/kWh (LCIA method IPCC 2013 GWP 100a V1.03, Thai National LCI Database, TIIS-MTEC-NSTDA (with TGO, Electricity 2016–2018) updated in December 2019) [43]. Therefore, we can reduce CO2eq emission for 1503.10 CO2eq per year.

3.3. Results of Using Sansevieria trifasciata for IAQ Improvement

Table 3 presents the results of monitoring the parameters that are relevant to IAQ during the experimental placement of mother-in-law’s tongue plants in the poorly ventilated room.
Table 3 shows that the average concentration of CO2 was decreased by placing 2, 3, 4, 5, and 6 mother-in-law’s tongue plants in the office as compared to there being no plants in the room, as can be visually observed in Figure 9. The concentration of CO2 in the room was not varied by the number of plants, but influenced by temperature of the room. This means if the door is opened, the temperature will be high and the CO2 concentration will be reduced. Closed chamber is required to control infiltration and ventilation to only consider the influence of plant on indoor CO2.
From Figure 9, it can be seen that there was an increasing trend in CO2 concentrations from 9:00 to 15:00, after which they declined to an ambient air concentration at 473.23 ± 8.66 ppm. The reductions in the percentage CO2 concentrations with 2, 3, 4, 5, and 6 of S. trifasciata when compared to no plants being placed in the office were 19.29%, 21.99%, 14.36%, 13.66%, and 10.47%, respectively. The overall average CO2 decreased by 15.95 ± 4.13%, which was slightly (±4%) lower than the reduction that was achieved in Case 2 by turning off the AC during lunchtime. The statistical analysis by One-Way ANOVA results was significant at p = 0.009132 (p<0.05) and f-ratio value is 3.53877. The results are different among treatments. However, the result of statistical analysis to compare between Case 2 (turned off AC at noon) and 3–6 indoor plants found p = 0.061, so it is not significant at the 95% confidence level. Therefore, reducing indoor CO2 could be done by turning off air conditioner and opening the door during lunch hour, or by planting S. trifasciata in offices because there was no difference from statistical analysis results.
These results were consistent with those of other studies, which have found that plants could reduce indoor CO2 concentrations [44,45]. Therefore, during the daytime, human respiration is clearly the key factor in increasing the CO2 concentration, while ventilation is the main factor in decreasing the level of CO2 in a room. Hence, the number of people in the room and their activities are the main drivers of the CO2 concentration. Thus, the concentration of CO2 is not directly related to the number of plants that are placed in the room. It was found that the respiration of plants during the night had no effect on the CO2 concentration when compared with no plants in the room with a declining trend in CO2 to the same level among different options from 0–6 mother-in-law’s tongue plants being apparent.
The envelope air permeability of the room was the air passing through 2–3 millimeters around the door, which was caused by damage of the sealed material. The infiltration rate of the room was considered from the CO2 concentration when there was no plant in the room to avoid the effect from photosynthesis or respiration of plant and microorganism in soil. The maximum rate was found at around 17:00–18:00 when people went back after finish working. The average maximum value of ventilation rate was 0.0152±0.0006 m3/s. The maximum infiltration was found at 0.0162 m3/s.

3.4. Results of The Simulation

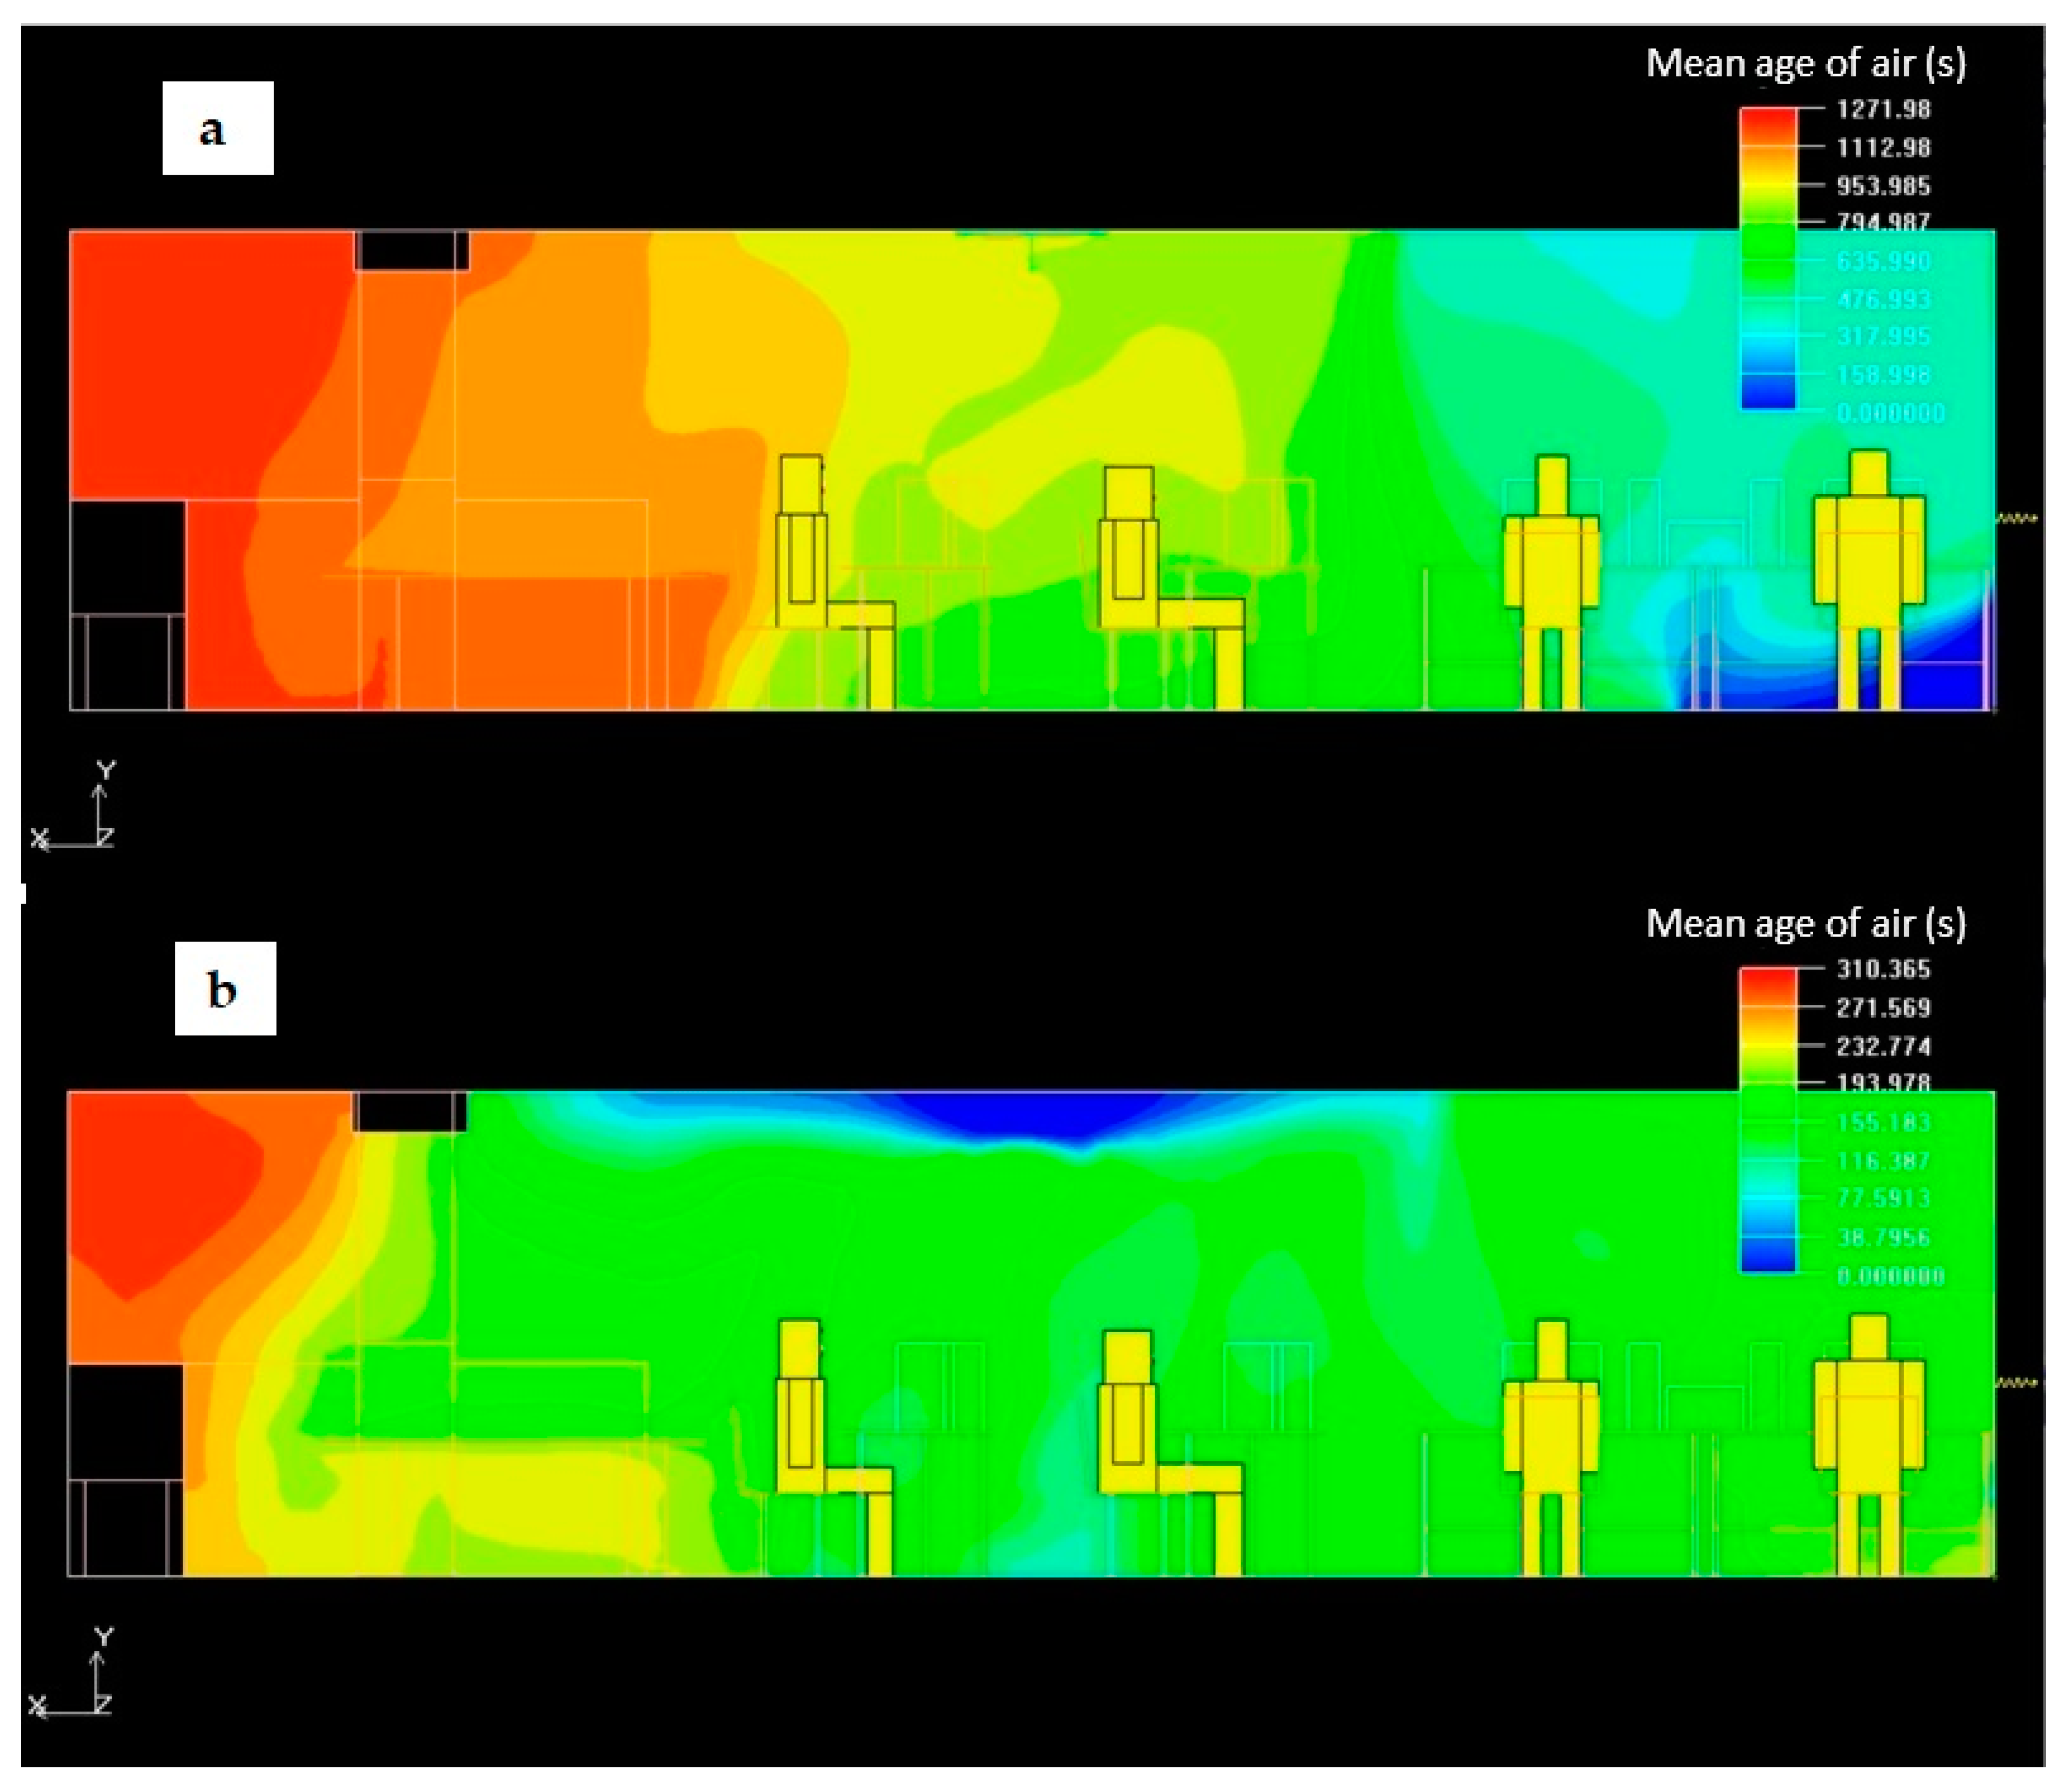
As noted above, the stale air inside the room might not be properly ventilated and this section presents the results of the computer simulation generated to explain that hypothesis, as shown in Figure 10.
Figure 10 shows the comparative results for the mean age of air when the fan mounted on the ceiling is turned off (Figure 10a) and turned on (Figure 10b). The electric fan was only used when the AC was switched off so there was no effect from the AC on the movement of air in this simulation. The average mean age of the air in Figure 10a,b were 747 s and 164 s, respectively. Thus, the efficiency of mixing the air by a 39-watt ceiling fan, from which the volume of air blown is 30 m3/min., is improved by approximately four times. Moreover, the exchange of air between the inside and outside of the room only occurred in the area near the door, and the stale air (i.e., that with the highest concentration of CO2 from human exhalation) was retained inside of the room, and this is clearly illustrated in Figure 10a.
The fan needs to be used for mixing air and the door must be opened, as shown in both Figure 10a and Figure 10b, since otherwise there will be no movement of air near the door, as presented in Figure 10a. Thus, the ventilation is undoubtedly much better when compared to when the AC is turned on when the door is closed. This finding should encourage room occupants to sometimes apply general ventilation to increase the IAQ.
A mesh refinement study was performed based on four grids, i.e., coarser, coarse, medium, and fine grid, with approximately 0.4–0.5 million, 0.8–0.9 million, 1.4–1.5 million, and 1.6–1.8 million cells, respectively, to minimize and ensure that the error was below the tolerance level. The average mass flow rate in the room was used for comparison of the meshes. The differences between fine grid and the other grids (coarser, coarse, and medium grids) are about 7.4%, 3.6%, and 1.7%, respectively. The performance of the medium grid, selected for the simulation of this numerical study, was not significantly different to the fine one, and it was concluded as the suitable option.

3.5. Mitigation of GHG Emissions

Table 4 summarizes the reduction in electricity costs and hence GWP for the three experimental cases.
When the feasible measures for the electrical appliances in the office were applied representing Case 2/B with the AC turned off from 12.00–13.00, or as in Case 3/C with the AC turned off from 9.00–13.00, the electricity cost and GWP can be reduced by 7.5% and 24.3%, respectively. AC is generally accepted as the largest consumer of electrical energy per unit and, thus, contributes most to the emission of GHGs. However, the total amount of electricity that is used by computers is higher due to the number of computers in the office (6 units). Overall therefore, since computers consume the greatest amount of energy, turning them off for only one hour per day during lunchtime can help to reduce the overall electricity consumption by almost 10%. However, this option was least convenient as compared to other choices, based on the opinion of the room occupants. The different practices relating to computers and the AC are the reason why the reductions that result from Cases B and C are so great.
Therefore, the methods that were investigated in this study to reduce electricity consumption and GWP would be feasible means of mitigating costs by reducing the usage of appliances in offices and could be adopted and implemented in energy saving plans in universities and other workplaces. However, it should be noted that the figures that are presented in Table 4 are only the estimated values, and based on the power ratings (wattage) of the various devices. The actual electricity consumption also depends on the settings actually used (such as standby mode for computers and T settings of the AC and refrigerator). In general, by observation, there is unlikely to be a significant effect from the adjustment of the T setting of the AC based on seasonal variation (i.e., the T setting is not varied during the year based on the outside temperature). More accurate data could be obtained if an electricity meter was installed in each room to monitor the actual electricity consumption in different scenarios.

4. Conclusions

This study conducted measurements of four IAQ parameters i.e., T, RH, CO, and CO2, in a small room with six occupants and found that the levels of some of the parameters exceeded the recommended levels, particularly the level of CO2, the source of which was human respiration. Therefore, the number of occupants in the room and its ventilation efficiency are the key factors for the CO2 concentration. Poor conditions (i.e., a CO2 concentration of over 1000 ppm) were not detected after the simple mitigation practices were implemented. However, T is a significant factor that must be taken into consideration in the adoption of measures to reduce electricity consumption. Without reconstruction of the office space and the installation of a ventilation system, Case 3/C was the best option with good IAQ, and it would achieve a reduction of electricity consumption of 24.3% based on the situation without taking any mitigating action. Moreover, this system would be feasible with the agreement of all members of staff working in the office. Another feasible option for CO2 reduction was placing mother-in-law’s tongue plants in the office. The average reduction in the CO2 level based on using between two and six plants was almost 16%, which rendered the CO2 concentration within the standard comfortable level of 1000 ppm. However, human activities are the key factor in the CO2 concentration in a room, not the number of plants. The data that were derived from measuring the actual IAQ parameters in various scenarios and the results of the computer simulation are helpful in identifying and promoting simple practices that aimed at achieving good IAQ while reducing electricity costs and, hence, GWP in office situations. Further research should be directed towards measuring other IAQ parameters, and the causes of SBS, which are possibly associated with the CO, particulate matter, and VOCs in car exhaust fumes.

Author Contributions

Conceptualization, K.P. (Kanittha Pamonpol); methodology, K.P. (Kanittha Pamonpol) and K.P. (Kritana Prueksakorn); software model K.P. (Kritana Prueksakorn); validation K.P. (Kanittha Pamonpol) and K.P. (Kritana Prueksakorn); formal analysis, K.P. (Kanittha Pamonpol) and K.P. (Kritana Prueksakorn); investigation, K.P. (Kanittha Pamonpol); resources, K.P. (Kanittha Pamonpol); data curation, K.P. (Kanittha Pamonpol) and T.A.; writing-original draft preparation, K.P. (Kanittha Pamonpol) and K.P. (Kritana Prueksakorn); writing-review and editing, T.A.; visualization, K.P. (Kanittha Pamonpol) and K.P. (Kritana Prueksakorn); supervision, K.P. (Kanittha Pamonpol); funding acquisition, K.P. (Kanittha Pamonpol), K.P. (Kritana Prueksakorn), and T.A.; project administration, T.A. All authors have read and agreed to the published version of the manuscript.

Funding

This research was performed with the financial support of the Research and Development Institute, Valaya Alongkorn Rajabhat University under the Royal Patronage and the Andaman Environment and Natural Disaster Research Center, Prince of Songkla University, Phuket Campus.

Acknowledgments

The authors would like to express our appreciation to the Research and Development Institute, Valaya Alongkorn Rajabhat University under the Royal Patronage, Prince of Songkla University, Phuket Campus for the financial support. The support by assistants, i.e., Tip Sophea and Hong Anh Thi Nguyen are also acknowledged. The authors would like to thank Robert William Larsen for kind advice on English writing.

Conflicts of Interest

The authors declare no conflict of interest.

References

  1. NOAA. Global Climate Station Summary: Annual Mean Temperature 2010–2015. 2020. Available online: https://gis.ncdc.noaa.gov/maps/ncei/summaries/global (accessed on 13 February 2020).
  2. Thai Meteorological Department: Meteorological Development Bureau, The Climate of Thailand. 2015. Available online: https://www.tmd.go.th/en/archive/thailand_climate.pdf (accessed on 13 February 2020).
  3. Canha, N.; Lage, J.; Candeias, S.; Alves, C.; Almeida, S.M. Indoor air quality during sleep under different ventilation patterns. Atmos. Pollut. Res. 2017, 8, 1132–1142. [Google Scholar] [CrossRef]
  4. Persily, A.K. Indoor carbon dioxide concentrations in ventilation and indoor air quality standards. In Proceedings of the 36th Air Infiltration and Ventilation Centre Conference, Madrid, Spain, 23–24 September 2015. [Google Scholar]
  5. EERE. Common Air Conditioner Problems. Energy Saver, Office of Energy Efficiency & Renewable Energy, 2017. Available online: https://energy.gov/energysaver/common-air-conditioner-problems (accessed on 17 October 2018).
  6. Boonyayothin, V.; Hirnlabh, J.; Khummongkol, P.; Teekasap, S.; Shin, U.; Khedari, J. Ventilation Control Approach for Acceptable Indoor Air Quality and Enhancing Energy Saving in Thailand. Int. J. Vent. 2016, 9, 315–326. [Google Scholar] [CrossRef]
  7. Spiru, P.; Simona, P.L. A review on interactions between energy performance of the buildings, outdoor air pollution and the indoor air quality. Energy Procedia. 2017, 128, 179–186. [Google Scholar] [CrossRef]
  8. EPA. An Office Building Occupants Guide to Indoor Air Quality. United States Environmental Protection Agency, 2017. Available online: https://www.epa.gov/indoor-air-quality-iaq/office-building-occupants-guide-indoor-air-quality (accessed on 19 October 2019).
  9. NASA. The Consequences of Climate Change. National Aeronautics and Space Administration, 2017. Available online: https://climate.nasa.gov/effects/ (accessed on 10 November 2019).
  10. Junaid, M.; Syed, J.H.; Abbasi, N.A.; Hashmi, M.Z.; Malik, R.N.; Pei, D.S. Status of indoor air pollution (IAP) through particulate matter (PM) emissions and associated health concerns in South Asia. Chemosphere 2017, 191, 651–663. [Google Scholar] [CrossRef] [PubMed]
  11. Jung, C.C.; Su, H.J.; Liang, H.H. Association between indoor air pollutant exposure and blood pressure and heart rate in subjects according to body mass index. Sci. Total Environ. 2016, 539, 271–276. [Google Scholar] [CrossRef] [PubMed]
  12. Ramalho, O.; Wyart, G.; Mandin, C.; Blondeau, P.; Cabanes, P.-A.; Leclerc, N.; Mullot, J.-U.; Boulanger, G.; Redaelli, M. Association of carbon dioxide with indoor air pollutants and exceedance of health guideline values. Build. Environ. 2015, 93, 115–124. [Google Scholar] [CrossRef]
  13. World Health Organization. Regional Office for Europe. In WHO Guidelines for Indoor Air Quality: Selected Pollutant; World Health Organization, Regional Office for Europe: Copenhagen, Denmark, 2010; ISBN 9789289002134. [Google Scholar]
  14. Risuleo, R.S.; Molinari, M.; Bottegal, G.; Hjalmarsson, H.; Johansson, K.H. A benchmark for data-based office modeling: Challenges related to CO2 dynamics. IFAC-PapersOnLine. 2015, 48, 1256–1261. [Google Scholar] [CrossRef]
  15. Mandin, C.; Trantallidi, M.; Cattaneo, A.; Canha, N.; Mihucz, V.G.; Szigeti, T.; Mabilia, R.; Perreca, E.; Spinazzè, A.; Fossati, S.; et al. Assessment of indoor air quality in office buildings across Europe—The OFFICAIR study. Sci. Total Environ. 2017, 579, 169–178. [Google Scholar] [CrossRef] [Green Version]
  16. Ye, W.; Zhang, X.; Gao, J.; Cao, G.; Zhou, X.; Su, X. Indoor air pollutants, ventilation rate determinants and potential control strategies in Chinese dwellings: A literature review. Sci. Total Environ. 2017, 586, 696–729. [Google Scholar] [CrossRef]
  17. Arar, S.; Al-Hunaiti, A.; Masad, M.H.; Maragkidou, A.; Wraith, D.; Hussein, T. Elemental Contamination in Indoor Floor Dust and Its Correlation with PAHs, Fungi, and Gram+/− Bacteria. Int. J. Environ. Res. Public Health 2019, 16, 3552. [Google Scholar] [CrossRef] [Green Version]
  18. Norhidayah, A.; Kuang, L.C.; Azhar, M.K.; Nurulwahida, S. Indoor air quality and sick building syndrome in three selected buildings. Procedia Eng. 2013, 53, 93–98. [Google Scholar] [CrossRef] [Green Version]
  19. ASHRAE. Indoor air quality guide. In Best Practices for Design, Construction, and Commissioning; American Society of Heating, Refrigerating and Air-conditioning Engineers (ASHRAE): Atlanta, GA, USA, 2009; ISBN 9781933742595. [Google Scholar]
  20. Jin, L.; Zhang, Y.; Zhang, Z. Human responses to high humidity in elevated temperatures for people in hot-humid climates. Build. Environ. 2017, 114, 257–266. [Google Scholar] [CrossRef]
  21. Liu, W.; Zhong, W.; Wargocki, P. Performance, acute health symptoms and physiological responses during exposure to high air temperature and carbon dioxide concentration. Build. Environ. 2017, 114, 96–105. [Google Scholar] [CrossRef] [Green Version]
  22. RFA. Carbon Dioxide (CO2) Safety Program; Renewable Fuels Association: Vancouver, WA, USA, 2015. [Google Scholar]
  23. Sohn, C.H.; Huh, J.W.; Seo, D.W.; Oh, B.J.; Lim, K.S.; Kim, W.Y. Aspiration pneumonia in carbon monoxide poisoning patients with loss of consciousness: Prevalence, outcomes, and risk factors. Am. J. Med. 2017, 130, 1465.e21–1465.e26. [Google Scholar] [CrossRef] [PubMed] [Green Version]
  24. Wolverton, B.C.; Johnson, A.; Bounds, K. Interior Landscape Plants for Indoor Air Pollution Abatement; NASA: Washington, DC, USA, 1989; p. 22.
  25. Ongwandee, M.; Moonrinta, R.; Panyametheekul, S.; Tangbanluekal, C.; Morrison, G. Investigation of volatile organic compounds in office buildings in Bangkok, Thailand: Concentrations, sources, and occupant symptoms. Build. Environ. 2011, 46, 1512–1522. [Google Scholar] [CrossRef]
  26. Sun, S.; Zheng, X.; Villalba-Díez, J.; Ordieres-Meré, J. Indoor Air-Quality Data-Monitoring System: Long-Term Monitoring Benefits. Sensor 2019, 19, 4157. [Google Scholar] [CrossRef] [Green Version]
  27. ASHRAE. Standards & Guidelines. American Society of Heating, Refrigerating and Air-Conditioning Engineers, 2017. Available online: https://www.ashrae.org/standards-research--technology/standards--guidelines (accessed on 30 September 2019).
  28. Fluke Corporation. Fluke 975 Air MeterTM, 2019. Available online: http://www.fluke.com/fluke/then/HVAC-IAQ-Tools/Air-Testers/Fluke-975.htm?PID=56156 (accessed on 3 August 2019).
  29. Almeida, R.M.S.F.; de Freitas, V.P.; Delgado, J.M.P.Q. School Buildings Rehablilitation: Indoor Environmental Quality and Enclosure Optimization; Springer International Publishing: Basel, Switzerland, 2015; pp. 35–83, ISSN 2191-530X; ISBN 978-3-319-15359-9. [Google Scholar] [CrossRef]
  30. Gubb, C.; Blanusa, T.; Griffiths, A.; Pfrang, C. Can houseplants improve indoor air quality by removing CO2 and increasing relative humidity? Air Qual. Atmos. Health 2018, 11, 1191–1201. [Google Scholar] [CrossRef] [Green Version]
  31. Alonso, M.J.; Andreson, T.; Frydenlund, F.; Widell, K.N. Improvement of air flow distribution in a freezing tunnel using Airpak. Procedia Food Sci. 2011, 1, 1231–1238. [Google Scholar] [CrossRef] [Green Version]
  32. Li, G.; She, C.; Wu, N.; Li, Z.; Wang, L. The solution and simulation of the condensation problem of the capillary network system in the children’s hospital in Shenyang in Summer. Procedia Eng. 2015, 121, 1215–1221. [Google Scholar] [CrossRef] [Green Version]
  33. Prueksakorn, K.; Piao, C.X.; Ha, H.; Kim, T. Computational and experimental investigation for an optimal design of industrial windows to allow natural ventilation during wind-driven rain. Sustainability 2015, 7, 10499–10520. [Google Scholar] [CrossRef] [Green Version]
  34. Habchi, C.; Ghali, K.; Ghaddar, N. Coupling CFD and analytical modeling for investigation of monolayer particle suspension by transient flows. Build. Environ. 2016, 105, 1–12. [Google Scholar] [CrossRef]
  35. Buratti, C.; Mariani, R.; Moretti, E. Mean age of air in a naturally ventilated office: Experimental data and simulations. Energy Build. 2011, 43, 2021–2027. [Google Scholar] [CrossRef]
  36. ASHRAE. ANSI/ASHRAE Standard 62.1-2016, Ventilation for Acceptable Indoor Air Quality; American Society of Heating, Refrigerating and Air-conditioning Engineers, the American National Standards Institute: Atlanta, GA, USA, 2016; ISSN 10412336. [Google Scholar]
  37. ASHRAE. ANSI/ASHRAE Standard 55-2017, Thermal Environmental Conditions for Human Occupancy; American Society of Heating, Refrigerating and Air-conditioning Engineers, the American National Standards Institute: Atlanta, GA, USA, 2017; ISSN 10412336. [Google Scholar]
  38. Boonyou, S.; Jitkhajornwanich, K. Enhancement of natural ventilation in office buildings in Bangkok. In Architecture, City, Environment: Proceedings of the PLEA 2000, Cambridge, UK, 2-5 July 2000; James & James (Science Publishers) Ltd.: London, UK, 2000. [Google Scholar]
  39. Busch, J.F. A tale of two populations: Thermal comfort in air-conditioned and naturally ventilated offices in Thailand. Energy Build. 1992, 18, 3–4. [Google Scholar] [CrossRef]
  40. Thai Meteorological Department: Meteorological Development Bureau, Summary of the Climate in Thailand 2017. 2018. Available online: https://www.tmd.go.th/programs/uploads/yearlySummary/สรุปสภาวะอากาศปี%202561.pdf (accessed on 13 February 2020). (In Thai).
  41. Klinmalee, A.; Srimongkol, K.; Kim Oanh, N.T. Indoor air pollution levels in public buildings in Thailand and exposure assessment. Environ. Monit. Assess. 2009, 156, 581–594. [Google Scholar] [CrossRef]
  42. Baklanov, A.; Molina, L.T.; Gauss, M. Megacities, Air quality and Climate. Atmos. Environ. 2016, 126, 235–249. [Google Scholar] [CrossRef]
  43. Thailand Greenhouse Gas Management Organization. Carbon Label and Carbon Footprint for Organization: Emission Factor. 2020. Available online: http://thaicarbonlabel.tgo.or.th/products_emission/products_emission.pnc (accessed on 28 February 2020). (In Thai).
  44. Cetin, M.; Sevik, H. Measuring the impact of selected plants on indoor CO2 concentration. Pol. J. Environ. Stud. 2016, 25, 973–979. [Google Scholar] [CrossRef]
  45. Parhizkar, H.; Khoraskani, R.A.; Tahbaz, M. Double skin façade with Azolla; ventilation, Indoor Air Quality and Thermal Performance Assessment. J. Clean. Prod. 2020, 249, 119313. [Google Scholar] [CrossRef]
  46. IPCC. Guidelines for National Greenhouse Gas Inventories. Intergovernmental Panel on Climate Change, 2006. Available online: http://www.ipcc-nggip.iges.or.jp/public/2006gl/ (accessed on 19 September 2019).
  47. TGO. Emission Factor Collected from Secondary Data for Carbon Footprint for Organization. Thailand Greenhouse Gas Management Organisation, 2017. Available online: http://thaicarbonlabel.tgo.or.th/admin/uploadfiles/emission/ts_11335ee08a.pdf (accessed on 1 October 2019).
Figure 1. Diagram of the office.
Atmosphere 11 00271 g001
Figure 2. Model of the room in Airpak.
Atmosphere 11 00271 g002
Figure 3. Monthly relative humidity (RH) data.
Atmosphere 11 00271 g003
Figure 4. Monthly Temperature data.
Atmosphere 11 00271 g004
Figure 5. Monthly CO data.
Atmosphere 11 00271 g005
Figure 6. Monthly CO2 data.
Atmosphere 11 00271 g006
Figure 7. Diurnal temperature in the ambient air and in the room during experiments.
Atmosphere 11 00271 g007
Figure 8. Diurnal relative humidity in the ambient air and in the room during experiments.
Atmosphere 11 00271 g008
Figure 9. The trend of 24-hour CO2 concentration and number of Sansevieria trifasciata.
Atmosphere 11 00271 g009
Figure 10. Assessment of air ventilation: mean age of air, (a) fan mounted on the ceiling was turned off (b) fan mounted on the ceiling was turned on.
Atmosphere 11 00271 g010
Table 1. Options for electricity saving scenario.
AppliancesUnitPower (watt)Working Time (hour)
Case ACase BCase C
Computer6 a450887 b
Printer c110111
Printer (standby)12.170 d0 d
Refrigerator190248 e8 e
AC1100087 f4 g
Fan13901 h4 h
Water dispenser1100888
Light32887 i7 i
Notes: Superscripts represent assumptions as follows: a the spare computer near the door was not in used; b all computers turned off during lunchtime; c not used continuously for printing; used for approximately one hour per day; d turned on only when in use; e no food kept in the office refrigerator overnight; f turned on from 09.00–12.00 and 13.00–17.00 (turned off during lunchtime); g turned on from 13.00-17.00; h turned on instead of AC; i turned off during lunchtime.
Table 2. Measurement results in the operational practices for the improvement of indoor air quality (IAQ).
ParametersCase 1
(Normal)
Case 2
(AC Turned off 12:00–13:00)
Case 3
(AC Turned off 9:00–13:00)
Case 4
(AC Turned off 9:00–17:00)
Maximum CO2 concentration (ppm)1167.09934.56904.21488.07
Average CO2 (± SD) concentration (ppm)785.05
(67.94)
759.30
(111.66)
700.75
(164.60)
472.10
(10.02)
Minimum CO2 concentration (ppm)556.13565.06526.60457.17
T (°C) Average Standard = 23–26 °C [38]25.326.127.933.8
RH (%) Average Standard = 65% [30]68.771.771.669.4
CO (ppm) Average Standard = 9 ppm [36]1.811.924.615.83
Table 3. Results of indoor air quality improvement using Sansevieria trifasciata.
Number of Plants0 Plants2 Plants3 Plants4 Plants5 Plants6 Plants
CO2 (ppm)Min491.15468.55470.87475.83467.92465.08
Avg681.32 ± 136.59549.91 ± 52.46531.52 ± 58.40583.48 ± 103.08588.22 ± 115.67609.98 ± 60.81
Max1133.301029.27770.12902.671072.431037.10
CO (ppm)Min0.970.980.980.980.950.90
Avg1.05 ± 0.061.20 ± 0.161.17 ± 0.131.14 ± 0.141.01 ± 0.031.00 ± 0.02
Max1.301.901.921.571.251.17
RH (%)Min52.0046.0062.0057.0064.0063.00
Avg64.23 ± 2.98140.53 ± 2.2166.00 ± 1.2367.29 ± 1.6769.11 ± 0.9268.07 ± 1.75
Max72.0072.0071.0070.0076.0073.00
T (°C)Min24.3824.5524.6124.1724.6524.58
Avg26.61 ± 1.7227.55 ± 1.7228.02 ± 1.4927.39 ± 1.9827.20 ± 1.8226.79 ± 1.73
Max28.6729.7229.6229.6429.5029.64
Table 4. Estimation of mitigations of greenhouse gas (GHG) emissions based on the electricity saving scenarios.
AppliancesCase ACase BCase C
ElectricitycostaGHGsb%%
PC5356.8604.43118.20.0−8.1
Printer5.00.62.90.00.0
Printer (standby)3.10.41.80.00.0
Refrigerator535.760.4311.8−4.3−4.3
AC1984.0223.81154.9−3.0−12.0
Fan0.00.00.00.10.5
Water dispenser198.422.4115.50.00.0
Light166.718.897.0−0.3−0.3
Total8249.6930.74802.1−7.5−24.3
Notes: Cases A, B, and C are detailed in Table 1. Superscripts: a electricity cost per unit varies from month to month. The cost was averaged from the annual bill based on a figure of 3.96 Baht per kWh; b The GWP is calculated based on IPCC guidelines [46]. The emission factor for electricity production in Thailand is 0.5821 kgCO2-eq [47].