Article

Characteristics, Secondary Formation and Regional Contributions of PM2.5 Pollution in Jinan during Winter

1
State Key Laboratory of Environmental Criteria and Risk Assessment, Chinese Research Academy of Environmental Sciences, Beijing 100012, China
2
Jinan Eco-environmental Monitoring Center of Shandong Province, Jinan 250000, China
*
Authors to whom correspondence should be addressed.
Atmosphere 2020, 11(3), 273; https://doi.org/10.3390/atmos11030273
Submission received: 9 February 2020 / Revised: 3 March 2020 / Accepted: 4 March 2020 / Published: 10 March 2020
(This article belongs to the Special Issue Future Energy Technologies and Photochemical Smog Formation)

Abstract

:
Air pollution is an increasing threat to human health in China. In this study, daily PM10 and PM2.5 samples were collected simultaneously at the Jinan Environmental Monitoring Station (EMS)in Jinan, China from 15 November 2016 to 15 March 2017. The aim of this work was to improve the understanding of the characteristics and sources of air particles and determine different levels of PM2.5 pollution and its constituent elements, water-soluble ions and carbonaceous species. Nitrate (NO3), organic materials (OM) and sulfate (SO42−) were identified as the three main components of PM2.5 pollution. With increasing pollution level, the contributions of SO42−, NO3 and NH4+ increased at greater rates, unlike that of OM. The proportion of SO42− exceeded that of NO3 and became predominant in severe PM2.5 pollution (SP; 250 μg m−3 ≤ PM2.5 ≤ 500 μg m−3). This work demonstrates that SO42− has a dominant role in SP level and, consequently, requires greater research attention. It is demonstrated that relative humidity (RH) enhances the rate of sulfate formation more than that of nitrate. Therefore, under the current Chinese emergency response measures, it is necessary to further reduce emissions of SO2 and NO2. Four clusters of backward trajectories identified dominant pollution vectors originating from highly industrialized areas that exacerbate the poor air quality in Jinan. It is, therefore, necessary to undertake regional control measures to reduce pollutant emissions.

1. Introduction

In recent years there have been frequent heavy pollution days in the central and eastern regions of China. Consequently, Chinese authorities and the public are increasingly demanding more stringent prevention and control measures for atmospheric pollution [1]. Serious air pollution not only lowers air quality but also negatively affects human health, both physically and mentally. Therefore, China’s continuously severe air pollution (SP) has caused wide public concern [2]. There have been many studies on air pollution in major areas of China [3,4,5,6,7,8,9,10,11], of which a large number have proven that secondary inorganic species play an important role in haze formation [3,4,9,10,11].
Jinan is located in central Shandong Province and is its capital city. The city extends south to Mount Tai (which is the province’s highest peak at 1000 m) and north to the Yellow River. Jinan City is located close to the Beijing-Tianjin-Hebei (BTH) region and transmits atmospheric pollution to it. The air pollution in Jinan can affect the BTH area and is also affected by surrounding cities.
Previous research has mainly focused on airborne particulate chemical compositions and characteristics, particle size fractions, potential source analyses and health risks in Jinan in recent years [12,13,14,15,16]. Wang et al. (2012) studied the secondary formation of inorganic aerosols in droplet mode through heterogeneous aqueous reactions under haze conditions [12]. Gu et al. (2014) investigated airborne fine particulate pollution in terms of chemical compositions, possible sources and mass closure analysis of PM2.5 in Jinan. They identified the major emission sources in Jinan to be coal combustion, biomass burning, secondary sulfates, soil dust, secondary nitrates and vehicle emissions [16]. Cheng et al. (2011) used the potential source contribution function (PSCF) model to analyze the mass concentrations and major chemical components of PM2.5 in Jinan from December 2004 to October 2008, which confirmed the potential local and regional sources of secondary sulfates and nitrates in PM2.5 in Jinan [17]. However, few studies have specifically addressed PM2.5 fine particles at different pollution levels throughout winter in Jinan.
In this study, the temporal-spatial variations in different PM2.5 pollution levels were comprehensively analyzed based on the whole period when people heat their homes in Jinan, from 15 November 2016 to 15 March 2017. The role of meteorological parameters in the formation and evolution of PM2.5 pollution episodes was investigated in Jinan during winter. We also attempted to identify the constituents most responsible for explosive growth in PM2.5 concentrations. Eight severe pollution days were identified, which showed that sulfates dominate the fine particle pollutants in severely polluted conditions in Jinan in winter. Finally, we analyzed 24 h backward trajectories and determined the regional transport effect on Jinan.

2. Experiments

2.1. Site Location and Data Collection

The terrain in Jinan is higher in the south and lower in the north, which is not conducive to the dispersal of pollutants. The total area is 8177 km2 and the resident population is about 7.132 million. The number of motor vehicles is 2.065 million, with an annual growth rate exceeding 10% in recent decades. In 2017, the concentrations of PM10, PM2.5, SO2, NO2, CO and O3 in the ambient air of Jinan City were 130 μg m−3, 63 μg m−3, 25 μg m−3, 46 μg m−3, 2.1 mg m−3 and 190 μg m−3, respectively [18]. These PM10, PM2.5, NO2 and O3 concentrations exceed the National Ambient Air Quality Standard’s (GB 3095-2012) secondary standard by 0.9, 0.8, 0.2 and 0.2 times, respectively. Compared to 2016, the concentrations of PM10, PM2.5 and SO2 decreased, the concentration of CO increased, and the concentrations of NO2 and O3 remained basically the same. Jinan ranked in the bottom 10 out of 74 key environmental protection cities in 2017 in terms of air quality [18]. According to the 2017 Jinan Environmental Quality Brief, PM10 was the primary pollutant on 38% of days, which is the highest proportion of all pollutants.
As shown in Figure 1, the sampling site was located on the rooftop of the Jinan Environmental Monitoring Station (EMS) (36°39′47″ N,117°3′18″ E) at about 20 m above ground level and was compliant with HJ 194-2017(Technical specifications on manual methods for ambient air quality monitoring). The site is in an urban area where the surrounding traffic is relatively dense and there are no major industrial plants. The air pollution source and observation data obtained here were taken to represent the level of air pollution in the urban area of Jinan.
PM2.5 and PM10 samples were collected simultaneously from 15 November 2016 to 15 March 2017 using an automatic sampling system (PNS 16T-3.1, Comde-Derenda, Stahnsdorf, Germany). This equipment is produced by Comde-Derenda (Wuxi) Measuring Technologies Ltd and meets the atmospheric environment sampling standards of China (HJ 618-2011, HJ 656-2013, HJ 93-2013). This system can continuously monitor particulate matter (PM10, PM2.5, etc.) with an automatic filter changer (φ 47 mm). The sampling time was 23 h (09:00–08:00 the next day) and the sampling flow was 16.7 L/min. The volumetric flow rate was measured with an orifice plate and electronically adjusted with an accuracy of ≤2%.

2.2. Weighing and Chemical Analysis

Quartz fiber and Teflon (φ 47 mm, Whatman) filters were used in this study. A detailed description of sample filter weighing has been presented in previous work (HJ618-2011, HJ656-2013) [19]. Organic carbon (OC) and elemental carbon (EC) concentrations were measured by the IMPROVE thermal optical reflectance method with a DRI Model 2001A [20]. A Thermo Dionex ICS-1500 and ICS-2000 were used to analyze water-soluble anions (F, Cl, NO3 and SO42−) and cations (Na+, NH4+, K+, Mg2+ and Ca2+) according to Zhao et al. [19]. Metal elements (Na, K, As, Cd, Cr, Pb, Mn, Ni, Se, Zn, Co, Cu, V) were measured by ICP-MS (Agilent 7900, USA). Elements Si, Al, Ca, Mg, Fe, Ti and Ba were measured by ICP-OES (Vista-MPX, USA), with a detailed description of the method given by Zhang [21]. Some 110 PM2.5 and 107 PM10 filters were analyzed for mass, water-soluble ions, OC/EC and elements.
The pollution conditions in Jinan were divided into five categories as follows. Using the Technical Regulation on Ambient Air Quality Index, we categorized PM2.5 conditions as clean (C; PM2.5 ≤ 75 μg m−3), slightly polluted (S; 75 μg m−3 < PM2.5 ≤ 115 μg m−3), moderately polluted (M; 115 μg m−3 < PM2.5 ≤ 150 μg m−3), heavily polluted (HP; 150 μg m−3 < PM2.5 ≤ 250 μg m−3) and severely polluted (SP; 250 μg m−3 < PM2.5 ≤ 500 μg m−3).
Atmospheric particulate matter mass reconstruction can estimate the effects of aerosols from different sources on ambient air quality based on the proportions of compounds in different components [22]. In this study, the chemical mass reconstruction method was used to classify organic matter (OM), EC, mineral dust (MD), trace elements (TE), SO42−, NO3, NH4+ and Cl in PM2.5. The mass of MD was estimated on the basis of oxides of Al, Si, Ca, Fe, Ti, K and Mg as follows [11]:
MD = [1.89 × Al] + [2.14 × Si] + [1.4 × Ca] + [1.43 × Fe] + [1.67 × Ti] + [1.2 × K] + [1.66 × Mg].
The OM content included undetected H, S, N and O and was estimated by multiplying the OC content by a conversion factor (CF) corresponding to the organic molecular carbon weight per carbon weight. The CF ranged from 1.6 to 2.1. In previous work [22,23,24], CFs of 1.6 ± 0.2 appear to be more accurate for urban aerosols [23]. In Jinan, CFs of 1.4 and 1.8 have been used for urban research before [16,25]. The OM was estimated to be 1.4 times the OC according to our previous study in Jinan [16]. In MD, except for the above elements, the sum of all other element concentrations was defined as the TE concentration. “Other” were considered unidentified mass, measurement or experimental errors et al [26].

3. Results

3.1. General Characteristics of PM2.5 Pollution in Winter

Figure 2 presents the variations in the PM2.5 concentration and main chemical composition from 15 November 2016 to 15 March 2017. The range of PM2.5 concentrations was large at 16.5–413.6 μg m−3, and the average mass concentrations of PM2.5 during the sampling period were 107.1 ± 75.4 μg m−3. It is obvious that there are two extreme PM2.5 peaks in Figure 2 coinciding with high concentrations of SO42−. The general features of the main PM2.5 components during the sampling periods are listed in Table 1. The main component in PM2.5 was NO3, with an average concentration ± standard deviation of 21.9 ± 15.6 μg m−3. The second-highest proportions were of SO42− and OM, at concentrations of 19 ± 21.2 and 19 ± 11.4 μg m−3. Therefore, NO3, SO42− and OM are the three major species of PM2.5. On average, PM2.5 accounted for 62% of PM10, which indicates that atmospheric particulate matter pollution was mainly dominated by PM2.5 in Jinan during winter. The high percentage of PM2.5 infers that the primary source is of combustion/secondary aerosol origin, as there was a low fraction of crustal material. Some 110 valid samples were collected during the sampling period, and there were 45, 30, 16, 11 and 8 days of C, S, M, HP and SP PM2.5 pollution, respectively. Eight heavy pollution days were identified as18–20 November 2016 and 2, 4–6, and 18 January 2017.
Figure 3 displays a PM2.5 composition spectrum characteristic diagram. NO3 (21.9 μg m−3), SO42− (19.0 μg m−3), OC (13.6 μg m−3) and NH4+ (11.6 μg m−3) were the four dominating components and comprised nearly 60% of the total mass. In addition, a correlation analysis between PM2.5, gaseous pollutants and meteorological parameters is shown in Table S1. PM2.5 exhibited good positive relationships with CO, SO2, NO2 and RH, but not O3, which is consistent with previous results [8,27].
The mass closures of PM2.5 are presented in Figure 4. According to the results of PM2.5 reconstruction, NO3, OM and SO42− were the three main components in the constructed PM2.5 and, on average, accounted for 19.9%, 19.1% and 15.7% of the total PM2.5, respectively. There were almost the same proportions of MD and NH4+, at 10.2% and 9.9%, respectively. The small fraction of MD is consistent with the inferred result that there was a high percentage of PM2.5. The proportion of EC (5.0%) in PM2.5 was slightly greater than that of Cl (4.1%). Other unanalyzed substances, such as water, or experimental analysis errors [26], accounted for 14.8% of the PM2.5.

3.2. Chemical Compositions of Different Pollution Levels

The mass concentrations of OM, EC, MD, TE, SO42−, NO3, NH4+ and Cl increased with increasing concentrations of PM2.5; however, their proportions varied. Figure 5 lists the average percentages of the main constituents in PM2.5 at different pollution levels. Differences from the C-level to SP-level are noticeable, especially for OM, SO42− and NO3. As shown in Figure 5, the average proportion of OM declined consistently as the pollution level increased. This decrease in OM from the C to HP level in Jinan in winter is the same at that observed in Beijing [28,29], indicating that there is a decreasing contribution of carbonaceous matter with increasingly severe pollution levels. The average percentages of NO3 in the five pollution categories (from lowest to highest) were 16.9%, 21.8%, 22.9%, 24.8% and 15.9%. The peak value coincides with HP level pollution, which suggests an inverted V-shaped trend in the dataset. Figure S1 emphasizes the changes in the proportions of SO42− and NO3 over the whole sampling period. Figure S1b also shows an inverted V-shaped curve. The potential origin of this unusual relationship is that higher PM2.5 levels suppress the NO3 formation rate. A detailed discussion can be seen in Section 4.2. The average proportions of SO42− and NH4+ increased relative to that of NO3. From the HP to SP pollution levels, the percentage of SO42− increased from 18.6% to 24.6%, or about 6.0%. The NH4+ proportion showed a small increase with pollution level, while that of Cl remained approximately constant. Other proportion had small increases up to the HP level and more obvious increases from HP to SP. These may be attributed to measurement errors, improper multiplier(s), missing source(s) and particle-bound water [26]. PM2.5 pollution becomes more hygroscopic, with abundant inorganic water-soluble ions, as RH increases [30]. Particle-bound water in PM2.5 maybe the “other” species that caused a significant increase in its concentration at high PM2.5 concentrations. All these data indicate that the formation of heavy haze is mainly promoted by secondary inorganic species, especially SO42−.
The most obvious chemical composition characteristic in PM2.5 was that the concentration and mass percentage of SO42− increased significantly from the HP to SP level and far exceeded those of NO3. Hence, SO42− became the greatest constituent during the serious pollution event. This result indicates that the regulation and reduction of SO42− gas precursors during heavy pollution events are extremely important.
Although eight serious PM2.5 pollution days were observed, all the data show that sulfate contributed most to severe PM2.5 pollution. The molar ratio of ammonium to sulfate was used to infer their existent forms in the particles. As shown in Table S2, the concentration of NH4+ was strongly correlated with those of SO42− and NO3, with Spearman correlation coefficients of 0.94 and 0.90, respectively. Therefore, NH4+ neutralized SO42− first. In the atmosphere, if NH4+ and SO42− are combined into (NH4)2SO4, the molecular ratio of NH4+ and SO42− would be 2:1. If only NH4HSO4 was formed, the molecular ratio would be 1:1 [31]. In this study, the average molecular concentration of ρ(NH4+)/ρ(SO42−) was 3.5 ± 1.0, with values of 3.3, 3.8, 3.7, 3.3 and 2.8 for pollution levels C, S, M, HP and SP, respectively. The Spearman correlation coefficient of NH4+ and Cl was 0.58, so NH4+ neutralized SO42− to form (NH4)2SO4, while the remaining NH4+ combined with NO3 and Cl to generate NH4NO3 and NH4Cl.

4. Discussion

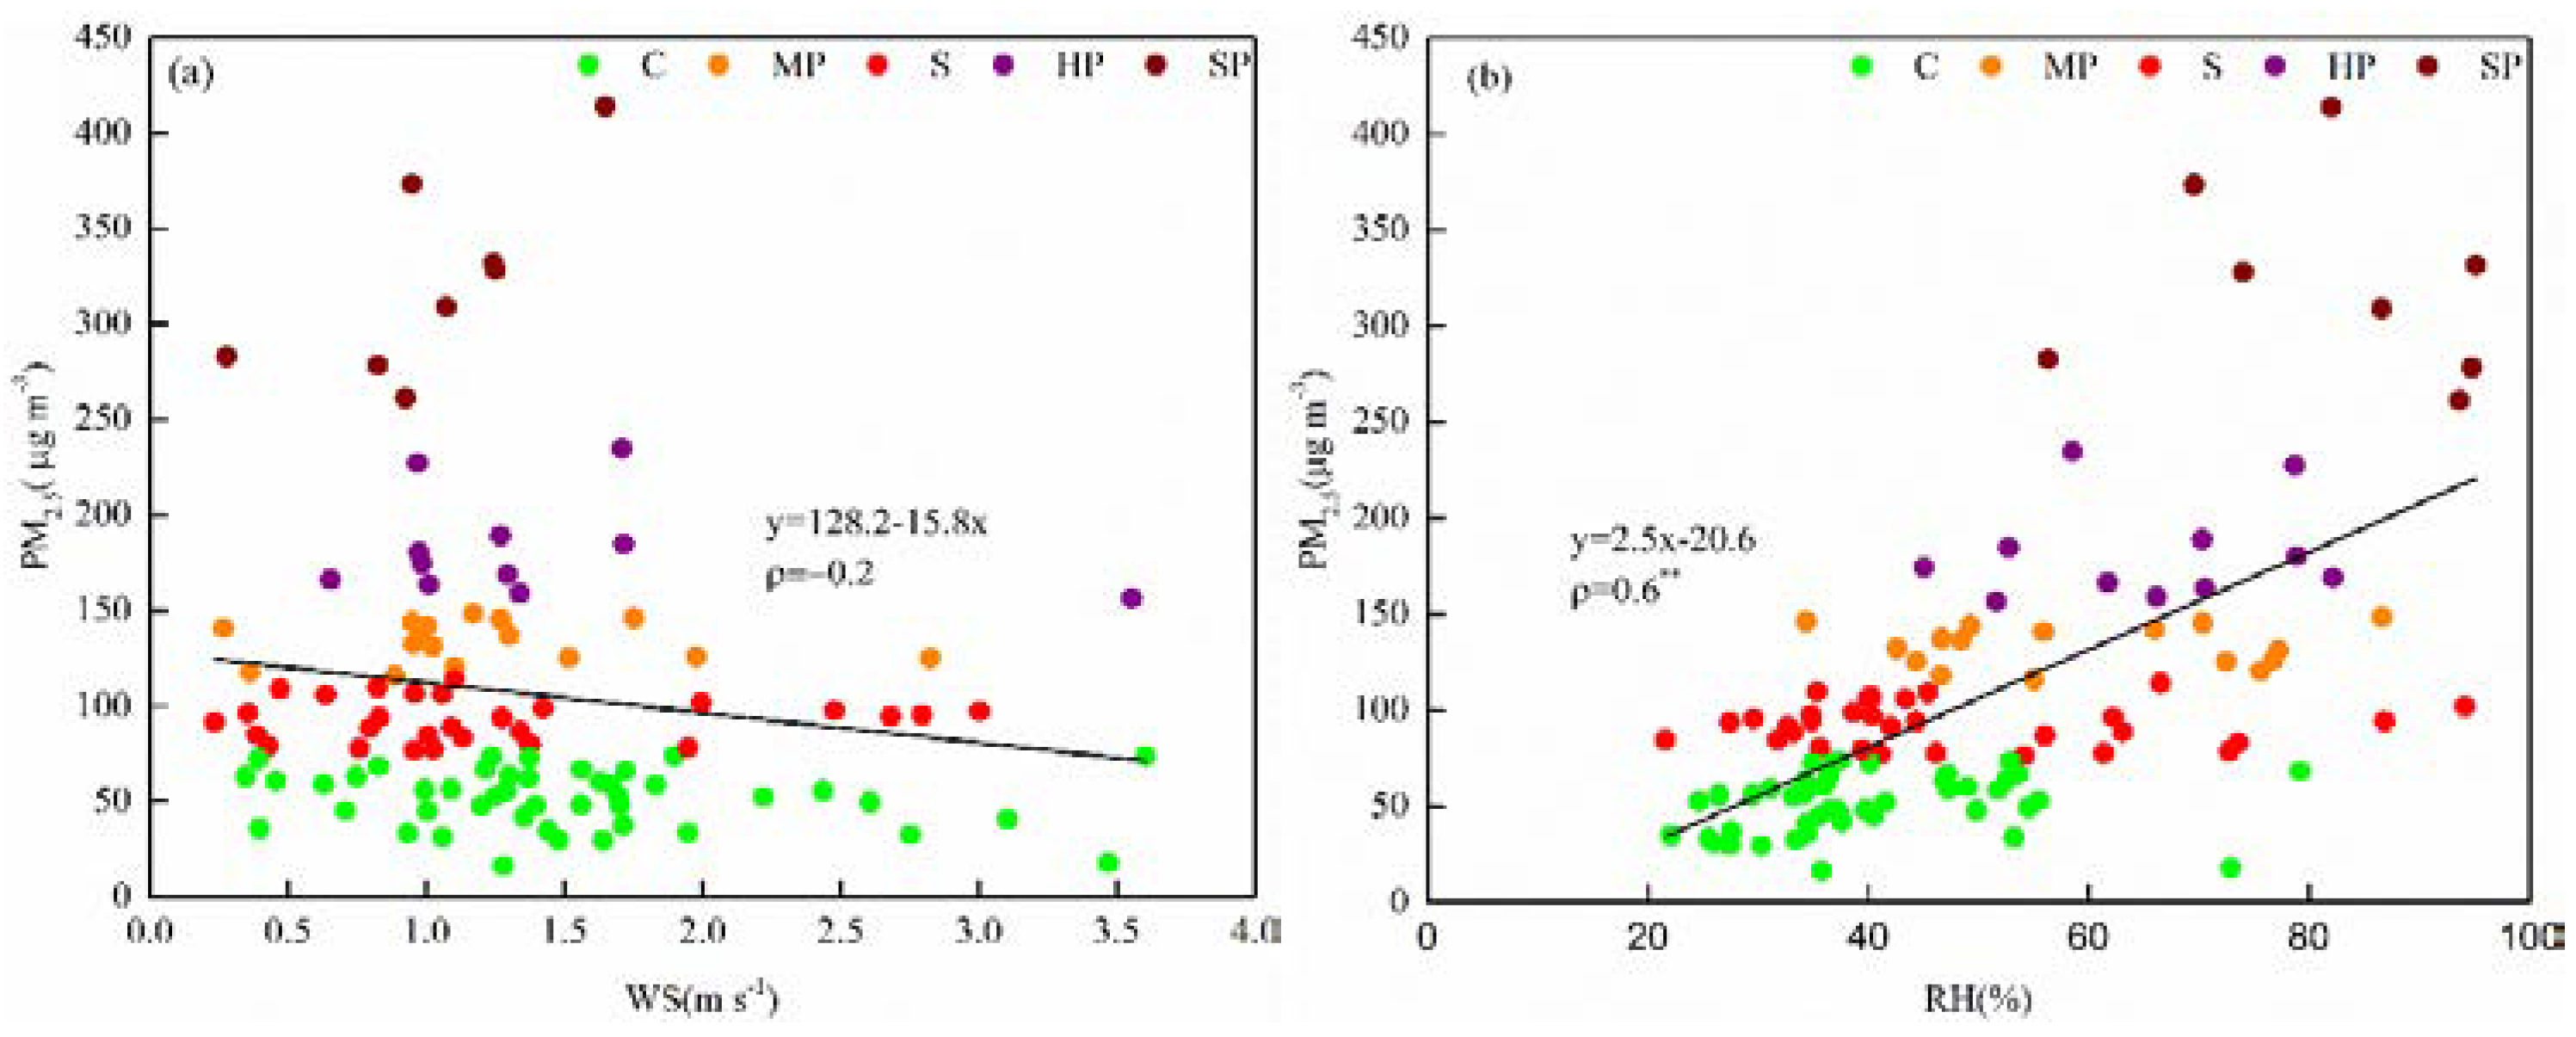
4.1. Meteorological Conditions

Wind speed (WS) and relative humidity (RH) are the most important meteorological factors influencing the mass concentrations of PM2.5, as demonstrated in previous studies [10,11]. In this study, RH and WS had great impacts on PM2.5, which is consistent with the study of Tian [11]. PM2.5 concentrations (Figure 6a) showed a decreasing dependence on WS but increasing dependence on RH (Figure 6b). As shown in Figure 6, WS was an influential factor and had a negative relationship with PM2.5 concentration, with a Spearman correlation coefficient (ρ) of 0.2. Compared with WS, RH had a greater impact on PM2.5 concentration and was positively correlated with it (ρ = 0.6).
Figure 7 shows the relationships between RH and the proportions of SO42− and NO3 in PM2.5. The ratio of SO42− obviously increased with increasing RH in PM2.5, with ρ = 0.7. As shown in Figure 7b, the low coefficient values seem to indicate that RH is slightly positively related to nitrate. Aqueous reactions may make a more significant contribution to the formation of sulfate than of nitrate with increasing PM2.5 concentration. Hence, high RH was more favorable for the formation of sulfate. In this study, Figure 7 demonstrates that hygroscopic secondary inorganic ions significantly increased with increasing RH during winter, which is consistent with previous studies [10,32].

4.2. Secondary Formation

Sulfate and nitrate mainly originate from the conversion of SO2 and NO2 gaseous precursors [33]. The sulfate oxidation rate (SOR) and nitrate oxidation rate (NOR) were used to evaluate the degrees of SO2 and NO2 conversion in the atmosphere. The larger the SOR and NOR values, the more SO2 and NO2 are converted to sulfate and nitrate. A value of SOR > 0.1 is often used to indicate the presence of secondary conversion [34,35]. SOR and NOR were calculated based on the following formulas: SOR = n-SO42−/(n-SO42− + n-SO2) and NOR = n-NO3/(n-NO3 + n-NO2), where n-SO42−, n-SO2, n-NO3 and n-NO2 represent the molecular concentrations of sulfate, sulfur dioxide, nitrate and nitrogen dioxide, respectively.
Figure 8 presents the relationships between the daily average values of SOR, NOR, RH and O3 in PM2.5. SOR and NOR demonstrate opposite trends with RH and O3. The concentration of O3 decreased with increasing RH, indicating weak photochemical reactivity. At RH < 40%, there was a lesser influence of SOR, but SOR increased rapidly from <0.2 up to nearly 0.5 at RH > 60% in PM2.5. At the same time, we quantified the molecular ratio of SO42− to SO2, which reflects sulfur partitioning between the particle and gas phases in PM2.5. This had the same trend as that of SOR to RH, as shown in Figure S2. Similar SO42− evolution has been observed in Xi’an and Beijing [36]. Figure 8b shows that O3 contributed more to NOR than RH in PM2.5, as the trend in O3 was consistent with that of NOR at RH < 60%.
Meteorological conditions were recorded by the EMS during the sampling period. The average ozone (O3) concentrations at the EMS were 40.4, 45.5, 29.6, 29.0 and 7.7 μg m−3 for pollution levels of C to SP, while RH levels were 40.1%, 47.4%, 59.3%, 65.1% and 81.5%, respectively. The average SOR values from the C to SP pollution levels were 0.09, 0.13, 0.20, 0.24 and 0.33, while those of NOR were 0.11, 0.21, 0.24, 0.30 and 0.27, respectively. We can see that the formation rate of NO3 was faster than that of SO42− from the C-level to HP-level; however, differences occurred at the SP-level. With decreases in O3 concentration accompanied by increases in RH, the NO3 formation rate was slower than that of SO42− at the SP-level. SO42− can be formed through oxidation of SO2 by hydroxyl radicals in a gas phase reaction or by oxidants (e.g. H2O2, O3) in an aqueous phase reaction [37]. Nitrate is predominantly formed by the gas-phase reaction of NO2 and OH radicals and by heterogeneous reactions of nitrate radicals (NO3) [38]. With increases in pollution level, photochemical reactions in the gas phase are suppressed [10]. RH plays an important role in SO2 conversion, which is consistent with the relationship between SO42− and RH (Figure 7a and Figure S2). It is further suggested that this part of SO42− increases due to aqueous phase secondary formation at the SP-level. However, the oxidation of NO2 was weakened. Concentrations of NO2 and SO2 increases by 30% and 50% respectively from the HP to SP level. Figure 5 shows that nitrate and sulfate concentrations increased by 13% and 131% from the HP to SP level, respectively. NO2 is not only a precursor of nitrate but is also an important oxidant in sulfate formation during severe pollution days [39]. This can also explain the trends in nitrate and sulfate concentrations from the HP to SP level. Thus, the dual functions of RH and NO2 accelerate the formation of sulfate during SP-level pollution.

4.3. Regional Transport

In order to study the impact of regional transport on Jinan (36°39′47″ N, 117°3′18″ E) at the different pollution levels, 24 h backward trajectories from 15 November 2016 to 15 March 2017 were calculated. An altitude of 100 m AGL was set as the average flow field of the atmospheric boundary layer of the study area and start times of 00:00, 06:00, 12:00 and 18:00 UTC each day were used. The backward trajectory clusters were calculated by the TrajStat model, which is a plugin in MeteoInfo [40], and 472 effective trajectories of the simulation were clustered. There were 286 “polluted trajectories” during days where the PM2.5 concentration was >75 μg m−3. Four main transmission paths were obtained. The hourly PM2.5 concentration data were imported into the TrajStat model obtained from the Municipal Environmental Monitoring Centre.
As shown in Figure 9 and Table S3, cluster 1, accounting for the largest trajectories (27.1%), came from the southwestern Shandong Province, Jining, Zaozhuang and Xuzhou, and the transmission distance was relatively short. The average mass concentration of PM2.5 in cluster 1 was 114.4 μg m−3, of which the number of PM2.5 pollution trajectories accounted for 36.4% of the 286 polluted trajectories. Cluster 2 came from the northeastern part of Beijing, Chengde and Tianjin to Jinan. The transmission distance was the longest and the air mass movement was the fastest. The average PM2.5 concentration was 63.4 μg m−3. It was the least polluted trajectory of the four clusters, only accounting for 10.8% of the particulate pollution during this investigation. Cluster 3 came from the eastern coastal (Bohai) direction, reaching Jinan via Dongying and Zibo, and accounted for 26.9% of the total number of trajectories. Dongying and Zibo are highly industrialized with abundant petroleum resources and ceramic industries. The average PM2.5 concentration reached a maximum level of 148.5 μg m−3, which was the result of enriched emissions of primary pollutants in cluster 3. The PM2.5-polluted trajectories accounted for 32.9% of the total polluted trajectories. Cluster 3 was the most polluted trajectory of the four types of air mass. In addition, the RH was high in this air mass because it came from Bohai, which may have further facilitated secondary conversion. Cluster 4 came from Liaocheng and the average PM2.5 mass concentration was 126.0 μg m−3, accounting for 19.7% of the total number of trajectories. The PM2.5-pollution trajectories accounted for 19.9% of the total number of polluted trajectories.
Winter air pollution in Jinan is likely to mostly come from these surrounding areas, given their high-emission intensities. Jinan is located in the central part of Shandong Province between 36°01′ and 37°32′ N latitude and 116°11′ to 117°44′ E longitude, which is about 420 km from Beijing. Jinan and its surrounding cities can influence each other. Previous studies have shown that Shandong Province is the most important contributor to particulate matter pollution in Tianjin [41]. In April 2017, China implemented the National Research Program for Key Issues in Air Pollution Control, China. The main causes of heavy pollution in the BTH region and surrounding areas have been determined to be local accumulation, regional transport and secondary formation [42]. This heavy pollution episode in Jinan is a comprehensive result of multiple causes rather than a single one. Hence, to effectively reduce pollution, regional joint prevention is necessary and inevitable.

5. Conclusions

The chemical characteristics and formation of five different PM2.5 pollution levels were investigated in winter, from 15 November 2016 to 15 March 2017, in Jinan, along with local meteorological parameters. Sulfate was observed to have a dominant role in severe PM2.5 pollution.
Daily PM2.5 concentrations varied from 16.5 to 413.6 μg m−3 with a mean ± SD of 107.1 ± 75.4 μg m−3. The three main components in PM2.5 pollution were NO3, OM and SO42− which, on average, accounted for 19.9%, 19.1% and 15.7% of the total PM2.5, respectively. The fraction of OM decreased (from 21.2% to 14.6%) and the proportion of SO42− increased (from 13.6% to 24.6%) as the pollution level increased from the C-level to SP-level, while that of NO3 had an inverted V-shaped relationship with pollution level and peaked with HP-level pollution (NO3 proportions = 16.9%, 21.8%, 22.9%, 24.8% and 15.9% with increasing pollution levels, respectively). The most obvious PM2.5 characteristic was that the concentration and mass percentage of SO42− increased significantly from the HP to SP level and far exceeded those of NO3, thereby becoming the largest constituent of SP-level PM2.5 pollution.
The RH increased according to PM2.5 pollution level, which is favorable for the formation of inorganic species. As the RH increased, so did the proportion of sulfate in PM2.5. The proportion of NO3 appeared to have a minor increasement as RH increases. SOR and NOR demonstrated opposite variations with RH and O3. The linear relationship between SOR and RH was similar to that between SO42− and RH in PM2.5. The variation in NOR was the same as that of nitrate. At the HP to SP level, RH was more favorable to sulfate conversion than to nitrate. RH increased with decreases in O3, which is more favorable for the aqueous phase formation of sulfate. At the same time, NO2, an important oxidant, was favorable to sulfate formation, leading to faster sulfate production and worsening air pollution in a repeating cycle. Therefore, according to current emergency response measures, it is necessary to further reduce the emissions of SO2 and NO2.
Finally, 24 h air mass backward trajectories were determined to study the impact of regional transport on Jinan at different pollution levels. Four clusters were obtained, indicating that 26.3% of the air mass came from the north and was relatively clean. The other three clusters, which were the main transmission paths affecting air quality in Jinan, came either from a coastal area or highly industrialized cities. They accounted for 73.7% of the total air trajectories and had slow air mass movement.
In general, RH corresponds with higher PM2.5 concentrations and more gaseous pollutants, leading to faster sulfate production and more severe haze pollution in Jinan in winter. Meanwhile, pollution in Jinan is also affected by regional transport, especially from other cities in Shandong Province. The Chinese government has begun to undertake regional collaboration to effectively control pollution emissions in the BTH and surrounding cities. As an important city in the BTH pollution transmission channel, Jinan should start reducing its emissions.

Supplementary Materials

The following are available online at https://www.mdpi.com/2073-4433/11/3/273/s1. Table S1. Correlation analysis between PM2.5, gaseous pollutants and meteorological parameters; Table S2. Matrix of correlation coefficients between different ions in PM2.5; Table S3. The concentration and proportion of PM2.5 in each cluster; Figure S1. Relationship between the proportion of SO42−, NO3 and PM2.5 concentrations; Figure S2. Relationship between molecular ratio of SO42−/SO2 and RH in PM2.5

Author Contributions

Conceptualization: Y.L. and W.Y.; formal analysis: Y.L., J.W., X.Z. and X.W.; investigation: Y.L., X.W. and L.H.; methodology: B.H.; project administration: Y.L. and W.Y.; resources: J.W.; software: B.H.; supervision: W.Y.; visualization: Y.L.; writing (original draft): Y.L., J.W. and L.H.; writing (review and editing): Y.L., X.Z., X.W., W.Y., B.H. and Z.B. All authors have read and agreed to the published version of the manuscript.

Funding

This research was funded by the Development and Demonstration of Road Dust Monitoring and Management System (Z191100009119011), National Research Program for Key Issues in Air Pollution Control, China (No.DQGG0107-19), the Shandong Science and Technology Development Plan Project (2014GSF117038) and the Jinan Science and Technology Plan Project (201509001-2).

Acknowledgments

We would like to thank everyone who has supported and helped this project.

Conflicts of Interest

The authors declare no conflicts of interest.

References

  1. Fu, H.; Chen, J. Formation, features and controlling strategies of severe haze-fog pollutions in China. Sci. Total Environ. 2017, 578, 121–138. [Google Scholar] [CrossRef] [PubMed]
  2. Dui, W. Hazy weather research in China in the last decade: A review. Acta Sci. Circumstantiae 2012, 32, 257–269. [Google Scholar] [CrossRef]
  3. Han, S.-Q.; Wu, J.-H.; Zhang, Y.-F.; Cai, Z.-Y.; Feng, Y.-C.; Yao, Q.; Li, X.-J.; Liu, Y.-W.; Zhang, M. Characteristics and formation mechanism of a winter haze–fog episode in Tianjin, China. Atmos. Environ. 2014, 98, 323–330. [Google Scholar] [CrossRef]
  4. Hu, Q.; Fu, H.; Wang, Z.; Kong, L.; Chen, M.; Chen, J. The variation of characteristics of individual particles during the haze evolution in the urban Shanghai atmosphere. Atmos. Res. 2016, 181, 95–105. [Google Scholar] [CrossRef]
  5. Huang, X.; Liu, Z.; Zhang, J.; Wen, T.; Ji, D.; Wang, Y. Seasonal variation and secondary formation of size-segregated aerosol water-soluble inorganic ions during pollution episodes in Beijing. Atmos. Res. 2016, 168, 70–79. [Google Scholar] [CrossRef]
  6. Lai, S.C.; Zhao, Y.; Ding, A.J.; Zhang, Y.Y.; Song, T.L.; Zheng, J.Y.; Ho, K.F.; Lee, S.C.; Zhong, L.J. Characterization of PM2.5 and the major chemical components during a 1-year campaign in rural Guangzhou, Southern China. Atmos. Res. 2016, 167, 208–215. [Google Scholar] [CrossRef]
  7. Wu, Y.; Ge, X.; Wang, J.; Shen, Y.; Ye, Z.; Ge, S.; Wu, Y.; Yu, H.; Chen, M. Responses of secondary aerosols to relative humidity and photochemical activities in an industrialized environment during late winter. Atmos. Environ. 2018, 193, 66–78. [Google Scholar] [CrossRef]
  8. Sun, Z.; Mu, Y.; Liu, Y.; Shao, L. A comparison study on airborne particles during haze days and non-haze days in Beijing. Sci. Total Environ. 2013, 456–457. [Google Scholar] [CrossRef] [PubMed]
  9. Li, H.; Ma, Y.L.; Duan, F.K.; He, K.B.; Zhu, L.D.; Huang, T.; Kimoto, T.; Ma, X.; Ma, T.; Xu, L.L.; et al. Typical winter haze pollution in Zibo, an industrial city in China: Characteristics, secondary formation, and regional contribution. Environ. Pollut. 2017, 229, 339–349. [Google Scholar] [CrossRef]
  10. Xu, L.; Duan, F.; He, K.; Ma, Y.; Zhu, L.; Zheng, Y.; Huang, T.; Kimoto, T.; Ma, T.; Li, H.; et al. Characteristics of the secondary water-soluble ions in a typical autumn haze in Beijing. Environ. Pollut. 2017, 227, 296–305. [Google Scholar] [CrossRef]
  11. Tian, S.L.; Pan, Y.P.; Liu, Z.R.; Wen, T.X.; Wang, Y.S. Size-resolved aerosol chemical analysis of extreme haze pollution events during early 2013 in urban Beijing, China. J. Hazard. Mater. 2014, 279, 452–460. [Google Scholar] [CrossRef] [PubMed]
  12. Wang, X.; Wang, W.; Yang, L.; Gao, X.; Nie, W.; Yu, Y.; Xu, P.; Zhou, Y.; Wang, Z. The secondary formation of inorganic aerosols in the droplet mode through heterogeneous aqueous reactions under haze conditions. Atmos. Environ. 2012, 63, 68–76. [Google Scholar] [CrossRef]
  13. Lv, C.; Wang, X.; Pang, N.; Wang, L.; Wang, Y.; Xu, T.; Zhang, Y.; Zhou, T.; Li, W. The impact of airborne particulate matter on pediatric hospital admissions for pneumonia among children in Jinan, China: A case-crossover study. J. Air Waste Manag. Assoc. 2017, 67, 669–676. [Google Scholar] [CrossRef] [PubMed]
  14. Chen, Q.; Wang, M.; Sun, H.; Wang, X.; Wang, Y.; Li, Y.; Zhang, L.; Mu, Z. Enhanced health risks from exposure to environmentally persistent free radicals and the oxidative stress of PM2.5 from Asian dust storms in Erenhot, Zhangbei and Jinan, China. Environ. Int. 2018, 121, 260–268. [Google Scholar] [CrossRef] [PubMed]
  15. Dong, C.; Yang, L.; Yan, C.; Yuan, Q.; Yu, Y.; Wang, W. Particle size distributions, PM2.5 concentrations and water-soluble inorganic ions in different public indoor environments: A case study in Jinan, China. Front. Environ. Sci. Eng. 2013, 7, 55–65. [Google Scholar] [CrossRef]
  16. Gu, J.; Du, S.; Han, D.; Hou, L.; Yi, J.; Xu, J.; Liu, G.; Han, B.; Yang, G.; Bai, Z.-P. Major chemical compositions, possible sources, and mass closure analysis of PM2.5 in Jinan, China. Air Qual. Atmos. Health 2014, 7, 251–262. [Google Scholar] [CrossRef]
  17. Cheng, S.; Yang, L.; Zhou, X.; Wang, Z.; Zhou, Y.; Gao, X.; Nie, W.; Wang, X.; Xu, P.; Wang, W. Evaluating PM2.5 ionic components and source apportionment in Jinan, China from 2004 to 2008 using trajectory statistical methods. J. Environ. Monit. 2011, 13, 1662–1671. [Google Scholar] [CrossRef]
  18. Jinan Environmental Quality Brief of 2017; Jinan Environmental Protection Bureau: Jiana, China, 2017.
  19. Zhao, X.; Gu, C.; Yang, H.; Wang, J.; Yang, W.; Wang, X.; Bai, Z. Chemical composition and source apportionment of PM2.5 during a winter air pollution episode in the KuiDu-Wu Area of Xinjiang Uygur Autonomous Region. Res. Environ. Sci. 2017, 30, 1515–1523. [Google Scholar]
  20. Feng, J.; Yu, H.; Su, X.; Liu, S.; Li, Y.; Pan, Y.; Sun, J.-H. Chemical composition and source apportionment of PM2.5 during Chinese Spring Festival at Xinxiang, a heavily polluted city in North China: Fireworks and health risks. Atmos. Res. 2016, 182, 176–188. [Google Scholar] [CrossRef]
  21. Zhang, N.; Han, B.; Zhao, R.; Zhao, X.; Xu, J.; Zhang, Y.; Bai, Z. Source profile and excess cancer risk evaluation of environmental tobacco smoking under real conditions, China. Atmos. Pollut. Res. 2019, 10, 1994–1999. [Google Scholar] [CrossRef]
  22. Sillanpää, M.; Hillamo, R.; Saarikoski, S.; Frey, A.; Pennanen, A.; Makkonen, U.; Spolnik, Z.; Van Grieken, R.; Braniš, M.; Brunekreef, B.; et al. Chemical composition and mass closure of particulate matter at six urban sites in Europe. Atmos. Environ. 2006, 40, 212–223. [Google Scholar] [CrossRef]
  23. Turpin, B.J.; Lim, H.J. Species contributions to PM2.5 mass concentrations: Revisiting common assumptions for estimating organic mass. Aerosol Sci. Technol. 2001, 35, 602–610. [Google Scholar] [CrossRef]
  24. Koulouri, E.; Saarikoski, S.; Theodosi, C.; Markaki, Z.; Gerasopoulos, E.; Kouvarakis, G.; Makela, T.; Hillamo, R.; Mihalopoulos, N. Chemical composition and sources of fine and coarse aerosol particles in the Eastern Mediterranean. Atmos. Environ. 2008, 42, 6542–6550. [Google Scholar] [CrossRef]
  25. Yang, L.; Zhou, X.; Wang, Z.; Zhou, Y.; Cheng, S.; Xu, P.; Gao, X.; Nie, W.; Wang, X.; Wang, W. Airborne fine particulate pollution in Jinan, China: Concentrations, chemical compositions and influence on visibility impairment. Atmos. Environ. 2012, 55, 506–514. [Google Scholar] [CrossRef]
  26. Chow, J.C.; Lowenthal, D.H.; Chen, L.W.; Wang, X.; Watson, J.G. Mass reconstruction methods for PM2.5: A review. Air Qual. Atmos. Health 2015, 8, 243–263. [Google Scholar] [CrossRef] [Green Version]
  27. Tai, A.P.K.; Mickley, L.J.; Jacob, D.J. Correlations between fine particulate matter (PM2.5) and meteorological variables in the United States: Implications for the sensitivity of PM2.5 to climate change. Atmos. Environ. 2010, 44, 3976–3984. [Google Scholar] [CrossRef]
  28. Quan, J.N.; Tie, X.X.; Zhang, Q.; Liu, Q.; Li, X.; Gao, Y.; Zhao, D.L. Characteristics of heavy aerosol pollution during the 2012–2013 winter in Beijing, China. Atmos. Environ. 2014, 88, 83–89. [Google Scholar] [CrossRef]
  29. Zheng, G.J.; Duan, F.K.; Su, H.; Ma, Y.L.; Cheng, Y.; Zheng, B.; Zhang, Q.; Huang, T.; Kimoto, T.; Chang, D.; et al. Exploring the severe winter haze in Beijing: The impact of synoptic weather, regional transport and heterogeneous reactions. Atmos. Chem. Phys. 2015, 15, 2969–2983. [Google Scholar] [CrossRef] [Green Version]
  30. Tang, I.N.; Munkelwitz, H.R. Aerosol Phase Transformation and Growth in the Atmosphere. J. Appl. Meteorol. 1994, 33, 791–796. [Google Scholar] [CrossRef]
  31. Tianxue, Q.; Chen, J.; Yin, L.; Niu, Z.; Zhang, F.; Xu, L. Study on the characteristics of water-soluble inorganic ions in PM2.5 in spring in the key cities of sourthern Fujian province. J. Environ. Sci. 2013, 22, 512–516. [Google Scholar] [CrossRef]
  32. Cheng, Y.; He, K.B.; Du, Z.Y.; Zheng, M.; Duan, F.K.; Ma, Y.L. Humidity plays an important role in the PM2.5 pollution in Beijing. Environ. Pollut. 2015, 197, 68–75. [Google Scholar] [CrossRef] [PubMed]
  33. Gao, J.J.; Tian, H.Z.; Cheng, K.; Lu, L.; Zheng, M.; Wang, S.X.; Hao, J.M.; Wang, K.; Hua, S.B.; Zhu, C.Y.; et al. The variation of chemical characteristics of PM2.5 and PM10 and formation causes during two haze pollution events in urban Beijing, China. Atmos. Environ. 2015, 107. [Google Scholar] [CrossRef]
  34. Ji, D.S.; Wang, Y.S.; Wang, L.L.; Chen, L.F.; Hu, B.; Tang, G.Q.; Xin, J.Y.; Song, T.; Wen, T.X.; Sun, Y.; et al. Analysis of heavy pollution episodes in selected cities of northern China. Atmos. Environ. 2012, 50, 338–348. [Google Scholar] [CrossRef]
  35. Sun, Y.; Zhuang, G.; Tang, A.; Wang, Y.; An, Z. Chemical Characteristics of PM2.5 and PM10 in Haze−Fog Episodes in Beijing. Environ. Sci. Technol. 2006, 40, 3148–3155. [Google Scholar] [CrossRef] [PubMed]
  36. Wang, G.; Zhang, R.; Gomez, M.E.; Yang, L.; Levy Zamora, M.; Hu, M.; Lin, Y.; Peng, J.; Guo, S.; Meng, J.; et al. Persistent sulfate formation from London Fog to Chinese haze. Proc. Natl. Acad. Sci. USA 2016, 113, 13630. [Google Scholar] [CrossRef] [Green Version]
  37. Zhao, X.J.; Zhao, P.S.; Xu, J.; Meng, W.; Pu, W.W.; Dong, F.; He, D.; Shi, Q.F. Analysis of a winter regional haze event and its formation mechanism in the North China Plain. Atmos. Chem. Phys. 2013, 13, 5685–5696. [Google Scholar] [CrossRef] [Green Version]
  38. Seinfeld, J.H.; Pandis, S.N. Atmospheric Chemistry and Physics: From Air Pollution to Climate Change, 2nd ed.; John Wiley: New York, NY, USA, 2006. [Google Scholar]
  39. Cheng, Y.; Zheng, G.; Wei, C.; Mu, Q.; Zheng, B.; Wang, Z.; Gao, M.; Zhang, Q.; He, K.; Carmichael, G.; et al. Reactive nitrogen chemistry in aerosol water as a source of sulfate during haze events in China. Sci. Adv. 2016, 2, e1601530. [Google Scholar] [CrossRef] [Green Version]
  40. Wang, Y.Q.; Zhang, X.Y.; Draxler, R.R. TrajStat: GIS-based software that uses various trajectory statistical analysis methods to identify potential sources from long-term air pollution measurement data. Environ. Model. Softw. 2009, 24, 938–939. [Google Scholar] [CrossRef]
  41. Kong, S.; Han, B.; Bai, Z.; Chen, L.; Shi, J.; Xu, Z. Receptor modeling of PM2.5, PM10 and TSP in different seasons and long-range transport analysis at a coastal site of Tianjin, China. Sci. Total Environ. 2010, 408, 4681–4694. [Google Scholar] [CrossRef]
  42. Hu, J.; Chai, F.; Duan, J.; Yi, P.; Chu, Y.; Xie, D. Explosive Growth of PM2.5 during the Autumn and Winter Seasons in the Jing-Jin-Ji and Surrounding Area and Its Control Measures with Emergency Response. Res. Environ. Sci. 2019, 32, 1704–1712. [Google Scholar] [CrossRef]
Figure 1. (a) Map showing the relative locations of Beijing and Jinan. (b) The pink area indicates Jinan city and the black spot is the sampling site Jinan Environmental Monitoring Station (EMS).
Atmosphere 11 00273 g001
Figure 2. Time series of PM2.5 and main chemical composition.
Atmosphere 11 00273 g002
Figure 3. Average concentrations of chemical components in PM2.5 (data shown in blue are the primary component >1.0 μg m−3, while data shown in red are <1.0 μg m−3).
Atmosphere 11 00273 g003
Figure 4. Average chemical reconstruction of PM2.5 during the sampling period.
Atmosphere 11 00273 g004
Figure 5. Compositional reconstruction of PM2.5 pollution of different levels during the sampling period.
Atmosphere 11 00273 g005
Figure 6. Relationships between PM2.5 concentration and wind speed (WS, a) and relative humidity (RH, b) (note: ** indicates ρ < 0.01).
Atmosphere 11 00273 g006
Figure 7. Relationships between relative humidity(RH) and the proportions of SO42− (a) and NO3 (b) in PM2.5. (note: ** indicates ρ < 0.01).
Atmosphere 11 00273 g007
Figure 8. Relationships between RH and sulfate oxidation rate (SOR) (a) and nitrate oxidation rate (NOR) (b). Size-coded by O3 concentration in PM2.5, where larger circles indicate higher O3 concentrations.
Atmosphere 11 00273 g008
Figure 9. (a) Back-trajectories for each identified cluster (at 100 m height). The large red dot denotes the location of the Jinan EMS. (b) Mean PM2.5 mass concentrations of each cluster.
Atmosphere 11 00273 g009
Table 1. Average concentrations and chemical compositions of PM2.5 during the sampling period.
PM2.5PM2.5/PM10
AverageSDaMedian
μg m−3
mass107.175.486.80.6
MDb8.55.270.2
TEb1.10.710.5
OMb1911.415.80.8
EC4.93.440.7
SO42−1921.212.40.8
NO321.915.617.80.8
NH4+11.610.78.80.8
Cl4.133.30.8
a: Standard deviation. b: MD represents mineral dust; TE represents trace elements; OM represents organic matter.

