Article

Innovative Trend Analysis of Precipitation in the Lake Issyk-Kul Basin, Kyrgyzstan

1
College of Resources and Environmental Science, Xinjiang University, Urumqi 830046, China
2
Key Laboratory of Oasis Ecology Xinjiang University, Urumqi 830046, China
3
State Key Laboratory of Desert and Oasis Ecology, Xinjiang Institute of Ecology and Geography, Chinese Academy of Sciences, Urumqi 830011, China
4
Research Center for Ecology and Environment of Central Asia, Chinese Academy of Sciences, Urumqi 830011, China
5
University of Chinese Academy of Sciences, Beijing 10049, China
6
Department of Geography, Marburg University, Deutschhausstr. 10, 35037 Marburg, Germany
*
Author to whom correspondence should be addressed.
Atmosphere 2020, 11(4), 332; https://doi.org/10.3390/atmos11040332
Submission received: 3 March 2020 / Revised: 23 March 2020 / Accepted: 26 March 2020 / Published: 29 March 2020
(This article belongs to the Section Meteorology)

Abstract

:
The analysis of various characteristics and trends of precipitation is an essential task to improve the utilization of water resources. Lake Issyk-Kul basin is an upper alpine catchment, which is more susceptible to the effects of climate variability, and identifying rainfall variations has vital importance for water resource planning and management in the lake basin. The well-known approaches linear regression, Şen’s slope, Spearman’s rho, and Mann-Kendall trend tests are applied frequently to try to identify trend variations, especially in rainfall, in most literature around the world. Recently, a newly developed method of Şen-innovative trend analysis (ITA) provides some advantages of visual-graphical illustrations and the identification of trends, which is one of the main focuses in this article. This study obtained the monthly precipitation data (between 1951 and 2012) from three meteorological stations (Balykchy, Cholpon-Ata, and Kyzyl-Suu) surrounding the Lake Issyk-Kul, and investigated the trends of precipitation variability by applying the ITA method. For comparison purposes, the traditional Mann–Kendall trend test also used the same time series. The main results of this study include the following. (1) According to the Mann-Kendall trend test, the precipitation of all months at the Balykchy station showed a positive trend (except in January (Zc = −0.784) and July (Zc = 0.079)). At the Cholpon-Ata and Kyzyl-Suu stations, monthly precipitation (with the same month of multiple years averaged) indicated a decreasing trend in January, June, August, and November. At the monthly scale, significant increasing trends (Zc > Z0.10 = 1.645) were detected in February and October for three stations. (2) The ITA method indicated that the rising trends were seen in 16 out of 36 months at the three stations, while six months showed decreasing patterns for “high” monthly precipitation. According to the “low” monthly precipitations, 14 months had an increasing trend, and four months showed a decreasing trend. Through the application of the ITA method (January, March, and August at Balykchy; December at Cholpon-Ata; and July and December at Kyzyl-Suu), there were some significant increasing trends, but the Mann-Kendall test found no significant trends. The significant trend occupies 19.4% in the Mann-Kendall test and 36.1% in the ITA method, which indicates that the ITA method displays more positive significant trends than Mann–Kendall Zc. (3) Compared with the classical Mann-Kendall trend results, the ITA method has some advantages. This approach allows more detailed interpretations about trend detection, which has benefits for identifying hidden variation trends of precipitation and the graphical illustration of the trend variability of extreme events, such as “high” and “low” values of monthly precipitation. In contrast, these cannot be discovered by applying traditional methods.

1. Introduction

Climate change manifests in global warming and changing patterns of rainfall; it has been directly affecting the hydrologic and thermal conditions of rivers [1,2], as well as the quality of freshwater resources in ecosystems [3] and human water-use designs [4,5,6]. Inland water dynamics and water resource availability are susceptible to climate change, especially in arid and semiarid regions. Central Asia is the largest non-zonal arid region in the world [7,8,9,10]. In the past 100 years, the average temperature of this region has increased significantly (approximately 1.6 °C), which is higher than in China’s eastern monsoon region and northern hemisphere (even rising above the recent changes twice), and it was estimated that it would increase by 1–2 °C between 2030 and 2050 [10,11]. Previous studies reported that in the mountain areas of arid regions, surface runoff is mainly generated by rainfall, snow, and glacial meltwater [12,13]. However, these upper alpine catchments are significantly more susceptible to the effects of climate variability, resulting in significant changes in the water resource yield in arid regions based on climate change [14]. This connection between the hydrological cycle and climatic factors was more pronounced in endorheic lake basins in the arid regions [15], as these closed systems are especially sensitive toward even small changes [16].
In the past three decades, trend detection in metro-hydrological time series has been evaluated by many researchers. These studies have mainly used parametric or nonparametric procedures, including Şen’s slope [17], Spearman’s rho tests [18], linear regression [19], cumulative sum [20], and the Mann-Kendall trend test [21], to investigate the annual, seasonal, and monthly data series. Among these methods, the Mann-Kendall trend test is the most popular method and is employed in many regions across the world. Zhao and Li [22] thoroughly analyzed climate change trends and characteristics between 1957 and 2015 at 11 synoptic stations along the loess hilly-gully region by using a combination of wavelet analysis, Spearman’s rho test, linear trend estimation, the Mann–Kendall test, trend-free pre-whitening, and the abrupt change test. Adarsh and Janga Reddy [23] analyzed annual rainfall data in four subdivisions of southern India using the nonparametric Mann–Kendall test, linear regression, and Şen’s slope estimator methods. The study concluded that the trend analysis of rainfall time scales shown a decreasing trend in the Kerala subdivision, but an increasing trend in other communities. Caloiero and Coscarelli [24] used the Şen’s method and Mann–Kendall trend test to study temporal rainfall dynamics in a large part of southern Italy for possible trends in seasonal and annual precipitation values. Wang and Xu [25] indicated that the utilization of these classical approaches is limited by certain assumptions, including of the sequence independence of data series. Also, these referenced processes are purely statistical techniques that do not allow us to detect the “low”, “medium”, and “high” value trends during a calculation. Therefore, a flexible graphical method is needed to explore time series trends to avoid errors when major hidden trends are detected.
Recently, Şen [26] proposed an innovative trend analysis (ITA) method that has used for pan evaporation [27], river flow [28], and rainfall [29] trend detection in different regions. Then, comparisons between ITA and classical methods show that ITA has some advantages over other methods [30]. Stream changes in the Western Mediterranean Basin for 55 years using observed data collected from six discharge gauge stations were investigated by Saplıoğlu and Kilit [31]. They discovered that there is a strong correlation between the Mann-Kendall trend analysis and the ITA method. In New Zealand, Caloiero [29] investigated the temporal variability of rainfall during the period 1951–2010, using a high-quality monthly dataset. This study confirms that the ITA method can be successfully used to evaluate the “high” and “low” data values for the trend analysis of seasonal and annual precipitation values. Wu and Qian [32] applied linear regression analysis, the Mann–Kendall trend test, and ITA to detect trends of seasonal and yearly rainfall extremes in Shaanxi, China; the records began in the 1950s and ended in 2014. They concluded that the comparison of the three approaches supports the ITA method. Besides, ITA demonstrates many advantages, including allowing the observation of sub-trends and exhibiting graphical results. Alashan [33] proposed the ITA change-boxes (CB) approach to making more detailed interpretations about trend possibilities within a given time series (such as in discharge records, monthly rainfall, and daily temperature) in the USA, UK, and Turkey.
Precipitation is the primary source of surface water and groundwater supply, and significant precipitation variability directly affects the quantity and quality of water resources [34]. Therefore, the analysis of the characteristics and rules of precipitation represents an essential task to improve the utilization of water resources [35]. Central Asia is deep inland and far from the sea. It belongs to the arid and semi-arid regions. Due to socio-economic development, the amount of water in the lower reaches of the river has decreased, the utilization rate of water resources has continued to increase, and the ecological environment of the desert oasis has been deteriorating [9,36]. The water resources of the inland lake basin in this area are mainly supplemented by precipitation [15], but there is rarely research on the changing characteristics of rainfall. Given this, this article analyzes the precipitation of the leading lakes in Central Asia, to investigate the change of rain in this region, and to provide a basis for the study of climate change.
Alpine lakes in Central Asia located in high mountains or low-lying basins on the plateau. Some lakes, in a natural condition, have a stable supply of alpine glaciers and are less affected by human activities [37,38]. They can genuinely reflect regional climate change, and the lake’s response is more sensitive, so mountain lakes are considered sensitive indicators of climate and environmental change [39]. These lakes are valuable water resources in arid regions, and they have a direct effect on the ecological environment of dry areas [40].
Lake Issyk-Kul is an endogenous mountain lake, is the fourth deepest continental reservoir in the world, is one of the largest slightly saline lakes in the world, and is the largest high-altitude lake in Central Asia [41]. Accordingly, regional climate variability and anthropogenic activities also affect the lake’s surface runoff. Many researchers have indicated that changes in the surface runoff and the water-cycle components as precipitation are the main drivers of water-level fluctuations in Lake Issyk-Kul [15,16]. Therefore, discussing the rainfall variability of endorheic lake basins within the context of global warming is essential for developing a sustainable application of water resources in the lake basin, and other arid and semi-arid regions in Central Asia. To date, analysis of the precipitation changes in the Lake Issyk-Kul basin has mainly concentrated on studying the annual temporal trends [42,43] but has failed to include monthly precipitation trends over the past 62 years. Besides, the ITA method has not been used to study precipitation changes in the Lake Issyk-Kul basin. Therefore, the primary concern of this paper is to analyze the variations of monthly precipitation at three meteorological stations in the Lake Issyk-Kul basin using the ITA method from 1951 to 2012. The novelty of this study is the comparison of the Mann-Kendall monotonic trend test with the recently proposed ITA approach.

2. Study Area and Data
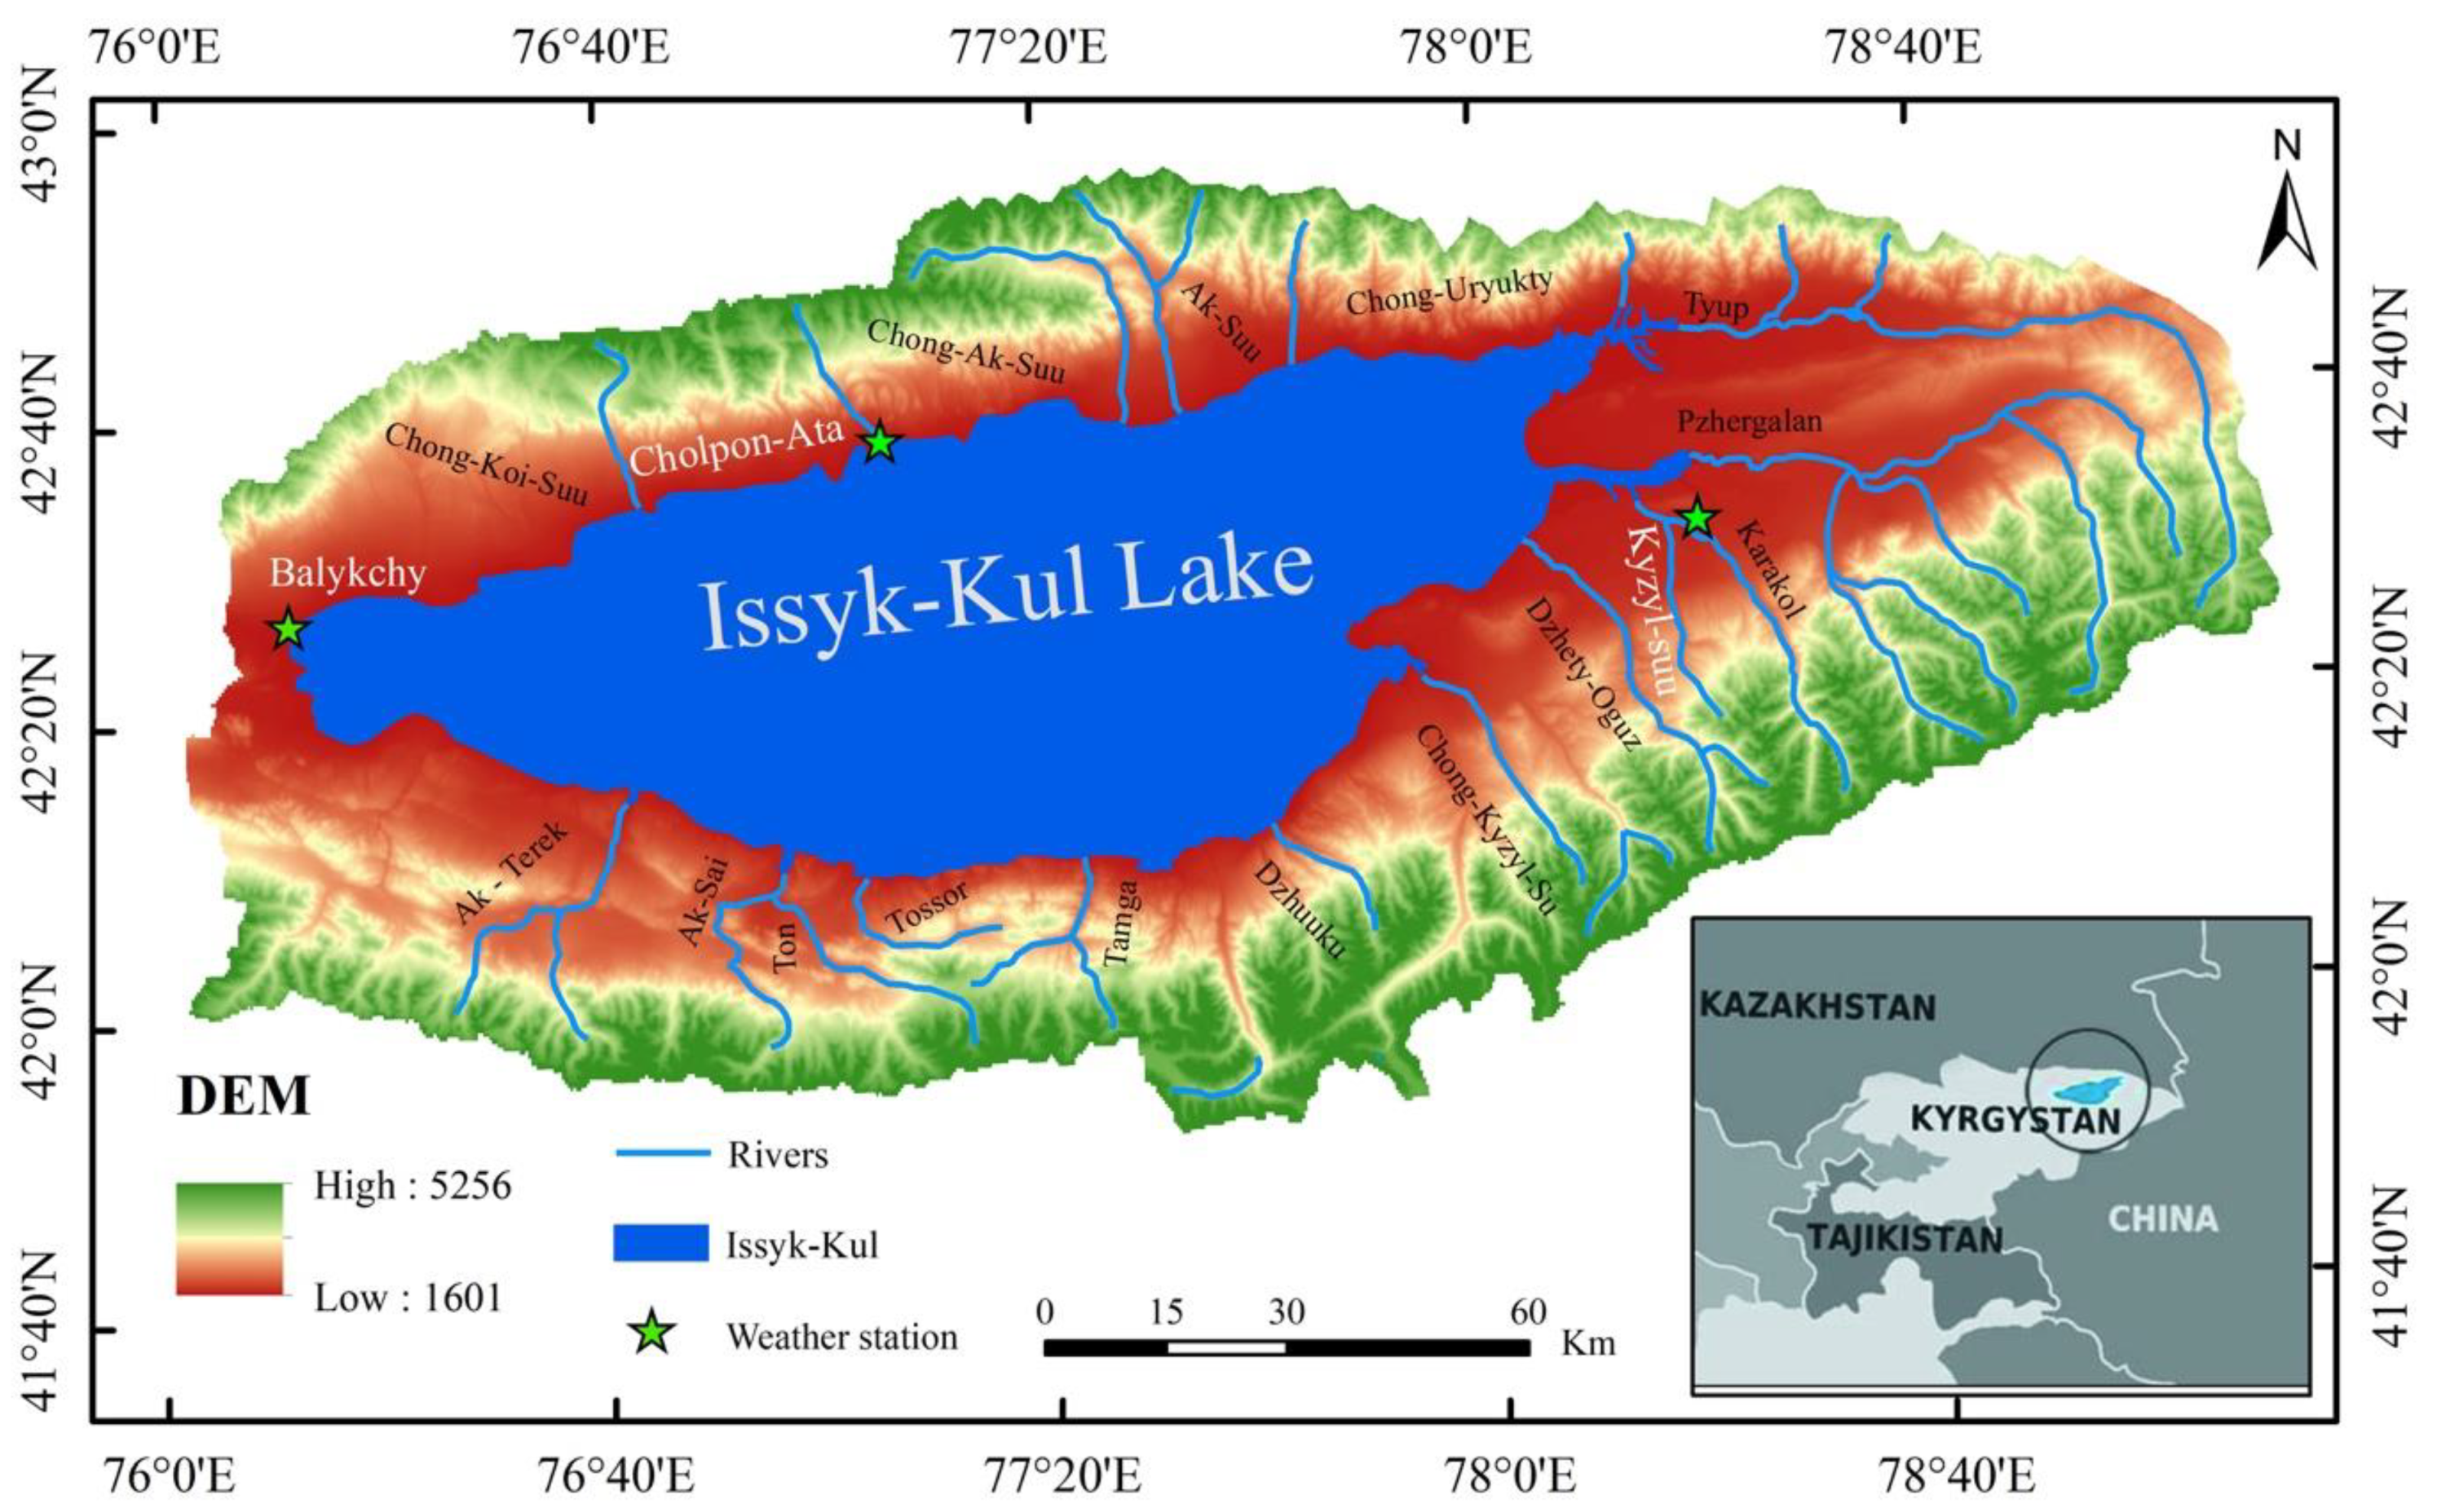
2.1. Study Area

The Lake Issyk-Kul basin (42° 25′ N, 77° 15′ E) (Figure 1) is at an altitude of 1606 m above sea level (a.s.l) and is located in the Kyrgyzstan part of arid Central Asia, on the northern slopes of the Tian-Shan Mountain Ranges [44]. It is surrounded by alpine mountain ranges: the Teskey Ala-Too range in the south, with peaks exceeding 4808 m, and the Kungey Ala-Too range in the north, with the highest peaks reaching 4648 m. Its drainage basin occupies a surface area of 22,080 km2, and all of the main branches of Issyk-Kul derive from the 834 g1aciers, with a volume of 48 km3 and a total glaciated area of 650 km2 [42,45]. The region surrounding Lake Issyk-Kul is one of the most densely populated areas of Kyrgyzstan. The population living in Issyk-Kul Oblast increased from 177,300 in 1940 to 448,000 in 2012, with a yearly population growth rate of 1.84% over the past 72 years [15]. The Lake Issyk-Kul basin temperature reaches up to 19–20 °C in July, and does not drop below 2–3 °C in January.
The average annual precipitation recorded in the Lake Issyk-Kul basin between 1951 and 2012 ranged from 136.7 mm (Balykchy) to 412.2 mm (Kyzyl-Suu), with an overall average of 276.5 mm (Table 1). The wettest months were July and August, with 40.97 mm and 39.33 mm of precipitation, respectively. During the winter months, rain was at its lowest level, especially at the Balykchy station, where it remained below 1.2 mm per month from November to February (Table 1).

2.2. Data Sources

This study obtained the monthly climatic data (average precipitation; 1951–2012) from three meteorological stations (Kyzyl-Suu, Balykchy, and Cholpan-Ata), shown in Figure 1, surrounding the lake Issyk-Kul.

3. Methodology

This study conducted statistical analyses of the precipitation data using the following tools:
  • Selection of the Mann-Kendall trend test [17,18] to evaluate the monthly features of the precipitation time series.
  • Use of the ITA method [26] to detect details about the trends of monthly precipitation and temporal trends.
These methods are described in the following sections.

3.1. The Mann-Kendall Monotonic Trend Test

The Mann-Kendall monotonic trend test was used to detect changes in the climate data [46,47]. These methods have been applied by the World Meteorological Organization and utilized in studies dealing with temporal changes in climatic data [48].
The given time series data x (x1, x2, …, xn) were compared in turn, and the consequences were recorded as sgn (xk − xi) = sgn (θ):
sgn ( θ ) = { 1 , 0 , 1 , θ > 0 θ = 0 θ < 0
The Mann-Kendall statistic parameter, S, is defined as:
S = i = 1 n 1 k = i + 1 n sgn ( x k x i )
var [ S ] = [ n ( n 1 ) ( 2 n + 5 ) t t ( t 1 ) ( 2 t + 5 ) ] / 18
where xj and xk are random variables (divided the given time series x into two variables, as x1, x2, …, xj, and xt+1, xt+2, …, xk). The standardized statistic Zc is calculated as:
Z c = { S 1 var ( S ) , 0 , S + 1 var ( S ) , S > 0 S = 0 S < 0
In this equation, positive Zc values reflect an upward trend, while negative Zc values denote a downward trend. If the standardized statistic |Z| > 2.58, the trend is significant at the 99% confidence level; if the standardized statistic |Z| > 1.96, the trend is significant at the 95% confidence level; if the standardized statistic |Z| > 1.65, the trend is significant at the 90% confidence level, and vice versa [49].

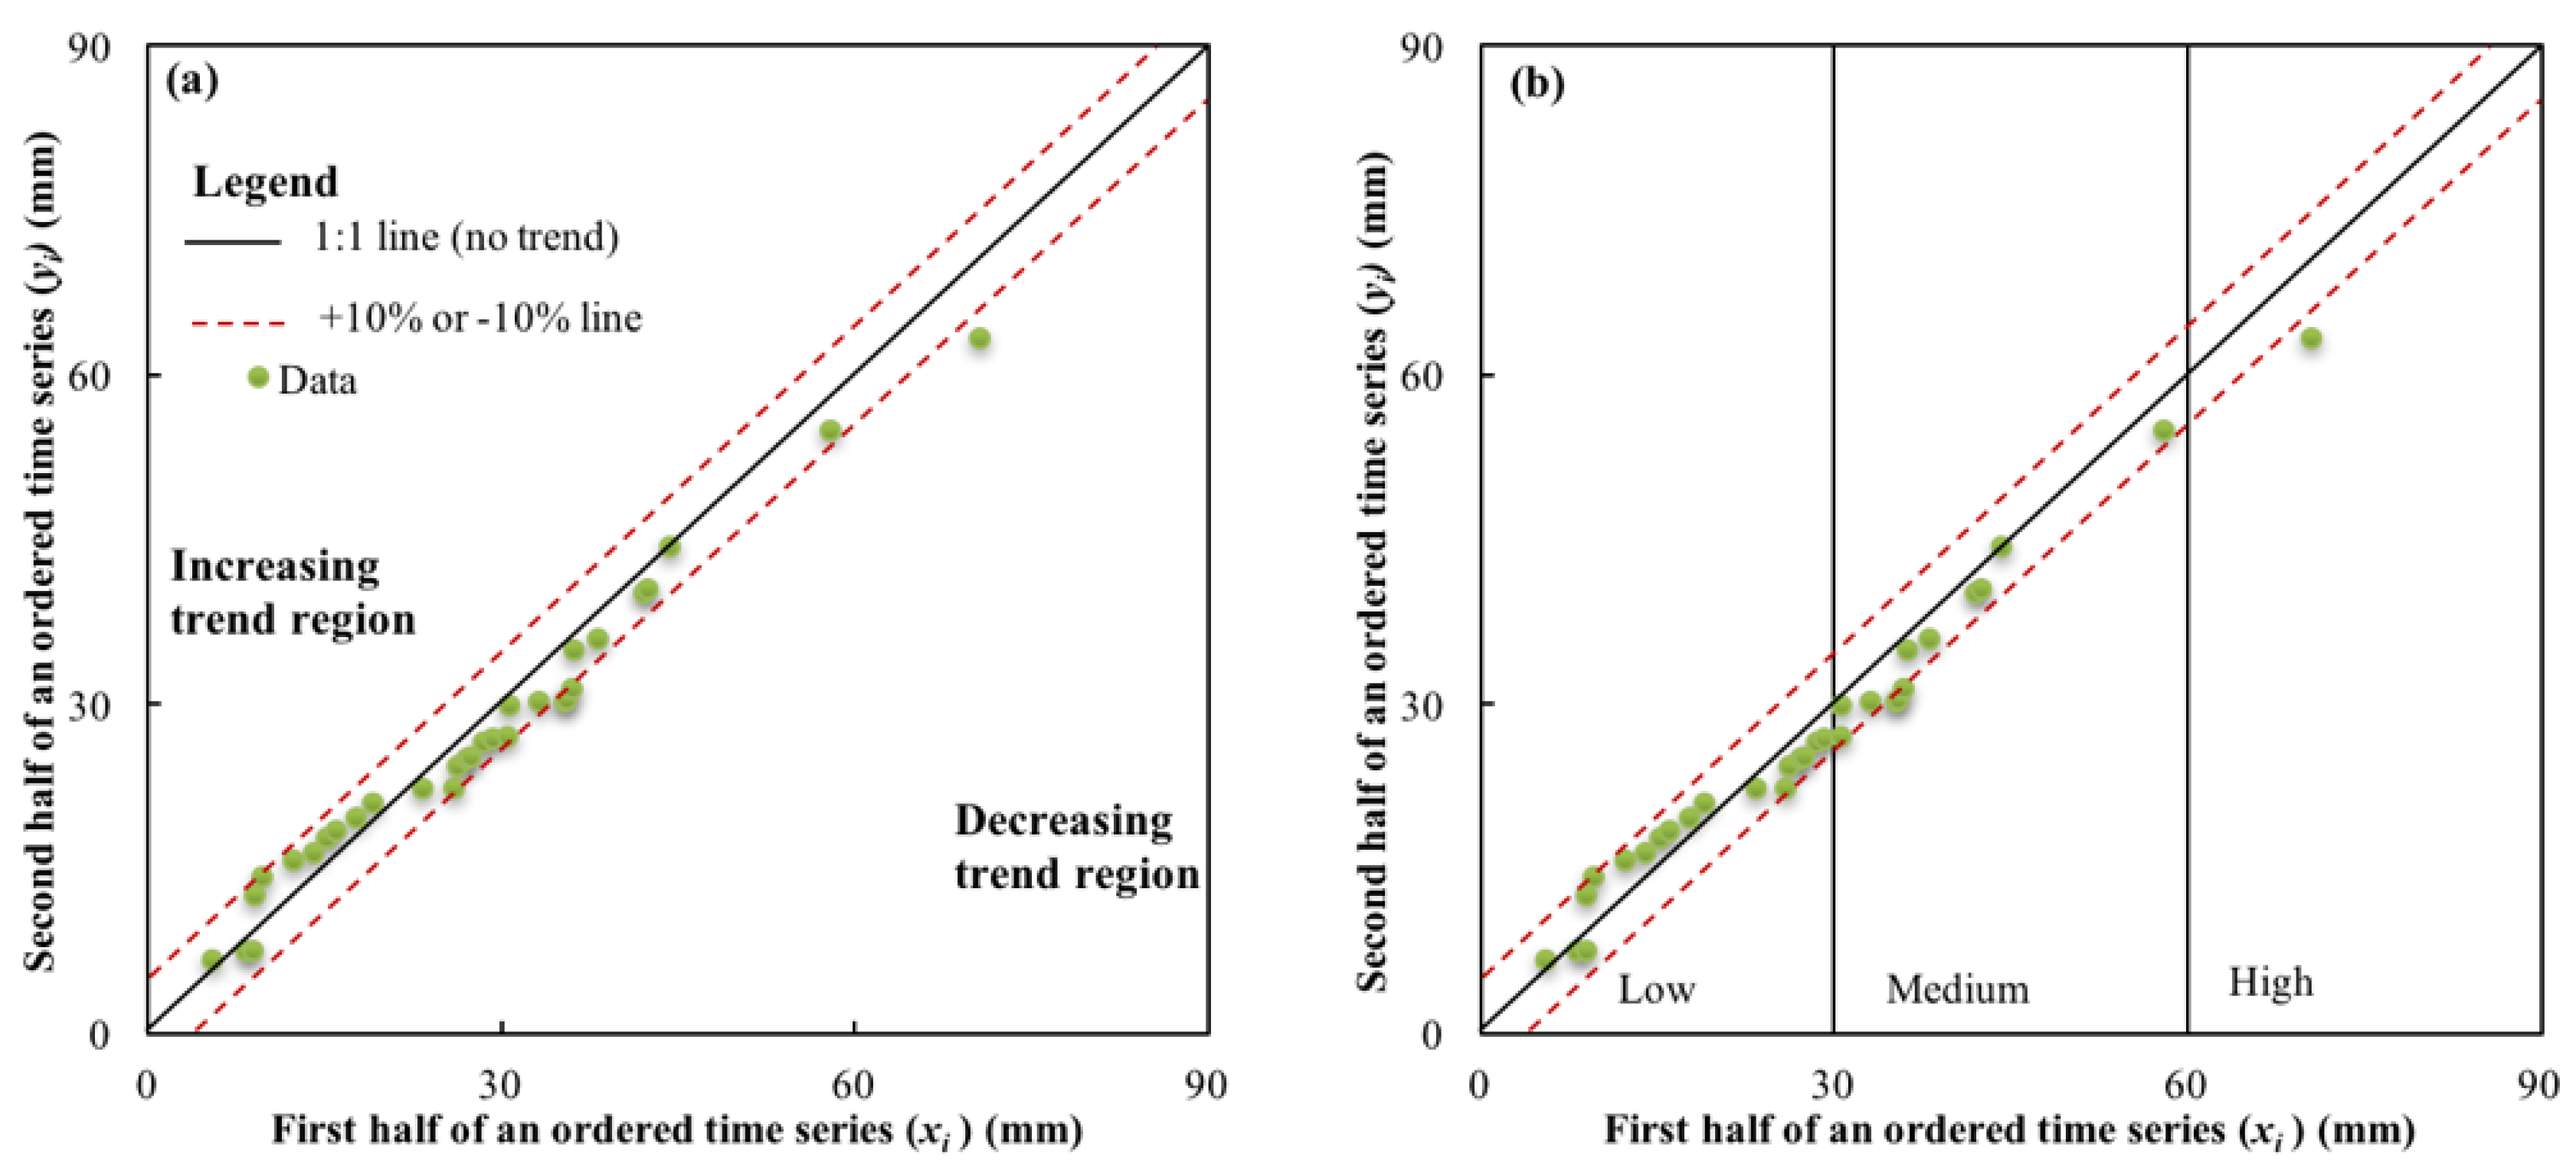
3.2. The Method for Innovative Trend Analysis Atmosphere 11 00332 i001

The recorded hydro-meteorological data were divided into two equal parts from the first time series to the end-time series, and both sub-series were separately sorted in ascending order. Then, the first sub-series (xi) was plotted on the horizontal X-axis, and the second sub-series (xj) was plotted on the vertical Y-axis, based on the two-dimensional Cartesian coordinate system (Figure 2a). If the data points in the scatter plot collected on the 1:1 (45°) line, it indicated that they were trendless (data with no trend). If the data points accumulated in the triangular area below the 1:1 line, it could be concluded that there was a decreasing trend present in the time series. If the data points fell above the upper triangular area, the 1:1 line, it could be said that the time series exhibited an increasing trend [26,50]. In the case of the single monotonic trend, it is not necessary to look for “low”, “medium”, and “high”, value groups, because the monotonic trend has a trend slope. Otherwise, if the scatters points are nonparallel with increasing or decreasing trends, the data are classified into “low”, “medium”, and “high” value groups, and shown in Figure 2b. Accordingly, patterns of “low”, “medium”, and “high” values of any metro-hydrological data series are identified through this method. In this study, the “low”, “medium”, and “high”, value groups were based on the percentiles [33], according to low (X < X ¯ − SX), medium ( X ¯ − SX < X < X ¯ + SX), and high (X > X ¯ + SX) precipitation. In these, X denotes the first half-time series, the mean is denoted by X ¯ , and the standard deviation is indicated as SX.
The ITA method lies in the annotation of all data ranges. In this article, the ITA method was applied on the monthly precipitation data between 1951 and 2012. Recently, extensive studies have used the ITA method to analyze the long-term recorded variables at the eastern Chine/Yangtze River Delta (annual and seasonal rainfall) [25], in Southern Italy (rainfall anomalies) [24], at the Pascagoula River, in Oxford City, and in Diyarbakir City [33] (monthly flow, rainfall, and daily temperature), and on the Qazin plain [28] (decadal river flow extremes). The ITA method failed to evaluate the monthly precipitation trends in the region of the Lake Issyk-Kul. Therefore, in this article, the ITA method was applied to detect the precipitation trends. A graphical representation by way of a Cartesian coordinate system was created, as shown in Figure 2. Besides, to graphically illustrate the distance of the data points from the 1:1 line, in this paper, two confidence bands (0.1 and −0.1) (Figure 2) have been added; this is to help the reader to better realize the differences between the data points and the trendless line, without any statistical implications.

4. Results and Analysis

4.1. The Mann-Kendall Trend Test for Analyzing the Temporal Precipitation Dynamics in the Lake Issyk-Kul Basin

Originally recorded data are considered without losing the originality of the time series [21,51]. In this study, the monthly precipitation data between 1951 and 2012 for the three stations in the Lake Issyk-Kul basin were used to analyze monthly trends, applying the monotonic Mann-Kendall trend test. Table 2 shows the results of the nonparametric Mann-Kendall test for the precipitation data. Balykchy and Cholpan-Ata are situated at the western and northern shores of the Lake Issyk-Kul basin, respectively, and the Kyzyl-Suu station is located south of the lake basin (Figure 1).
Table 2 shows that, in the different weather stations of the Lake Issyk-Kul basin, the precipitation showed distinct differences in the observed trends. The monthly precipitation did not change significantly for the Balykchy station in March and November from 1951 to 2012 (Zc = 1.476 and Zc = 1.604 < Z0.10 = 1.645, respectively), indicating a slight increase in precipitation. In January (Zc = −0.784) and July (Zc = −0.079), they showed a weakly decreasing trend. In February and October, monthly values were 2.769 and 3.912, respectively, showing a more significant increasing trend (α = 0.01). In December, the precipitation at the 0.10 significance level also indicated a significant rising trend. All of the other months showed a weaker growing trend, with the calculated Zc [H0] values per month being between −1.645 and 1.645.
For the Cholpon-Ata station, between 1951 and 2012, as shown in Table 2, the precipitation trends of all five months were below 1.645 (Z0.10 = 1.645), showing an increasing trend (α = 0.01). The rising trend in April, May, July, September, and December was not substantial at the 90% significance level, and these exhibited trends were not strong. In February and October, values increased significantly during the same period, at the 0.05 level, and Zc reached 2.381 and 2.223, respectively. In contrast, the precipitation in other months, such as January, March, June, August, and November, showed a weaker declining trend (January: −0.619, March: −0.018, June: −0.134, August: −0.966, and November: −0.298).
At the Kyzyl-Suu station, the study period from 1951 to 2012 indicated that the precipitation in February and October has a significant increasing trend. Table 2 notes that these two months had Zc values both higher than 1.645 and 2.58, at the 90% and 99% significance levels, respectively. Considering the statistical Zc Values in September and December, they approximately imply the rejection of the H0 (null hypothesis) at the 90% significance level because the values strictly matched Zc [H0] = 1.645. The precipitation in March was 0.723, followed by that in July (Zc = 0.522); they were below 1.645 (Z0.10 = 1.645), and showed a slightly increasing trend. All of the other months showed a negative (decreasing) trend (in January, April, May, June, August, and November). Generally, the three stations showed the same significantly increasing trend (α = 0.10) in February and October.
Based on the Mann-Kendall test for the study periods of precipitation, we identified a significant increase in February at Balykchy and Cholpon-Ata, and a substantial increase in October at Balykchy, Kyzyl-Suu, and Cholpon-Ata. All of the other months showed no trend (except at Balykchy and Kyzyl-Suu in December and February, respectively; they showed an increasing trend at the 90% significance level). In general, the percentage of positive trends decreased from west to south (from 42.8% to 28.6%), and the portion of no patterns showed a similar increase from west to south (from 31% to 34.5%) (Table 2).

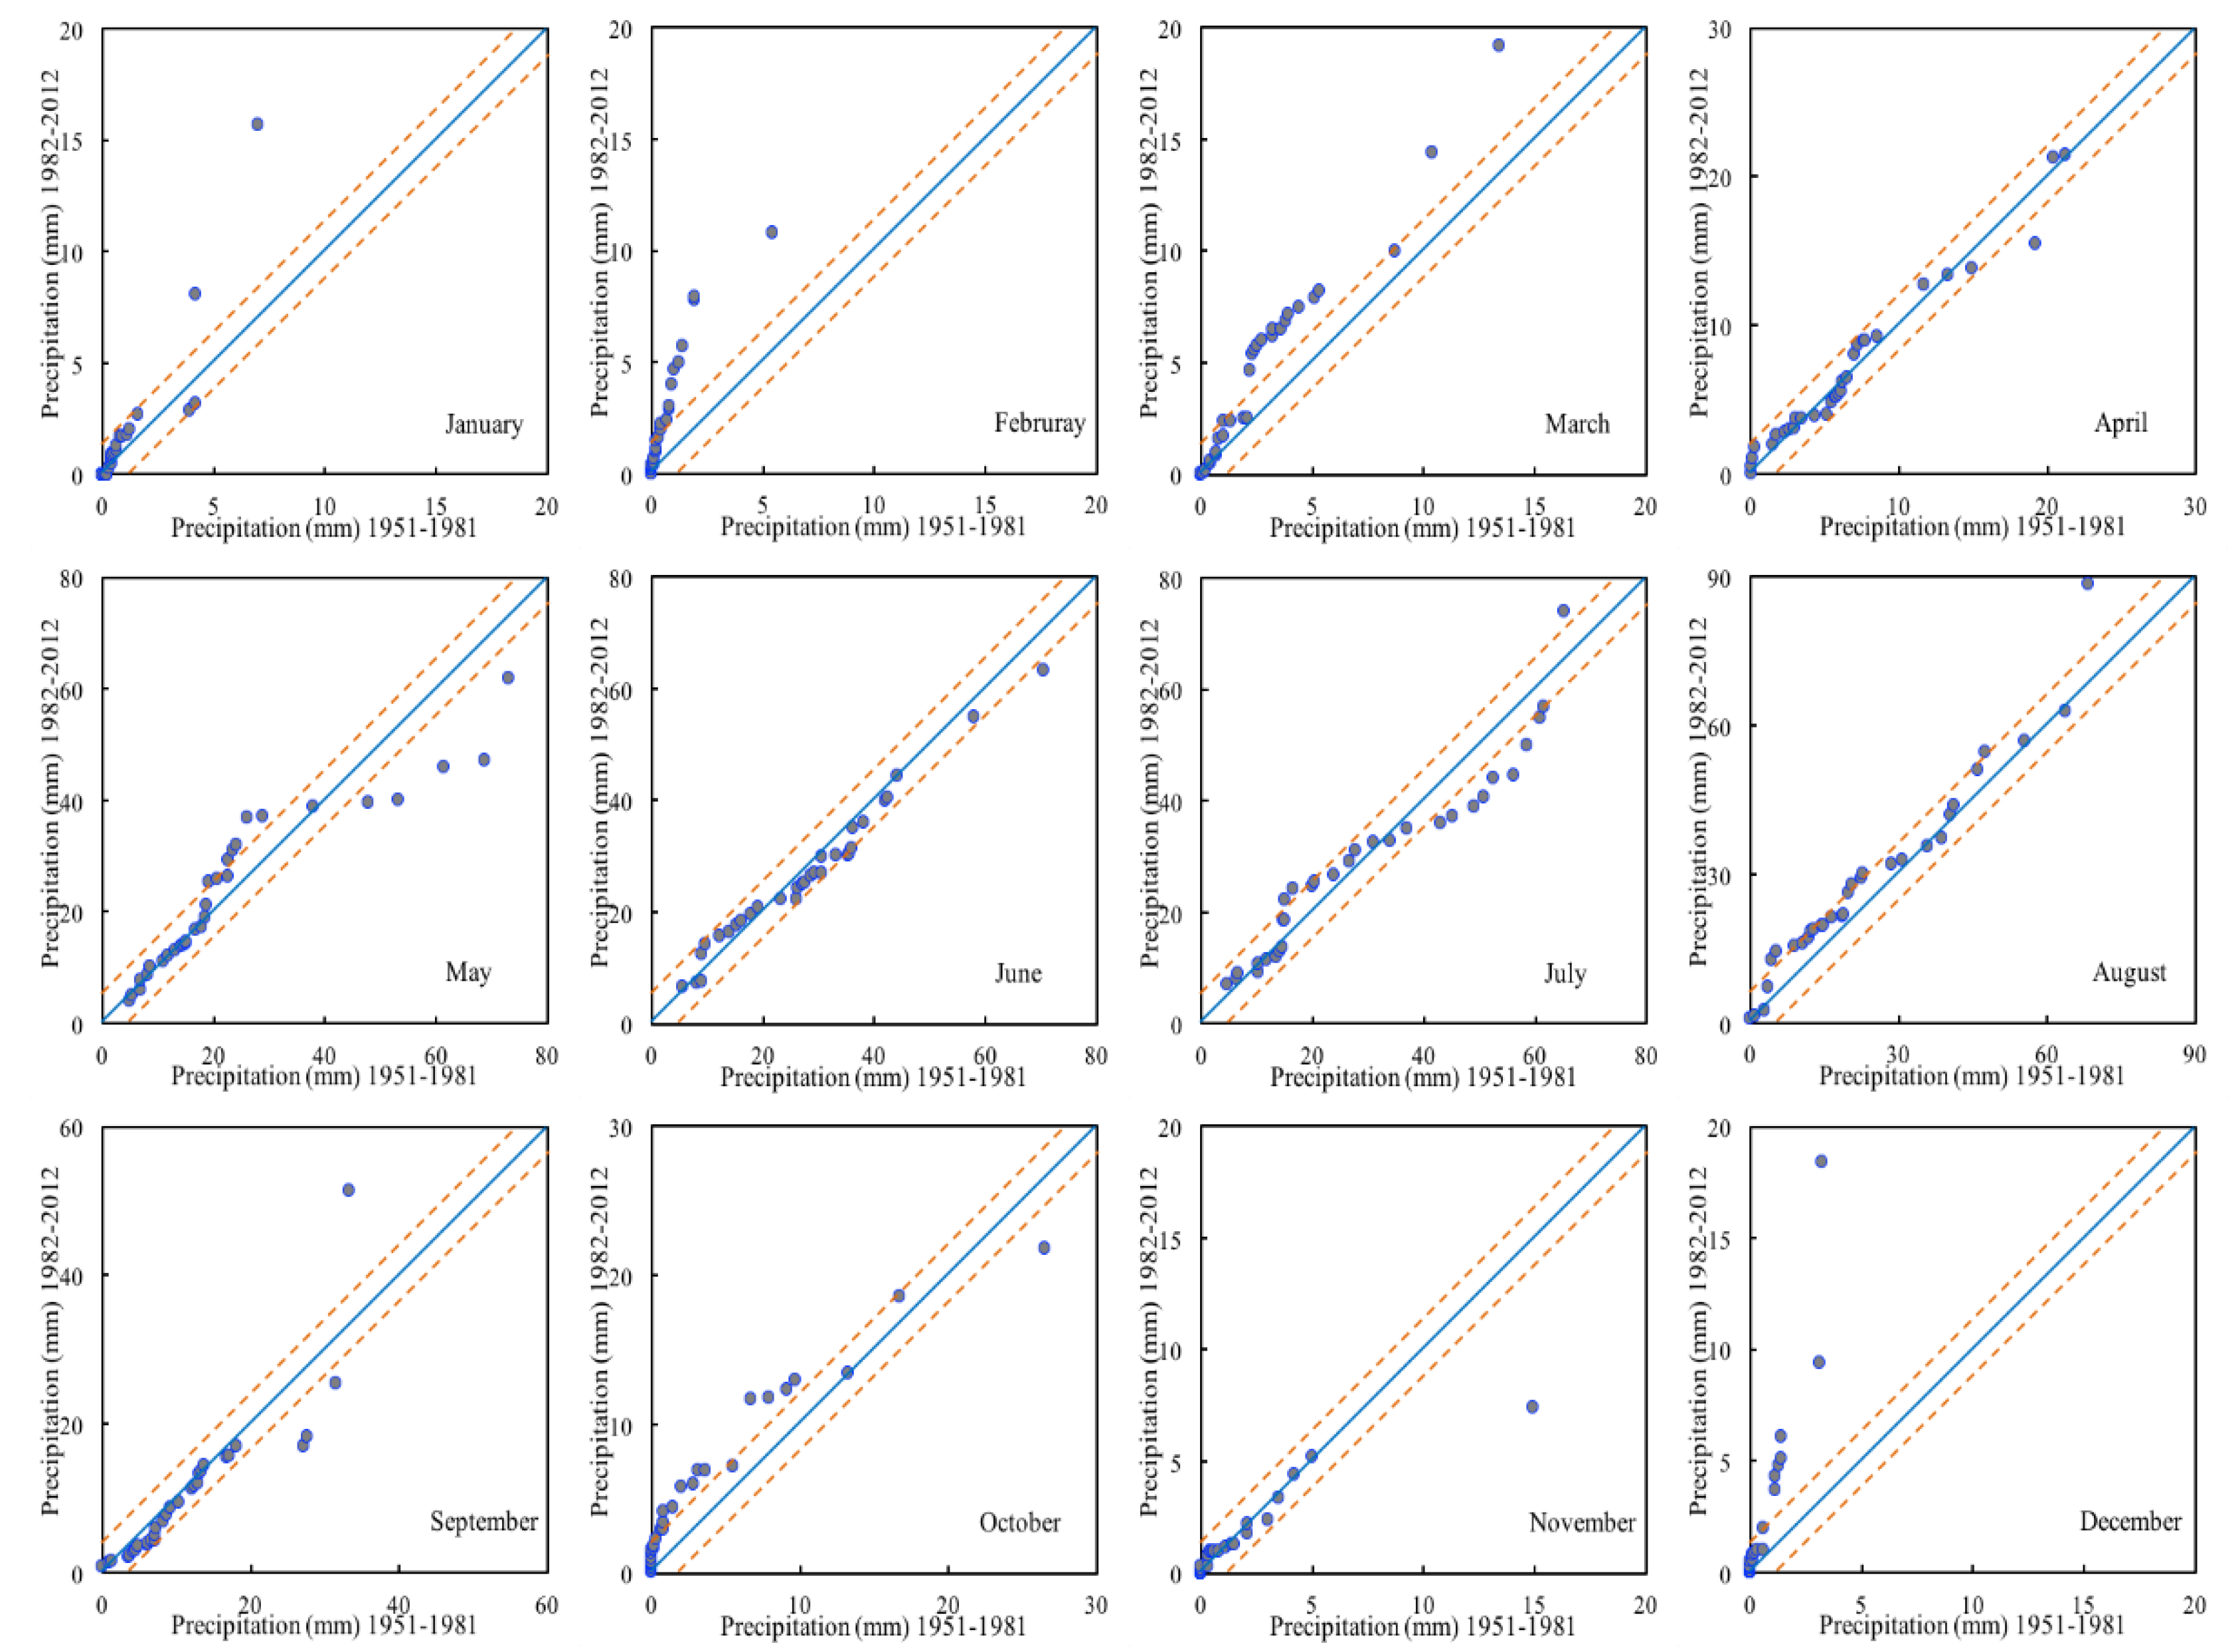
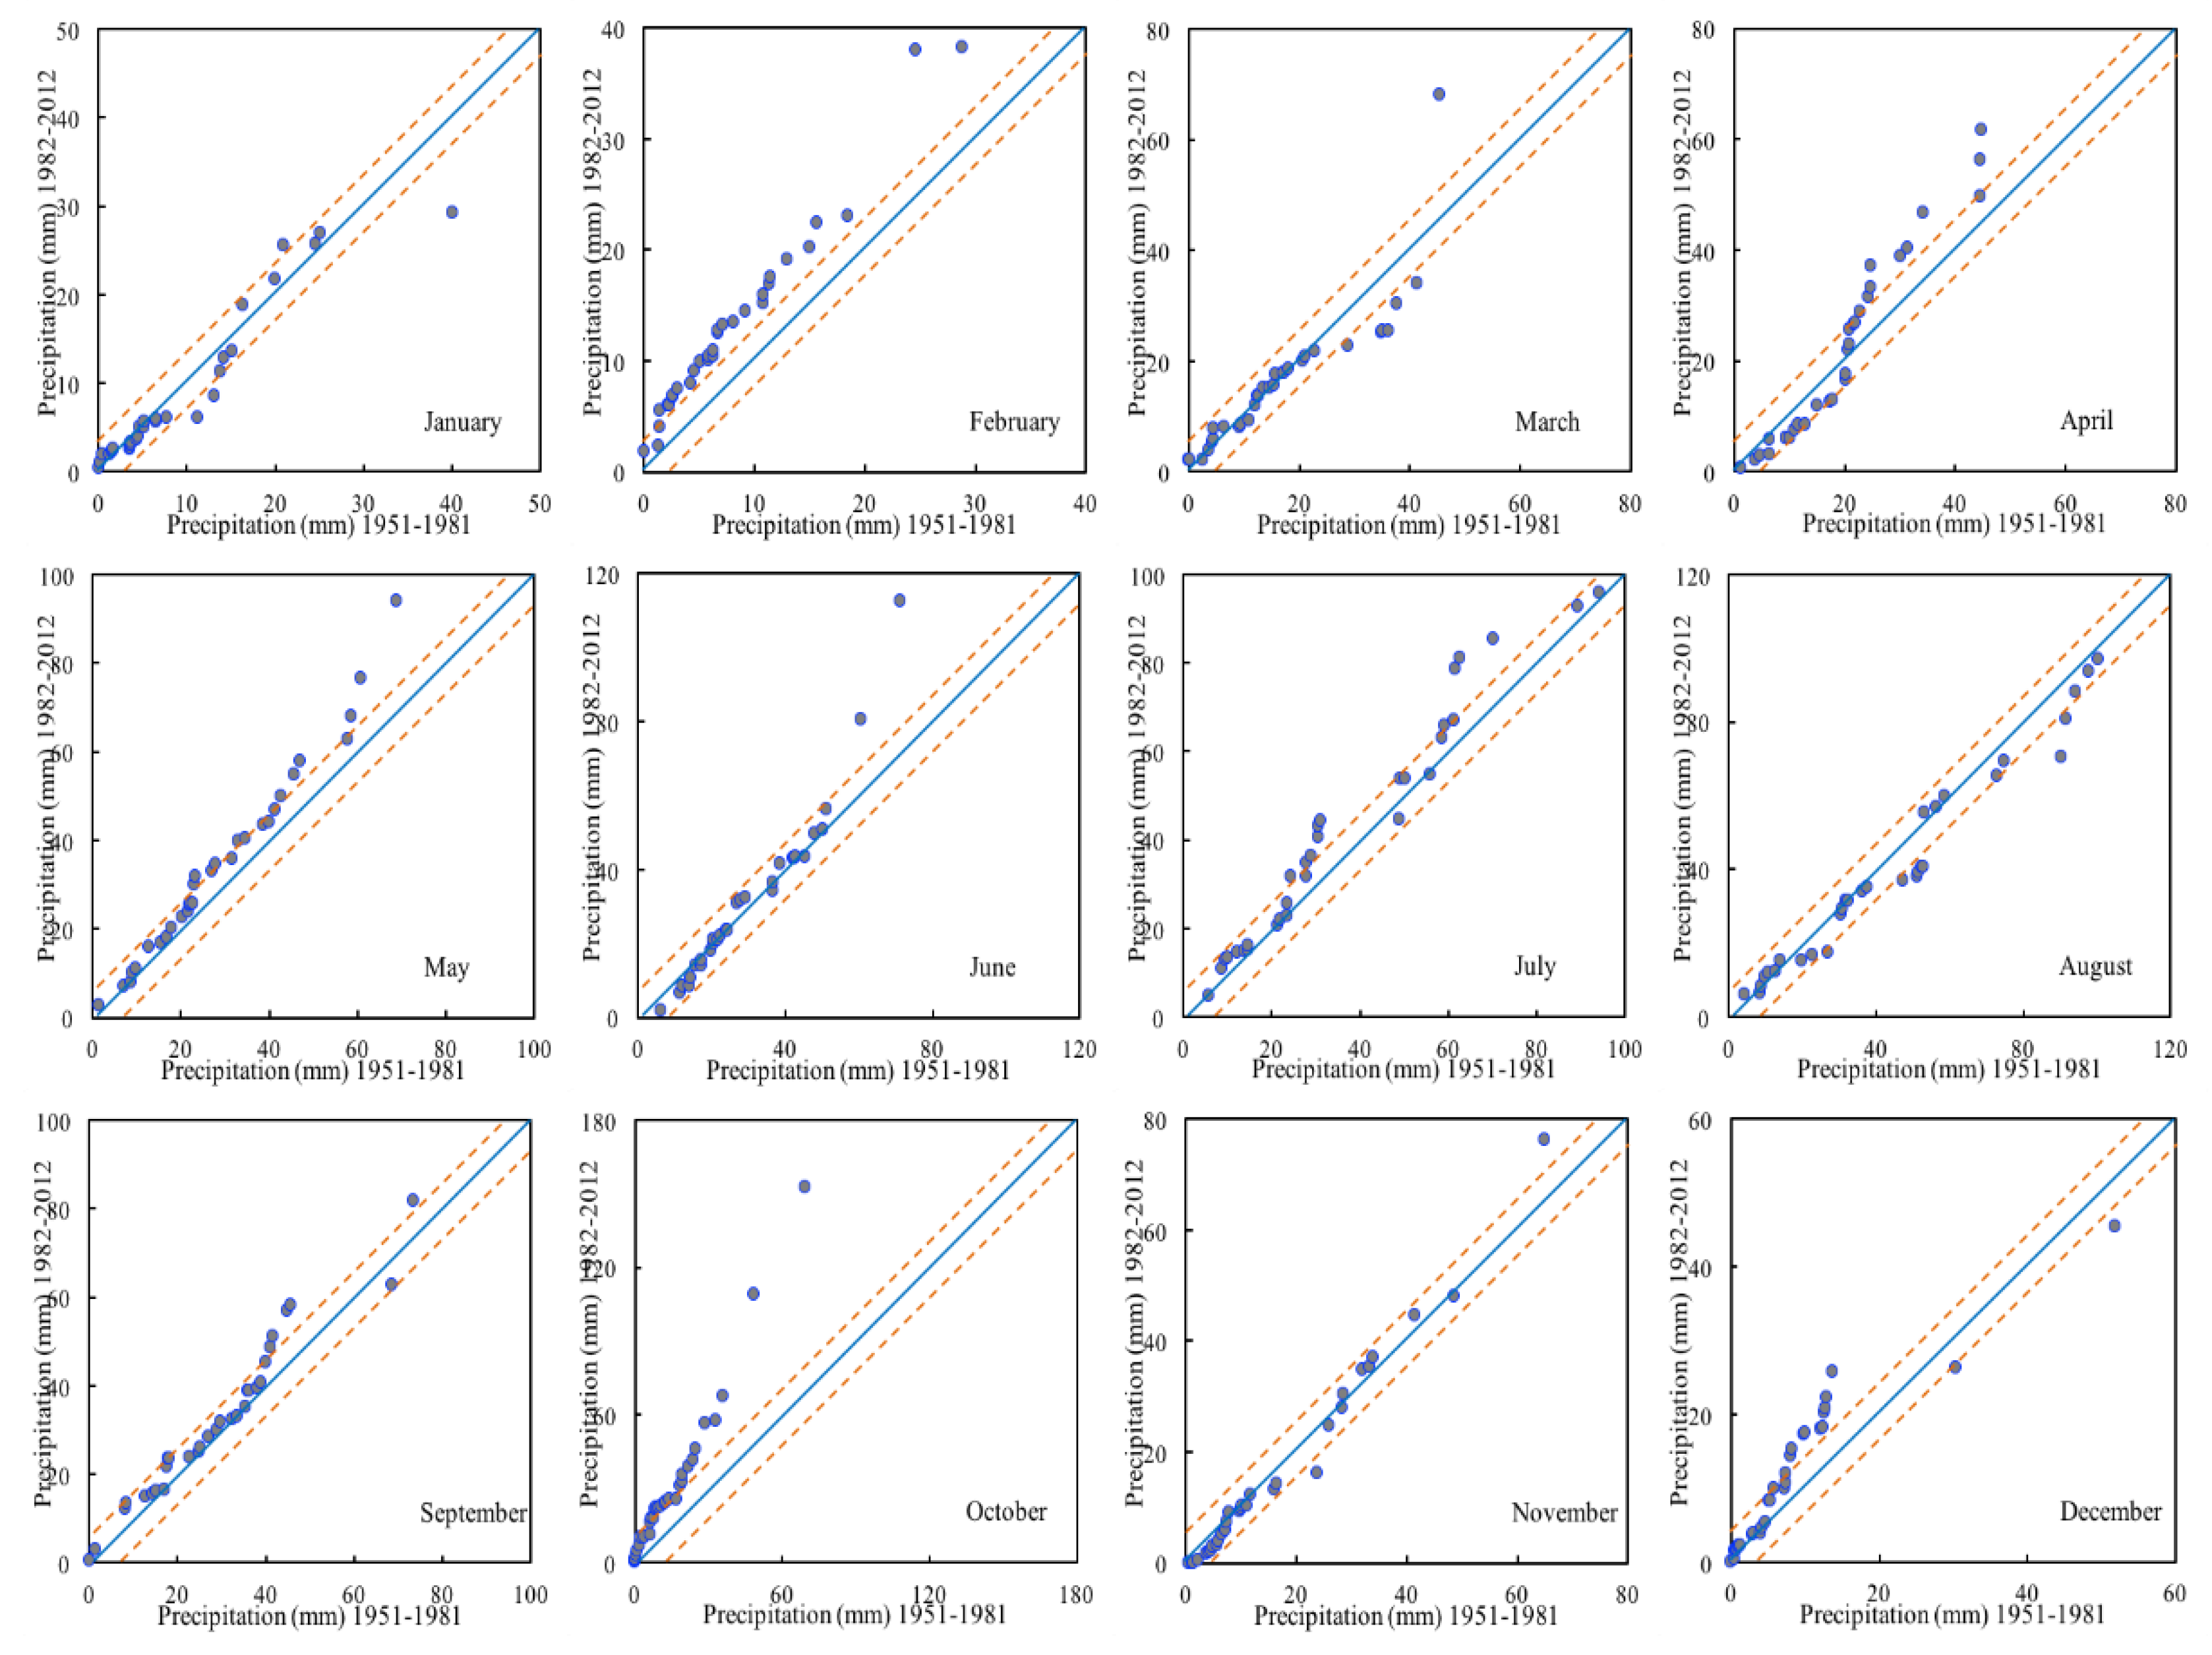
4.2. The ITA Method for Analyzing the Temporal Precipitation Dynamics in the Lake Issyk-Kull Basin

The innovative trend methodology presented has been applied for different temperatures and rainfall time series recorded at various locations across the world [52,53]. Figure 1 provides the meteorological sites of the Lake Issyk-Kul basin; an average precipitation time series was evaluated for the monthly timescale, and trend analysis was performed through the application of the ITA method. Results of the ITA approach have been compared with the ones obtained through the monotonic Mann-Kendall test applied to the original series. Each monthly value is represented by its average estimated between the 1951 and 2012 periods. To graphically show the differences between the 1:1 line and each data point, previous research has included confidence limits on ITA trend diagrams [54].
Figure 3, Figure 4 and Figure 5 show the results of the ITA method being applied to the three stations (Balykchy, Cholpon-Ata, and Kyzyl-Suu) in the Lake Issyk-Kul basin, reflecting the monthly precipitation between 1951 and 2012. In this article, for the interpretation of this figure, it is better to add 0.1 bands (Figure 3, Figure 4 and Figure 5) and divide the precipitation into three clusters that are “low”, “medium”, and “high”. The purpose of these bands is only to help the reader to better recognize the spacing of the data points from the trendless line, without any statistical meaning.
The results of applying the ITA method (Figure 3) indicate the case at the Balykchy station. They show that most data points fall above the 1:1 line, implying an overall upward trend. However, the characteristics of patterns in different precipitation categories are quite distinct in each month. In September, the data points show a generally steady decrease in all precipitation categories; the “low” precipitation decreases slightly, while the “medium” precipitation has a robust declining trend. In May and July, the pattern changes abruptly, and they have the same trend features; the precipitation below 20 mm month−1 has no trend, the precipitation from 20 to 40 mm month−1 shows an increasing trend, and the precipitation above 40 mm month−1 shows a decreasing trend of about 10%. In June, the precipitation below 20 mm month−1 falls below the 10% line, and the precipitation above 20 mm month−1 falls above the −10% line, suggesting an increasing and decreasing trend, respectively. In April and November, most of the precipitation points have no trend. However, in January, February, March, August, October, and December, the precipitation points indicated a gradually increasing trend in all precipitation categories.
On a monthly scale, in Figure 4, concerning the 0.1 relative bands, the results show a clear increasing trend of all of the values in the “low”, “medium”, and “high” categories in February, May, July, September, and October. These cases, the increasing trends in February and October, have been detected for the 0.1 relative bands, with data generally falling above the 0.1 corresponding groups. In April, the “low” precipitation values are less in the first sub-series than the next sub-series, indicating that the time series halves with no monotonic trends shown in a positive direction. Negative patterns were detected in August, but only for the “low” and the “high” values, and in November, for the “low” and the “medium” ones. In December, the “low” precipitation points in the upper triangle represent an increasing trend, which means that there is an increase in “low” precipitation in the second halves of the observed data (1982–2012) from that in the first halves (1951–1981). In the “medium” and “high” categories, a decreasing trend is indicated, but there are not many precipitation data points. In June, the precipitation below 40 mm month−1 has no trend, while the precipitation above 40 mm month−1 shows an increasing trend. Finally, in January and March, the monthly precipitation has a composition of various trend patterns, but all of these explanations mean that they have a negative trend.
The results of applying the ITA method for the Kyzyl-Suu station data are shown in Figure 5; the monthly time series with the most apparent trend evidence is in October and December, where most data points are positioned in the increasing trend area, though not outside the 0.1 bands. The same situation is evidenced in February, except for the “medium” precipitation values. This contrasts with the trend features detected in August and November, in which the precipitation data points have a negative trend for the “low” and the “medium” values, and have a positive direction for the “high” ones. In March and July, the precipitation below 20 mm month−1 showed a downward trend; in contrast, the “medium” and “high” values have a positive trend. In September, the data points shown a steady increasing trend, especially in the above 30 mm month−1 precipitation categories. The most evident result was the negative trend demonstrated in January and April, with some data outside the 0.1 bands. Unusual behavior has detected for May and June, which showed negative trends for the “low” and “medium” values, and a positive trend for the “high” values.

4.3. Comparison of the Mann-Kendall Trend Test and the ITA Method for Analyzing the Temporal Precipitation Dynamics in the Lake Issyk-Kul Basin

Table 3 gives a summary and comparison of the Mann-Kendall test and the ITA method results. As shown in Table 3, the “high” values and “low” values of all stations were individually evaluated by the ITA method. It is clear from this table that although there is no trend in most months according to the Mann-Kendall test, upward and downward trends are seen with the ITA method. The results showed that according to the Mann-Kendall trend test, seven of the 36 months at the three stations of the Lake Issyk-Kul basin showed a rising tendency. The results of the ITA method indicated that increasing trends were seen in 16 out of 36 months at the three stations, while six months showed decreasing patterns for “high” monthly precipitation. According to the “low” monthly precipitations, 14 months had an increasing trend, while four months showed a decreasing trend. These results give details about the patterns of the monthly precipitation time series in terms of the evaluation of the “low” and “high” values. The ITA method is also a different aspect of the Mann-Kendall trend test.

5. Discussion

Due to climate change affecting the water resources in Central Asia, research and assessment are of vital significance. Precipitation is the primary source of surface water and groundwater, the changes in rainfall directly affect the total amount of water resources, and it is of considerable significance to analyze and study the characteristics and rules of changes of precipitation to improve the utilization of water resources. However, the change characteristics of precipitation are rarely considered. Thus, in-depth knowledge about the variations of precipitation over the Lake Issyk-Kul basin is necessary for better water resource planning and management. However, most of the previous studies in the Lake Issyk-Kul basin analyzed the variability of annual precipitation trends [15,42], which did not reflect precipitation features at the monthly scale.
Moreover, no study had conducted the ITA method to consider monthly precipitation characteristics in the Lake Issyk-Kul basin. Regarding the identified knowledge gaps, this study investigated the trends of precipitation variability in monthly time scales. The monthly precipitation recorded in the lake Issyk-Kul basin from 1951 and 2012 ranged from 136.7 mm (Balykchy) to 412.2 mm (Kyzyl-Suu), with more than 42%of the rainfall concentrating in the summer, and the precipitation in the lake basin outside of the mountain ranges increased from the northwest to the southeast. Balykchy, at the western edge of the lake Issyk-Kul, is the only station with a predominantly arid climate (with a dry phase from April to November). The highest portion of precipitation is at the Kyzyl-Suu station, which falls in the east of the Lake Issyk-Kul basin (Table 1).
The ITA method performed by Şen [26] was employed on monthly time series recorded at the Balykchy, Cholpon-Ata, and Kyzyl-Suu stations, and the results were compared with those from the Mann-Kendall trend test in this study (Table 3). Strong trends of extreme (“high” and “low”) precipitation are associated with flood and drought. For the monthly total precipitation data, a significant increasing trend was detected in February and October according to the Mann-Kendall trend test, at three stations (Table 2); notably, in October, Zc values exhibited a strong increasing trend. As reported by Romanovsky et al. (2013) [43], the Lake Issyk-Kul level increased after 1997, an increase that took place in the situation of global warming and was caused by the activation of the west air mass transport and the increase of precipitation in autumn. As for the Lake Issyk-Kul basin, Alymkulova and Abuduwaili [16] noted that monthly agricultural water demand rises in October. In our results, similarly, the precipitation in October showed a significant increasing trend. The results indicated that the time of the high volume of water consumption is not under decreasing precipitation. Thus, in October, it should be flooded, with rainfall water during its falling time in the Lake Issyk-Kul basin.
To further establish these results, the monthly precipitation trends obtained from the ITA method in this region were compared with those from the well-known methods of the Mann-Kendall trend test. The ITA method results of monthly precipitation are compared and summarized with those from the traditional Mann-Kendall trend test in Table 3. For the 36 months in which time series were analyzed, significant trends were seen in seven according to the Mann-Kendall trend test. However, 16 months exhibited an increasing trend, six months showed a decreasing trend for “high” monthly precipitation and “low” monthly precipitation, 14 months had a rising trend, and four months showed a decreasing trend using the ITA method. These results give details about the patterns of monthly precipitation time series in terms of the evaluation of “low” and “high” values. They are clearly illustrated Figure 3, Figure 4 and Figure 5.
Besides, to validate the reliability of the monthly precipitation trends—also using the ITA indicator obtained from the previous research, which was presented by the Caloiero [29]—the innovative trend indicator (D) was used in this study to detect whether the precipitation trends were statistically significant. If D is a positive value, then precipitation exhibits an upward trend. In contrast, if D is a negative value then it indicates a downward trend. For analysis based on the monthly time series data for 36 months, significant increasing trends were observed in 13 series by ITA (D), while the D values in February, October, and December were higher than those in the other months (Table 4), giving similar trend results to those from the ITA method [26,50]. These results further confirmed that these three months had a significant increasing trend during the study period in the Lake Issyk-Kul basin. This method contributes to the ITA method to establish significant trends that cannot be detected by the Mann-Kendall test. Besides, the linear regression slope b [32] and the Mann-Kendall test are quantitative methods that give purely arithmetical results. As seen from Table 4, the linear regression slope b results present a different aspect (positive and negative trends shown, with inconsistent results) from the seven months and five months demonstrated by the ITA (D) and Mann-Kendall test, respectively. Additionally, the two trend analysis methods (linear regression slope b and ITA (D)) show significant trends for the 29 series, and are in full agreement (Table 4).
For the 36 monthly time series, significant trends are observed in 11 series by the Mann–Kendall test (Table 2), and no significant trends are suggested by linear regression (Table 4). The Mann–Kendall trend test and the ITA method present consistent results for the seven series with significant trends, with full agreement. To compare the results (significant trends and lack of significant trends) from three methods, the two tables Table 2 and Table 4 (ITA versus Mann-Kendall test and regression slope b) exhibit that the significant trend occupies 19.4% in Table 2 and 36.1% in Table 4, which indicates that the ITA method displays stronger significant trends than the Mann–Kendall Zc.
Several methods have been used and discussed in this paper. The main concern is to determine the trend tendency accurately. The comparison between the Mann-Kendall trend test and the ITA method applied in this paper was crucial because trend analysis in previous research indicated that users have grown at a record rate. Moreover, many kinds of literature employed the Mann-Kendall method on a given time series. The Mann-Kendall trend test is a well-known classical method for trend detection. Its basis is the assumption that the time series has no sequence correlation, and is at least based on short-term memory serial correlation, and almost all of the climate records are significant [55]. Therefore, the Mann-Kendall trend test can show a notable trend in series with meaningful positive serial relationships [56]. In this paper, the comparison of the ITA (D) and the Mann-Kendall test (Zc [H0] values per month) shows some different results, indicating that the ITA method has some advantages over the Mann-Kendall test. However, the Mann-Kendall analysis has some results to be trendless (e.g., in January, March, and August at Balykch, in December at Cholpon-Ata, or in July and December at Kyzyl-Suu), where increasing trends have been discovered by using the ITA method. Additionally, all data ranges can be provided graphically on a Cartesian coordinate system, which allows for detailed information on the trends of monthly precipitation data in terms of the investigation of “low”, “medium”, and “high” values (Table 3, and Figure 3, Figure 4 and Figure 5). As Şen [26] said, this is a critical issue because efficient, effective, and optimal water resource management not only needs to determine the monotonic trend within a given period, but also needs to determine the “low”, “medium”, and “high” water levels.

6. Conclusions

We analyzed the monthly variations of precipitation by using the Mann-Kendall test and the ITA method between 1951and 2012 in the Lake Issyk-Kul basin. The conclusions of our study can be summarized as follows:
(1)
The Mann-Kendall monotonic trend test and ITA method give different trends for the precipitation variables, which provide us with the complexity of the trend phenomena. According to the Mann-Kendall trend test, precipitation in all months at the Balykchy station shows a positive trend (except in January (Zc = −0.784) and July (Zc = 0.079)), and these in February and October (Zc = 2.769 and 3.912 > Z0.01 = 2.58) were significant at the 99% confidence level, and in December (Zc = 1.786 > Z0.10 = 1.645) at the 90% confidence level. At the Cholpon-Ata and Kyzyl-Suu stations, monthly precipitation also indicated a decreasing trend in January (Zc = -0.619 and 0.079), June (Zc = −0.134 and 0.249), August (Zc = −0.966 and −1.033), and November (Zc = −0.298 and −0.449). Meanwhile, precipitation at the two meteorological stations showed distinct differences in other months. At the monthly scale, significant increasing trends were detected in February (Zc = 2.381 and 1.871 > Z0.10 = 1.645) and October (Zc = 2.223 and 2.600 > Z0.05 = 1.96).
(2)
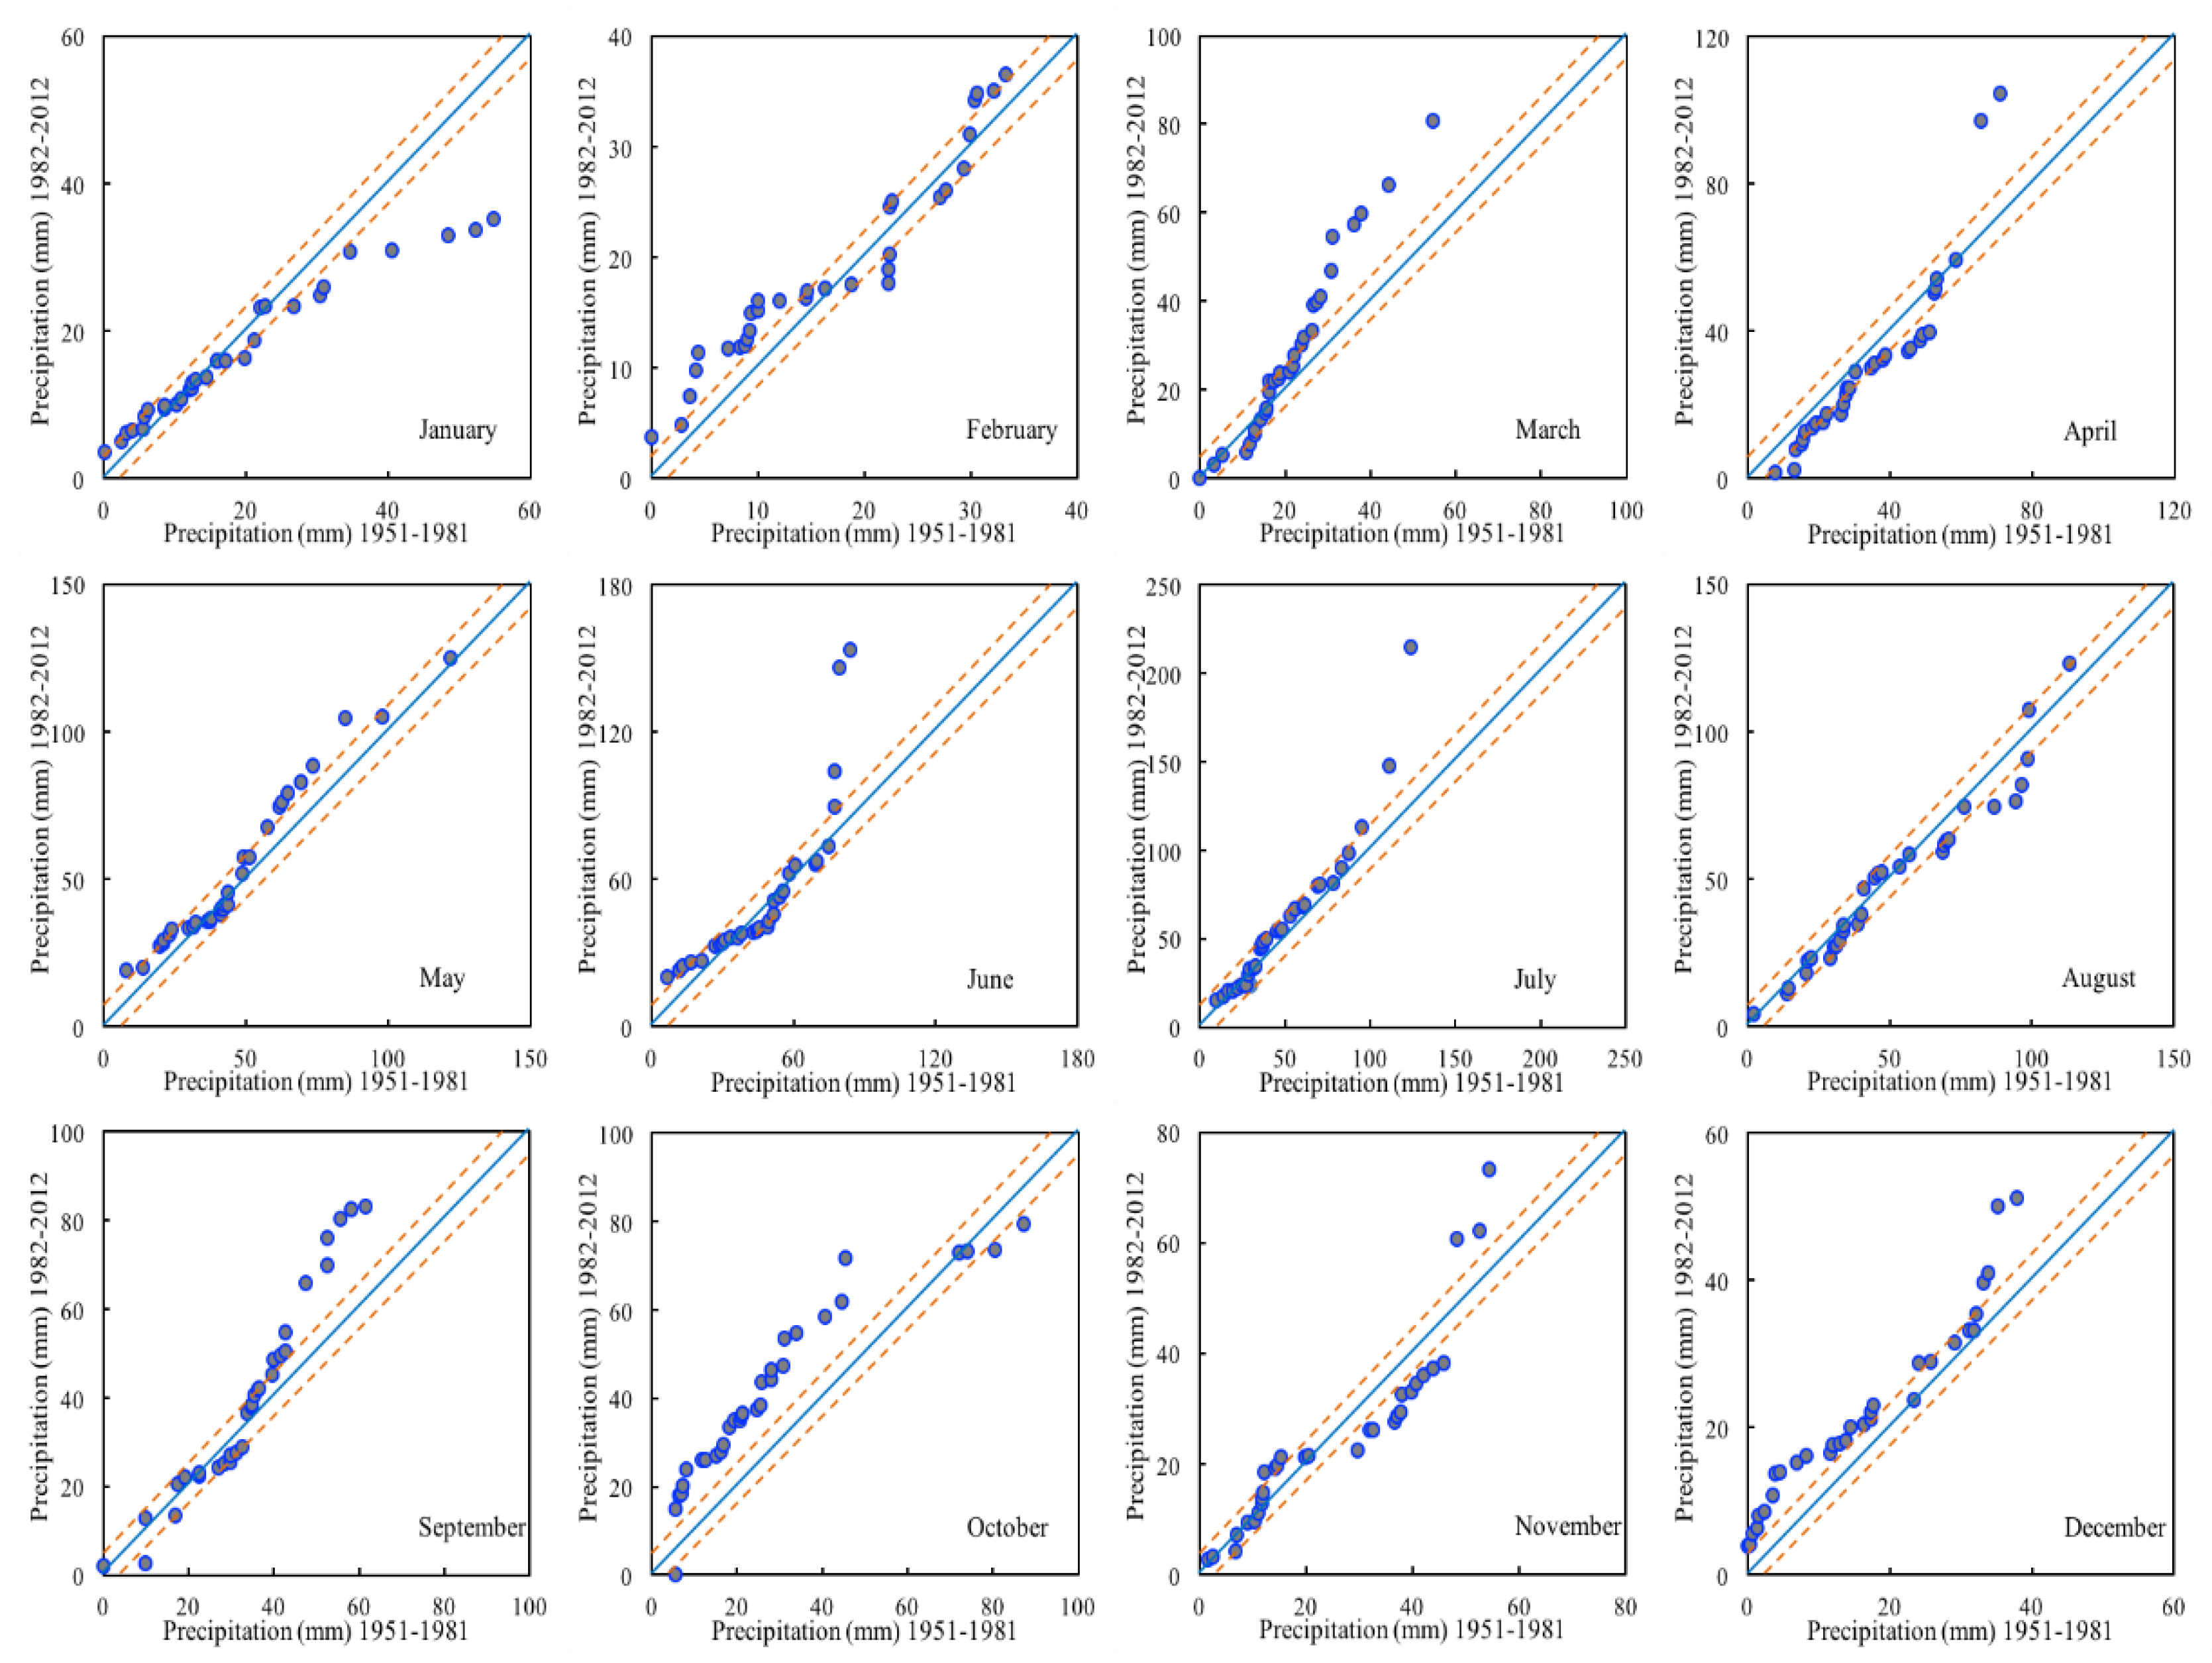
The ITA method allows a comprehensive investigation of the monthly variation of precipitation in this study, the results of which indicated that increasing trends were seen in 16 out of 36 months at the three stations, while six months showed decreasing patterns for “high” monthly precipitation. According to the “low” monthly precipitations, 14 months had an increasing trend, and four months showed a decreasing trend. Through the application of the ITA method (for January, March, and August at Balykchy, December at Cholpon-Ata, and July and December at Kyzyl-Suu), some data showed a significant increasing trend. However, with the Mann-Kendall test, no meaningful patterns were found.
(3)
Compared with the classical Mann-Kendall test, the ITA method has some advantages. This approach allows more detailed interpretations about trend detection, which is of benefit for identifying hidden variation trends of precipitation. These cannot be discovered by applying traditional methods, nor can the trend variability of extreme events—such as “high” and “low” values of monthly precipitation—be graphically illustrated by such methods. Besides, in the results from the two methods, the significant trend occupies 19.4% in the Mann-Kendall test and 36.1% in the ITA method, which indicates that the ITA method displays a more definite significant pattern than the Mann–Kendall Zc.
This study presented a comprehensive investigation of the temporal variation of monthly precipitation in the Lake Issyk-Kul basin between 1951 and 2012. The results are helpful for water resource managers involved in predicting the risk associated with flood and drought disasters in the study area. This study also contributes to the trend detection methods by quantitatively evaluating trends in the “low”, “medium”, and “high”, value groups of time series. Due to the lack of data, this study only analyzes the inter-annual trends of precipitation at three meteorological stations. Future research will collect more weather station data to analyze the annual, decadal, and seasonal changes in precipitation. Based on the ITA method, several improvements—namely using double-ITA and triple-ITA procedures together with simple ITA—are suggested, which needs further research.

Author Contributions

The research article is the joint work with five authors, J.A. designed the experiments, and Y.A. analyzed the trends of precipitation variability by employing innovative trend analysis (ITA) method and wrote the manuscript. B.M., B.E., and M.G. helped to review and prepare this paper for publication. All authors have read and agreed to the published version of the manuscript.

Funding

This research received no external funding.

Acknowledgments

This study was supported by the National Natural Science Foundation of China (Grant No.U1603242), West Light Foundation of Chinese Academy of Sciences (2017-XBQNXZ-B-012), Science and Technology Service Network Initiative Program of Chinese Academy of Sciences (KFJ-STS-QYZD-071), and the Foundation of State Key Laboratory of Desert and Oasis Ecology, Xinjiang Institute of Ecology and Geography Chinese Academy of Sciences, the Department of Water Resources and Irrigation, Ministry of Agriculture and Land Reclamation of the Kyrgyz Republic for the provision of data, National Science & Technology Infrastructure Center-Data Sharing Infrastructure of Earth System Science. And supported by a grant from the Xinjiang University Fund (2018) for Distinguished Young Scholars.

Conflicts of Interest

The authors declare that there is no conflict of interests regarding the publication of this paper.

References

  1. Arnell, N.W.; Gosling, S.N. The impacts of climate change on river flow regimes at the global scale. J. Hydrol. 2013, 486, 351–364. [Google Scholar] [CrossRef]
  2. Gosling, S.N.; Taylor, R.G.; Arnell, N.; Todd, M.C. A comparative analysis of projected impacts of climate change on river runoff from global and catchment-scale hydrological models. Hydrol. Earth Syst. Sci. 2011, 15, 279–294. [Google Scholar] [CrossRef] [Green Version]
  3. Van Vliet, M.T.H.; Franssen, W.H.P.; Yearsley, J.R.; Ludwig, F.; Haddeland, I.; Lettenmaier, D.P.; Kabat, P. Global river discharge and water temperature under climate change. Glob. Environ. Chang.-Hum. Policy Dimens. 2013, 23, 450–464. [Google Scholar] [CrossRef]
  4. Zhan, C.S.; Niu, C.W.; Song, X.M.; Xu, C.Y. The impacts of climate variability and human activities on streamflow in Bai River basin, northern China. Hydrol. Res. 2013, 44, 875–885. [Google Scholar] [CrossRef]
  5. Bronstert, A.; Niehoff, D.; Burger, G. Effects of climate and land-use change on storm runoff generation: Present knowledge and modelling capabilities. Hydrol. Processes 2002, 16, 509–529. [Google Scholar] [CrossRef]
  6. Karlsson, I.B.; Sonnenborg, T.O.; Refsgaard, J.C.; Trolle, D.; Børgesen, C.D.; Olesen, J.E.; Jeppesen, E.; Jensen, K.H. Combined effects of climate models, hydrological model structures and land use scenarios on hydrological impacts of climate change. J. Hydrol. 2016, 535, 301–317. [Google Scholar] [CrossRef]
  7. Xu, C.; Chen, Y.; Chen, Y.; Zhao, R.; Ding, H. Responses of Surface Runoff to Climate Change and Human Activities in the Arid Region of Central Asia: A Case Study in the Tarim River Basin, China. Environ. Manag. 2013. [Google Scholar] [CrossRef]
  8. Lioubimtseva, E.; Henebry, G.M. Climate and environmental change in arid Central Asia: Impacts, vulnerability, and adaptations. J. Arid Environ. 2009, 73, 963–977. [Google Scholar] [CrossRef]
  9. Deng, H.; Chen, Y.N.; Wang, H.J.; Zhang, S.H. Climate change with elevation and its potential impact on water resources in the tianshan mountains, central Asia. Glob. Planetary Chang. 2015, 135, 28–37. [Google Scholar] [CrossRef]
  10. White, C.J.; Tanton, T.W.; Rycroft, D.W. The Impact of Climate Change on the Water Resources of the Amu Darya Basin in Central Asia. Water Resour. Manag. 2014, 28, 5267–5281. [Google Scholar] [CrossRef]
  11. Jianqing, Z.; Mingjin, Z.; Buda, S. The Interpretation of Freshwater Resources in the Fifth Assessment Report of IPCC. Progress. Inquisitiones DE Mutat. Clim. 2014, 2014. [Google Scholar] [CrossRef] [Green Version]
  12. Chen, S.Y.; Shi, Y.Y.; Guo, Y.Z.; Zheng, Y.X. Temporal and spatial variation of annual mean air temperature in arid and semiarid region in northwest China over a recent 46 year period. J. Arid Land 2010, 2, 87–97. [Google Scholar] [CrossRef]
  13. Zhang, Q.; Xu, C.-Y.; Yang, T. Scaling properties of the runoff variations in the arid and semi-arid regions of China: A case study of the Yellow River basin. Stoch. Environ. Res. Risk Assess. 2009, 23, 1103–1111. [Google Scholar] [CrossRef]
  14. Balocchi, F.; Pizarro, R.; Meixner, T.; Urbina, F. Annual and monthly runoff analysis in the Elqui River, Chile, a semi-arid snow-glacier fed basin. Tecnologia Y Ciencias Del Agua 2017, 8, 23–35. [Google Scholar] [CrossRef]
  15. Alifujiang, Y.; Abuduwaili, J.; Ma, L.; Samat, A.; Groll, M. System Dynamics Modeling of Water Level Variations of Lake Issyk-Kul, Kyrgyzstan. Water 2017, 9, 989. [Google Scholar] [CrossRef] [Green Version]
  16. Alymkulova, B.; Abuduwaili, J.; Issanova, G.; Nahayo, L. Consideration of Water Uses for Its Sustainable Management, the Case of Issyk-Kul Lake, Kyrgyzstan. Water 2016, 8, 298. [Google Scholar] [CrossRef] [Green Version]
  17. Gocic, M.; Trajkovic, S. Analysis of changes in meteorological variables using Mann-Kendall and Sen’s slope estimator statistical tests in Serbia. Glob. Planetary Chang. 2013, 100, 172–182. [Google Scholar] [CrossRef]
  18. Rahman, M.A.; Yunsheng, L.; Sultana, N. Analysis and prediction of rainfall trends over Bangladesh using Mann–Kendall, Spearman’s rho tests and ARIMA model. Meteorol. Atmos. Phys. 2016. [Google Scholar] [CrossRef]
  19. He, X.; Guan, H.D.; Zhang, X.P.; Simmons, C.T. A wavelet-based multiple linear regression model for forecasting monthly rainfall. Int. J. Climatol. 2014, 34, 1898–1912. [Google Scholar] [CrossRef]
  20. Eslami-Andargoli, L.; Dale, P.; Sipe, N.; Chaseling, J. Mangrove expansion and rainfall patterns in Moreton Bay, Southeast Queensland, Australia. Estuar. Coast. Shelf Sci. 2009, 85, 292–298. [Google Scholar] [CrossRef] [Green Version]
  21. Sang, Y.-F.; Wang, Z.; Liu, C. Comparison of the MK test and EMD method for trend identification in hydrological time series. J. Hydrol. 2014, 510, 293–298. [Google Scholar] [CrossRef]
  22. Zhao, X.; Li, Z.; Zhu, Q.; Zhu, D.; Liu, H. Climatic and drought characteristics in the loess hilly-gully region of China from 1957 to 2014. PLoS ONE 2017, 12, e0178701. [Google Scholar] [CrossRef] [PubMed] [Green Version]
  23. Adarsh, S.; Reddy, M.J. Trend analysis of rainfall in four meteorological subdivisions of southern India using nonparametric methods and discrete wavelet transforms. Int. J. Climatol. 2015, 35, 1107–1124. [Google Scholar] [CrossRef]
  24. Caloiero, T.; Coscarelli, R.; Ferrari, E. Application of the Innovative Trend Analysis Method for the Trend Analysis of Rainfall Anomalies in Southern Italy. Water Resour. Manag. 2018. [Google Scholar] [CrossRef]
  25. Wang, Y.; Xu, Y.; Tabari, H.; Jie, W. Innovative trend analysis of annual and seasonal rainfall in the Yangtze River Delta, eastern China. Atmos. Res. 2020, 231. [Google Scholar] [CrossRef]
  26. Şen, Z. Innovative Trend Analysis Methodology. J. Hydrol. Eng. 2012, 17, 1042–1046. [Google Scholar] [CrossRef]
  27. Kisi, O. An innovative method for trend analysis of monthly pan evaporations. J. Hydrol. 2015, 527, 1123–1129. [Google Scholar] [CrossRef]
  28. Tabari, H.; Taye, M.T.; Onyutha, C.; Willems, P. Decadal Analysis of River Flow Extremes Using Quantile-Based Approaches. Water Resour. Manag. 2017, 31, 3371–3387. [Google Scholar] [CrossRef]
  29. Caloiero, T. Evaluation of rainfall trends in the South Island of New Zealand through the innovative trend analysis (ITA). Theor. Appl. Climatol. 2019, 139, 493–504. [Google Scholar] [CrossRef]
  30. Li, J.; Wu, W.; Ye, X.; Jiang, H. Innovative trend analysis of main agriculture natural hazards in China during 1989–2014. Nat. Hazards 2018. [Google Scholar] [CrossRef]
  31. Saplıoğlu, K.; Kilit, M.; Yavuz, B.K. Trend analysis of streams in the Western Mediterranean Basin of Turkey. Fresenius Environ. Bull. 2014, 23, 313–324. [Google Scholar]
  32. Wu, H.; Qian, H. Innovative trend analysis of annual and seasonal rainfall and extreme values in Shaanxi, China, since the 1950s. Int. J. Climatol. 2017, 37, 2582–2592. [Google Scholar] [CrossRef]
  33. Alashan, S. An improved version of innovative trend analyses. Arab. J. Geosci. 2018, 11. [Google Scholar] [CrossRef]
  34. Dean, J.F.; Webb, J.A.; Jacobsen, G.E.; Chisari, R.; Dresel, P.E. A groundwater recharge perspective on locating tree plantations within low-rainfall catchments to limit water resource losses. Hydrol. Earth Syst. Sci. 2015, 19, 1107–1123. [Google Scholar] [CrossRef] [Green Version]
  35. García-Garizábal, I. Rainfall variability and trend analysis in coastal arid Ecuador. Int. J. Climatol. 2017. [Google Scholar] [CrossRef]
  36. Karthe, D.; Chalov, S.; Borchardt, D. Water Resources and Their Management in Central Asia in the Early 21st Century: Status, Challenges and Future Prospects. Environ. Earth Sci. 2014, 73, 487–499. [Google Scholar] [CrossRef]
  37. Mathis, M.; Sorrel, P.; Klotz, S.; Huang, X.; Oberhänsli, H. Regional vegetation patterns at lake Son Kul reveal Holocene climatic variability in central Tien Shan (Kyrgyzstan, Central Asia). Quat. Sci. Rev. 2014, 89, 169–185. [Google Scholar] [CrossRef]
  38. Junli, L.I.; Müller, J.P.; Schneider, J.F. Spatio-temporal Analysis of Recent Changes of Lake Area and Lake Water Level at High Mountains in Central Asia. Resour. Sci. 2011, 33, 1839–1846. [Google Scholar]
  39. Aizen, V.B.; Aizen, E.; Glazirin, G.; Loaiciga, H. Simulation of daily runoff in Central Asian alpine watersheds. J. Hydrol. 2000, 238, 15–34. [Google Scholar] [CrossRef]
  40. Kakahaji, H.; Banadaki, H.D.; Kakahaji, A.; Kakahaji, A. Prediction of Urmia Lake Water-Level Fluctuations by Using Analytical, Linear Statistic and Intelligent Methods. Water Resour. Manag. 2013, 27, 4469–4492. [Google Scholar] [CrossRef]
  41. Romanovsky, V.V. Water Level Variations and Water Balance of Lake Issyk-Kul. In Lake Issyk-Kul: Its Natural Environment; Springer: Dordrecht, The Netherlands, 2002. [Google Scholar]
  42. Salamat, A.U.; Abuduwaili, J.; Shaidyldaeva, N. Impact of climate change on water level fluctuation of Issyk-Kul Lake. Arab. J. Geosci. 2015, 8, 5361–5371. [Google Scholar] [CrossRef]
  43. Romanovsky, V.V.; Tashbaeva, S.; Cretaux, J.; Calmant, S. The closed Lake Issyk-Kul as an indicator of global warming in Tien-Shan. Nat. Sci. 2013, 5, 608–623. [Google Scholar] [CrossRef] [Green Version]
  44. Ferronskii, V.I.; Polyakov, V.A.; Brezgunov, V.S.; Vlasova, L.S.; Karpychev, Y.A.; Bobkov, A.F.; Romaniovskii, V.V.; Johnson, T.; Ricketts, D.; Rasmussen, K. Variations in the Hydrological Regime of Kara-Bogaz-Gol Gulf, Lake Issyk-Kul, and the Aral Sea Assessed Based on Data of Bottom Sediment Studies. Water Resour. 2003, 30, 252–259. [Google Scholar] [CrossRef]
  45. Shabunin, G.D.; Shabunin, A.G. Climate and Physical Properties of Water in Lake Issyk-Kul. In Lake Issyk-Kul: Its Natural Environment; Springer: Dordrecht, The Netherlands, 2002. [Google Scholar]
  46. Mann, H.B. Nonparametric Tests against Trend. Econometrica 1945, 13, 245–259. [Google Scholar] [CrossRef]
  47. Kendall, M.G. A new measure of rank correlation. Biometrika 1938, 30, 81–93. [Google Scholar] [CrossRef]
  48. Miao, C.Y.; Ni, J.R.; Borthwick, A.G.L. Recent changes of water discharge and sediment load in the Yellow River basin, China. Progress Phys. Geogr. 2010, 34, 541–561. [Google Scholar] [CrossRef] [Green Version]
  49. Farlie, D.J.G. Rank Correlation Methods—Kendall, Mg. J. R. Stat. Soc. Ser. General 1971, 134, 682. [Google Scholar] [CrossRef]
  50. Şen, Z. Innovative trend significance test and applications. Theor. Appl. Climatol. 2015, 127, 1–9. [Google Scholar] [CrossRef]
  51. Dorjsuren, B.; Yan, D.H.; Wang, H.; Sonomdagva, C.; Enkhbold, A.; Xu, Y.; Girma, A.; Gedefaw, M.; Abiyu, A. Observed Trends of Climate and River Discharge in Mongolia’s Selenga Sub-Basin of the Lake Baikal Basin. Water 2018, 10, 1436. [Google Scholar] [CrossRef] [Green Version]
  52. Malik, A.; Kumar, A.; Guhathakurta, P.; Kisi, O. Spatial-temporal trend analysis of seasonal and annual rainfall (1966–2015) using innovative trend analysis method with significance test. Arab. J. Geosci. 2019, 12, 328. [Google Scholar] [CrossRef]
  53. Zhou, Z.; Wang, L.; Lin, A.; Zhang, M.; Niu, Z. Innovative trend analysis of solar radiation in China during 1962–2015. Renew. Energy 2018, 119, 675–689. [Google Scholar] [CrossRef]
  54. Sonali, P.; Kumar, D.N. Review of trend detection methods and their application to detect temperature changes in India. J. Hydrol. 2013, 476, 212–227. [Google Scholar] [CrossRef]
  55. Şen, Z. Innovative Trend Methodologies in Science and Engineering; Springer: Berlin, Germany, 2017. [Google Scholar] [CrossRef]
  56. Lacombe, G.; McCartney, M.; Forkuor, G. Drying Climate in Ghana over the Period 1960–2005: Evidence from the Resampling-Based Mann-Kendall Test at Local and Regional Levels. Hydrologic. Sci. J. 2012, 8. [Google Scholar] [CrossRef] [Green Version]
Figure 1. The location of Lake Issyk-Kul Basin, Kyrgyzstan, Central Asia.
Atmosphere 11 00332 g001
Figure 2. Example of the innovative trend analysis (ITA) method proposed by Şen [26]. (a) non-monotonic trends and (b) the trends of each cluster (low, medium and high).
Atmosphere 11 00332 g002
Figure 3. The results of applying the ITA method for monthly precipitation at the Balykchy station in the Lake Issyk-Kul basin 1951–2012.
Atmosphere 11 00332 g003
Figure 4. The results of the ITA method for monthly precipitation at the Cholpon-Ata station in the Lake Issyk-Kul basin 1951–2012.
Atmosphere 11 00332 g004
Figure 5. The results of applying the ITA method for monthly precipitation at the Kyzyl-Suu station in the Lake Issyk-Kul basin 1951–2012.
Atmosphere 11 00332 g005
Table 1. Monthly average precipitation for the three studied stations in the Lake Issyk-Kul basin (1951–2012).
PrecipitationJanFebMarAprMayJunJulAugSepOctNovDecMean
Stationmmmmmmmmmmmmmmmmmmmmmmmmmm
Balykchy1.21.43.76.823.627.129.226.110.74.51.31.2136.7
Cholpon-Ata8.910.716.820.732.030.839.341.530.423.216.39.9280.6
Kyzyl-Suu17.717.824.732.949.149.654.450.436.534.725.319.1412.2
Average9.27 9.97 15.07 20.13 34.90 35.83 40.97 39.33 25.87 20.80 14.30 10.07 276.50
Table 2. The results of the monotonic Mann-Kendall trend test for monthly precipitation in the Lake Issyk-Kull basin.
StationsBalykchyCholpon-AtaKyzyl-Suu
Z MonthMann-Kendall Test Statistics (S)Zc [H0] Values per MonthMann-Kendall Test Statistics (S)Zc [H0] Values per MonthMann-Kendall Test Statistics (S)Zc [H0] Values per Month
Jan−169−0.784[A]−103−0.619[A]−14−0.079[A]
Feb4092.769[R] ***3932.381[R] **3091.871[A] *
Mar1871.476[A]−44−0.018[A]1200.723[A]
Apr270.516[A]−40.172[A]−203−1.227[A]
May−30.352[A]710.425[A]−41−0.243[A]
Jun−170.267[A]−23−0.134[A]−42−0.249[A]
Jul−76−0.079[A]1080.650[A]870.522[A]
Aug−120.292[A]−160−0.966[A]−171−1.033[A]
Sep−200.243[A]2531.531[A]2411.458[A]
Oct−5943.912[R] ***3672.223[R] **4292.600[R] ***
Nov2261.604[A]−50−0.298[A]−75−0.449[A]
Dec2621.786[A] *1260.759[A]2001.209[A]
Note: R: rejected, A: accepted. * Trends at the 90% confidence level; ** Trends at the 95% confidence level; *** Trends at the 99% confidence level.
Table 3. A comparison of the Mann-Kendall trend test and the ITA method for analyzing the temporal precipitation dynamics in the Lake Issyk-Kul basin between 1951 and 2012.
Balykchy StationCholpon-Ata StationKyzyl-Suu Station
MonthMK TestITA MethodMK TestITA MethodMK TestITA Method
Low HighLow HighLow High
Jan
Feb
NoNoNoNoNoNoNoNoYes (-)
Yes (+)Yes (+)Yes (+)Yes (+)Yes (+)Yes (+)Yes (+)Yes (+)No
Mar
Apr
NoNoYes (+)NoNoNoNoNoYes (+)
NoNoNoNoYes (-)Yes (+)NoYes (-)Yes (+)
May
Jun
NoNoYes (-)NoYes (+)Yes (+)NoNoYes (+)
NoNoYes (-)NoNoYes (+)NoNoYes (+)
Jul
Aug
NoNoYes (-)NoYes (+)Yes (+)NoNoYes (+)
NoYes (+)NoNoNoYes (-)NoNoNo
Sep
Oct
NoYes (-)NoNoYes (+)NoNoNoYes (+)
Yes (+)Yes (+)NoYes (+)Yes (+)Yes (+)Yes (+)Yes (+)No
Nov
Dec
NoNoNoNoYes (-)NoNoYes (+)No
Yes (+)Yes (+)Yes (+)NoYes (+)Yes (-)NoYes (+)Yes (+)
Table 4. The values of the linear regression slope and D of ITA for monthly precipitation in the Lake Issyk-Kul basin from 1951 to 2012.
MonthBalykchyCholpon-AtaKyzyl-Suu
Slope bITA (D)Slope bITA (D)Slope bITA (D)
Jan
Feb
0.016.09 **−0.03−0.49−0.02−1.14
0.0426.94 **0.136.16 **0.063.15 **
Mar
Apr
0.046.54 **−0.03−0.230.101.36
0.010.270.041.14−0.11−0.87
May
Jun
0.04−0.120.081.880.041.27
0.004−0.37−0.010.530.131.43
Jul
Aug
0.001−0.240.101.360.222.07 *
0.021.97 *−0.20−0.99−0.24−0.42
Sep
Oct
0.03−0.950.221.070.171.71
0.094.96 **0.2710.46 **0.324.29 **
Nov
Dec
0.01−1.010.01−0.16−0.08−0.17
0.0429.29 **0.023.82 **0.163.43 **
* Trends at the 95% confidence level; ** Trends at the 99% confidence level.

