Article

A Study of the Effect of Brake Pad Scorching on Tribology and Airborne Particle Emissions

1
Department of Mechanical Engineering, Lund University, 221 00 Lund, Sweden
2
Department of Machine Design, KTH Royal Institute of Technology, 100 44 Stockholm, Sweden
3
Department of Industrial Engineering, University of Trento, Via Sommarive 9, Povo, 38122 Trento, Italy
4
Brembo S.p.A., Advanced R&D Department, 240 40 Stezzano (BG), Italy
*
Author to whom correspondence should be addressed.
Atmosphere 2020, 11(5), 488; https://doi.org/10.3390/atmos11050488
Submission received: 15 April 2020 / Revised: 7 May 2020 / Accepted: 8 May 2020 / Published: 10 May 2020
(This article belongs to the Special Issue Study of Brake Wear Particle Emissions)

Abstract

:
Non-exhaust wear emissions from disc brakes affect the air quality in cities throughout the world. These emissions come from the wear of the contact surfaces of both the pads and disc. The tribological and emissions performance of disc brakes strongly depend on the contact surface characteristics of the pads and discs. The surfaces of conventional pads are scorched by heating it to several hundred degrees to make the resin carbonize down to a few millimetres deep into the pad. This is done to have a shorter run-in period for new pads. It is not known how scorching will affect the amount of airborne particle emissions. Therefore, the aim of the present study is to investigate how pad scorching influence the airborne particle emissions. This is done by comparing the pin-on-disc tribometer and inertia dyno bench emission results from a Cu-free friction material run against a grey cast iron disc. Three types of modified friction material surfaces have been tested: scorched, extra-scorched and rectified. The results show that the level of scorching strongly affects the airborne particle emissions in the initial phase of the tests. Even if the scorched layer is removed (rectified) before testing, it seems like it still has a measurable influence on the airborne particle emissions. The results from the tribometer tests are qualitatively in line with the inertia dyno bench test for about the first forty brake events; thereafter, the airborne particle emissions are higher for the scorched pads. It can be concluded that it seems that the level of scorching has an adverse influence on both the tribological performance and level of particle emissions.

1. Introduction

Emissions from the transport sector is one of the main contributors to the total airborne particle emission in urban areas [1]. Exhaust and non-exhaust emissions (airborne wear particles from tyres, roads, clutches and brakes) contribute equally to the total traffic generated emissions [2,3]. It has been reported [4] that wear emissions from brake systems contribute up to 55% of the non-exhaust airborne emissions.
It should be noted that electric vehicles are about 25% heavier than equivalent internal combustion engine vehicles [5,6], which means that the non-exhaust wear emissions are expected to increase in the future. Some electric vehicles use regenerative brakes on the driving wheels, but they are still equipped with mechanical brakes on all axles. A major drawback with regenerative brakes is that the efficiency is very low at low vehicle speeds [7] and, therefore, the mechanical brakes are used during city driving. Non-exhaust emissions are not yet regulated but the UN-ECE PMP informal working group for particulates, who developed the limit values for exhaust emissions, and are currently working on guidelines for non-exhaust emissions.
Most road vehicles are equipped with mechanical brake systems. A mechanical disc brake basically consists of a calliper with two pads and a disc that is fixed to the wheel. When braking, the stationary pads are forced into contact with the rotating disc, and the friction between the contact surfaces makes the vehicle slow down. The emissions from the disc brakes originate from the wear of the pads and discs’ contact surfaces. A fraction of the wear becomes airborne and a fraction falls to the ground or get stuck on other surfaces.
The possibility of measuring the friction, wear, and particle emissions generated from automotive disc brakes has been studied using test stands, both with pin-on-disc tribometers [8] and disc brake assembly test stands [9,10,11,12], as well as on cars, both with chassis dyno [13] and in field [14]. Pin-on-disc tribometers (PoD) have shown to be useful to explain phenomena occurring on a material level and to rank the pad-to-rotor material contact pairs in terms of tribological and emission performances [15].
There are several ways to change the tribology and emission performance during the design process of novel pad and rotor materials. One way is to change the material composition of the bulk materials and another way is to change the contact surface properties. To change the tribology performance of the pad material, the bulk composition could be modified by different binders, fillers, reinforcing fibres, and frictional additives [16]. Manufacturing techniques also affects the pad tribology performance [17]. The pad surface could be modified by different surface treatment techniques, such as grinding and pyrolysis.
Matějka et al. [18] investigated the run-in behaviour with respect to airborne particle emissions of brand new and used pads and rotors with a dyno bench setup. They concluded that new pads and rotors emit significantly more airborne particles than used ones and this could be improved by appropriate surface treatments in the production of new pads. Perricone et al. [19] tested a conventional disc brake system with an inertia brake dyno bench developed for disc brake emission studies and concluded that a significant part of the airborne emissions that were generated at severe braking, with pad bulk temperatures above 180 °C, are volatiles. They discussed that these volatiles probably originate from the decomposition of the pad resin. Ma et al. [20] compared tests run with a PoD tribometer and a stationary induction heater to distinguish how much of the emission is generated only from heat. They concluded that about 5% of the number of airborne particles are heat generated.
The surface of the conventional friction material of the brake pads used in passenger vehicles are usually treated by scorching at the end of production. During this process, the surface is heated up to several hundred degrees to make the resin carbonize down to a few millimetres [21]. The heating can be done either by a hotplate or by infrared radiation. Scorching is also aimed at having a shorter bedding-in of new pads and to prevent possible initial fading.
There is a lack of studies about the effect of the level of scorching on the amount of airborne particle emissions presented in the literature. Therefore, the aim of the present study is to investigate how pad scorching influences the airborne particle emissions. This is done by comparing PoD airborne emission results of low metallic friction material scorched at different levels run against a grey cast iron disc. The results are compared with inertia dyno bench tests to validate the methodology.

2. Experimental Methodology

An illustration of the experimental methodology used in the present work can be seen in Figure 1. First, the reference car, brake system and driving cycle were chosen. When these were set, the test specimens for both the PoD tribometer and inertia dyno bench testing were manufactured. Thereafter, the tribometer was run in parallel with the dyno bench tests. The outputs from the tribometer were used to explain the phenomenon that occurs on a material scale while the dyno bench results were used to validate these observations on a system scale. In the following sub-section, each box in Figure 1 will be explained in more detail.

2.1. Car and Brake System

In the present study, a disc brake with a fixed calliper used on the front axle in a C-segment car was used. The main elements of the brake are presented in Figure 2. The main properties of the car and the brake system are shown in Table 1. The disc brake is made of one grey cast iron disc, one fixed aluminium calliper, two Cu-free pads and four aluminium pistons.

2.2. Materials

The samples for the tribometer tests were cylindrical pin specimens (10 mm in diameter) cut-out of scorched, extra scorched and rectified full pads, whereas the disc specimens were cut-out from grey cast iron rotor material of 60 mm diameter and 6 mm thickness. A Cu-free low-metallic pad friction material was used for this study. The composition of the material, as measured by energy dispersive X-ray spectroscopy (EDXS), is given in Table 2.
The material was tested with three different surface conditions: scorched (S), extra-scorched (XS) and rectified (R). The scorched samples represent un-used pads while the rectified pads could represent pads for which the scorched layer has been worn-off after usage. The extra-scorched could also represent pad surfaces after high energy braking or long-time downhill braking. The scorched samples underwent a standard scorching process, as described by Matejka et al. [18], in which a heated plate presses the pad surface at temperatures up to 700 °C for 60 s. The extra-scorched samples were subjected to the double scorching time more than the standard scorched ones; the rectified samples were obtained by removing three superficial millimetres off the standard scorched pads with a mechanically applied shearing force.

2.3. Pin-on-Disc Tribometer

The tests were performed using a conventional PoD tribometer designed for dry sliding airborne emission studies [15]. In this setup, the disc specimen was rotating horizontally, and the normal load was applied by using dead weights. It can run with constantly applied normal forces of up to 100 N and maximum rotational speeds of 3000 rpm. The coefficient of friction (CoF) was indirectly measured using an HBM® (Hottinger Baldwin Messtechnik GmbH, Darmstadt, Germany) Z6FC3/20 kg load cell that gives the tangential force.
The mass loss of the test specimens was measured by weighing the test specimens before and after the test to the nearest 0.1 mg, using a Sartorius® (Sartorius AG, Göttingen, Germany) ME614S balance.
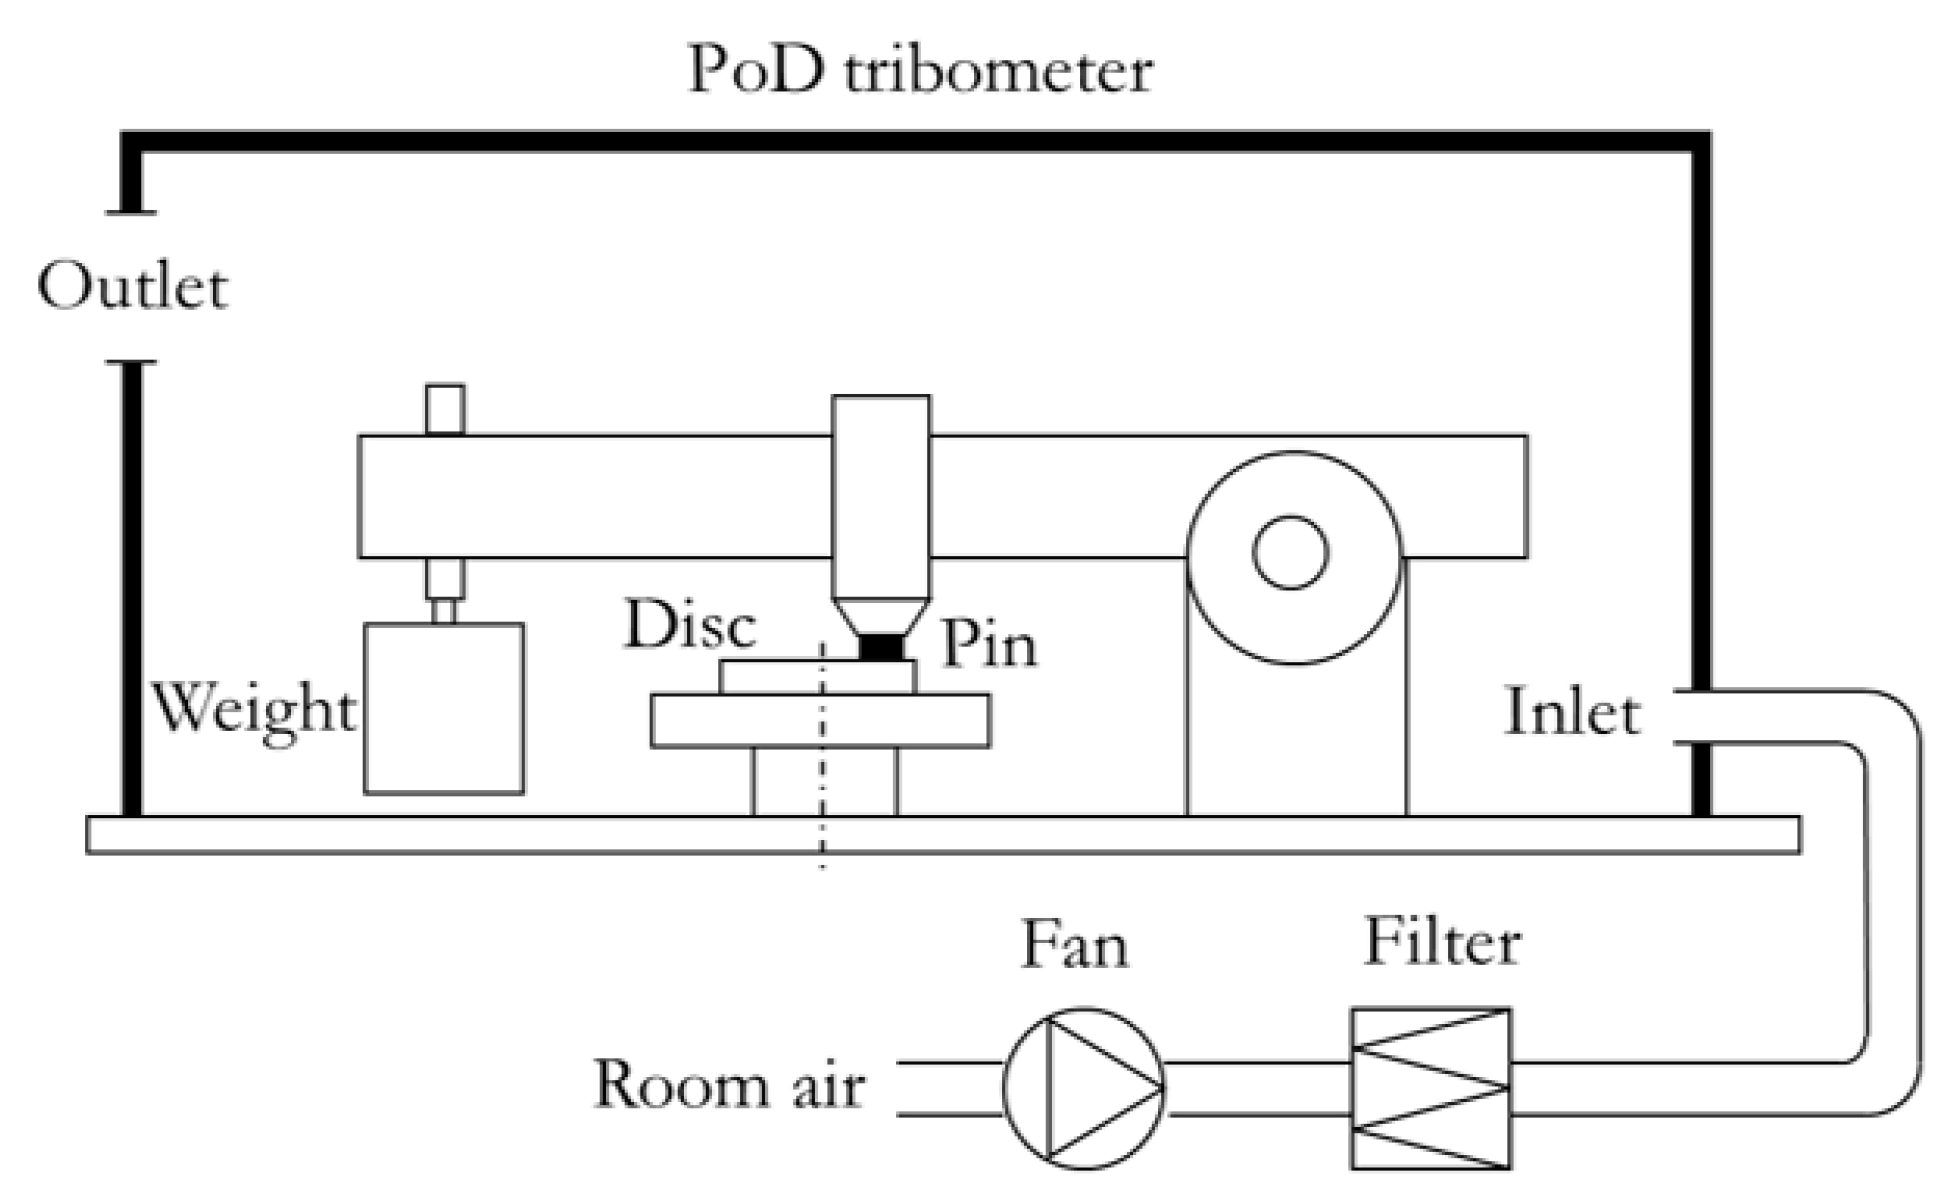
The tribometer was placed inside a closed box to enable airborne particle measurements. The test equipment is presented in Figure 3. A fan pumps ambient air through a HEPA filter to the air inlet. The HEPA filter is of class H13 EN 1822 with a collection efficiency of 99.95% at the maximum penetrating particle size, which ensures particle-free inlet air. The inlet air velocity was measured with a TSI® air velocity transducer model 8455. The air inside the box was well mixed due to the complex volume of the pin-on-disc tribometer [22]. The air inside the box transports the generated particles to the air outlet where the sampling point for the particle instruments was located. The temperature and humidity inside the box were measured but not controlled.
A Dekati® (Dekati Ltd., Kangasala, Finland) Electrical Low Pressure Impactor (ELPI+) was used for real-time measurements of particle concentrations for particle diameters from 6 nm to 10 μm. Additionally, a TSI® Optical Particle Sizer (OPS) model 3330 was used to measure the particle number concentration in the size range of 0.3 μm to 10 μm. The sampling frequency was 1 Hz for both instruments. The sampling setup was anisokinetic. The particle losses for different particle size intervals and sampling setups has been investigated in detail by Riva et al. [23]. However, in the present work, the concentration as directly measured by the particle instruments were only used to rank the different surface treatments. The measured concentrations can be used to compare the different surface treatments since the air flow through the box was about the same for all tests.
Pre-tests were run to find the normal load and sliding velocity, which resulted in a disc temperature in the steady state that corresponds to the mean disc temperature measured in the Los Angeles city traffic measurement campaign [15]. The sliding velocity of the disc was set to 2 m/s and the nominal contact pressure to 0.6 MPa. The wear track on the disc has a mid-diameter of 44 mm. Each test was run for 2 h and repeated five times.
The surface of the tested pins was observed with a JEOL IT300 scanning electron microscope (SEM), equipped with an EDXS system, in order to observe the worn surface of the friction material and its composition.

2.4. Brake Dyno Bench

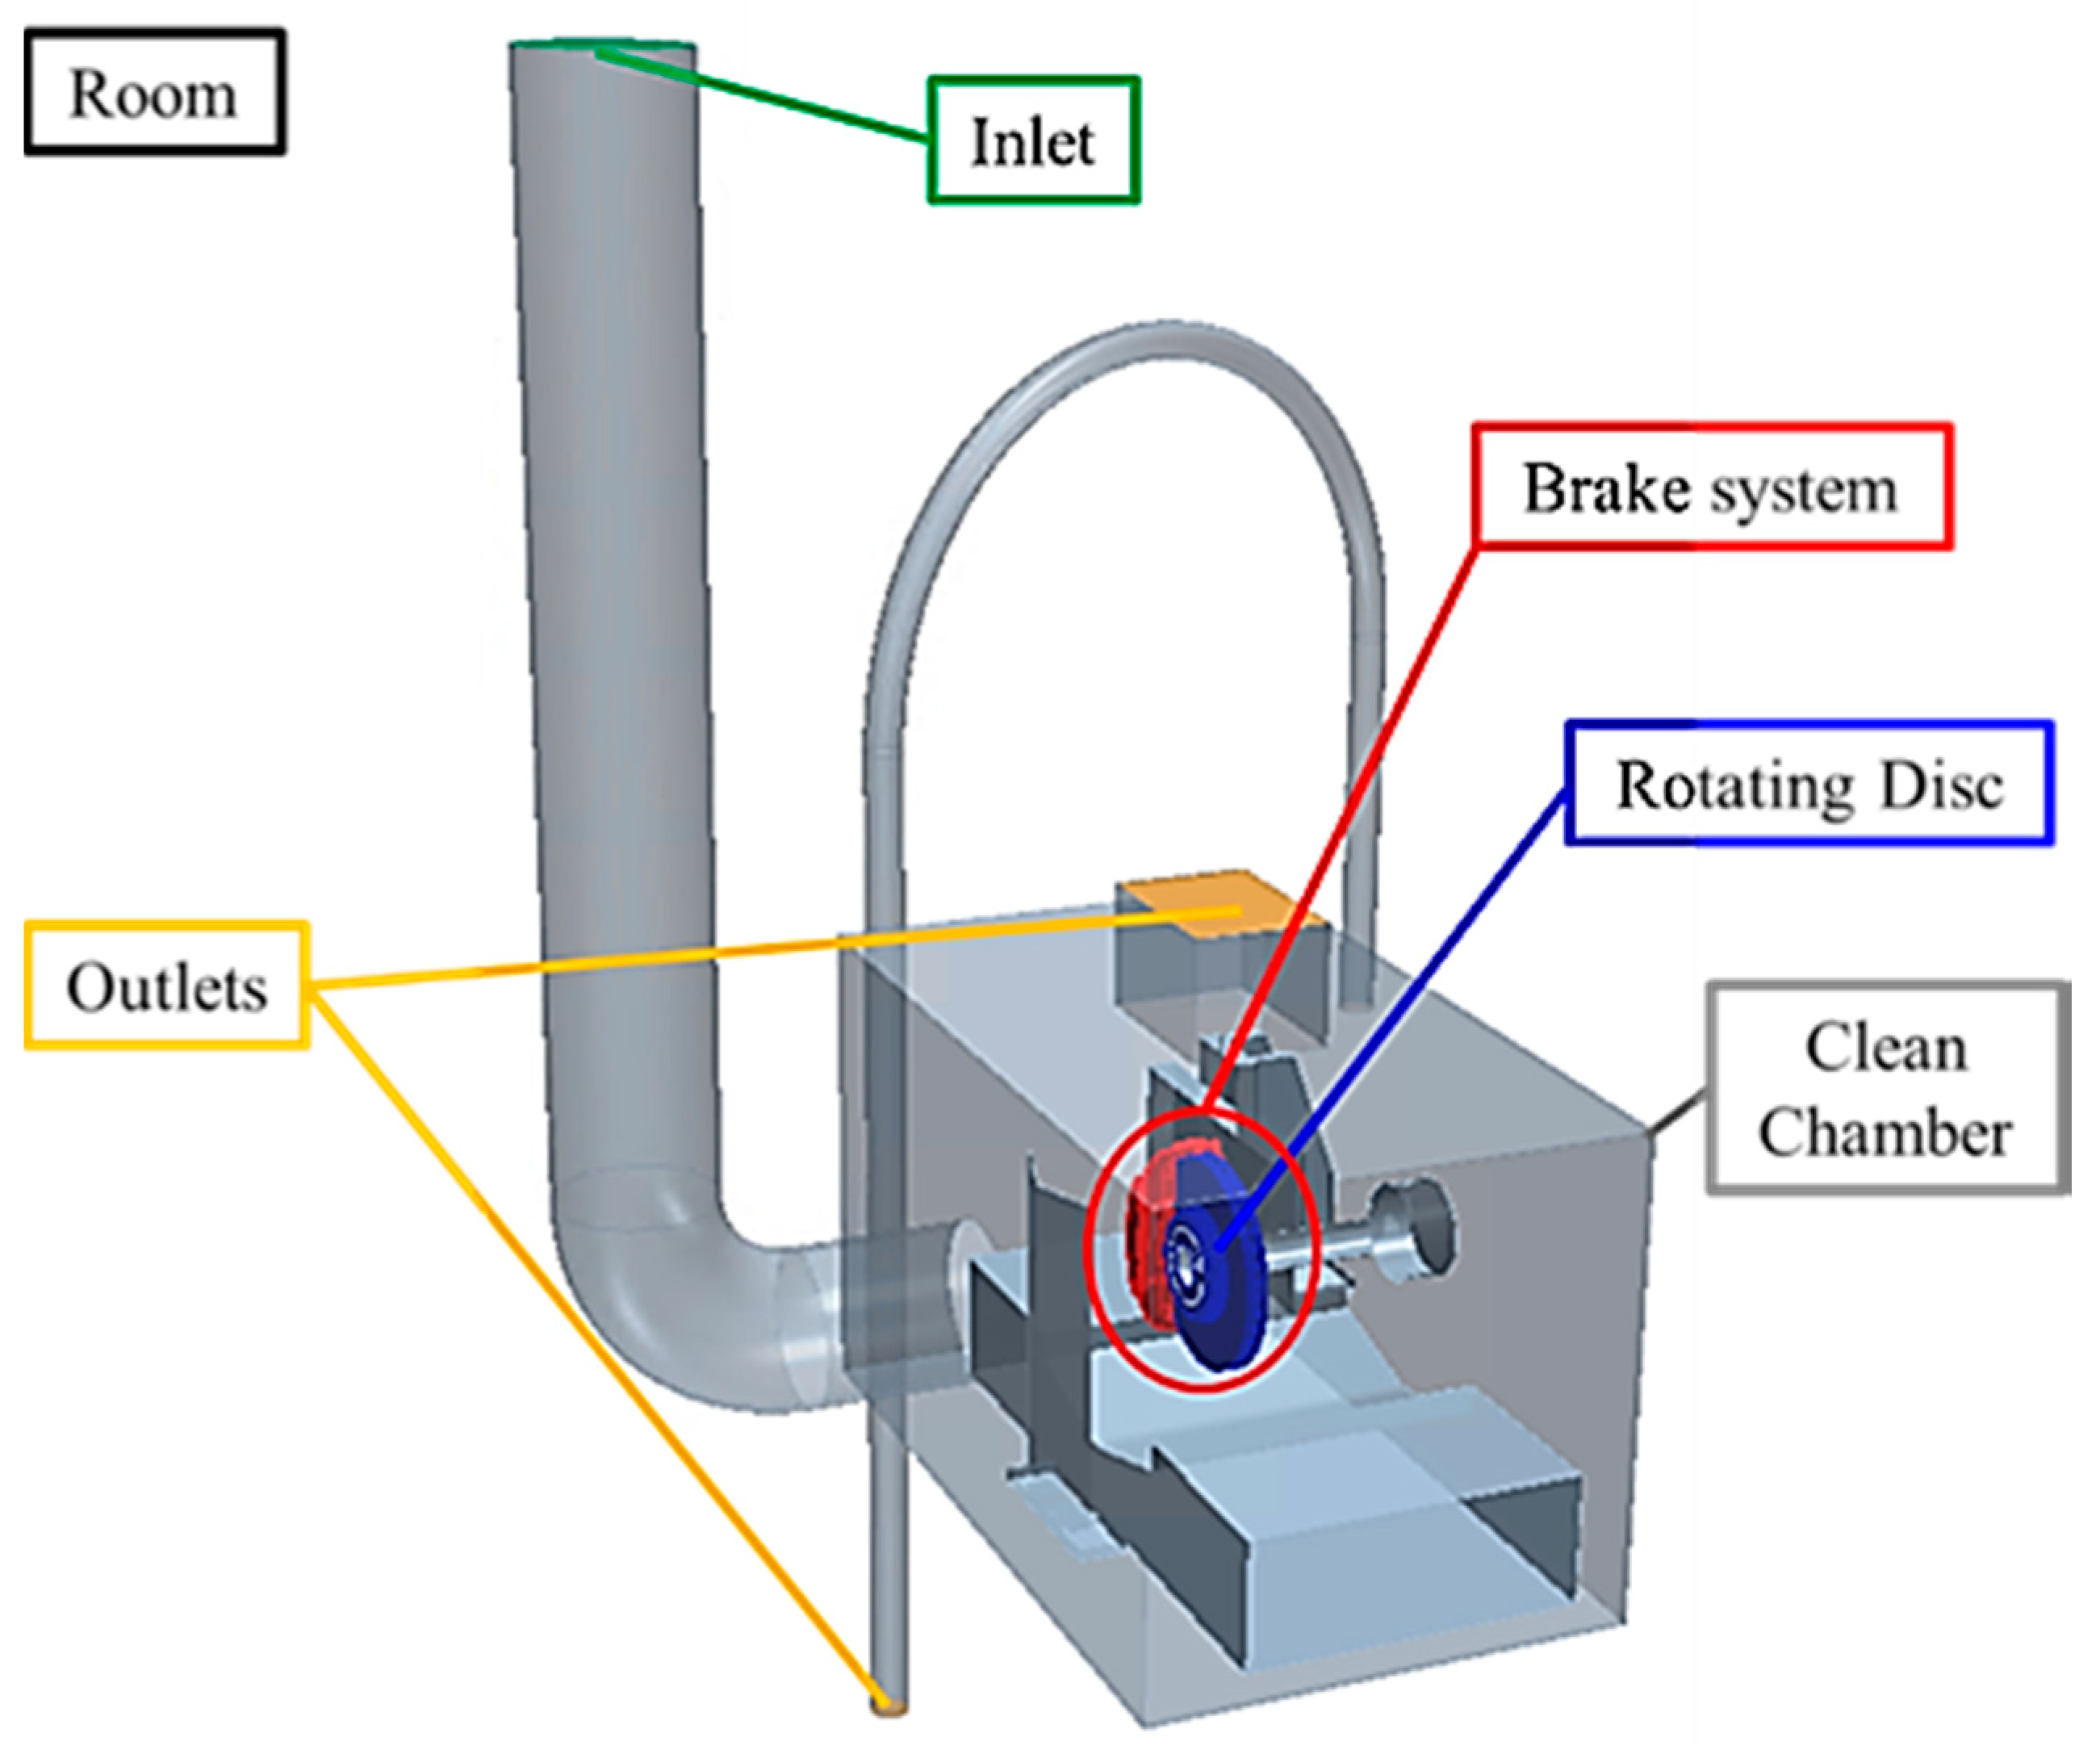
The inertia dyno bench used for validation of the PoD tribometer results was designed by Perricone et al. [19]. This bench has been frequently used to study the tribological and airborne emissions performance of disc brakes. The disc brake was mounted in a chamber in which the cleanness of the inlet air was controlled. There were two outlets on the roof of the chamber. The larger outlet was used to control the air velocity in the sampling pipe to have isokinetic sampling. An overview of the test setup can be seen in Figure 4. In the validation tests, the inlet flow rate was set to 850 m3/s, which corresponds to a velocity of about 5 m/s. A detailed description of the sampling system can be found in [19]. The directly measured values are only used in the present work in order to see the difference between the different surface treatments.
K-type thermocouples were used to measure the disc and pad temperatures online during testing. An actuator controls the hydraulic pressure and there is a torque feedback to regulate the pressure in order to obtain a constant torque braking. The disc and pad wear were measured by weighting the components with a Sartorius balance MSE14202S (repeatability ±0.01 g) before and after testing.
A driving cycle designed for airborne brake emission measurements was used to simulate urban driving [23] and its procedure is shown in Table 3. This cycle was based on car tests conducted in the city of Bergamo in Italy. Each pad surface condition was tested five times.
An ELPI+ and a TSI® (TSI Incorporated, Shoreview, MN, USA) Condensation Particle Counter (CPC) model 3775 were used to measure the airborne particles in the sampling pipe during testing. Both instruments were set to the same sampling frequency of 1 Hz. The CPC can detect airborne particles from 4 nm to 1 µm. Additionally, a DEKATI® PM10 Impactor was used to collect particles on greased aluminum foils during testing. The filters were conditioned for 24 h in an HEPA climate chamber (model Sartorius SCC400L-EPA) with controlled temperature and dew point before and after testing. To get an estimate of the PM, the filters were weighed three times in a row with a 7-digit laboratory balance (model Sartorius CUBIS MSE2.7S-000-DM).

3. Results

3.1. PoD Tests

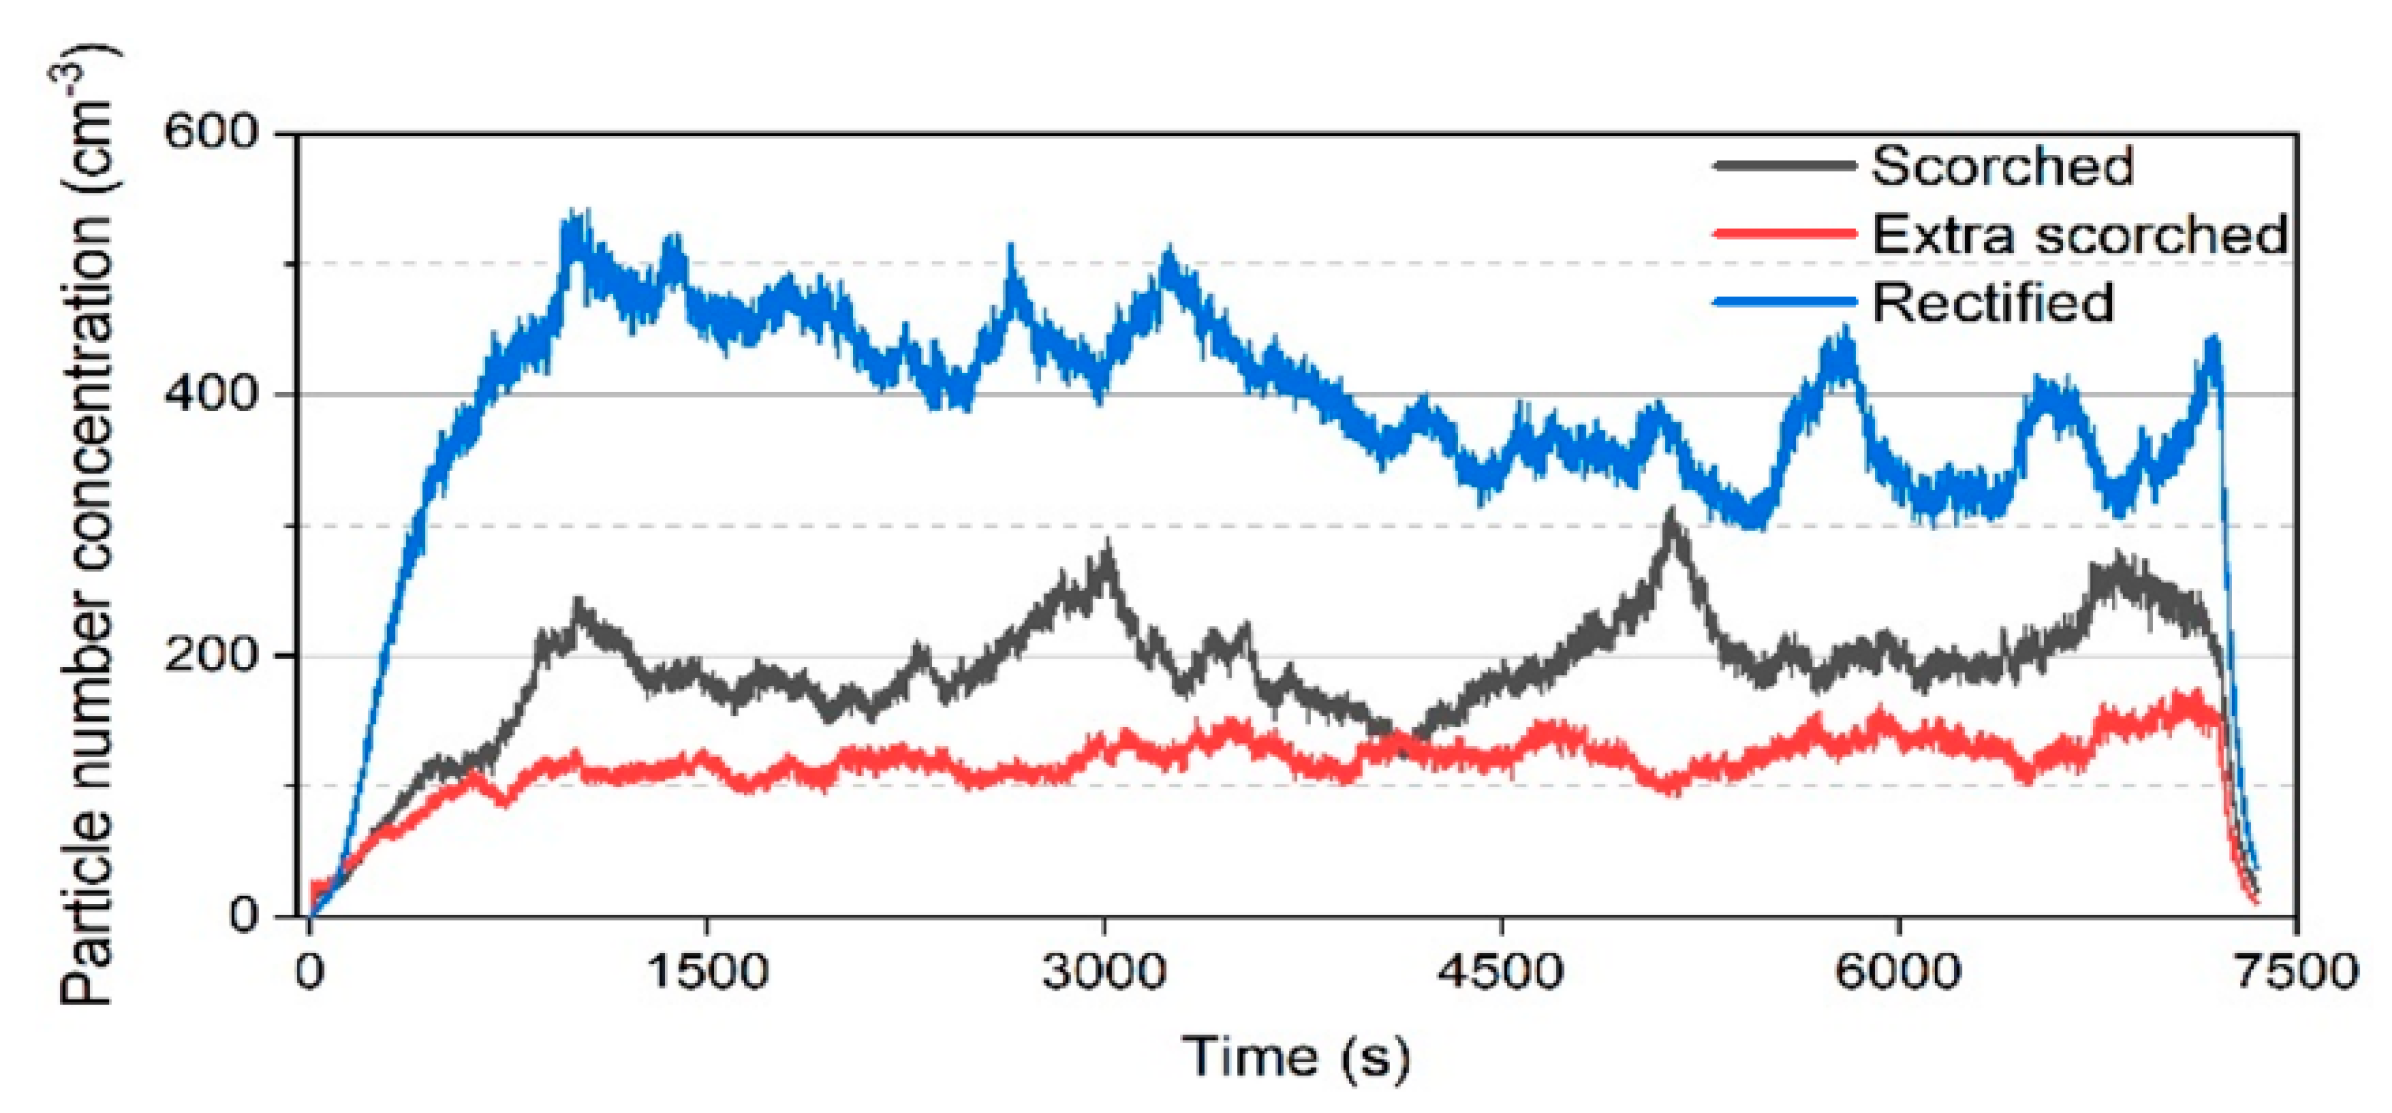
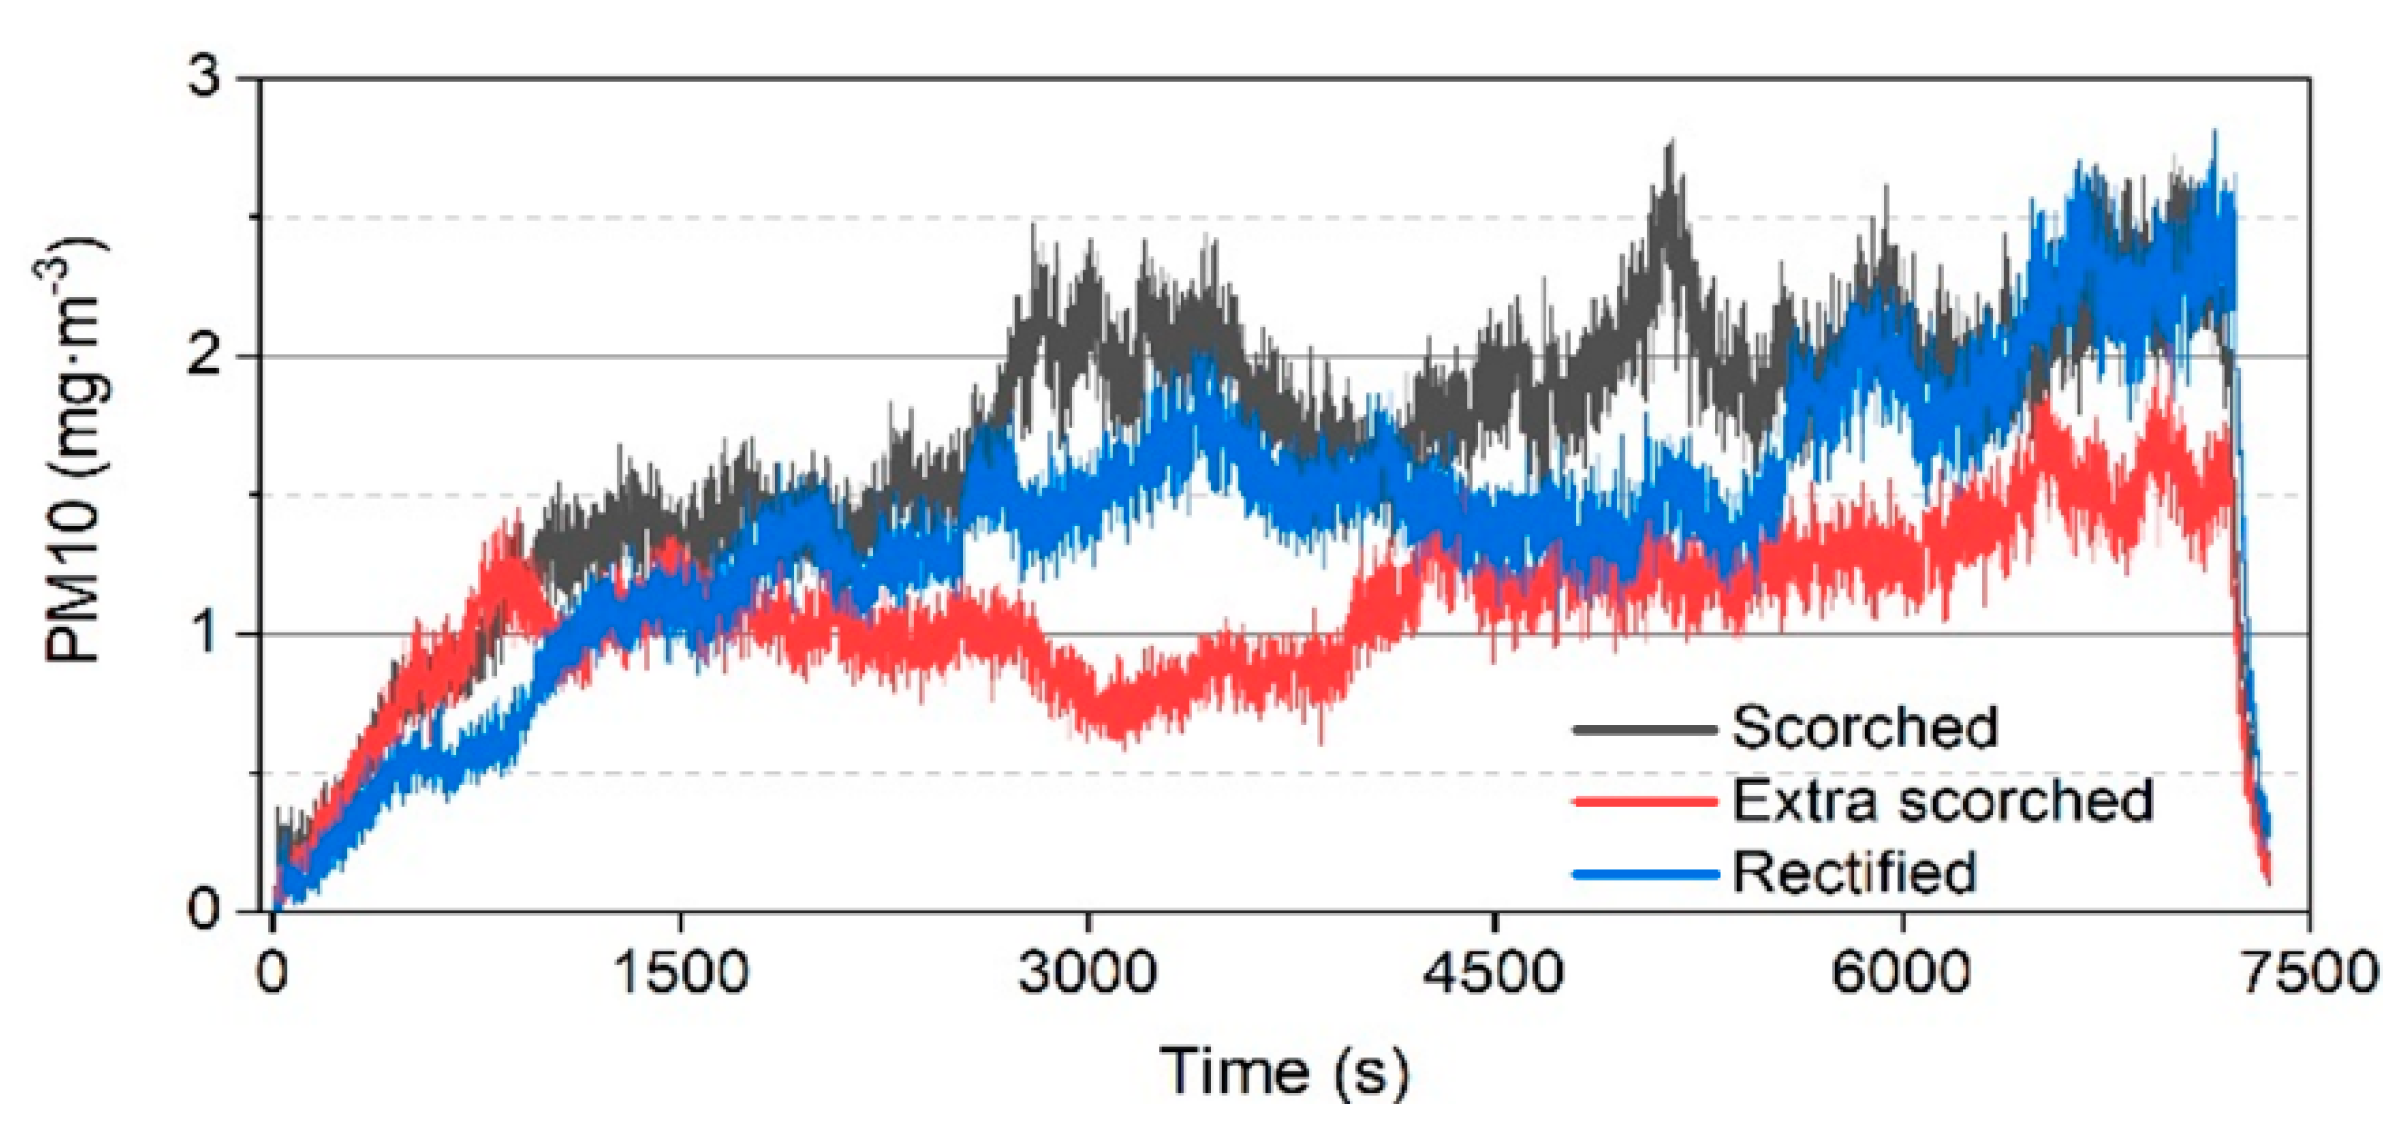
Figure 5 shows representative curves of the measured CoF versus time for three surface types. Typical curves of the airborne particle number concentration (PNC) measured by OPS and PM10, measured by ELPI+, are shown in Figure 6 and Figure 7. The mean value and standard deviation of the measured response variables are listed in Table 4. It should be noticed that the CoF, air flow rate (Qair), PNC and PM10 (particulate matter for particles with diameters smaller than 10 µm) are only evaluated after running-in (i.e., in the time interval 4000–6000 s), while the mass losses of the pin and disc samples correspond to the whole test.

3.2. Characterization of Worn Surfaces

Figure 8 shows the top views of the tested pins, for all three surface types: rectified, scorched and extra-scorched. The arrows (SD) indicate the sliding direction during the pin-on-disc tests. The friction layer formed by the primary plateaus, made of the metallic fibre, as well as the secondary plateaus, produced by the compaction of the wear debris, is visible.
The rectified sample is similar to the scorched one concerning the distribution of the wear fragments on the surface. The materials display secondary plateaus with good compaction at the interface with the metallic fibres. Instead, the extra-scorched sample features less compact secondary plateaus made by coarse particles, and a large area of the pin surface is covered by dispersive wear debris.
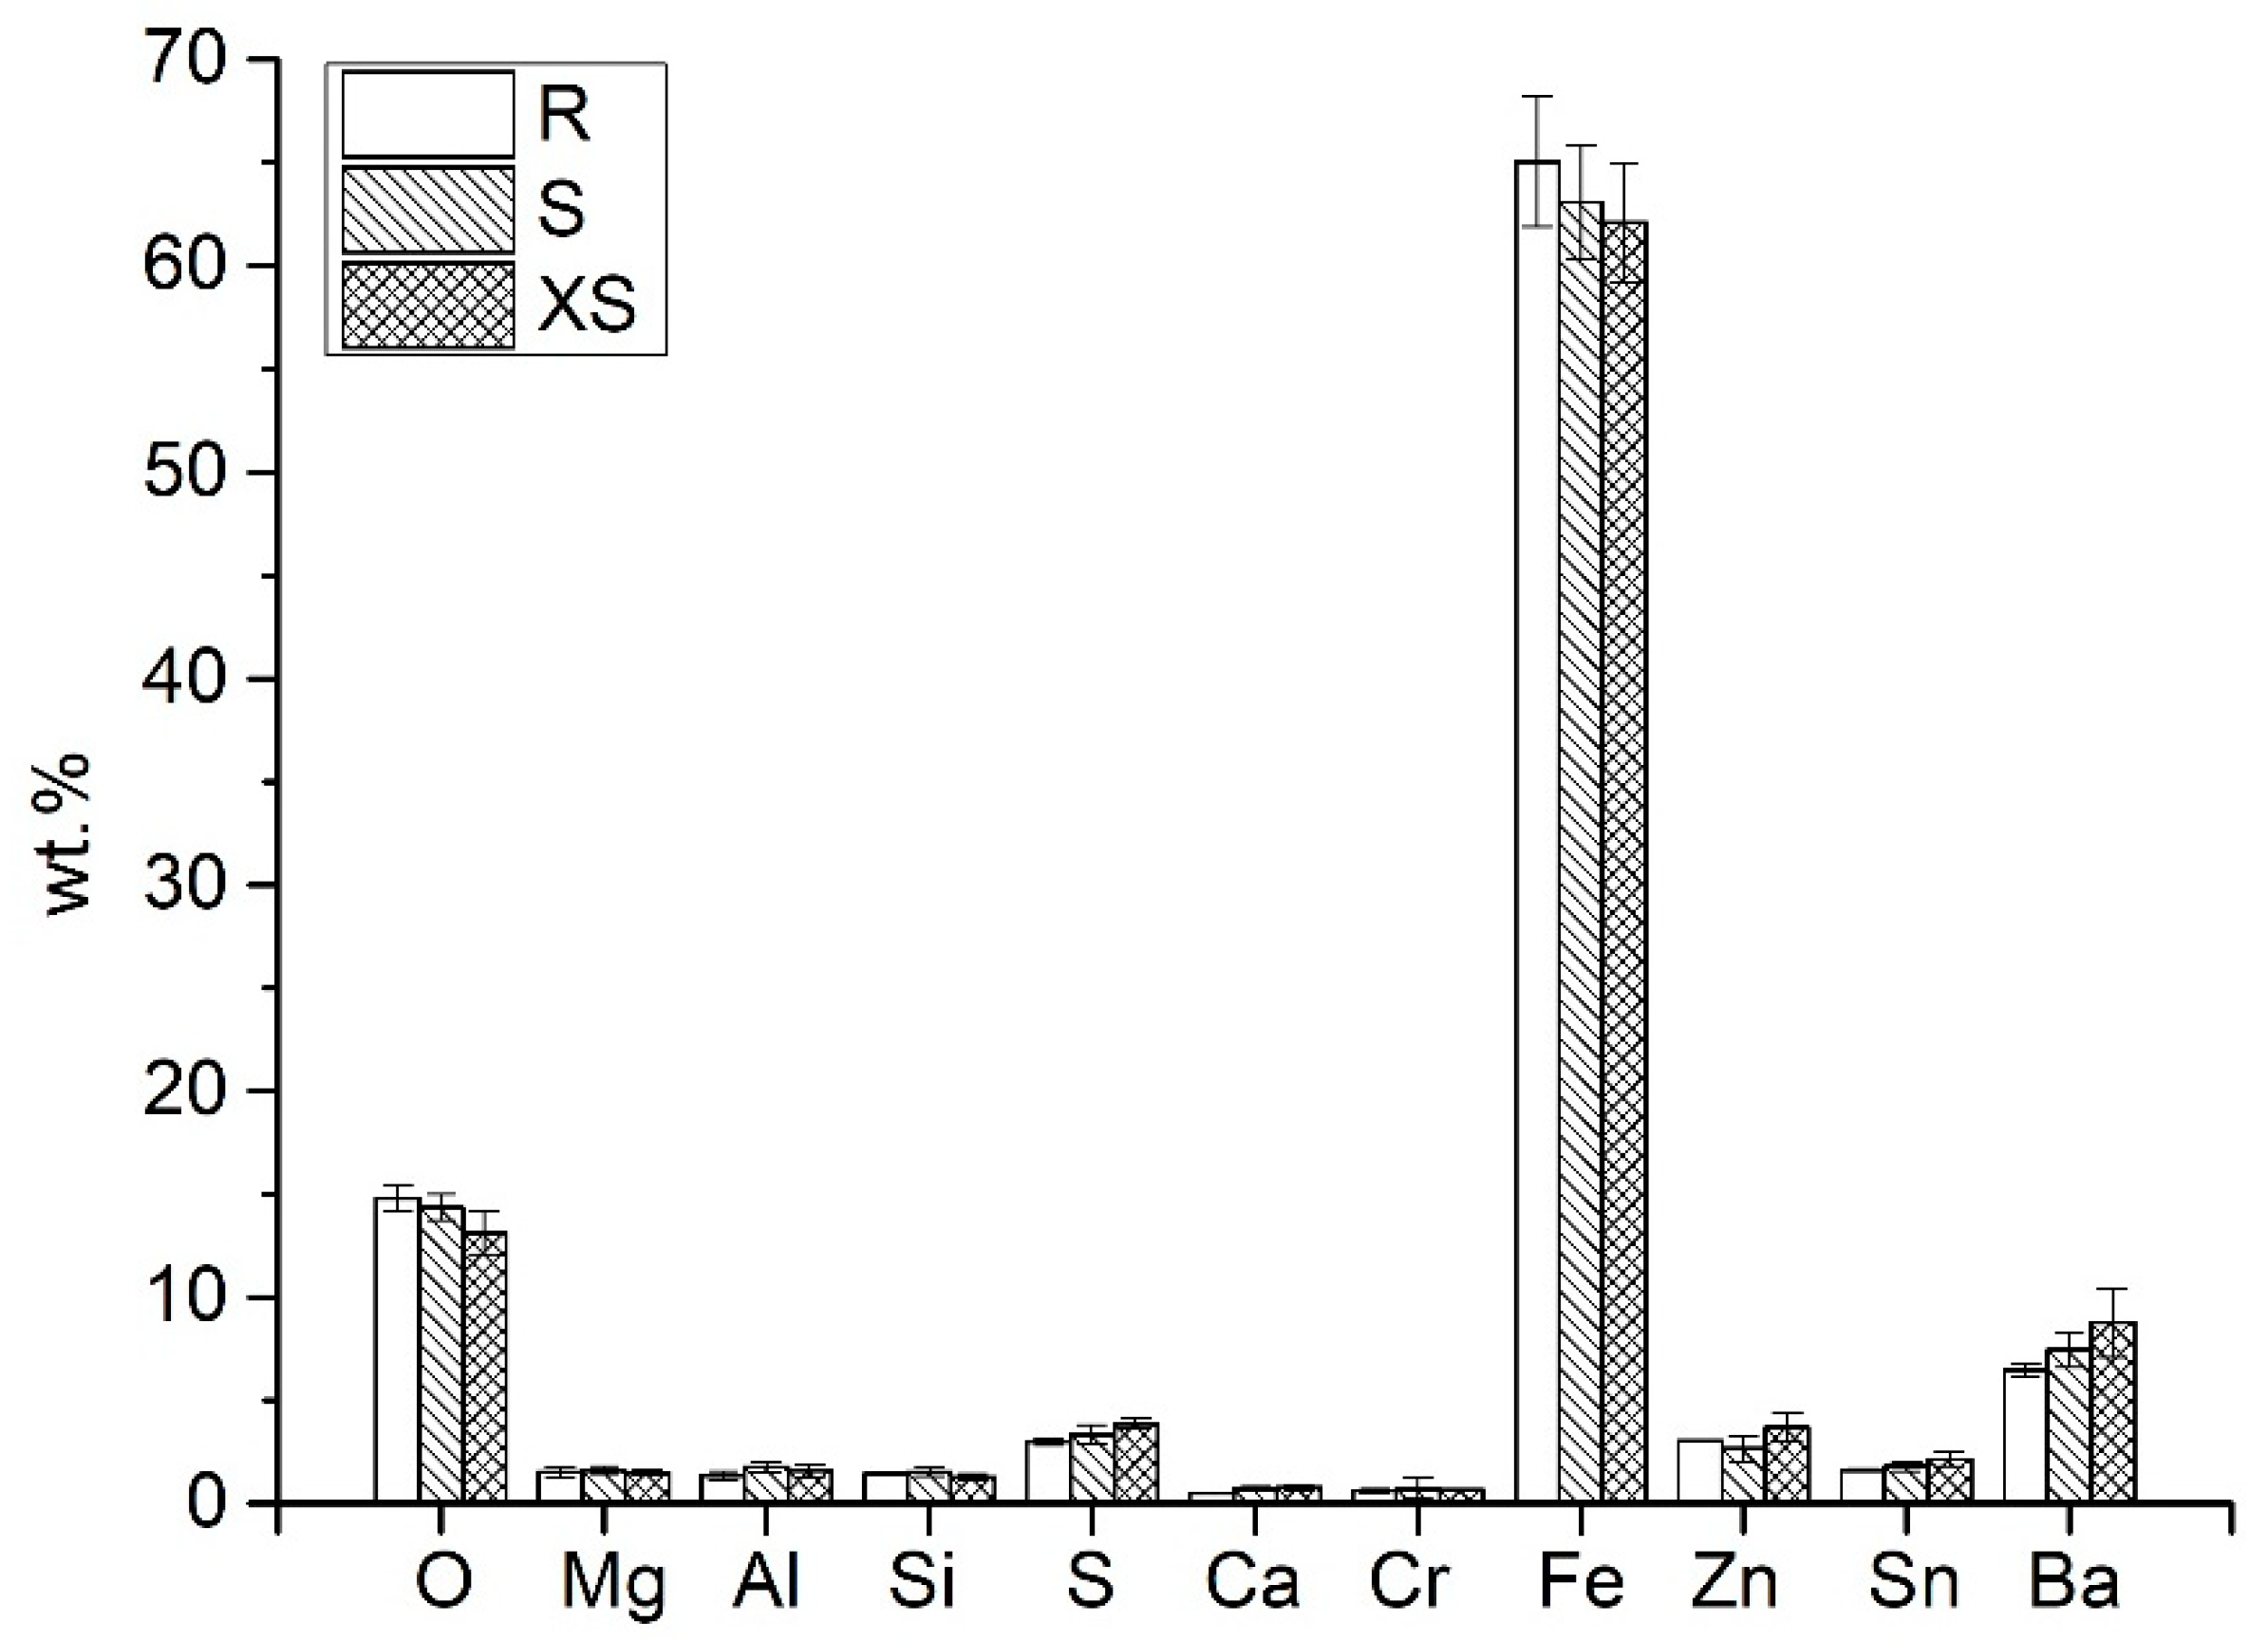
Figure 9 shows the results of the EDXS analyses carried out on the secondary plateaus. The elemental composition is similar for all three surface types. Some minor variations in the composition are detectable, especially in the content of Fe, Ba and O. Iron is the most concentrated element, which originates from the wear of both the pins and the discs, whereas the other elements come only from the pins.

3.3. Dyno Bench

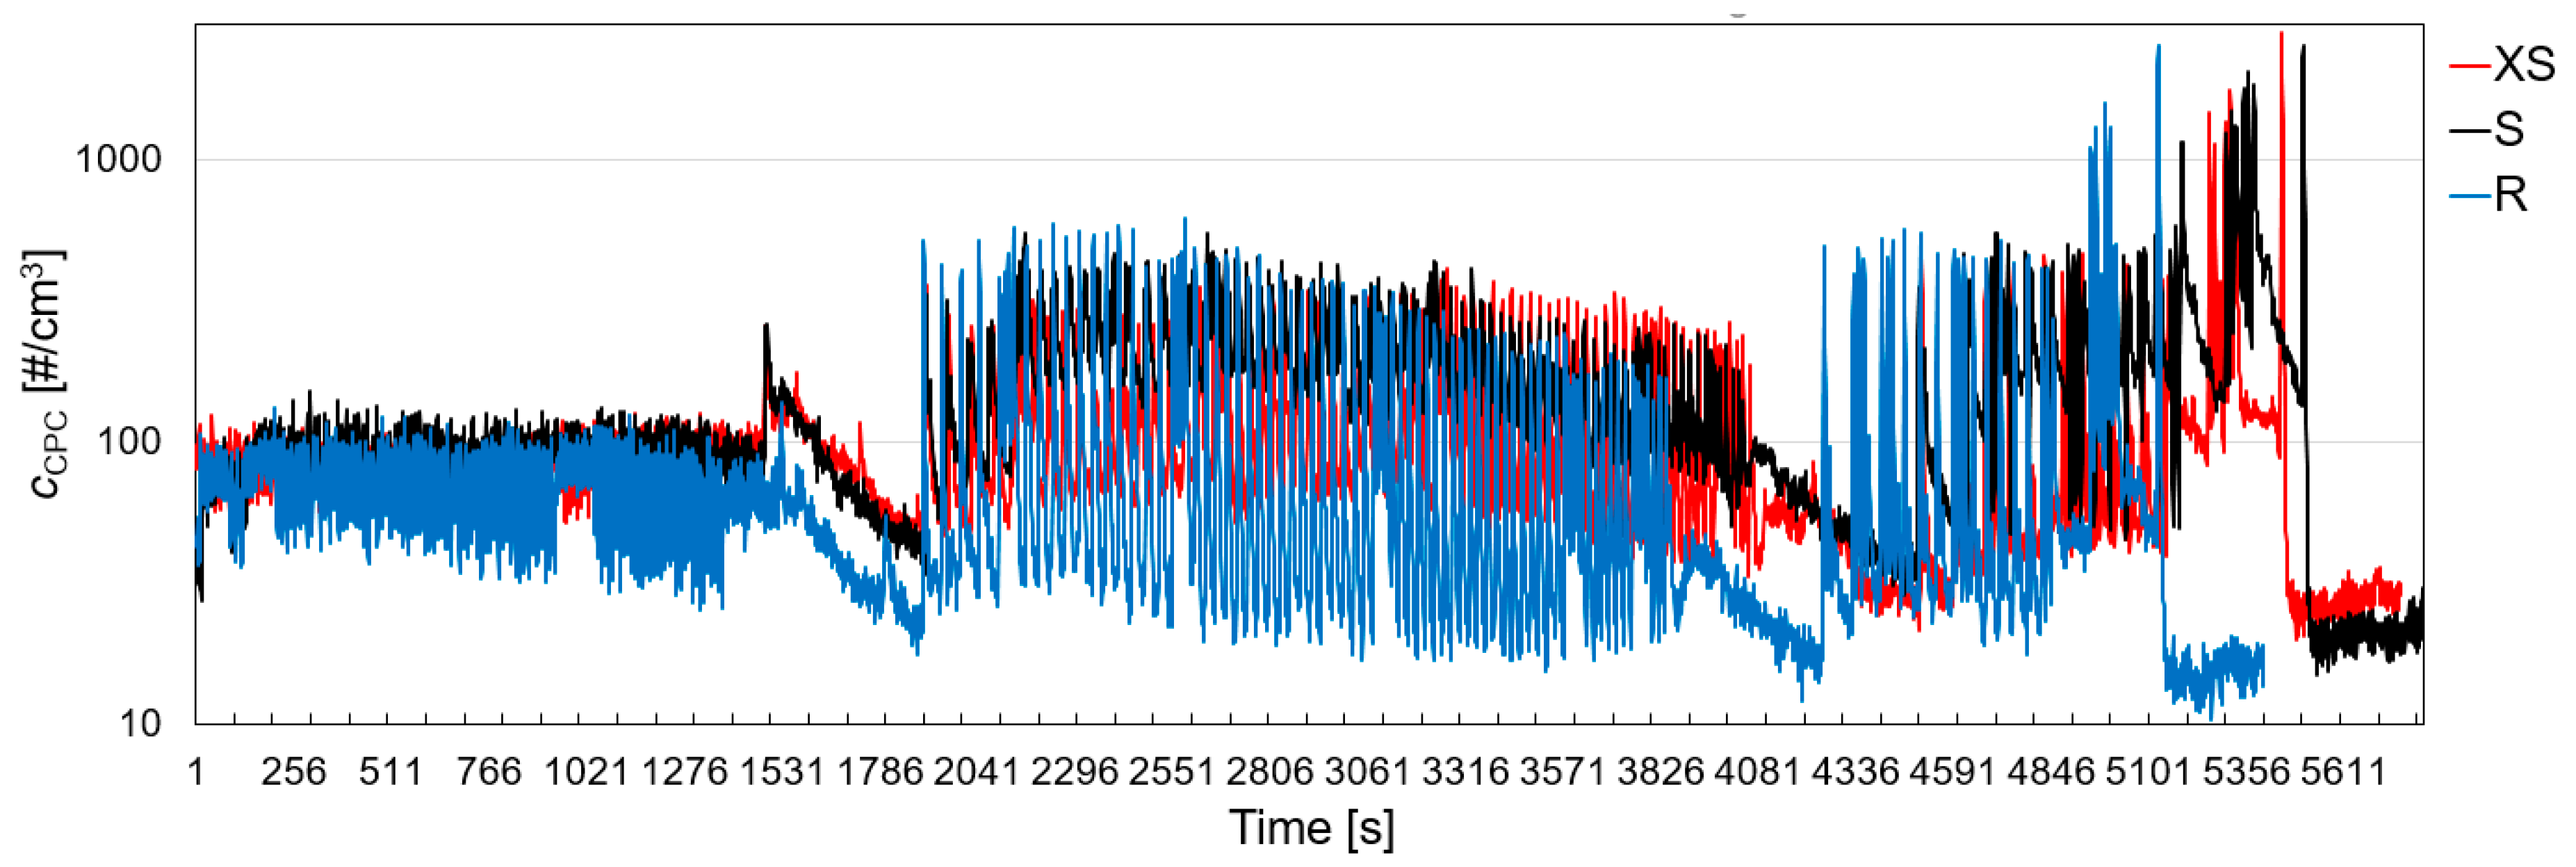
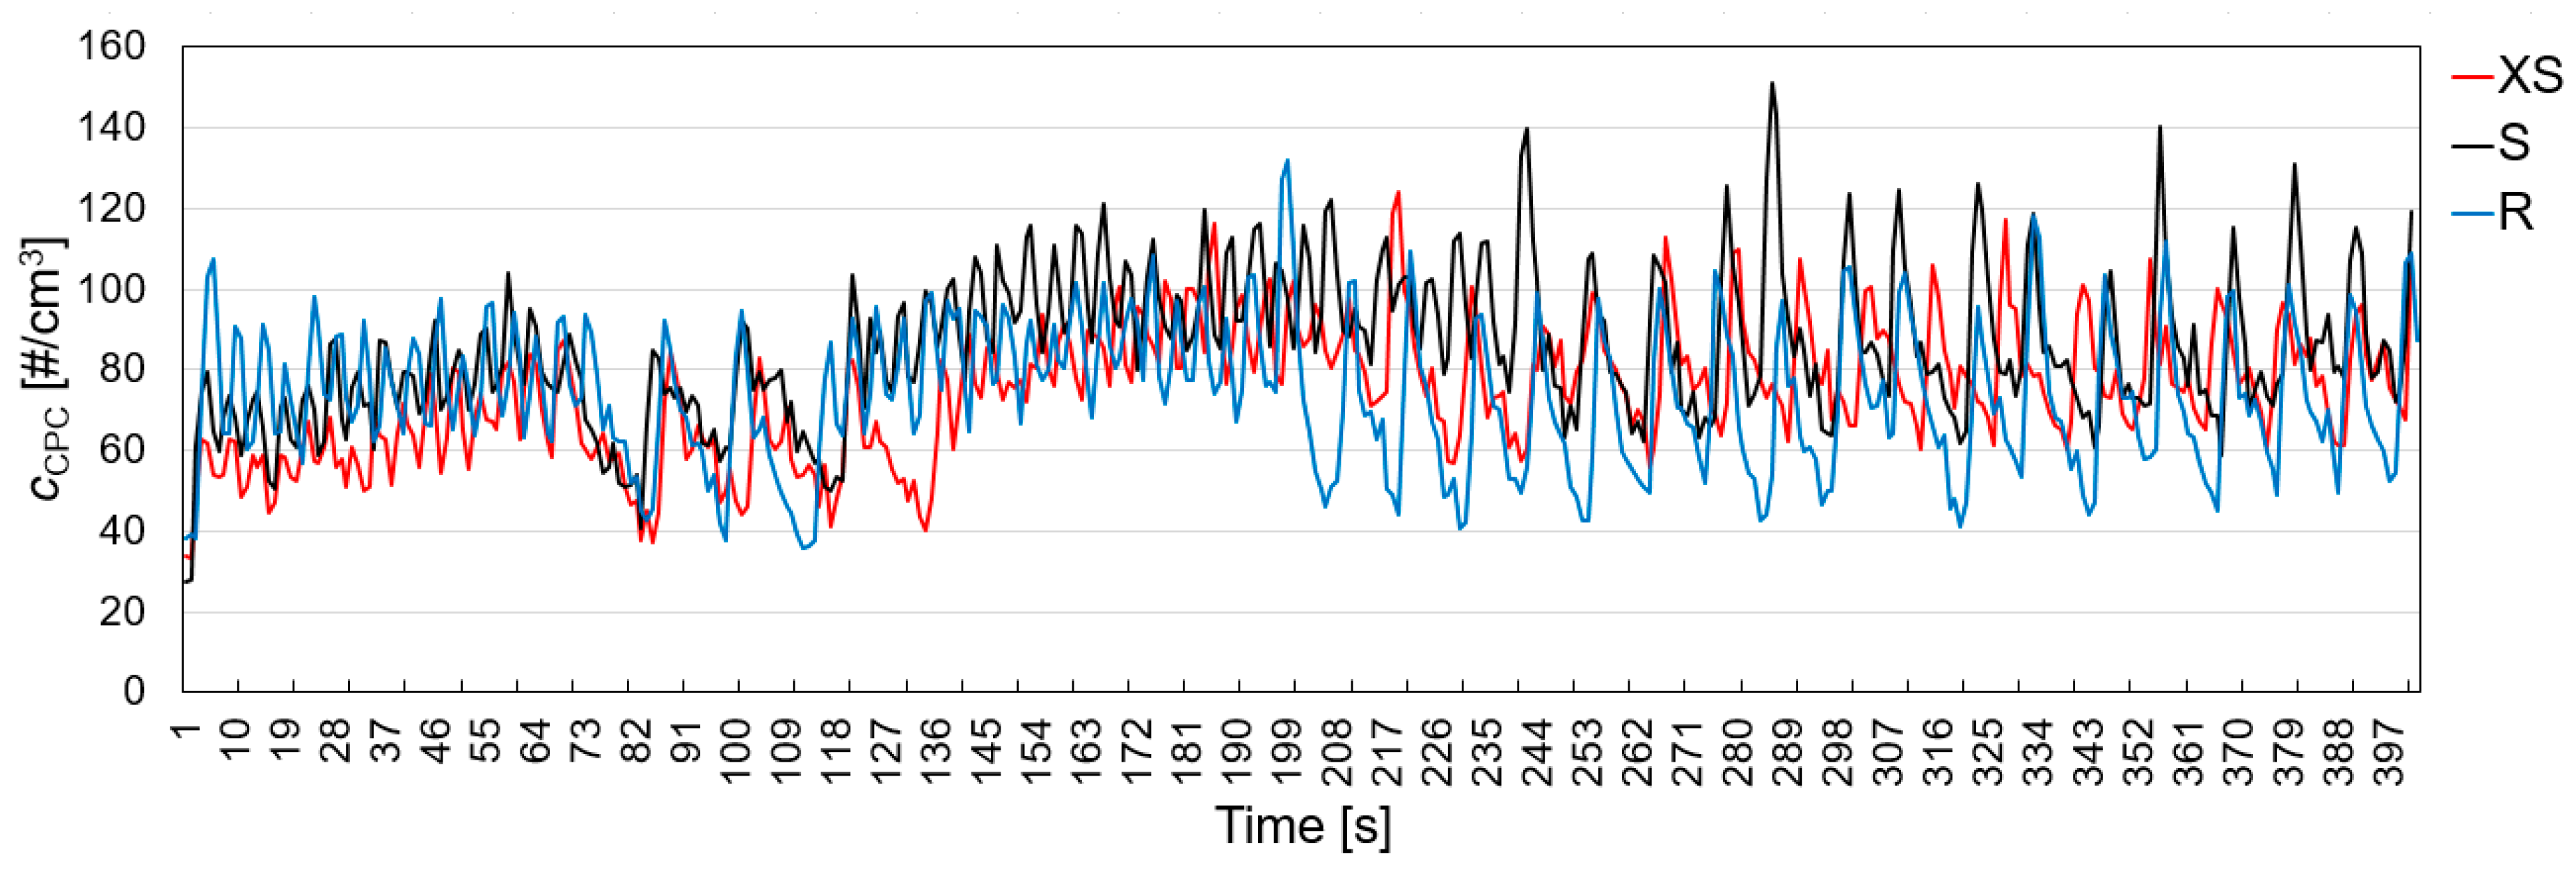
The mean values and standard deviations of the total measured response variables for the full dyno bench cycle are listed in Table 5. Figure 10 shows representative curves of the PNC measured by CPC during the full driving cycle versus time for the three surface types. The measured PNC during the first 400 s of the test cycle is presented in Figure 11.

4. Discussion

The CoF measured in the PoD tests for the extra-scorched specimen is a bit lower than for the scorched and rectified ones (see Table 4). It can be seen in Figure 5 that the extra scorched specimen has a longer run-in time before it reaches a steady-state in CoF at the same level as the scorched and rectified ones. This could be explained by that the extra-scorched specimens having rougher initial surfaces than the scorched and rectified surfaces; therefore, it takes a longer time to fill up the surface holes with worn material debris (third-body) and, in turn, to reach a more stable situation with relatively larger contact area and lower contact pressure. After being run-in, a larger part of the pad surface is covered by a third-body nano-sized thick tribofilm, which makes the situation more stable, and can be seen in the SEM images presented in Figure 8. The relatively lower contact pressure could also explain that the rectified specimen has the lowest pin/pad and disc wear (see Table 1 and Table 4). The run-in dependence on initial surface roughness of the pad material has been numerically studied by Wahlström [25] and experimentally studied by Matějka et al. [18] with a dyno bench setup, and the results of the present study are in line with these studies.
It can be seen in Table 4 that the particle concentrations are the lowest for the extra-scorched surfaces during the PoD tests. The scorched surface is lower than the rectified surface in terms of number concentration while the scorched and rectified surfaces are about the same in terms of mass concentration. In Figure 11 it can be seen that the extra-scorched pads tested in the dyno bench produce a lower level of particle number concentration than the rectified and scorched one for about the first forty brake events (t = 195 s), which is in line with the results of the PoD tests. This could be explained by the surface conditions introduced by the scorching process itself. At the start of the PoD tests, the rectified specimens have a relatively larger part of the resin in contact with the disc in comparison to the scorched and extra-scorched specimens, since the resin at the surface was burned away by the scorching process. Therefore, the extra-scorched surface with the lowest resin left has the lowest particle number and mass concentrations. This is in line with result presented by Ma et al. [20], who studied the generation of airborne particle from a disc brake material combination during pin-on-disc tribometer and stationary induction heating tests. They concluded that a significant part of the airborne particles is generated by the heating, which is promising since one way of lowering the emissions could be to extra-scorch the pad surfaces before they are used in the car.
From the particle number concentration and particulate matter measured during the dyno bench tests (see Table 5), it seems that scorching only has a positive effect at the beginning of the pad’s life. This can also be seen in the results from the PoD tests (Figure 6 and Figure 7), in which the trend is that the measured concentrations for the three surfaces tend to go closer to each other towards the end of the tests.

5. Conclusions

PoD and inertia dyno bench tests were conducted to investigate the influence of brake pad scorching on the tribological performance and generation of airborne wear particles from a Cu-free low metallic pad and a grey cast iron disc contact pair. The following conclusions can be drawn from the present study:
  • The tribological performance in terms of CoF and wear for the scorched and extra scorched surfaces are comparable. The rectified pad surface exhibits a lower wear.
  • The level of airborne particle emissions during the PoD tests are qualitatively in line with the inertia dyno bench test for about the first forty brake events (195 s); thereafter, the airborne particle emissions are higher for the scorched pads. It can be concluded from these results that the scorched pads result in higher levels of total PN and PM emissions.

Author Contributions

Methodology, M.L., U.O., S.G., J.W. and G.P.; validation, J.W. and G.P.; investigation, M.T. and M.L., Y.L.; data curation, M.T., M.L. and Y.L.; writing—original draft preparation, M.L. and J.W.; writing—review and editing, M.L., Y.L., U.O., S.G. and J.W.; visualization, M.L., Y.L. and J.W.; supervision, U.O., S.G., J.W. and G.P.; project administration, U.O., S.G. and G.P.; funding acquisition, U.O., S.G., J.W. and G.P. All authors have read and agreed to the published version of the manuscript.

Funding

The research has received financial support by the EIT-Raw Materials through the EU Project: ECOPADS—Eliminating COpper from brake PADS & recycling.—n. 17182.

Conflicts of Interest

The authors declare no conflict of interest.

References

  1. Amato, F. Non-Exhaust Emissions: An Urban Air Quality Problem for Public Health; Academic Press ELSEVIER: San Diego, CA, USA, 2018. [Google Scholar]
  2. Alemani, M. Particle Emissions from Car Brakes: The Influence of Contact Conditions on the Pad-to-Rotor Interface. Ph.D. Thesis, KTH Royal Institute of Technology, Stockholm, Sweden, 2017. [Google Scholar]
  3. European Environment Agency (EEA). European Union emission inventory report 1990–2017 under the UNECE Convention on Long-range Transboundary Air Pollution (LRTAP); European Environment Agency: Copenhagen, Demark, 2019; Available online: https://www.eea.europa.eu//publications/european-union-emissions-inventory-report-2017 (accessed on 30 March 2020).
  4. Grigoratos, T.; Martini, G. Brake wear particle emissions: A review. Environ. Sci. Pollut. Res. 2014, 22, 2491–2504. [Google Scholar] [CrossRef] [PubMed] [Green Version]
  5. Timmers, V.R.; Achten, P.A. Non-exhaust PM emissions from electric vehicles. Atmos. Environ. 2016, 134, 10–17. [Google Scholar] [CrossRef]
  6. Non-Exhaust Emissions from Road Traffic; Air Quality Expert Group, Department for Environment, Food and Rural Affairs (Defra): London, UK, 2019.
  7. Doyle, A.; Muneer, T. Traction energy and battery performance modelling. In Electric Vehicles: Prospects and Challenges; Muneer, T., Kolhe, M.L., Doyle, A., Eds.; Elsevier: Amsterdam, The Netherlands, 2017; pp. 93–124. ISBN 9780128030219. [Google Scholar]
  8. Wahlström, J.; Söderberg, A.; Olander, L.; Jansson, A.; Olofsson, U. A pin-on-disc simulation of airborne wear particles from disc brakes. Wear 2010, 268, 763–769. [Google Scholar] [CrossRef]
  9. Sanders, P.G.; Xu, N.; Dalka, T.M.; Maricq, M.M. Airborne brake wear debris: Size distributions, composition, and a comparison of dynamometer and vehicle tests. Environ. Sci. Technol. 2003, 37, 4060–4069. [Google Scholar] [CrossRef] [PubMed]
  10. Perricone, G.; Wahlström, J.; Olofsson, U. Towards a test stand for standardized measurements of the brake emissions. Proc. Inst. Mech. Eng. Part D J. Automob. Eng. 2016, 230, 1521–1528. [Google Scholar] [CrossRef]
  11. Hagen, F.H.F.Z.; Mathissen, M.; Grabiec, T.; Hennicke, T.; Rettig, M.; Grochowicz, J.; Vogt, R.; Benter, T. Study of brake wear particle emissions: Impact of braking and cruising conditions. Environ. Sci. Technol. 2019, 53, 5143–5150. [Google Scholar] [CrossRef] [PubMed]
  12. Mamakos, A.; Arndt, M.; Hesse, D.; Augsburg, K. Physical characterization of brake-wear particles in a PM10 dilution tunnel. Atmosphere 2019, 10, 639. [Google Scholar] [CrossRef] [Green Version]
  13. Mathissen, M.; Grigoratos, T.; Lähde, T.; Vogt, R. Brake wear particle emissions of a passenger car measured on a chassis dynamometer. Atmosphere 2019, 10, 556. [Google Scholar] [CrossRef] [Green Version]
  14. Wahlström, J.; Olofsson, U. A field study of airborne particle emissions from automotive disc brakes. Proc. Inst. Mech. Eng. Part D J. Automob. Eng. 2014, 229, 747–757. [Google Scholar] [CrossRef]
  15. Wahlström, J.; Lyu, Y.; Matjeka, V.; Söderberg, A. A pin-on-disc tribometer study of disc brake contact pairs with respect to wear and airborne particle emissions. Wear 2017, 384, 124–130. [Google Scholar] [CrossRef]
  16. Chan, D.; Stachowiak, G.W. Review of automotive brake friction materials. Proc. Inst. Mech. Eng. Part D J. Automob. Eng. 2004, 218, 953–966. [Google Scholar] [CrossRef]
  17. Ertan, R.; Yavuz, N. An experimental study on the effects of manufacturing parameters on the tribological properties of brake lining materials. Wear 2010, 268, 1524–1532. [Google Scholar] [CrossRef]
  18. Matějka, V.; Metinöz, I.; Wahlström, J.; Alemani, M.; Perricone, G. On the running-in of brake pads and discs for dyno bench tests. Tribol. Int. 2017, 115, 424–431. [Google Scholar] [CrossRef]
  19. Perricone, G.; Matějka, V.; Alemani, M.; Wahlström, J.; Olofsson, U. A Test stand study on the volatile emissions of a passenger car brake assembly. Atmosphere 2019, 10, 263. [Google Scholar] [CrossRef] [Green Version]
  20. Ma, J.; Olofsson, U.; Lyu, Y.; Wahlström, J.; Åström, A.H.; Tu, M. A comparison of airborne particles generated from disk brake contacts: Induction versus frictional heating. Tribol. Lett. 2020, 68, 1–13. [Google Scholar] [CrossRef] [Green Version]
  21. Dante, R.C. Handbook of Friction Materials and Their Application; Elsevier: Amsterdam, The Netherlands, 2016. [Google Scholar]
  22. Riva, G.; Wahlström, J.; Alemani, M.; Olofsson, U. A CFD study of a pin-on-disc tribometer setup focusing on airborne particle sampling efficiency. In Proceedings of the ECOTRIB Conference Proceedings, 6th European COnference on TRIBology, Ljubljana, Slovenia, 7–9 June 2017. [Google Scholar]
  23. Perricone, G.; Alemani, M.; Wahlström, J.; Olofsson, U. A proposed driving cycle for brake emissions investigation for test stand. Proc. Inst. Mech. Eng. Part D J. Automob. Eng. 2019, 234, 122–135. [Google Scholar] [CrossRef]
  24. Riva, G.; Perricone, G.; Wahlström, J. A multi-scale simulation approach to investigate local contact temperatures for commercial Cu-full and Cu-free brake pads. Lubricants 2019, 7, 80. [Google Scholar] [CrossRef] [Green Version]
  25. Wahlström, J. A factorial design to numerically study the effects of brake pad properties on friction and wear emissions. Adv. Tribol. 2016, 2016, 1–10. [Google Scholar] [CrossRef] [Green Version]
Figure 1. Experimental methodology with its validation routine.
Atmosphere 11 00488 g001
Figure 2. Fixed calliper disc brake system.
Atmosphere 11 00488 g002
Figure 3. An overview of the pin-on-disc (PoD) setup with its important parts marked [15].
Atmosphere 11 00488 g003
Figure 4. An overview of the inertia dyno bench setup with its important parts marked [24].
Atmosphere 11 00488 g004
Figure 5. Representative measured coefficient of friction curves for the three surface types.
Atmosphere 11 00488 g005
Figure 6. Representative measured particle number concentration curves for the three surface types.
Atmosphere 11 00488 g006
Figure 7. Representative measured PM10 curves for the three surface types.
Atmosphere 11 00488 g007
Figure 8. SEM images of the sliding surface of the rectified, scorched and extra-scorched samples ran with the PoD. The sliding direction (SD) during testing is marked with arrows.
Atmosphere 11 00488 g008
Figure 9. Diagram of the element composition of the secondary plateaus for all the samples: rectified (R), scorched (S) and extra-scorched (XS). Carbon is not quantified.
Atmosphere 11 00488 g009
Figure 10. Representative measured particle number concentration curves for the three surface types as measured by the CPC instrument in the dyno bench setup. Rectified (R), scorched (S) and extra-scorched (XS).
Atmosphere 11 00488 g010
Figure 11. Particle concentration as measured by the CPC during the first 400 s of the dyno bench tests for the three tested surfaces. Rectified (R), scorched (S) and extra-scorched (XS).
Atmosphere 11 00488 g011
Table 1. The main properties of the car and disc brake.
PropertyValue
Wheel radius361 mm
Rotor outer radius171 mm
Rotor inner radius92.2 mm
Rotor effective radius136 mm
Pad surface area7507 mm2
Cylinder diameters4 × 22 mm
Table 2. Elemental composition of the friction material used in the study. Carbon is not quantified.
Elementwt.%Elementwt.%
Fe13.7S9.1
Ba20.2Sn7.7
Zn8.4Ca3.2
Mg7.5Cr2.6
Al7.1O16.2
Si4.3
Table 3. Test driving cycle used in the dyno bench tests [23].
NSectionInitial Speed (km/h)Final Speed (km/h)Initial Rotor Brake Temperature (°C)Braking Deceleration (g)Number of Stops in Present Test (N)
5′ Cleaning
1.125 J/kg specific energy3626700.162
1.23626900.1618
1.336261100.1683
1.436261300.1656
1.536261500.1624
1.636261700.168
2.175 J/kg specific energy5228700.235
2.25228900.2316
2.352281100.2322
2.452281300.2325
2.552281500.2312
2.652281700.238
3.1125 J/kg specific energy575700.252
3.2575900.253
3.35751100.256
3.45751300.258
3.55751500.251
4.1175 J/kg specific energy70171100.311
4.270171300.312
4.370171700.311
5.1225 J/kg specific energy79201100.241
5′ Cleaning
Table 4. Mean value and standard deviation of the measured CoF, particle concentration, air flow rate and mass losses of the pin and disc samples.
RectifiedScorchedExtra-Scorched
CoF0.47 ± 0.030.47 ± 0.010.44 ± 0.02
cOPS (cm−3)349 ± 60246 ± 91139 ± 11
cELPI+ (mg·m−3)2.02 ± 0.292.03 ± 0.311.44 ± 0.15
Qair (m3·h−1)7.56 ± 0.177.71 ± 0.127.63 ± 0.08
Δmpin (mg)70.2 ± 9.386.5 ± 15.187.9 ± 9.8
Δmdisc (mg)69.5 ± 9.774.6 ± 12.376.6 ± 9.5
Table 5. Mean and standard deviation of the total measured particle concentration (cELPI+ and cCPC), mass of the PM collected on the filters and the mass loss of the pads (Δmpad).
RectifiedScorchedExtra-Scorched
cELPI+ (105·cm−3)8.8 ± 2.49.8 ± 2.512.8 ± 3.2
cCPC (105·cm−3)5.6 ± 1.56.5 ± 2.27.3 ± 2.2
PM (g)0.34 ± 0.050.34 ± 0.080.44 ± 0.06
Δmpad (g)5.7 ± 0.77.6 ± 0.38.6 ± 0.6