Abstract
Meteorological disasters are the result of the interaction of multiple factors and multiple systems. In order to improve the accuracy of prediction, it is necessary not only to consider the characteristics and cycles of each subsystem, but also to study the interaction of all systems. Based on the summer precipitation data and 130 circulation indexes of 34 national meteorological observation stations in Chongqing from 1961 to 2010, the prediction model of Chongqing summer precipitation was established based on the decision tree and the stochastic forest algorithm based on machine learning, and the prediction test of 2011–2018 was carried out independently by the model. Compared with the results of the single-factor prediction model, the trend consistency rate increased by 37.5% and 12.5% respectively. In addition, when using the random forest model to predict summer precipitation in Chongqing from 2014 to 2018, the 5-year average Ps, Cc and PC scores were 84.6, 0.27 and 67.1, respectively, which were significantly improved compared with 72.4, −0.12 and 52.9 of the current climate forecasting methods, and the forecast quality of the random forest was relatively stable. The multi-system collaborative impact model based on decision tree and random forest algorithm can achieve high accuracy and stability. Thus, this method can not only be an effective means for the diagnosis and prediction of climate causes, but also has a good theoretical and practical value for the prediction of extreme disasters.
1. Introduction
Since summer precipitation is of great concern regarding meteorological disasters, a lot of research work has been done on the influence of climate system subsystem changes and their interactions on summer precipitation. Some progress has been made in the study of the characteristics, causes and prediction methods of summer precipitation in Chongqing and its surrounding areas. Li [1,2,3] analyzed the characteristics of summer precipitation, drought and flood in the eastern part of southwest China, and pointed out that it had obvious inter-annual and inter-decadal changes. Zhou et al. [4] studied the basic climatic characteristics of summer precipitation in the three gorges reservoir area, and the results showed that the summer precipitation in the three gorges reservoir area had a good consistency, the frequency of drought years was significantly higher than that of flood years, and the summer precipitation in the three gorges reservoir area had an obvious inter-decadal variation. Ma Zhenfeng [5] analyzed the main physical factors affecting summer precipitation in southwest China, such as plateau factors, westerly belt system, subtropical high and other factors, and established a summer precipitation prediction model with a certain physical basis on this basis, which achieved good results in precipitation prediction in flood season in recent years. Zhang Qiang et al. [6] analyzed the correlation between Sea Surface Temperature (SST) index and drought and flood disaster in the upper reaches of the Yangtze river, showing that the occurrence of El Nino event increases the probability of drought in the upper reaches of the Yangtze river, while the occurrence of La Nina event increases the probability of waterlogging in the upper reaches of the Yangtze river. Liu De et al. [7] analyzed the characteristics of Eurasian circulation in summer rainfall in Chongqing, and established a conceptual model for forecasting summer precipitation in Chongqing by using circulation index in key areas in early winter.
In recent years, artificial intelligence technology has also begun to be applied in the field of atmospheric science such as severe convection weather forecast and climate prediction. There are many applications of machine learning in severe convection weather prediction. In 2017, Shenzhen Meteorological Bureau and Alibaba jointly organized the CIKM data science competition themed "smart city, smart country", and made climate precipitation forecast with radar images. Xiu Yuanyuan et al. [8] used machine learning supervised learning model support vector machine SVM to identify and forecast severe convection weather. Sun Quande et al. [9] showed the potential of machine learning methods in improving local accurate weather prediction. Li Wenjuan et al. [10] founded that the physical significance of factors selected by the random forest algorithm was relatively clear. In the field of climate, researchers have used artificial intelligence systems to help them rank climate models over the past few years [11] to detect hurricanes and other extreme weather events in real and simulated climate data, and thus find new climate models. The above study is based on considering the influence of a single system or physical factor on precipitation in and around Chongqing. The effects of anomalies of multiple systems or physical factors on precipitation in Chongqing are considered. In fact, due to the non-linear and chaotic nature of the climate system, the factors that affect the precipitation prediction constitute the comprehensive effects of many sea temperatures (ENSO, Kuroshio, etc.), plateau snow, land surface temperature, volcanic activity, astronomical factors, monsoon, subtropical high, high resistance and plateau topography. We aim to analyze the synergistic effect of the factors that lead to the precipitation change through sorting, statistics, analysis and processing of big data, machine learning, etc., and distinguish which factors are excellent forecasting factors, and the weight of these excellent factors in different regions, that is, how much forecasting information these factors can provide. If these issues are resolved, precipitation prediction will become possible and credible.
As an excellent representative of the machine learning algorithm, the decision tree model adopts recursive segmentation technology to continuously divide the data space into different subsets so as to detect the potential structure, important patterns and relationships of data [12]. Compared with traditional parametric statistical methods, the decision tree model does not need to make assumptions about the relationship between independent variables and dependent variables in advance, and it can effectively overcome the multi-collinearity of independent variables. However, the results of a single decision tree are unstable and prone to overfitting. The random forest model builds decision trees by randomly extracting some samples from the original samples through Bootstrap sampling technology, and combines multiple decision trees to effectively avoid overfitting [13]. At present, decision trees and random forest algorithms are more and more widely used in meteorology. Shi Dawei et al. [14] used the decision tree algorithm to establish a more accurate classification and prediction model for road icing disaster. Shi Yimin et al. [15] studied the classification and prediction model of regional summer precipitation days based on the data mining Classification and Regression Tree (CART) algorithm. Qin Pengcheng et al. [16] Hubei rapeseed yield limiting factor analysis based on a decision tree and random forest model also achieved good application.
Based on the actual forecast business, this paper adopts the decision tree classification method to establish the precipitation prediction model with multi-factor collaborative influence for the average summer precipitation in Chongqing. Based on decision tree modeling, random forest is used to conduct an integrated prediction test, and evaluate its prediction effects.
2. Materials and Methods
2.1. Materials
The meteorological data used in this paper were obtained through the Meteorological Unified Service Interface Community of China Meteorological Administration. The decision tree method uses the regional average precipitation of 34 national meteorological observing stations in Chongqing (Figure 1), while random forest analyzes the precipitation of 34 national meteorological observing stations.
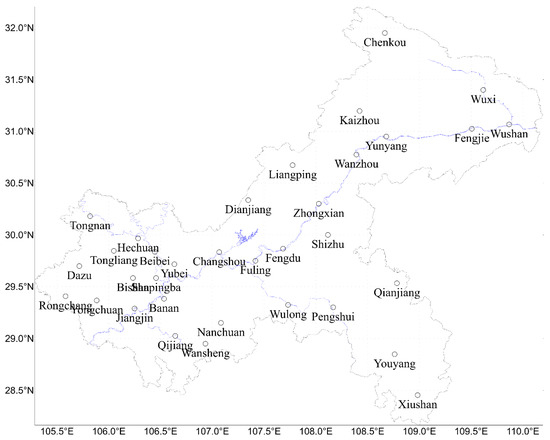
Figure 1.
Map of 34 national meteorological stations in Chongqing.
The circulation index in this article comes from the business meteorological network [17,18,19,20], respectively, including atmospheric circulation index 88 such as the subtropical high, east Asian trough, polar vortex, Eurasian circulation type, characteristics, Pacific Ocean trade winds etc., SST index 26 such as ENSO (various districts and types), warm pools, Indian Ocean, Tide area, Kuroshio area et al., cold air and typhoon, Southern Oscillation Index (SOI), The Pacific Decadal Oscillation (PDO), Quasi-biennial Oscillation (QBO), subsurface SST index and another 16; in total, 130 items. Among them, the SST index in this article includes 26 SST indexes and 16 other indexes including multivariable ENSO index, decadal oscillation in the north Pacific, meridional mode SST in the Atlantic Ocean, quasi-biennial oscillation, EU300T_130E, EU300T_160E, EU300T_180W, and Atlantic SST triples. In this article, summer refers to June to August.
2.2. Methods
The machine learning algorithms adopted in this article include decision tree [14,16,21], and random forest [22,23,24]. The evaluation methods are Prediction Consistency (Pc), Prediction Score (Ps) and Correlation Coefficient (Cc) [25,26,27], which are used in the China Meteorological Administration (CMA). The modeling period is from 1961 to 2010, and the independent inspection and evaluation period is from 2011 to 2018. The decision tree and stochastic forest model are multi-factor prediction models using 130 circulation indexes, while the prediction model established by using any one of the 130 circulation indexes is a single-factor prediction model.
2.2.1. The Decision Tree
Yang et al. [28] introduced the basic concepts and common algorithms of decision tree, which can be used to form classification and predictive model. Suppose , including as input variables (circulation index), is the number of features (the summer model is 130, the winter model is 34), is the category-type response variable (that is, the amount of precipitation), , is the sample size (from 1961–2018, 58 years). Among them, 1961–2010 is the training data set and the completion of model training; 2011–2018 is the independent test data set and the independent inspection and evaluation. The goal of decision tree learning is to build a decision tree model based on a given training set to enable it to correctly classify instances. In this paper, the C4.5 algorithm of Quinlan is adopted for decision tree generation [29].
2.2.2. Random Forest
Random forest is a multifunctional machine learning algorithm. It was first proposed by Breiman, a professor of statistics at the University of California, Berkeley, in 2001, and can perform regression and classification calculations. The basic composition of the random forest is classification and regression tree (classification and regression tree) invented by Breiman and other inventions. Compared with machine learning algorithms such as neural networks, this algorithm of repeated classification and regression of binary data effectively reduces the amount of calculation. Random forest is the combination and re-aggregation of these classification trees. Random forest improves the estimation accuracy without significant increase in the calculation amount, and it is insensitive to missing values and multivariate collinearity, and can estimate up to thousands of explanatory variables, which why it is known as one of the best algorithms at present [30,31].
Random forests use the Bagging method to combine decision trees, and they use the Bootstrap sampling methods (Bootstrap method) to extract N samples from the original sample to model the decision tree. Under normal circumstances, random forests will randomly generate hundreds to thousands of decision trees. Each tree in the forest is independent, and then the most repetitive tree is selected as the final result. Since there is no need to consider constraints such as variable distribution conditions, interactions, non-linear effects and even missing values, the structure of the random forest is complex, but it is robust and easy to use [32,33,34].
The specific construction process of the random forest is as follows:
- (1)
- If the size of the training set is N (50 in this paper, that is, 1961–2010), for each tree, N training samples are randomly and recursively extracted from the training set (this sampling method is called bootstrap sample method) as the training set of the tree;
- (2)
- If the feature dimension of each sample is M, specify a constant m << M, randomly select m (20 in this paper) feature subsets from M features, and select the optimal one from these m features every time the tree splits.
- (3)
- Every tree grows as fast as possible, and there is no pruning process.
- (4)
- Established a large number of decision trees according to steps (1)–(3), thus forming a random forest. The classification result depends on the number of votes of the tree classifier.
In the process of building a random forest, there are two parameters that need to be set by the user according to the specific situation. In most cases, the default parameters of the model can obtain the optimal simulation results without adjustment. The term “random” in random forest refers to the two random parameters here. The introduction of these two randomness factors is crucial to the classification performance of a random forest. Due to their introduction, the random forest is not easy to fall into overfitting and has a good anti-noise ability (for example, insensitive to the default value). Therefore, the random forest models established in this paper to estimate precipitation all use default parameters.
2.2.3. Test Method
In order to test the climate prediction quality, CMA used a prediction grading score in 2010, then Ps and Cc in 2013. In order to be consistent with the current climate operations, Pc, Ps and Cc are used in this paper to test the prediction quality of the summer precipitation in Chongqing.
(1) Pc is evaluated station by station on the basis of whether the predicted and actual anomaly coincidence was consistent. The consistency rate formula is defined as follows:
where N0 is the number of the stations with correct climate trend prediction; N is the number of stations actually participating in the assessment.
(2) Ps test method is a method that sets different weights to comprehensively test the results of climate trend prediction and anomaly level prediction. Its test score is relatively intuitive. On the basis of the correct score of trend prediction, the correct score of abnormal prediction can still be obtained, which is equivalent to giving encouragement to the abnormal forecast, and its prediction score can relatively reflect the ability and level of climate prediction.
Trend prediction is the prediction of anomaly/anomaly percentage sign. When the prediction is identical to the actual sign (0 for positive), the trend prediction is correct. Anomaly level prediction refers to the prediction that the percentage of precipitation anomaly exceeds (including) ±20% and the temperature anomaly exceeds (including) ±1 °C.
Calculation formula of Ps test method:
where, N0 is the number of stations with correct climate trend prediction; N1 is the number of stations with correct first-order anomaly prediction; N2 is the number of stations with correct second-order anomaly prediction; N is the actual number of participating evaluation stations; M is the number of stations where there are no secondary anomalies and the precipitation anomaly percentage ≥100% or equal to −100% and the temperature anomaly ≥3 °C or ≤−3 °C; a is the weight coefficients of climate trend terms, b is the first-order abnormal terms and c is the second-order abnormal terms. In this method, a = 1, b = 2 and c = 4.
(3) Cc tests the correlation of climate trend prediction products, which characterizes the degree of correlation between the forecast and the live field. The size of the correlation coefficient can indicate the correspondence between the high and low center of the forecast field and the live field. It reflects the accuracy of the prediction result and the quality of the prediction method to a certain extent. It is one of the internationally popular prediction evaluation methods. Prediction inspection and evaluation of precipitation and the temperature mainly use precipitation anomaly percentage and average temperature anomaly to calculate their correlation coefficients.
Specific calculation method:
where is the forecast value of precipitation anomaly percentage of each station; is the average value of the precipitation anomaly percentage of all stations in the region; is the observed actual value of the precipitation anomaly percentage of all stations in the region; is the average value of the observed values of precipitation anomaly percentage of all stations in the region; N is the total number of stations actually participating in the assessment.
The forecast released in this article refers to the forecast submitted by the Chongqing Climate Center to the National Climate Center to participate in the assessment of forecast quality.
3. Results and Analysis of Precipitation Prediction in Summer Test
This section may be divided by subheadings. It should provide a concise and precise description of the experimental results, their interpretation as well as the experimental conclusions that can be drawn. In the actual climate prediction of Chongqing, due to the complex and changeable terrain, it is necessary to make trend judgment on the precipitation and average precipitation of 34 stations in order to obtain the forecast data and obtain the detailed spatial distribution. The authors used decision trees and random forests for correlation analysis based on both averages and individual site data from 34 sites. The single site results of the decision tree is relatively complex, and have no significant characteristics, while the single site results of random forest analysis are relatively good. However, due to the limitation of sample number, while based on average date of 34 sites, the results of random forest are not as good as those of the decision tree method. Therefore, in this paper, the decision tree model takes the average precipitation of 34 sites as the modeling object and focuses on the collaborative influence of multiple factors. In the random forest model, 34 sites were modeled, and spatial distribution characteristics were focused. The two methods complement each other.
3.1. Decision Tree Model Test
Considering the physical factors in the summer period, IBM SPSS Modeler 18.0 was used, and the CART algorithm (the same as below) was used to model (Figure 2). It can be seen from the model that the circulation index that has a large impact on summer precipitation in Chongqing includes the western Pacific subtropical high ridge line, landfall typhoon, SST in tidal zone, the northern boundary of the North African Atlantic North American High, polar vorticity in the Atlantic European region, Indian sub-high area, and 30 hPa zonal wind.
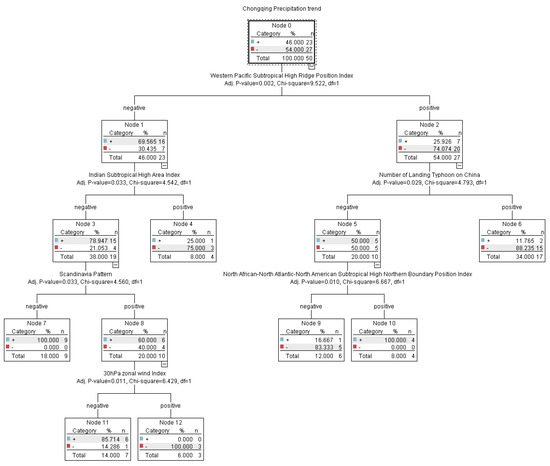
Figure 2.
An analytic diagram of the relationship between the precipitation trend and circulation index in summer in Chongqing based on the CART algorithm. The ‘% ‘represents the probability of more or less. The ‘n’ represents more or less annual scores (as below).
The combination of the summer rainfall trend in Chongqing and the concurrent circulation index model based on the CART algorithm is shown in Table 1. Factors with less precipitation include factors 1–4, factors with more precipitation include factors 5–7. “+” and “−” respectively represent the positive and negative anomalies of the exponent in the condition, and the percentile in brackets is the probability of less (or more).

Table 1.
Combination of summer precipitation trend and circulation index model based on the CART algorithm in Chongqing.
Using the same period index from 2011 to 2018 to predict the amount of summer precipitation in Chongqing and compare it with the observations, the results are shown in Table 2.
Table 2.
Different circulation index anomaly, precipitation prediction and observation from 2011 to 2018.
If the prediction only considers single-factor effects, the northern (southern) ridge of the western Pacific subtropical high (referred to as the Western Pacific subtropical high) generally corresponds to less (more) summer precipitation in Chongqing. Based on this prediction, the northern ridge of the western Pacific subtropical high in 2011, 2012, 2015 and 2018 corresponds to less precipitation, and the results in 2015 are inconsistent. In 2013, 2014, 2016 and 2017, the southward ridge of the western Pacific subtropical high corresponds to more precipitation, but only in 2014 and 2017. The total prediction accuracy was 62.5% (5/8).
When multi-factor synergy is considered, even if the western Pacific subtropical high is southerly, there may be less precipitation, as shown in case (3). In the actual prediction, 2011 and 2012 are completely in line with the situation (1). The percentages of precipitation anomalies are −30.5% and −22.1%, which are significantly less. The percentage of precipitation anomaly in 2013 was −26.1%, and the result was consistent with situation (3). If only the first two conditions of situation (3) are met, the probability of less precipitation is only 50%. In 2013, the 30 hPa zonal wind was significantly larger, which increased the probability of less precipitation to 100%. Similarly, in the collaborated multi-factor prediction, either the ridge line of the western Pacific subtropical high is northerly or southerly, there may be more precipitation, as shown in situation (5) and situation (6). The circulation index in 2014 is consistent with the result of situation (6). The probability of more precipitation is 100%, and the actual precipitation anomalies percentage is 6.3%, which is more normal. The circulation index in 2015 is consistent with the result of situation (5). The probability of excessive precipitation is 100%, and the percentage of actual precipitation anomaly is 11.7%. The circulation index in 2016 is consistent with the situation (3), which predicts less precipitation, but the actual situation is 9.5% more precipitation. 2016 is a typical El Nino year, and the anomaly of the atmospheric system caused by the SSP anomaly in the Pacific Ocean may be the possible reason for the failure of the prediction model in 2016 [30,31].
According to the prediction effect test from 2011 to 2018, the prediction accuracy of multi-factor synergy reached 87.5%, which was 25% higher than that of a single factor. In view of the fact that the analysis of the contemporaneous factors is more applied to diagnostic analysis, considering the actual situation of prediction, the SST index modeling of pre-winter (Figure 3) is selected to forecast the business according to the previous method.
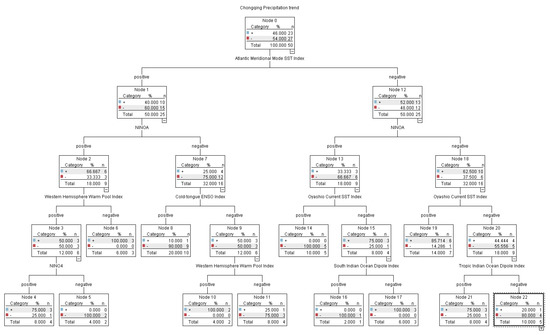
Figure 3.
Relationship between precipitation trend in summer and SST index in pre-winter based on the CART algorithm in Chongqing.
The combination of summer precipitation trend and winter SST index model based on the CART algorithm in Chongqing is shown in Table 3. In the model, there are 6 cases of lower precipitation and 6 cases of higher precipitation.
Table 3.
Combination of summer precipitation trend and prewinter Sea Surface Temperature (SST) model based on the CART algorithm in Chongqing.
The model was tested based on the observation of summer precipitation in Chongqing from 2011 to 2018, the results are shown in Table 4. In the model, if the Atlantic meridional model SST with the highest correlation is considered, the precipitation in Chongqing is low if it is high, while the precipitation in Chongqing is high if it is low. The trend forecast is correct in all years except 2014. If different combinations are considered, from 2011 to 2014, the Atlantic SST to mold is on the high side, and the NINOA is low. The cold tongue ENSO index was small and the predicted precipitation was small in 2013, which is consistent with the situation (1). The difference in the remaining three years is the difference in the western hemisphere warm pool index. In 2011 and 2012, it is consistent with the situation (2), with less predicted precipitation. In 2014 it is consistent with the situation (7), with more predicted precipitation. Signals of SST in 2015 and 2016 are consistent with the situation (10), and too much precipitation is predicted. In 2017 and 2018, it coincided with the situation (3), with less precipitation forecast. From the test, it can be seen that the forecast of precipitation trend in the 8 years from 2011 to 2018 is correct when considering the coordination of multiple factors, which is 12.5% higher than that when considering only a single factor.
Table 4.
Test table for predicting summer precipitation effect from 2011 to 2018 based on the winter SST index decision tree model in Chongqing.
The above considers the multi-factor synergy of the decision tree method. Although quantitative prediction of Chongqing’s summer precipitation cannot be achieved, the experiments show that, no matter whether the predictive diagnosis analysis is made by using the previous or the same period factor, it is more obvious than the single index. This also shows that the “climate system”, as a complex system, is the result of the interaction of multiple factors and multiple systems. In the process of diagnosis or prediction, we not only need to analyze the characteristics and cycles of each part of the system separately, but we must also study the integration behavior of the entire system and the interaction of the sub-system. This process requires statistical analysis of a large number of data such as ocean and atmosphere, as well as various model prediction data, in order to obtain the key factors affecting the local climate, the key regions of different circulation fields, and the key periods when indexes and circulation affect the local climate. With many "blind spots" in the physical processes and research of climate system change, current prediction methods cannot make full use of these huge data resources. It may be an important factor for large climate systems, but not necessarily a critical factor for local climatic characteristics. This will inevitably lead to “lighter and slightly heavier” situations in forecasting analysis, leading to uncertainty in the forecast Increased predictive accuracy. Therefore, with the help of decision tree and other machine learning technologies, comprehensive and valuable information can be fully mined from the vast variety of data, so as to discover the main system and collaborative influence mechanism that affect the local climate, which plays a significant role in improving the accuracy of local climate prediction.
3.2. Prediction Experiment of Random Forest Model in Summer
In the actual forecasting business, it is not only necessary to forecast the overall trend of the region, but also to analyze the spatial distribution pattern and forecast the rainfall centers and the occurrence locations. Therefore, based on the average model of the whole city in the previous section, this section uses random forests for prediction of 34 National Meteorological Observatories in Chongqing. In the selection of circulation index, since the actual summer forecast is released in March, the circulation factor that can be obtained at this time can only reach February. Thus, when random forests are used for prediction, this article only uses the early winter SST index modeling, regardless of the constraints such as the distribution conditions, interactions, nonlinear effects, and even missing values of variables. Figure 4 is the forecast distribution map of random forest precipitation and distribution of actual precipitation anomaly rate over the years 2011–2018.
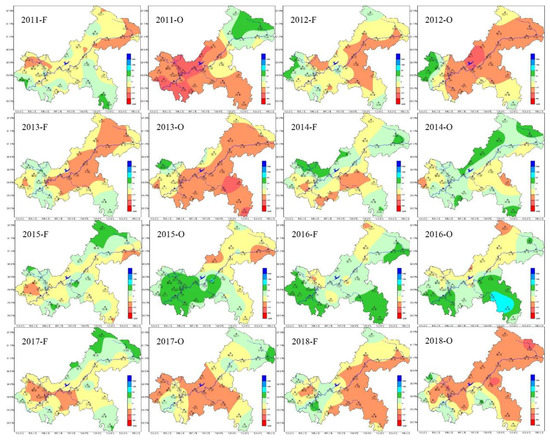
Figure 4.
Forecast and observation distribution of summer precipitation in Chongqing based on random forest. (F) and (O) mean forecasting and observation, respectively.
It can be seen from Figure 4 that there was no consistent or excessive summer precipitation in Chongqing during 2011–2018, which is a case of different spatial distributions, which also makes prediction difficult. Comparing the forecast with the actual situation, the overall trend forecast for 8 years is more accurate. Only the spatial distribution of 2011 and 2015 is slightly different, and the remaining years are relatively accurate in regional forecast. Because the forecast uses a dichotomous trend forecast and cannot be refined for anomalous forecasting, the prediction results are tested at 20% and −20% using Ps, Cc and PC test methods, respectively. The test results are shown in Table 5.
Table 5.
Comparison Table of random forest summer precipitation and release forecast from 2011 to 2018.
As can be seen from Table 5, the random forest prediction score is higher and more stable. The average Ps, Cc and PC scores for 2014-2018 were respectively 84.6, 0.27 and 67.1. Compared with 72.4, −0.12, and 52.9, which are released by the forecast, they are significantly improved. From the historical comparison, Ps and PC scores are consistent. 2016 and 2017 are roughly equivalent to the released forecasts, and the rest of the years are about 20 points higher than the released forecasts. The Cc score for the correlation between the predicted field and the live field is significantly better than the forecast, and, except for 2015, they all exceed 95% significance test. In contrast, the published forecast shows that Cc scores are mostly negative, which indicates that the predictive typing needs to be improved.
4. Conclusions and Discussion
By establishing a decision tree model based on multi-factor collaboration for summer precipitation in Chongqing and conducting random forest integration and testing, the following conclusions are reached:
- (1)
- In the concurrent circulation index that affects summer precipitation in Chongqing, the western Pacific subtropical ridge is a very important influencing factor. However, if we only consider the West Pacific sub-ridge ridgeline, there are a total 5 years in the 2011–2018 trend forecast which are accurate. Considering the synergistic effect of the Indian sub-high area and the typhoon landing, the 8-year trend can be accurately predicted, and the trend consistency rate increased by 37.5%. In the case that multiple factors were taken into account for the SST factor in the first winter, the precipitation trend prediction in 8 years was correct, which was 12.5% higher than that in the case that only a single factor of Atlantic meridional model SST was considered. This shows that in the prediction business, as the climate system is the result of the interaction of multiple factors and multiple systems, we not only need to analyze the characteristics and cycles of each part of the system separately, but also need to study the integration behavior of the whole system and the interaction of each subsystem. Using the decision tree to construct a multi-system collaborative impact model is an effective technical method. It is able not only to effectively improve the prediction accuracy, but also the prediction model established by the decision tree is different from the fully black-box effect of the neural network. The affected processes are relatively clear, so there is a higher application prospect for researches such as mechanism analysis.
- (2)
- Using random forest to predict the summer precipitation Ps, Cc and PC scores of Chongqing from 2014 to 2018 are steadily higher than the released forecasts. In addition to the instability of publishing forecasts, the quality of random forest forecasts is relatively stable. The results show that it is feasible to use the random forest algorithm to predict summer rainfall precipitation in Chongqing in actual business. In addition, the random forest algorithm does not have high requirements on data, and it does not need to consider constraints such as the distribution conditions, interaction, nonlinear effects, even missing values of variables. In most cases, the default parameters of the model can give optimal simulation results without tedious parameter adjustment. Therefore, the application of the random forest algorithm in the climate prediction business has good prospects.
In this paper, when using decision trees and random forests to predict and model summer precipitation in Chongqing, although the model has a good prediction effect, it is also a qualitative forecast. Quantitative prediction modeling research has not been carried out, and there are obvious limitations in precipitation prediction and central locations. The author will increase the research and development of multi-factor collaboration, multi-system integration and multi-mode collection technology in subsequent research and business. Further analysis is made on various factors affecting summer rainfall in Chongqing, so as to provide more evidence and clues for improving the precipitation forecasting level in this region.
Author Contributions
Conceptualization, C.Z. and X.D.; methodology, C.Z., X.D. and B.X.; software, B.X.; validation, X.D., B.X. and C.Z.; formal analysis, X.D. and C.Z.; investigation, J.W.; resources, X.D.; data curation, J.W.; writing—original draft preparation, X.D., C.Z. and J.W.; writing—review and editing, X.D., C.Z. and J.W.; visualization, B.X.; supervision, J.W.; project administration, X.D.; funding acquisition, C.Z. and X.D. All authors have read and agreed to the published version of the manuscript.
Funding
This research was funded by national natural science foundation of China (41875111), Chongqing natural science foundation project (cstc2019jcyj-msxmX0227), Chongqing technology innovation and application demonstration general project (cstc2018jscx-msybX0165), Intelligent meteorological technology innovation team project of Chongqing meteorological bureau (ZHCXTD-201804), Data availability. The data in this study are not available for use by others.
Conflicts of Interest
The authors declare no conflict of interest.
References
- Yong-Hua, L.I.; De, L.I.U.; Ye-Yu, Z.H.U.; Yang-Hua, G.A.O.; Wen-shu, M.A.O. Singular Spectrum Analysis of Surface Air Temperature and Precipitation Series in Chongqing. Plateau Meteorol. 2005, 24, 798–804. [Google Scholar]
- Yong Hua, L.; Wen Shu, M.; Yang Hua, G.; Feng Qing, H.; Jia Qi, L. Regional Flood and Drought Indices in Chongqing and their Variation Features Analysis. J. Meteorol. Sci. 2006, 26, 638–644. [Google Scholar]
- Li, Y.H.; Gao, Y.H.; Han, F.Q.; Xiang, M.; Tang, Y.H.; He, Y.K. Features of Annual Temperature and Precipitation Variety with the Effects on NPP in Chongqing. J. Appl. Meteorol. Sci. 2007, 18, 73–79. [Google Scholar]
- Yi, Z.; Yanghua, G.; Xionghong, D. Primary Climatic Characteristics of Summer Precipitation in the Three-Gorges Reservoir Region. J. Southwest Univ. (Nat. Sci. Ed.) 2005, 27, 269–272. [Google Scholar]
- Zhenfeng, M. Forecast of Summer Precipitation over Southwest Region of China. Meteorol. Mon. 2002, 28, 29–33. [Google Scholar]
- Zhang, Q.; Jiang, T.; Wu, Y.J. Impact of ENSO Events on Flood/Drought Disasters of Upper Yangtze River during 1470–2003. J. Glaciol. Geocryol. 2004, 26, 691–696. [Google Scholar]
- De, L.; Yong-hua, L.I.; Yang-hua, G.A.O.; Jing, L.I.; Yun-hui, T.A.N.G.; Zhao, Y.E. Analysis on Eurasian Circulation of Drought and Flood in Summer of Chongqing. Plateau Meteorol. 2005, 24, 275–279. [Google Scholar]
- Xiu, Y.Y.; Han, L.; Feng, H.L. The identification of strong convective weather based on machine learning methods. Electron. Des. Eng. 2016, 24, 4–7. [Google Scholar]
- Quande, S.; Ruili, J.; Jiangjiang, X.; Zhongwei, Y.; Haochen, L.; Jianhua, S.; Lizhi, W.; Zhaoming, L. Adjusting Wind Speed Prediction of Numerical Weather Forecast Model Based on Learning Methods. Meteorol. Mon. 2019, 45, 426–436. [Google Scholar]
- Li, W.; Zhao, F.; Li, M.; Chen, L.; Peng, X. Forecasting and Classification of Severe Convective Weather Based on Numerical Forecast and Random Forest Algorithm. Meteorol. Mon. 2018, 44, 1555–1564. [Google Scholar]
- Jones, N. How machine learning could help to improve climate forecasts. Nature 2017, 548, 379–380. [Google Scholar] [CrossRef] [PubMed]
- Huang, R.F.; Zhou, G.C. Meteorology and Big Data; Science Press: Beijing, China, 2017. [Google Scholar]
- Zhao, Z.Y. Python Machine Learning Algorithm; Electronic Industry Press: Beijing, China, 2017. [Google Scholar]
- Shi, D.; Geng, H.; Ji, C.; Huang, C. Construction and application of road icing prediction model based on C4.5 decision tree algorithm. Meteorol. Sci. 2015, 35, 204–209. [Google Scholar]
- Shi, Y.; Shi, D.; Hao, L.; Zhang, Y.; Wang, P. Research on classification and prediction model of regional summer precipitation days based on CART algorithm of data mining. J. Nanjing Univ. Inf. Technol. (Nat. Sci. Ed.) 2018, 10, 118–123. [Google Scholar]
- Qin, P.C.; Liu, Z.X.; Wan, S.Q.; SU, R.R.; Huang, J.F. Yield limiting factor analysis of rapeseed in Hubei province based on decision tree and random forest model. Chin. J. Agrometeorol. 2016, 37, 691–699. [Google Scholar]
- Zhang, R.; Zhang, R.; Zuo, Z. Impact of Eurasian spring snow decrement on East Asian summer precipitation. J. Clim. 2017, 30, 3421–3437. [Google Scholar] [CrossRef]
- Wu, B.; Su, J.; D’Arrigo, R. Patterns of Asian winter climate variability and links to arctic sea ice. J. Clim. 2015, 28, 6841–6858. [Google Scholar] [CrossRef]
- Weng, H.; Wu, G.; Liu, Y.; Behera, S.K.; Yamagata, T. Anomalous summer climate in China influenced by the tropical Indo-Pacific Oceans. Clim. Dyn. 2011, 36, 769–782. [Google Scholar] [CrossRef][Green Version]
- Yuan, Y.; Yang, S.; Zhang, Z. Different evolutions of the Philippine Sea anticyclone between eastern and central Pacific El Niño: Possible effect of Indian Ocean SST. J. Climate 2012, 25, 7867–7883. [Google Scholar] [CrossRef]
- Wei, W.; Fengchang, X.; Dawei, S.; Xiaojie, S. Research and application of CART algorithm based summer drought prediction model. J. Meteorol. Sci. 2016, 36, 661–666. [Google Scholar]
- Breiman, L. Random forests. Mach. Learn. 2001, 45, 5–32. [Google Scholar] [CrossRef]
- Wu, J.; Chen, Y.F.; Yu, S.N. Research on drought prediction based on random forest model. China Rural Water Resour. Hydropower 2016, 11, 17–22. [Google Scholar]
- Binren, X.U.; Yuanyuan, W.E.I. Spatial statistical reduction of precipitation data of TRMM on Qinghai-Tibet plateau based on random forest algorithm. Remote Sens. Land Resour. 2018, 30, 181–188. [Google Scholar]
- Qingquan, L.; Yiming, D.; Yihui, L. 10-Year Hindcasts and Assessment Analysis of Summer Rainfall over China from Regional Climate Model. J. Appl. Meteorol. Sci. 2005, S1, 41–47. [Google Scholar]
- Guang-tao, D.; Bo-min, C.; Bao-de, C. Application of Regional Climate Model (RegCM3) on 10-Year Hindcast Experiment and a Real-Time Operation in Summer of 2010 in the Eastern China. Plateau Meteorology. 2012, 31, 1601–1610. [Google Scholar]
- Bai, H.; Gao, H.; Liu, C.Z.; Mao, W.Y.; Du, L.M. Assessment of Multi-model Downscaling Ensemble Prediction System for Monthly Temperature and Precipitation Prediction in GuiZhou. Desert Oasis Meteorol. 2016, 10, 58–63. [Google Scholar]
- Yang, X.B.; Zhang, J. Decision Tree and Its Techniques. Comput. Technol. Dev. 2007, 17, 43–45. [Google Scholar]
- Quinlan, J.R. C4.5: Programs for Machine Learning; Morgan Kaufman: San Mateo, CA, USA, 1993. [Google Scholar]
- Iverson, L.R.; Prasad, A.M.; Matthews, S.N.; Peters, M. Estimating potential habitat for 134 eastern US tree species under six climate scenarios. For. Ecol. Manag. 2008, 254, 390–406. [Google Scholar] [CrossRef]
- Wang, W.J.; Yao, Z.Y.; Jia, S.; Zhao, W.H.; Tan, C.; Zhang, P.; Gao, L.S.; Zhu, X.Y. Application Research on Random Forest Algorithm in the Statistical Test of Rainfall Enhancement Effect. Meteorol. Environ. Sci. 2018, 41, 111–117. [Google Scholar]
- Men, X.L.; Jiao, R.L.; Wang, D.; Zhao, C.G.; Liu, Y.K.; Xia, J.J.; Li, H.C.; Yan, Z.W.; Sun, J.H.; Wang, L.Z. A temperature correction method for multi-model ensemble forecast in North China based on machine learning. Clim. Environ. Res. 2019, 24, 116–124. (In Chinese) [Google Scholar]
- Gao, H.; Ding, T.; Li, W. The three-dimension intensity index for western Pacific subtropical high and its link to the anomaly of rain belt in eastern China (in Chinese). Chin. Sci. Bull. 2017, 62, 3643–3654. [Google Scholar] [CrossRef]
- Shao, X.; Zhou, B. Monitoring and Diagnosis of the 2015/2016 Super El Nino Event. Meteorol. Mon. 2016, 42, 540–547. [Google Scholar]


© 2020 by the authors. Licensee MDPI, Basel, Switzerland. This article is an open access article distributed under the terms and conditions of the Creative Commons Attribution (CC BY) license (http://creativecommons.org/licenses/by/4.0/).