Article

Pollution Characteristics of Atmospheric Carbonyls in Urban Linfen in Winter

1
College of Chemical and Environmental Engineering, Yangtze University, JingZhou 434023, China
2
Chinese Research Academy of Environmental Sciences, Beijing 100012, China
3
Linfen municipal ecological and environmental monitoring center of Shanxi Province, Linfen 041000, China
*
Authors to whom correspondence should be addressed.
Atmosphere 2020, 11(7), 685; https://doi.org/10.3390/atmos11070685
Submission received: 9 May 2020 / Revised: 3 June 2020 / Accepted: 11 June 2020 / Published: 29 June 2020
(This article belongs to the Section Air Quality)

Abstract

:
Atmospheric carbonyls (aldehyde and ketone compounds) can be precursors for ozone and PM2.5, and they play an essential role in atmospheric chemistry. Linfen is a basin between mountains on the east and west, and there are many coking plants on the north and south sides of its urban area. The special topography and unfortunate industrial layout have frequently contributed to serious air pollution in Linfen. In order to investigate the pollution characteristics of atmospheric carbonyls in winter in urban Linfen, the carbonyl compounds were collected from the Municipal Committee site (MC) and the Yaowangtai site (YWT) from 16 to 25 January 2019, and their concentrations were analyzed by a high performance liquid chromatography-ultraviolet detector (HPLC-UV). The results show that formaldehyde, acetaldehyde, and acetone were the most abundant compounds, accounting for more than 70% of the total mass concentration of carbonyls in urban Linfen. Levels of these three carbonyls increased during the morning and evening traffic rush hours. The mass concentration of formaldehyde at both sites reached peak values at around noon (10:00–14:00). In addition, the mass concentrations of formaldehyde, acetaldehyde, and acetone were positively correlated with CO mass concentrations, whereas only formaldehyde and acetaldehyde were positively correlated with temperature. Therefore, atmospheric formaldehyde in urban Linfen’s winter mainly came from vehicle exhaust emissions and the secondary generation of photochemical reactions. Most of the acetaldehyde came from vehicle exhaust emissions, and photochemical reactions also partially contributed to it. For acetone, vehicle exhaust emissions were the main source. In addition, coking industry emissions from Northern Linfen′s Hongtong County may also have contributed to the atmospheric carbonyls in the urban area of Linfen. For the first time, this study found that formaldehyde showed different behavior to acetaldehyde and acetone; that is, the nighttime decrease in formaldehyde mass concentration was greater than that of acetaldehyde and acetone.

1. Introduction

Aldehyde and ketone compounds, also called carbonyl compounds or carbonyls, are oxygenated volatile organic compounds (OVOCs) that are commonly found in the atmosphere [1]. The sources of aldehyde and ketone compounds in the atmosphere include primary emissions and secondary generation. Primary emissions include anthropogenic (mainly motor vehicle emissions) and natural sources (mainly vegetation emissions) [2]. Secondary generation refers to the photochemical reactions of volatile organic compounds (VOCs) which are emitted into the atmosphere from human and natural sources [2].
Due to their unstable carbonyl group, these compounds are chemically active and play an important role in the process of photochemistry. The photolysis of these compounds, especially formaldehyde, is one of the main sources of OH radicals in polluted air, and their reaction with OH is an importance source of RO, HO2, and RO2 radicals [3]. Therefore, aldehyde and ketone compounds serve as both sources and sinks for free radicals. In addition, it has been reported that carbonyls are important precursors of ozone, PM2.5 [4], and thus play an important role in photochemical pollution and haze pollution. Studies have shown that compounds such as formaldehyde, acetaldehyde, and acrolein are highly biologically toxic. In high concentrations, they can cause upper respiratory tract discomfort and even cancer [5]. In October 2017, the World Health Organization’s International Agency for Research on Cancer announced that formaldehyde is now classified as a Grade 1 carcinogen, while acetaldehyde, 2,4-hexadienal, and benzophenone are Grade 2 carcinogens, and cyclohexanone and pyruvaldehyde are Grade 3 carcinogens.
Since the appearance of photochemical smog in Los Angeles in the 1960s, foreign scholars have conducted in-depth research on atmospheric aldehyde and ketone compounds. In China, studies began to emerge in the 1990s. Xu [6], Wang [7], and Rao et al. [8] studied the aldehyde and ketone compounds in Beijing and showed that the mass concentrations of carbonyls increased from the northwest to the southeast in winter due to the northwestern wind. Coal burning and motor vehicle exhaust emissions may have been the main sources [6,7,8]. According to the research of Huang [9] and Jing [10], the average concentrations of formaldehyde, acetaldehyde, acetone, and 2-butanone were 10.4, 15.4, 9.95, and 4.56 μg/m3 in industrial areas, and 10.0, 10.04, 7.80, and 2.81 μg/m3 in commercial areas, respectively. Both areas showed diurnal variation, with high mass concentrations during the morning and evening rush hours and low concentrations at all other times. In September 2007, Shi [11] investigated aldehyde and ketone compounds in Tianjin and the Bohai Sea. The results showed that vehicle exhaust emissions and photochemical reactions are important sources; the atmospheric concentration of aldehyde and ketone compounds in the Bohai Sea (formaldehyde, acetaldehyde, and acetone were 2.45 ± 1.10 μg/m3, 4.12 ± 1.38 μg/m3, and 3.79 ± 1.89 μg/m3, respectively) was significantly lower than that in Tianjin (15.93 ± 4.49 μg/m3, 15.71 ± 7.50 μg/m3, 25.58 ± 5.96 μg/m3, and 15.68 ± 3.65 μg/m3, respectively) but higher than that of other sea areas. Jiang [12] suggested that the photooxidation of VOCs emitted by forest plants in Zhangjiajie from August 2014 to January 2015 was the main source of formaldehyde, acetaldehyde, acetone, and methacrylaldehyde (MACR) in the atmosphere, and the concentration of aldehyde and ketone compounds showed significant diurnal variation; in most cases, the maximum value tends to appear at around 13:00–15:00 each day.
Urban Linfen, located southwest of Shanxi Province, is an industrialized and densely populated city of approximately 950,000. The main urban areas are located in the center of the Linfen Basin. It faces the Taiyue Mountains to the east, the Lvliang Mountains to the west, and plains to the north and south. Due to this special topography, air convection occurs only in the northern and southern directions. However, the border between Huozhou County in Northern Linfen and Jinzhong City is very narrow, resulting in poorer atmospheric diffusion conditions in Linfen. Meanwhile, frequent temperature inversions in winter make it more difficult for pollutants to spread due to the more static and stable weather conditions. Normally, northwestern winds can effectively reduce the mass concentrations of atmospheric pollutants, but meteorological monitoring shows that when the wind speed is less than 2 m/s, Linfen’s unique topography causes the northwestern wind direction to change. These conditions are such that the concentrations of pollutants cannot effectively be reduced. The wind speed must be greater than 2 m/s for the air quality to improve. As for the distribution of pollution sources, there are seven coking plants and 10 steel plants within 50 km of urban Linfen which emit large amounts of VOCs, including aldehydes. Most of these factories are located in Xiangfen County and Quwo County, south of urban Linfen, and some are in Hongtong County, north of urban Linfen. Thus, southern winds may transport high concentrations of VOCs from Xiangfen and Quwo to urban Linfen. Conversely, northern winds may transport high concentrations of VOCs from Hongtong County to urban Linfen. In addition, household coal burning for heat in the wintertime may also lead to the increased emission of air pollutants in urban Linfen (Figure 1).
Overall, the unique topography, industrial layout, and non-commercial coal burning in Linfen City cause serious air pollution, especially in winter. However, there are no reports concerning the pollution characteristics of atmospheric carbonyls in Linfen City thus far. Therefore, it is necessary to investigate the levels, diurnal variations, and possible sources of atmospheric carbonyls in winter in Linfen in order to provide a basis of data for effective air pollution control.

2. Materials and Methods

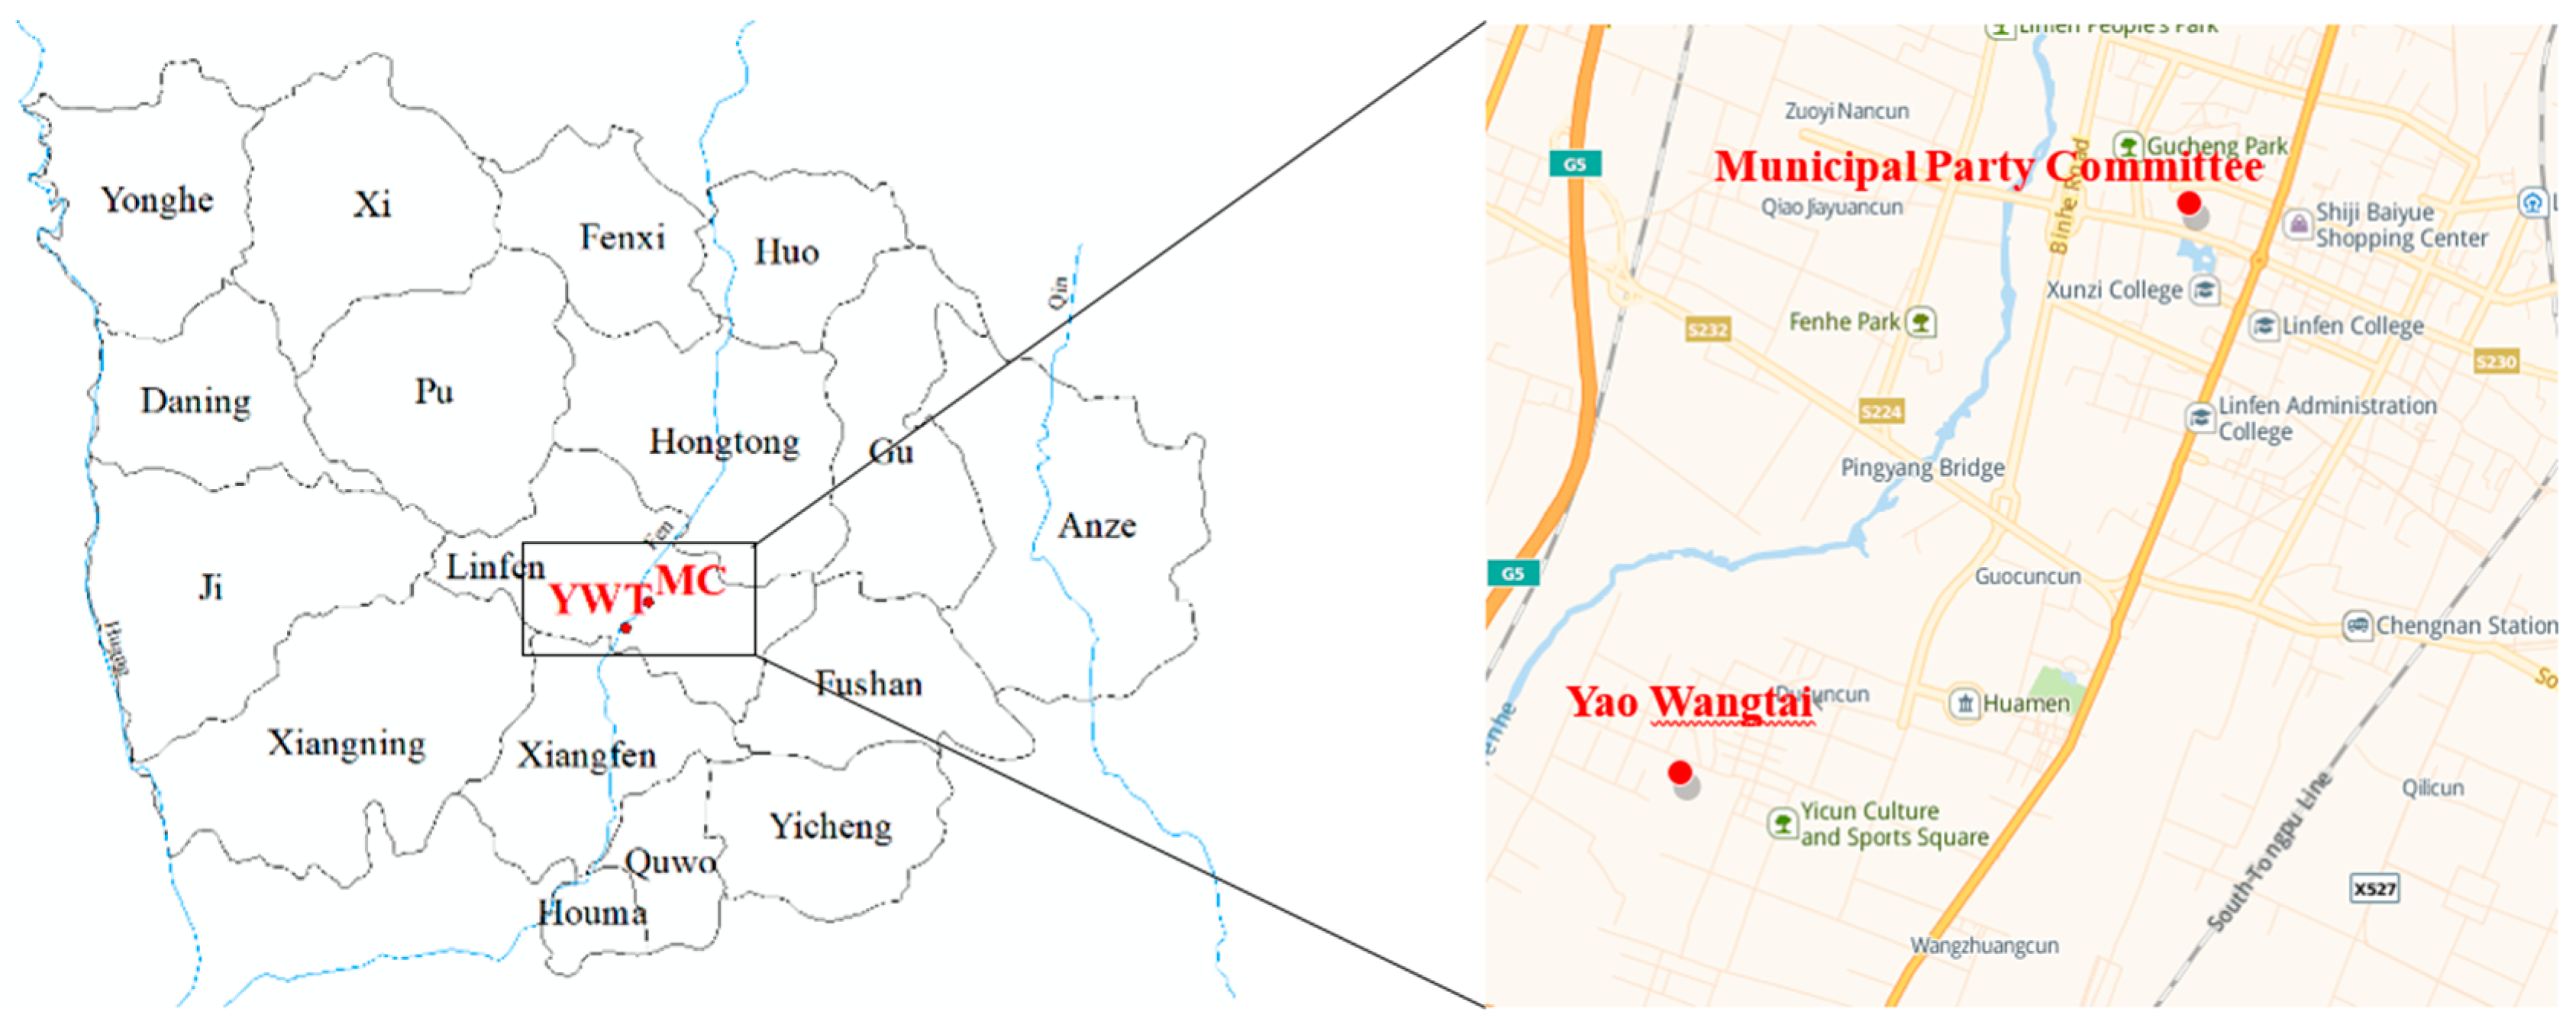
2.1. Sampling Sites and Times

Atmospheric aldehyde and ketone compounds were collected at two sampling sites: the Municipal Committee site (MC, 111.50° E, 36.09° N, traffic site) and the Yaowangtai site (YWT, 111.46° E, 36.05° N, semi-urban site) (Figure 2). The distance between the two sampling sites was about 7.4 km. The MC site was on the rooftop (about 20 m from ground level) of the office building of the municipal party committee. It was located north of Gulou West Street and was surrounded by many residential buildings, office buildings, shopping malls, and three main roads with high traffic levels, especially during the morning and evening rush hours. Therefore, this site was greatly affected by vehicle exhaust emissions. The YWT site was located on the rooftop (about 5 m from ground level) of the No. 3 Yaojing in the Yaowangtai Agricultural Demonstration Zone, Yaomiao Town. This site was surrounded by trees and some other plants. South Binhe Road, 500 m west of the sampling site, usually has a more modest traffic flow with increased traffic only during the rush hours (Figure 2). Therefore, this site was affected by vegetation emissions to some extent. Thus, the MC site was primarily used to study vehicle emission sources, and the YWT site was primarily used to study plant emission sources.
In this study, atmospheric aldehydes and ketones were sampled in accordance with the USEPA Compendium Method TO-11A [13]. The aldehyde and ketone compounds were sampled for 10 consecutive days from 16 to 25 January 2019. Sampling was performed every day from 4:00 to 24:00 at 2 h intervals, with a sampling flow rate of 0.8 L/min. During the sampling period, there was no rain or snow. The average temperature was 0.9 °C, the average relative humidity was 41%, and the average wind speed was 1.25 m/s, consisting of mainly northern winds and western winds.

2.2. Monitored Parameters

In addition to the mass concentrations of atmospheric carbonyls, several other parameters were measured at the MC site. At the MC sampling site, the CO and PM2.5 mass concentrations and meteorological factors such as wind direction, wind speed, relative humidity, and temperature were recorded. At the YWT sampling site, only the mass concentrations of aldehyde and ketone compounds were monitored.

2.3. Sample Collection and Analysis

Air samples were collected into silica cartridges impregnated with acidified 2,4-dinitrophenylhydrazine (DNPH). An ozone scrubber (Waters Corporation, Milford, MA, USA) was installed in front of the DNPH-silica cartridge in order to prevent possible ozone contamination. After sampling, the two ends of the tube were immediately sealed with poly tetra fluoroethylene (PTFE) caps, put in sealed bags, and stored below 4 °C. Before the analysis, acetonitrile was used to elute the aldehyde and ketone compounds in the sampling tube into the injection vial, and then qualitative and quantitative analyses were performed using a high performance liquid chromatography-ultraviolet detector (HPLC-UV). The mixed standard solution of 15 aldehyde and ketone compounds of TO-11 standard was selected to prepare a standard stock solution, and a standard curve was drawn by using the diluted standard solution. This method can be used to analyze 15 different aldehyde and ketone compounds, including formaldehyde, acetaldehyde, acrolein, acetone, propionaldehyde, butenal, butyraldehyde, benzaldehyde, isovaleraldehyde, valeraldehyde, o-methylbenzaldehyde, m-formyl Methylbenzaldehyde, p-methylbenzaldehyde, hexanal, and 2,5-dimethylbenzaldehyde, and methacrylaldehyde (MACR) was also measured.

2.4. Quality Assurance and Quality Control

In order to ensure the accuracy and reliability of the data analysis, strict quality assurance and control measures were taken during sampling, including regular verification and flow calibration of the sampler. A blank sample was collected each day, and the collected samples were kept away from light at a low temperature (<4 °C) and analyzed as soon as possible. At each sampling site, two field samples were collected with a back-up cartridge to evaluate breakthrough. Anything that affected the sampling process was recorded.
Other quality control measures included regularly verifying and calibrating the instruments, as well as using national standard samples to prepare standard stock solutions. In addition, the reagents used for sample pretreatment and instrument analysis were of excellent grade or chromatographic grade. The correlation coefficient was above 0.995, and a solution close to the middle concentration of the calibration curve was prepared with a standard solution for analysis. The relative error between the two concentrations was controlled within ±10%; otherwise, the standard curve had to be redrawn.

2.5. Methods of Contaminated Air Mass Transport Research

The Hybrid Single Particle Lagrangian Integrated Trajectory Model Version 4 (HYSPLIT4) is a model for calculating and analyzing the transport and diffusion trajectories of atmospheric pollutants. It has been widely used in the analysis of the transport routes and sources of atmospheric pollutants [14,15,16,17,18,19,20]. This model can be used to identify the pollution sources that affect air quality and analyze the impact of these potential pollution sources on the air quality in the study area [21,22]. In this study, the HYSPLIT4 model was used to simulate the backward trajectory of air mass and conduct studies on the cluster analysis of the trajectory, Potential Source Contribution Function (PSCF) and Concentration Weighted Trajectory (CWT). The grid covered the area of interest, defined by (35.2° N–41° N) and (104° E–114° E) with the center of the MC site (111.50° E, 36.09° N) as the midpoint, and it contained grid cells of 0.2° × 0.2°. The arrival height was chosen as 100 m above ground level in order to represent a well-mixed convective boundary layer for regional transport investigation. This height was chosen in order to weaken the effects of surface friction. A starting height of 100 m has been used in a number of prior publications [23,24].
The PSCF, which indicates the probability that the air mass on a pollution day originated in a given grid cell, was calculated using Equation (1) [21].
PSCFi,j = mi,j/ni,j
where,
ni,j: The total cases that air masses originate in the ijth cell during the study period.
mi,j: Number of cases that the air masses originate in the ijth cell on the pollution days.
PSCFi,j: Probability that air masses originating in the ijth cell on the pollution days.
The CWT is a measure of the source strength of a grid cell to the MC site and is determined as follows [25,26]:
CWT i , j = T = 1 L C T τ i , j , T T = 1 L τ i , j , T
where,
CT: The carbonyl compounds concentration corresponding to the arrival of back trajectory T.
τi,j,T: The number of trajectory segment endpoints in grid cell (i,j) for back trajectory T divided by the total number of trajectory segment endpoints for back trajectory T.
L: the total number of back trajectories over a time period.

3. Results and Discussion

3.1. Levels of Atmospheric Carbonyls in Urban Linfen in Winter

From 16 to 25 January 2019, 96 and 89 data records of aldehyde and ketone compounds were obtained at the two sampling sites of MC and YWT, respectively; 15 and 16 compounds were identified, respectively. The arithmetic mean mass concentrations for the measured aldehyde and ketone compounds are listed in Table 1. During the monitoring period, the average mass concentrations of total carbonyl compounds at MC and YWT were 16.9 μg/m3 and 18.3 μg/m3, respectively. The average concentrations of total carbonyl compounds at YWT were higher than those at MC, mainly because of the higher acetone concentration at YWT.
The three aldehyde and ketone compounds with the highest mass concentration at MC were formaldehyde (4.59 μg/m3), acetaldehyde (4.47 μg/m3), and acetone (3.24 μg/m3), which accounted for 74% of the total mass concentration. At YWT, they were acetaldehyde (4.89 μg/m3), acetone (4.83 μg/m3), and formaldehyde (3.66 μg/m3), accounting for 73% of the total mass concentration. The above results showed that the mass concentrations of acetaldehyde at both sampling sites had similar values. The mass concentration of formaldehyde at MC was higher than that found at YWT, and the mass concentration of acetone was higher at YWT than at MC.
Formaldehyde, acetaldehyde, and acetone were identified as key compounds because they accounted for more than 73% of the total mass concentration of carbonyls in urban Linfen, and MACR was identified as a key vegetation-based compound.
The atmospheric mass concentrations of urban Linfen’s three major carbonyls were compared with those of other cities, as listed in Table 2. The data show that the carbonyl mass concentrations in urban Linfen were much higher than those of Orleans, France in January 2011, but they were far lower than those of Fortaleza in Brazil in 2004 (except for acetaldehyde). The mass concentrations of formaldehyde and acetaldehyde were higher than those in Rome, Italy in 2006, but the mass concentration of acetone was slightly lower. Compared with domestic cities, the mass concentrations of formaldehyde, acetaldehyde, and acetone in urban Linfen were all at medium levels, which were comparable to the levels in Beijing in January 2014, higher than those in the same period in 2011 but much lower than those in the winter of 2007. The mass concentrations of key carbonyls in the present study were far lower than those in Foshan in 2014 and Zhengzhou in 2012. The mass concentrations of formaldehyde and acetaldehyde in urban Linfen were higher than those of the winter heating period from 2015 to 2016 in Xi’an, but the acetone mass concentration was lower (Table 2).

3.2. Diurnal Variations of Same Key Carbonyls at the Two Sites

Figure 3 shows the diurnal variations of the mass concentrations of the key carbonyls’, CO and PM2.5, mass concentrations at the MC site and the diurnal variations of the key carbonyls at YWT from 16 to 25 January 2019. During this period, Linfen City experienced two pollution events, transitioning from “good” to “heavy pollution” (from 16th to 19th, and from 21st to 24th). On the 25th, the air quality was categorized as “heavy pollution” before 9:00, and it began to improve from 10:00 since the wind speed increased to 3.1 m/s. However, it worsened again from 20:00 because of a reduction in the boundary layer and wind speed.
During the observed periods, the daily variations in the concentrations of key carbonyls, CO and PM2.5, were different. Except for a few days of formaldehyde, the mass concentrations of formaldehyde, acetaldehyde, acetone, PM2.5, and CO in the two pollution processes all increased with the increase in pollution level (Figure 3). They increased slowly and reached peak values on 19th, and then they decreased to low levels from 20th to 21st before rising again due to the influence of the northwestern wind. The sum of the concentrations of formaldehyde, acetaldehyde, and acetone reached their highest values (24.7 μg/m3) and (27.5 μg/m3) at 22:00 at MC and at 20:00 at YWT on the 24th, respectively. On the 20th, 21st, and 25th, the wind speed was greater than 3 m/s, leading to a significant decrease in carbonyls, especially at 10:00 on the 25th.
The variations in atmospheric carbonyl mass concentrations are usually determined by the emission sources, secondary generation of photochemical reactions, photolysis and photooxidation reactions, the height of the boundary layer, aerosol liquid water (ALW) or the liquid water content (LWC) of fog or cloud droplets, dew and other surface sources of liquid water, etc. [33,34,35]. Except for formaldehyde on some days, the mass concentrations of each key carbonyl at the two sites generally showed similar diurnal variations. Figure 3 shows that the formaldehyde mass concentration at both sites was high during the day and low in the morning and evening. The formaldehyde mass concentration was lowest from 4:00 to 6:00, and it then increased rapidly and reached its first peak at around noon (10:00~14:00), stayed high until 20:00, or rose again during rush hours from 18:00 to 20:00. After this, it decreased rapidly (Figure 3). Jiang et al. [32] also reported that formaldehyde had an elevated concentration in the afternoon (around 14:00) and during traffic rush hours (17:00~19:00) in all seasons in Orléans, France. In our study, the mass concentration of formaldehyde was positively correlated with CO mass concentration and temperature (Table 3). This suggests that the enhanced traffic emissions during the morning rush hour were responsible for the increase in formaldehyde [36,37]. Moreover, the higher mass concentrations of formaldehyde found at around noon may have been because of an accumulation of traffic emissions and the secondary generation of photochemical reactions [38]. In addition, the concentration of formaldehyde around the evening (16:00~18:00) was the same or greater than that at noon on polluted days. This may have been because of enhanced traffic emissions and a much lower boundary layer height than was observed at noon.
Interestingly, the formaldehyde mass concentration at YWT declined greatly from 16:00 to 18:00 on most days, while that of the MC site showed no such decrease. Thus, the formaldehyde mass concentration at YWT was far lower than that at MC by 22:00 (Figure 3). This might have been because the traffic flow around YWT was much lower than that around MC. Therefore, the emission of formaldehyde at YWT was far lower than that at MC.
The mass concentrations of acetaldehyde and acetone also increased in the morning and evening rush hours (Figure 3) at MC. In addition, acetaldehyde and acetone were strongly positively correlated with CO (Table 3), so the above results were attributed to vehicle exhaust emissions [36,37]. In addition, on some days, the acetaldehyde mass concentration increased slowly from 12:00 to 14:00. Moreover, there was a weak correlation between acetaldehyde and temperature (Table 3). These results indicate that photooxidation secondary reactions also contributed to some of the acetaldehyde emissions [39]. In contrast to formaldehyde and acetaldehyde, almost all of the acetone mass concentrations decreased from 12:00 to 14:00, and there was almost no correlation between acetone and temperature (Table 3). This indicate that not much acetone came from photooxidation reactions of secondary generation [39].
The observations of MACR mass concentration differed from the above aldehyde and ketone compounds. There was usually an increase of MACR at early afternoon at YWT and the mass concentration of YWT after 12:00 on the 20th and 21st was significantly higher than that of MC because the former site had more vegetation. It is known that MACR is one of the specific products of isoprene photooxidation. On the 20th and 21st, the sunlight radiation was intense and favored the vegetative emission and oxidation of isoprene. Due to the plentiful vegetation around YWT, the mass concentration of discharged isoprene was higher than that at MC, resulting in the MACR mass concentration being higher than that at MC. In addition, the MACR mass concentration increased during the morning and evening rush hours. It can therefore be concluded that automobile exhaust emissions contribute to the formation of the MACR that was detected. This is consistent with research findings that automobiles can also emit acetone and MACR [40].
In summary, formaldehyde came from vehicle exhaust emissions and the secondary generation of photochemical reactions in urban Linfen. Most acetaldehyde was affected by vehicle exhaust emissions, and photochemical secondary generation also contributed to some acetaldehyde emission, while vehicle exhaust emissions were the main sources of acetone emission.

3.3. Diurnal Variations of Different Carbonyls at the Same Sampling Site

As seen in Figure 3, the diurnal variation in the formaldehyde mass concentrations at MC is consistent with that of the acetaldehyde and acetone mass concentrations in most cases. That is, their mass concentration began to increase from 4:00 and decreased from 10:00 to 14:00, then it rose again from 18:00 to 20:00. In addition, with the exception of 21st and 22nd January, the three compounds all had a maximum mass concentration from 18:00 to 20:00 because of the vehicle emissions and a decrease in the boundary layer. However, the diurnal variations of formaldehyde and MACR were not the same, instead sometimes showing a slight increment in the early afternoon.
The mass concentration of formaldehyde at MC was higher than the mass concentration of acetaldehyde and acetone between 10:00 and 20:00 every day, which may be attributed to the stronger direct emissions from motor vehicles and the secondary production of photochemical reactions. It was noticed that, in most cases, no matter how much higher the maximum mass concentration of formaldehyde was on the previous night than that of acetaldehyde and acetone, the decrease in formaldehyde mass concentration was much greater than that of acetaldehyde and acetone from the night to the morning of the next day. That is to say, the minimum mass concentration of formaldehyde in the early morning was much lower than that of acetaldehyde and acetone on most days. Generally, carbonyl compounds can be removed at night by reacting with NO3 free radicals, dissolving in fog and dew, wet deposition, and dissolving on wet surfaces of particles [41,42,43]. During the monitoring period, there was no rain, snow, fog, or dew. Meanwhile, the reaction rate constant of formaldehyde with NO3 free radicals (5.6 × 1014 cm3 molecule−1 s−1 [44]) was lower than that of acetaldehyde (27 × 1014 cm3 molecule−1 s−1 [44]). Therefore, removal routes other than dissolution on the wet surfaces of particles can be excluded. It was reported that the concentration of carbonyls dissolving on the wet surface of particles was 1% of their atmospheric concentration, but this was significantly higher than that on particles calculated based on Henry′s law. This may be due to the oversaturation of carbonyls on the particles, which is beyond the scope of Henry′s law [45]. Generally, the amount of pollutant dissolved on the wet surface of particles is determined by the water content of particles. During the monitoring period, the relative humidity (RH) at the MC site was very low, and 97% of the RH values that we measured were lower than 50%. It was far lower than the requirement for RH (RH > 60%) which is needed for calculating the water content of particles by the E-AIM model. This indicates that the water content on the surface of the particles at MC site was very low, and the amount of formaldehyde adsorbed by particles during the monitoring period may have been much less than 1% of their atmospheric concentration. Therefore, compared with the decreased rate (19~87%) of formaldehyde mass concentration at night, the amount of formaldehyde removed from the atmosphere by particle absorption was negligible. Therefore, the larger drop in formaldehyde concentration at night compared with that of acetaldehyde and acetone cannot be explained only by the data obtained in this study, and relevant studies should be carried out in the future.

3.4. Influence of Wind Speed and Wind Direction on the Atmospheric Concentration of Key Carbonyls in Urban Linfen in Winter

It is known that wind can reduce the mass concentration of air pollutants and improve air quality. Figure 4 shows the relationships between the mass concentrations of formaldehyde, acetaldehyde, and acetone and wind speed at MC during the monitoring period. It can be seen from Figure 4 that the wind speed was less than 2 m/s in most cases, and the mass concentrations of the three compounds fluctuated and were not affected by the wind when it was less than 2 m/s. The above results indicate that the atmosphere of urban Linfen was in a relatively stable state most of the time, which was not conducive to the diffusion of pollutants. However, when the wind speed was higher than 2 m/s, the mass concentrations of the three compounds decreased sharply to less than half their maximum values. This indicates that the wind speed must be greater than 2 m/s in order for the atmospheric diffusion conditions to be more effective in urban Linfen.
Figure 5a–c shows the correlation between the mass concentrations of formaldehyde, acetaldehyde, and acetone and wind direction, respectively. It can be seen from Figure 5 that, during the monitoring period, the higher mass concentrations of formaldehyde, acetaldehyde, and acetone in urban Linfen City occurred primarily during western and northeastern winds. Studies have shown that the atmospheric lifetimes of formaldehyde, acetaldehyde, and acetone are 4 h, 6 d, and 60 d [42], respectively. Therefore, these aldehyde and ketone compounds and their precursor VOCs with longer atmospheric lifetimes can be transported to the downwind region by wind. Hongtong County, located to the northeast of the urban area of Linfen, has many coking and steel plants which emit a large amount of aldehyde–ketone compounds and VOCs. These pollutants can be transported to the urban area of Linfen. Photolysis or photooxidation reactions can occur during their transport process or after they reach the city, causing an increase in the mass concentration of aldehyde and ketone compounds in the urban area of Linfen [43].

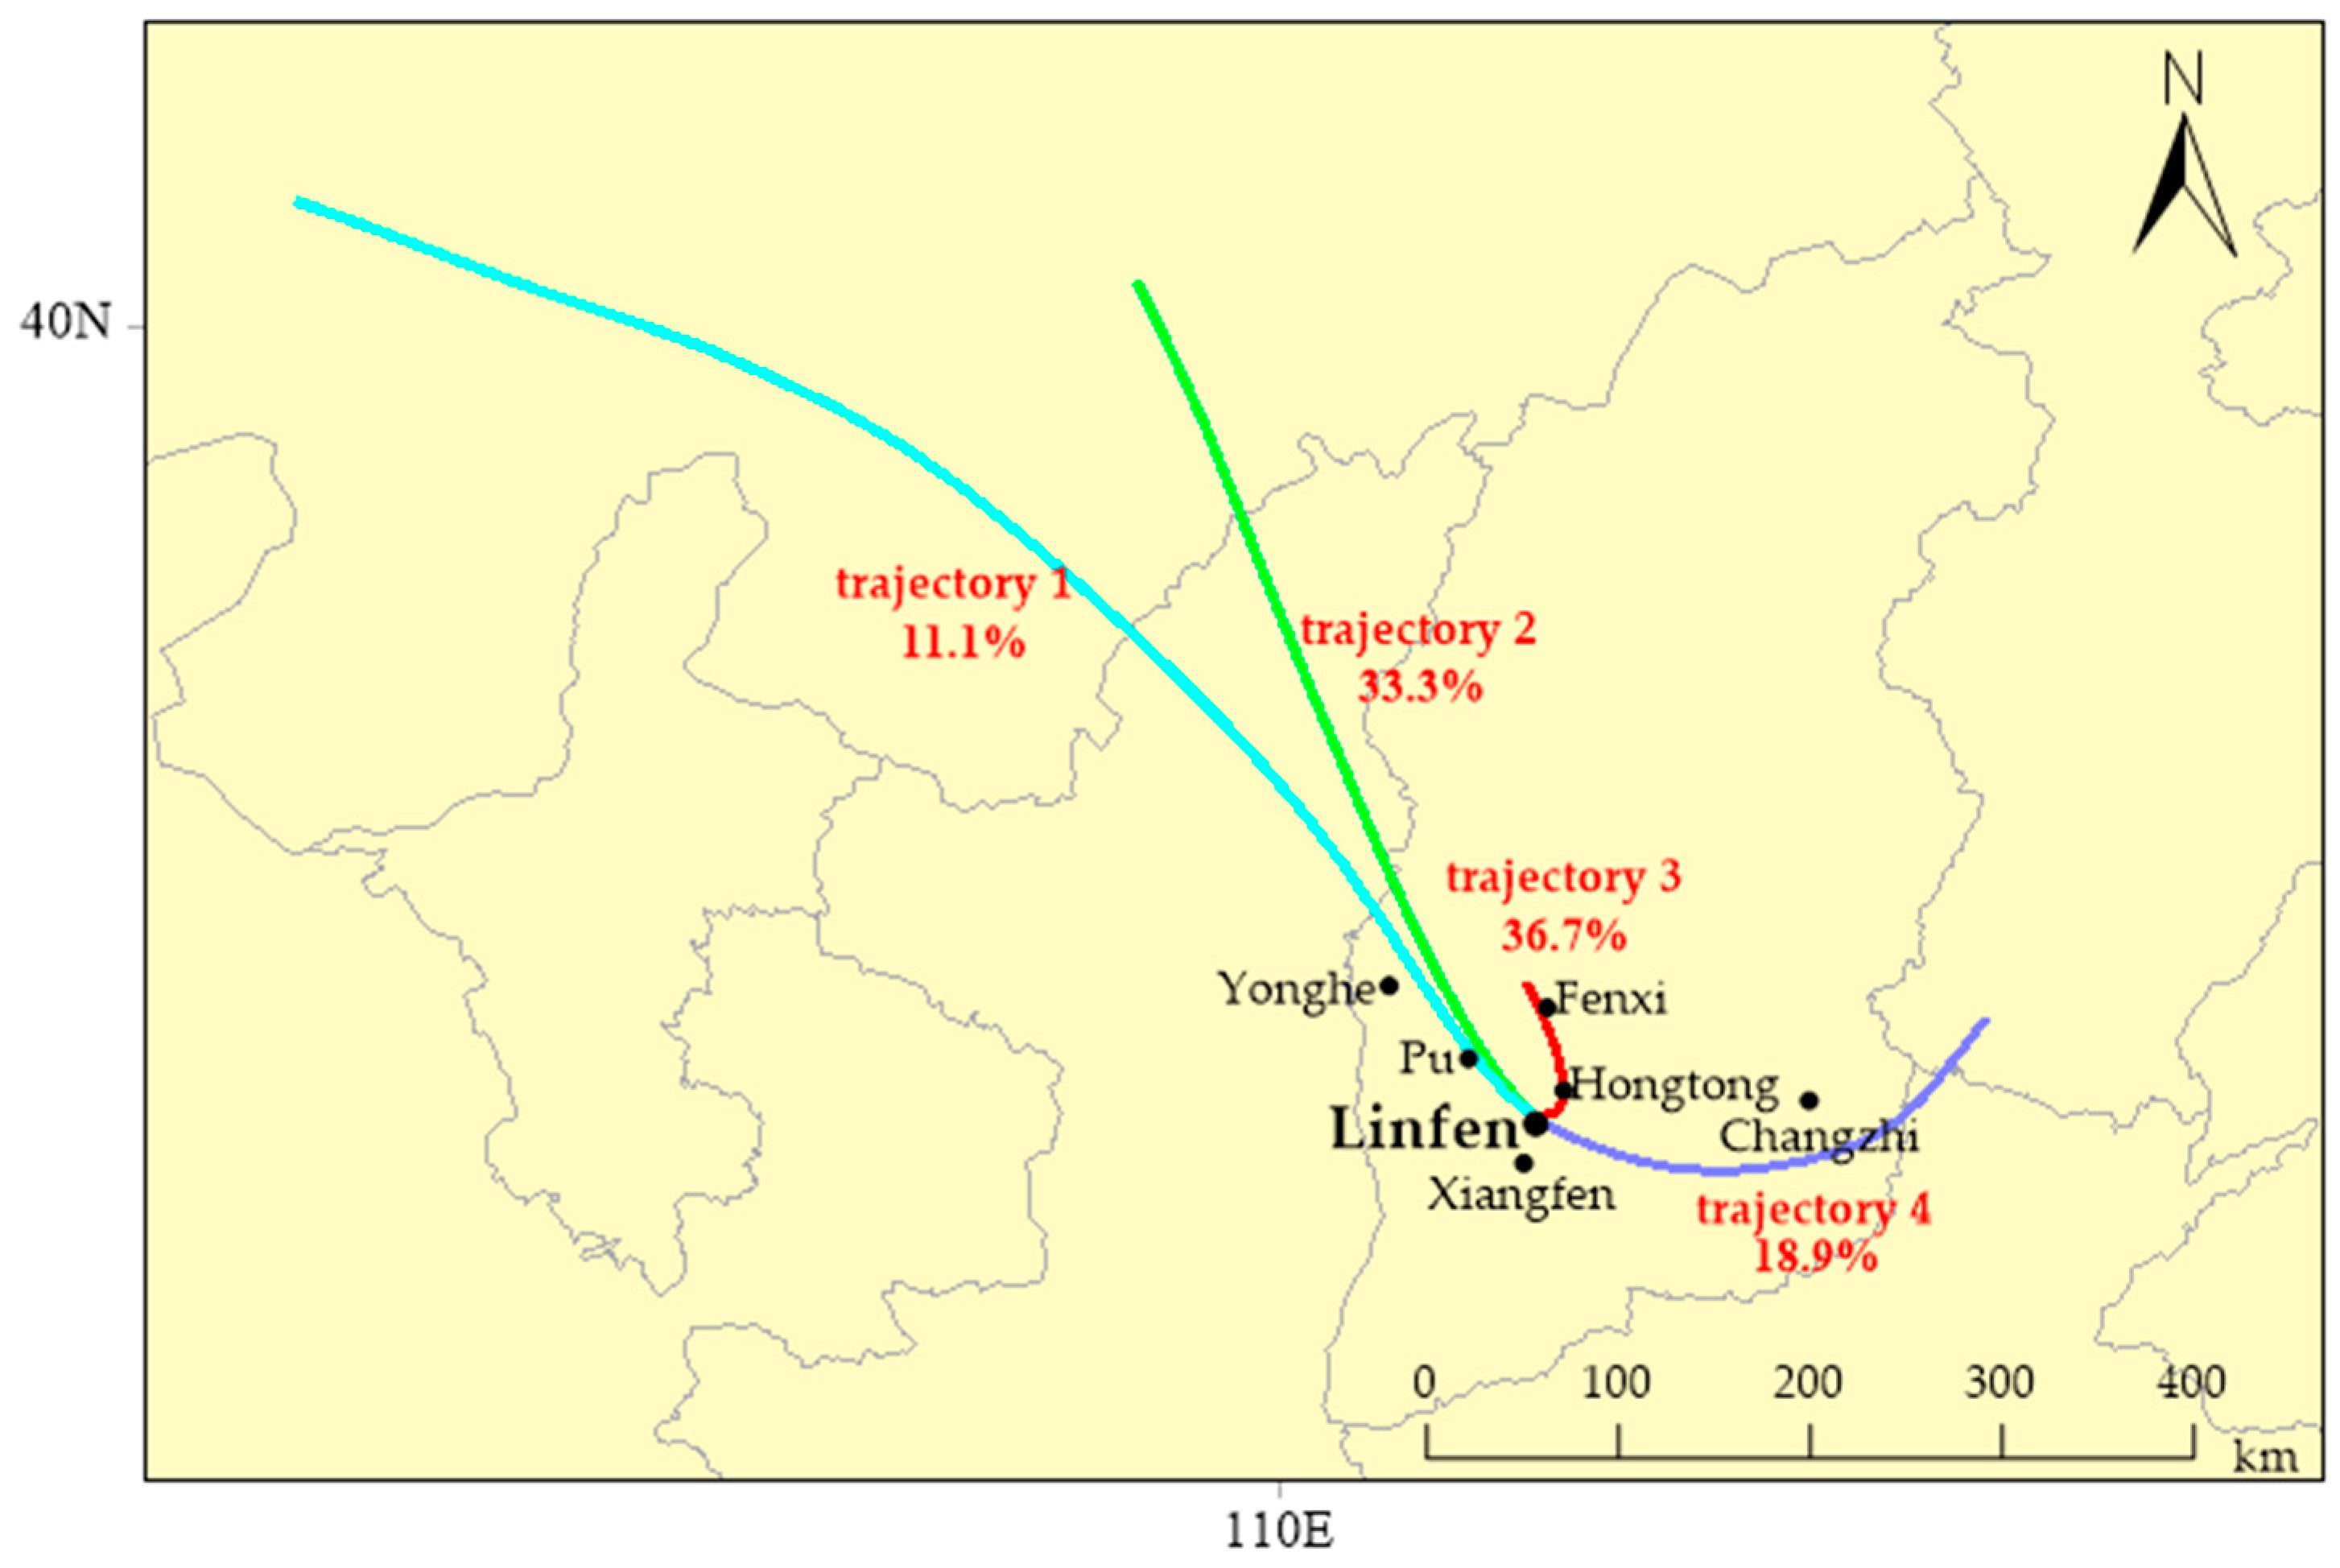
3.5. Analysis of the Transport Paths and Potential Source Areas of Atmospheric Carbonyls in Urban Linfen

In order to explore the influence of external pollution sources on the mass concentrations of carbonyls in urban Linfen using the HYSPLIT4 model, MC (111.50° E, 36.09° N) was taken as the target point to simulate the backward trajectory of urban Linfen, with 04:00 (UTC) as the starting time each day. During the monitoring period, the 24-h backward trajectory of air mass movement at 100 m above ground was simulated by the TrajStat software. A total of 110 trajectories were simulated; the mass concentrations of aldehyde and ketone compounds were imported into the corresponding trajectory and source clustering analysis was conducted for each trajectory (Figure 6). The results show that there were four main trajectories of air masses that reached urban Linfen during the monitoring period, including three from the north (81.1%) and one from the east (18.9%). Trajectory 1 from the north was the longest, but its pollution impact proportion was the lowest (11.1%). It started from Inner Mongolia and passed through Shanxi Province, Yonghe County, and Pu County to reach urban Linfen. Trajectory 2 was the second longest (33.3%) and had basically the same route as Trajectory 1. Trajectory 3 was the shortest, but it accounted for 36.7% of the total pollution impact proportion. It started from Fenxi County and reached urban Linfen after passing through Hongtong County. Trajectory 4 from the east started at Hebei Province, passed through Changzhi City and then reached urban Linfen.
Figure 7a,b displays the maps of the potential source regions of carbonyls and the distribution of the weighted trajectory concentrations. The redder the area in Figure 7a, the greater its possibility of being a potential source of pollution for urban Linfen. In Figure 7b, the redder the area, the greater its contribution to the mass concentration of aldehyde and ketone compounds in urban Linfen. As can be seen from Figure 7a, the local emissions from urban Linfen were the most likely to be potential sources of aldehyde and ketone compounds, followed by Hongtong County in the north and Xiangfen County in the south. Figure 7b shows that, in addition to the contribution of local emissions to the mass concentration of aldehyde and ketone compounds in urban Linfen, the pollution emissions of Hongtong County also contributed significantly to the mass concentration of aldehyde and ketone compounds in urban Linfen. This is because the northern wind can transport the waste gas, with large amounts of aldehyde and ketone compounds and VOCs, that is emitted from the four large industrial parks in Hongtong County (including Zhaocheng Coal Coking Processing Park) to urban Linfen.

4. Conclusions

The mass concentrations of atmospheric carbonyls were measured at the Municipal Committee site (MC, traffic source site) and the Yaowangtai site (YWT, plant source site) in urban Linfen from 16 to 25 January 2019. In total, 15 and 16 carbonyl compounds were identified at the MC site and the YWT site, respectively. Formaldehyde, acetaldehyde, and acetone were the most abundant carbonyls, accounting for more than 70% of the total mass concentration of carbonyls at the two sites. Their average mass concentrations were 4.59 μg/m3, 4.47 μg/m3, and 3.24 μg/m3 at MC, and 3.66 μg/m3, 4.89 μg/m3, and 4.83 μg/m3 at YWT. These three carbonyls increased during the morning and evening traffic rush hours. All of the formaldehyde mass concentrations and a part of the acetaldehyde mass concentration increased from 10:00 to 14:00 on pollution days. In addition, the mass concentrations of formaldehyde, acetaldehyde, and acetone were positively correlated with CO. The mass concentrations of formaldehyde and acetaldehyde were positively correlated with temperature. Almost no correlation was found between acetone and temperature. Therefore, formaldehyde mainly came from vehicle exhaust emissions (primary emissions) and photochemical reactions (secondary generation). Most of the acetaldehyde emissions came from vehicle exhausts, and photochemical reactions also contributed in part. For acetone, vehicle exhaust emissions were the main source. In addition, coking industry emissions from Northern Linfen’s Hongtong County may also have contributed to the atmospheric carbonyls found in the urban area of Linfen. For the first time, this study found that formaldehyde showed different behavior from acetaldehyde and acetone; that is, the mass concentration of formaldehyde decreased more than that of acetaldehyde and acetone at nighttime. However, we cannot explain the reason for this. Relevant studies should be carried out in the future.

Author Contributions

Conceptualization, F.L., Y.Z. and X.C.; Formal analysis, L.D.; Funding acquisition, Y.Z.; Investigation, H.W., X.W. and Y.K.; Methodology, F.L. and Z.X.; Project administration, Z.X.; Software, X.W.; Supervision, Z.X. and L.D.; Validation, X.C.; Writing—original draft, F.L., H.W., Y.Z. and X.C.; Writing—review & editing, F.L., H.W., X.W., Y.Z. and X.C. All authors have read and agreed to the published version of the manuscript.

Funding

This research was funded by Central Level, Scientific Research Institutes for Basic R&D Special Fund Business, China (No.2016-YSKY-026).

Acknowledgments

The author would like to thank Zhenhai Wu, Liang Peng, Xin Zhang, Lihui Zhang, Zhen He and Zhuangzhi Zhou of the Chinese Academy of Environmental Sciences for their help in this study. Thanks to the Linfen ecological environment bureau of Shanxi Province and the Linfen ecological environment monitoring center of Shanxi Province for their support to this study.

Conflicts of Interest

The authors declare no conflict of interest.

References

  1. Chen, X.; Li, X. Study Advance on Oxygenated Volatile Organic Compounds in Atmosphere. J. Cap. Norm. Univ. (Nat. Sci. Ed.) 2018, 039, 45–55. [Google Scholar]
  2. Tan, P.-G.; Yu, Y.B.; Jiang, H.W.; Liu, Z. Analysis and concentration variability of carbonyl compounds in Qingdao atmosphere. China Environ. Sci. 2002, 22, 451–455. [Google Scholar]
  3. Xue, Y. Charanteristics and Source of Carbonyls and Effects on Photochemistry Pollution in North China Plain; Shandong University: Jinan, China, 2018. [Google Scholar]
  4. Liu, Y. Study on Atmospheric Methane in Beijing: Emission from Rice Paddies and Consumption by Oxidizing; Chinese Rwsearch Academy of Environmental Sciences: Beijing, China, 1995. [Google Scholar]
  5. Lv, W. The Study on the Spatial-Temporal Distribution of Volatile Carbonyls in Atmosphere of the Pearl River Delta; Jinan University: Guangzhou, China, 2007. [Google Scholar]
  6. Xu, J.-Y.; Gao, Y. Seasonal Variations of Carbonyl Compounds in Urban Atmosphere of Beijing. Environ. Sci. 2009, 30, 625–630. [Google Scholar]
  7. Wang, Q.; Shao, M.; Wei, Q.; Chen, W.T.; Lu, S.H.; Zhao, Y. Spatial and Temporal Variations of Ambient Carbonyl Compounds in Beijingand Its Surrounding Areas. Environ. Sci. 2011, 32, 3522–3530. [Google Scholar]
  8. Rao, Z.; Chen, Z.; Liang, H.; Huang, L.; Huang, D. Carbonyl compounds over urban Beijing: Concentrations on haze and non-haze days and effects on radical chemistry. Atmos. Environ. 2016, 124, 207–216. [Google Scholar] [CrossRef]
  9. Huang, J.; Feng, Y.; Li, J.; Xiong, B.; Feng, J.; Wen, S.; Sheng, G.; Fu, J.; Wu, M. Characteristics of carbonyl compounds in ambient air of Shanghai, China. J. Atmos. Chem. 2008, 61, 1–20. [Google Scholar] [CrossRef]
  10. Jing, S. Study on the level of ambient carbonyl compounds in typical regions of Shanghai. Environ. Pollut. Control 2017, 39, 713–716. [Google Scholar]
  11. Shi, J.-W.; Pang, X.-B.; Bai, Z.-P.; Jin, L.-M.; Li, W.-F.; Kong, S.-F. Measurement of Carbonyl Compounds in Ambient Air of Tianjin City and Bohai Sea. J. Tianjin Univ. 2011, 3, 49–57. [Google Scholar]
  12. Jiang, Z.; Wang, Y.; Zheng, X.; Liu, X.; Xia, C.; Xiao, X.; Li, S. Variation Characteristics of Atmospheric Carbonyl Compounds in Zhangjiajie Forest. Res. Environ. Sci. 2016, 29, 1272–1278. [Google Scholar]
  13. US EPA. Compendium Method TO-11A Determination of Formaldehyde in Ambient Air Using Adsorbent Cartridge Followed by High Performance Liquid Chromatography (HPLC): Active Sampling Methodology; Center for Environmental Research Information Office of Research and Development: Cincinnati, OH, USA, 1999.
  14. Ren, C.B.; Wu, L.X.; Zhang, Y.Y. Analyze to the seasonal differences of transport pathways and potential source-zones of Beijing Urban PM2.5. China Environ. Sci. 2016, 36, 2591–2598. [Google Scholar]
  15. Wang, G.; Wang, D.; Chen, Z. Characteristics and transportation pathways and potential sources of a severe pm2.5 episodes during winter in beijing. China Environ. Sci. 2016, 36, 1931–1937. [Google Scholar]
  16. Begum, B.A.; Kim, E.; Jeong, C.H.; Lee, D.W.; Hopke, P.K. Evaluation of the potential source contribution function using the 2002 Quebec forest fire episode. Atmos. Environ. 2005, 39, 3719–3724. [Google Scholar] [CrossRef]
  17. Xu, X.; Akhtar, U.S. Identification of potential regional sources of atmospheric total gaseous mercury in Windsor, Ontario, Canada using hybrid receptor modeling. Atmos. Chem. Phys. 2010, 10, 7073–7083. [Google Scholar] [CrossRef] [Green Version]
  18. Wang, Y.Q.; Zhang, X.Y.; Draxler, R.R. TrajStat: GIS-based software that uses various trajectory statistical analysis methods to identify potential sources from long-term air pollution measurement data. Environ. Model. Softw. 2009, 24, 938–939. [Google Scholar] [CrossRef]
  19. Wang, A.; Zhu, B.; Yin, Y.; Jin, L.; Zhang, L. Aerosol number concentration properties and potential sources areas transporting to the top of mountain Huangshan in summer. China Environ. Sci. 2014, 34, 852–861. [Google Scholar]
  20. Hsu, Y.K.; Holsen, T.M.; Hopke, P.K. Comparison of hybrid receptor models to locate PCB sources in Chicago. Atmos. Environ. 2003, 37, 545–562. [Google Scholar] [CrossRef]
  21. Pongkiatkul, P.; Oanh, N.T.K. Assessment of potential long-range transport of particulate air pollution using trajectory modeling and monitoring data. Atmos. Res. 2007, 85, 3–17. [Google Scholar] [CrossRef]
  22. Byčenkienė, S.; Plauškaitė, K.; Dudoitis, V.; Ulevicius, V. Urban background levels of particle number concentration and sources in Vilnius, Lithuania. Atmos. Res. 2014, 143, 279–292. [Google Scholar] [CrossRef]
  23. Liu, N.; Ye, Y.; He, J.; Zhao, S. Integrated modeling ofurban-scale pollutant transport: Application in a semi-arid urban valley, Northwestern China. Atmos. Pollut. Res. 2013, 4, 306–314. [Google Scholar] [CrossRef] [Green Version]
  24. Riuttanen, L.; Hulkkonen, M.; Dal Maso, M.; Junninen, H.; Kulmala, M. Trajectory analysis of atmospheric transport of fine particles, SO2,NOxand O3 to the SMEAR II station in Finland in 1996–2008. Atmos. Chem. Phys. 2013, 13, 2153–2164. [Google Scholar] [CrossRef] [Green Version]
  25. Jeong, U.; Kim, J.; Lee, H.; Jung, J.; Kim, Y.J.; Song, C.H.; Koo, J.-H. Estimation of the contributions of long range transported aerosol in EastAsia to carbonaceous aerosol and PM concentrations in Seoul, Koreausing highly time resolved measurements: A PSCF model approach. J. Environ. Monit. 2011, 13, 1905–1918. [Google Scholar] [CrossRef] [PubMed]
  26. Kabashnikov, V.P.; Chaikovsky, A.P.; Kucsera, T.L.; Metelskaya, N.S. Estimated accuracy of three common trajectory statistical methods. Atmos. Environ. 2011, 45, 5425–5430. [Google Scholar] [CrossRef]
  27. Zhou, X.-M.; Tan, J.-H.; Xiang, P.; He, X.L.; Guo, S.J.; Duan, J.C.; He, K.B.; Ma, Y.L.; Deng, S.X.; Situ, S.P. Chemical characteristics of atmospheric carbonyls in winter and summer in Foshan City. China Environ. Sci. 2017, 37, 844–850. [Google Scholar]
  28. Wang, L.-L.; Wang, W.-S.; Zhao, X.-N.; Xu, X.-L. Pollution Characteristics and Sources of Carbonyl Compounds in Zhengzhou Ambient Air of Winter and Summer; Environmental Monitoring in China: Henan, China, 2014. [Google Scholar]
  29. Fan, Z.; Ma, W.; He, Y.; Wang, F. Pollution characterizations of aldehyde and ketones in haze air during winter domestic heating season of Xi’an. Environ. Pollut. Control. 2019, 41, 88–91. [Google Scholar]
  30. Possanzini, M.; Tagliacozzo, G.; Cecinato, A. Ambient Levels and Sources of Lower Carbonyls at Montelibretti, Rome (Italy). Water Air Soil Pollut. 2007, 183, 447–454. [Google Scholar] [CrossRef]
  31. Cavalcante, R.M.; Campelo, C.S.; Barbosa, M.J.; Silveira, E.R.; Carvalho, T.V.; Nascimento, R.F. Determination of carbonyl compounds in air and cancer risk assessment in an academic institute in Fortaleza, Brazil. Atmos. Environ. 2006, 40, 5701–5711. [Google Scholar] [CrossRef]
  32. Jiang, Z.; Grosselin, B.; Daële, V.; Mellouki, A.; Mu, Y. Seasonal, diurnal and nocturnal variations of carbonyl compounds in the semi-urban environment of Orléans, France. J. Environ. Sci. 2016, 40, 84–91. [Google Scholar] [CrossRef] [PubMed]
  33. Peng, W.; Wang, Y.; Gao, X.; Jia, S.; Xu, X.; Cheng, H.; Meng, Z. Characteristics of Ambient Formaldehyde at Two Rural Sites in the North China Plain in Summer. Res. Environ. Sci. 2016, 29, 1119–1127. [Google Scholar]
  34. Shi, Y.-Z.; Wang, G.-C.; Xu, Y.-F. Simulation Study of Photochemical Smog in Beijing Urban and Suburban Areas. Clim. Environ. Res. 2008, 13, 84–92. [Google Scholar]
  35. Liu, J.; Chu, B.; He, H. Diurnal Variation of SOA Formation Potential from Ambient Air at an Urban Site in Beijing. Environ. Sci. 2018, 39, 2505–2511. [Google Scholar]
  36. Anderson, L.G.; Lanning, J.A.; Barrell, R.; Miyagishima, J.; Jones, R.H.; Wolfe, P. Sources and sinks of formaldehyde and acetaldehyde: An analysis of Denver’s ambient concentration data. Atmos. Environ. 1996, 30, 2113–2123. [Google Scholar] [CrossRef]
  37. Ho, K.F.; Lee, S.C.; Louie, P.K.; Zou, S.C. Seasonal variation of carbonyl compounds concentrations in urban area of Hong Kong. Atmos. Environ. 2002, 36, 1259–1265. [Google Scholar] [CrossRef]
  38. Yang, Z.; Cheng, H.R.; Wang, Z.W.; Peng, J.; Zhu, J.X.; Lyu, X.P.; Guo, H. Chemical characteristics of atmospheric carbonyl compounds and source identification of formaldehyde in Wuhan, Central China. Atmos. Res. 2019, 228, 95–106. [Google Scholar] [CrossRef]
  39. Liu, Y.; Shao, M.; Kuster, W.C.; Goldan, P.D.; Li, X.; Lu, S.; Gouw, J.A.D. Source identification of reactive hydrocarbons and oxygenated VOCs in the summertime in Beijing. Environ. Sci. Technol. 2009, 43, 75–81. [Google Scholar] [CrossRef] [PubMed]
  40. Biesenthal, T.A.; Shepson, P.B. Observations of anthropogenic inputs of the isoprene oxidation products methyl vinyl ketone and methacrolein to the atmosphere. Geophys. Res. Lett. 1997, 24, 1375–1378. [Google Scholar] [CrossRef]
  41. Matsumoto, K.; Kawai, S.; Igawa, M. Dominant factors controlling concentrations of aldehydes in rain, fog, dew water, and in the gas phase. Atmos. Environ. 2005, 39, 7321–7329. [Google Scholar] [CrossRef]
  42. Atkinson, R. Atmospheric chemistry of VOCs and NOx. Atmos. Environ. 2000, 34, 2063–2101. [Google Scholar] [CrossRef]
  43. Koppmann, R. (Ed.) Volatile Organic Compounds in the Atmosphere; Blackwell Publishing: Oxford, UK, 2007; p. 512. ISBN 978-1-4051-3115-5. [Google Scholar]
  44. Atkinson, R.; Arey, J. Atmospheric Degradation of Volatile Organic Compounds. Chem. Rev. 2003, 103, 4605–4638. [Google Scholar] [CrossRef]
  45. Grosjean, D. Formaldehyde and Other Carbonyls in Ambient Air. Los Angeles Environ. Sci. Technol. 1982, 16, 254–262. [Google Scholar] [CrossRef]
Figure 1. Topographic map of Linfen City.
Atmosphere 11 00685 g001
Figure 2. Locations of the two sampling sites in Linfen City.
Atmosphere 11 00685 g002
Figure 3. Diurnal variations of formaldehyde, acetaldehyde, acetone, and MACR at MC and YWT and diurnal variations of CO and PM2.5 at MC from 16 to 25 January 2019.
Atmosphere 11 00685 g003
Figure 4. Correlation between the mass concentrations of formaldehyde (a), acetaldehyde (b), acetone (c), and wind speed at MC from 16 to 25 January 2019.
Atmosphere 11 00685 g004
Figure 5. Correlation between the mass concentrations of formaldehyde (a), acetaldehyde (b), acetone (c), and wind direction at MC from 16 to 25 January 2019.
Atmosphere 11 00685 g005
Figure 6. Result of cluster analysis of backward trajectory of airflow in urban Linfen from 16 to 25 January 2019.
Atmosphere 11 00685 g006
Figure 7. The map of potential source regions for carbonyls (a) and the distribution of weighted trajectory concentrations (b) in urban Linfen from 16 to 25 January 2019.
Atmosphere 11 00685 g007
Table 1. Mean, min., and max. values and limit of detection (LOD) of atmospheric aldehyde and ketone compounds at Municipal Committee site (MC) and Yaowangtai site (YWT) from 16 to 25 January 2019.
CompoundsMC (μg/m3)YWT (μg/m3)LOD
(μg/m3)
MeanMin.Max.MeanMin.Max.
Formaldehyde4.59 ± 2.640.4410.223.66 ± 2.110.358.350.056
Acetaldehyde4.47 ± 2.220.999.224.89 ± 2.420.0010.410.083
Acrolein0.29 ± 0.230.000.910.19 ± 0.170.000.810.110
Acetone3.24 ± 1.820.007.294.83 ± 2.740.0010.870.128
Propionaldehyde0.68 ± 0.340.003.610.77 ± 0.410.001.550.137
Butenal0.38 ± 0.240.001.050.53 ± 0.400.001.740.184
Butyraldehyde1.32 ± 0.600.292.601.49 ± 0.760.273.250.214
Benzaldehyde0.39 ± 0.270.001.050.51 ± 0.370.002.580.329
Isovaleraldehyde0.02 ± 0.070.000.320.08 ± 0.170.000.790.363
Valeraldehyde0.11 ± 0.140.000.490.14 ± 0.220.000.940.353
O-methylbenzaldehyde0.01 ± 0.070.000.490.01 ± 0.080.000.730.513
M-methylbenzaldehyde0.20 ± 0.330.001.780.15 ± 0.400.002.410.512
P-methylbenzaldehyde---0.02 ± 0.140.001.260.557
Hexanal0.28 ± 0.290.001.030.14 ± 0.230.001.200.293
2,5-dimethylbenzaldehyde0.10 ± 0.220.001.190.27 ± 0.390.002.250.351
MACR0.50 ± 0.390.001.350.64 ± 0.420.001.660.2
Total16.9 ± 7.654.3033.618.3 ± 7.904.8638.5-
Table 2. Aldehyde and ketone compounds in winter in cities at home and abroad.
CityTypeFormaldehydeAcetaldehydeAcetoneSampling TimeReference
(μg/m3)
Linfenurban4.144.824.002019/01Present study
Beijingurban7.110.39.52007/01[6]
urban4.012.962.012011/01[7]
urban5.514.074.222014/01[8]
Foshanurban8.555.88.292014/12[27]
Zhengzhouurban8.237.6713.92012/01[28]
Xi’anurban3.32.897.372015–2016 winter[29]
We Rome, Italysemi-rural area1.360.924.572006/12[30]
Fortaleza, Brazilurban12.422.952.482004/11–12[31]
Orleans, Francesemi-urban area1.460.671.062011/01[32]
Table 3. Correlation coefficients (r) among the mass concentrations of formaldehyde, acetaldehyde, acetone, and CO, temperature at MC from 16 to 25 January 2019.
FormaldehydeAcetaldehydeAcetone
CO0.440.820.77
Temperature0.580.320.17

