Heatwaves in the Future Warmer Climate of South Africa
Abstract
:1. Introduction
2. Data and Methods
3. Results
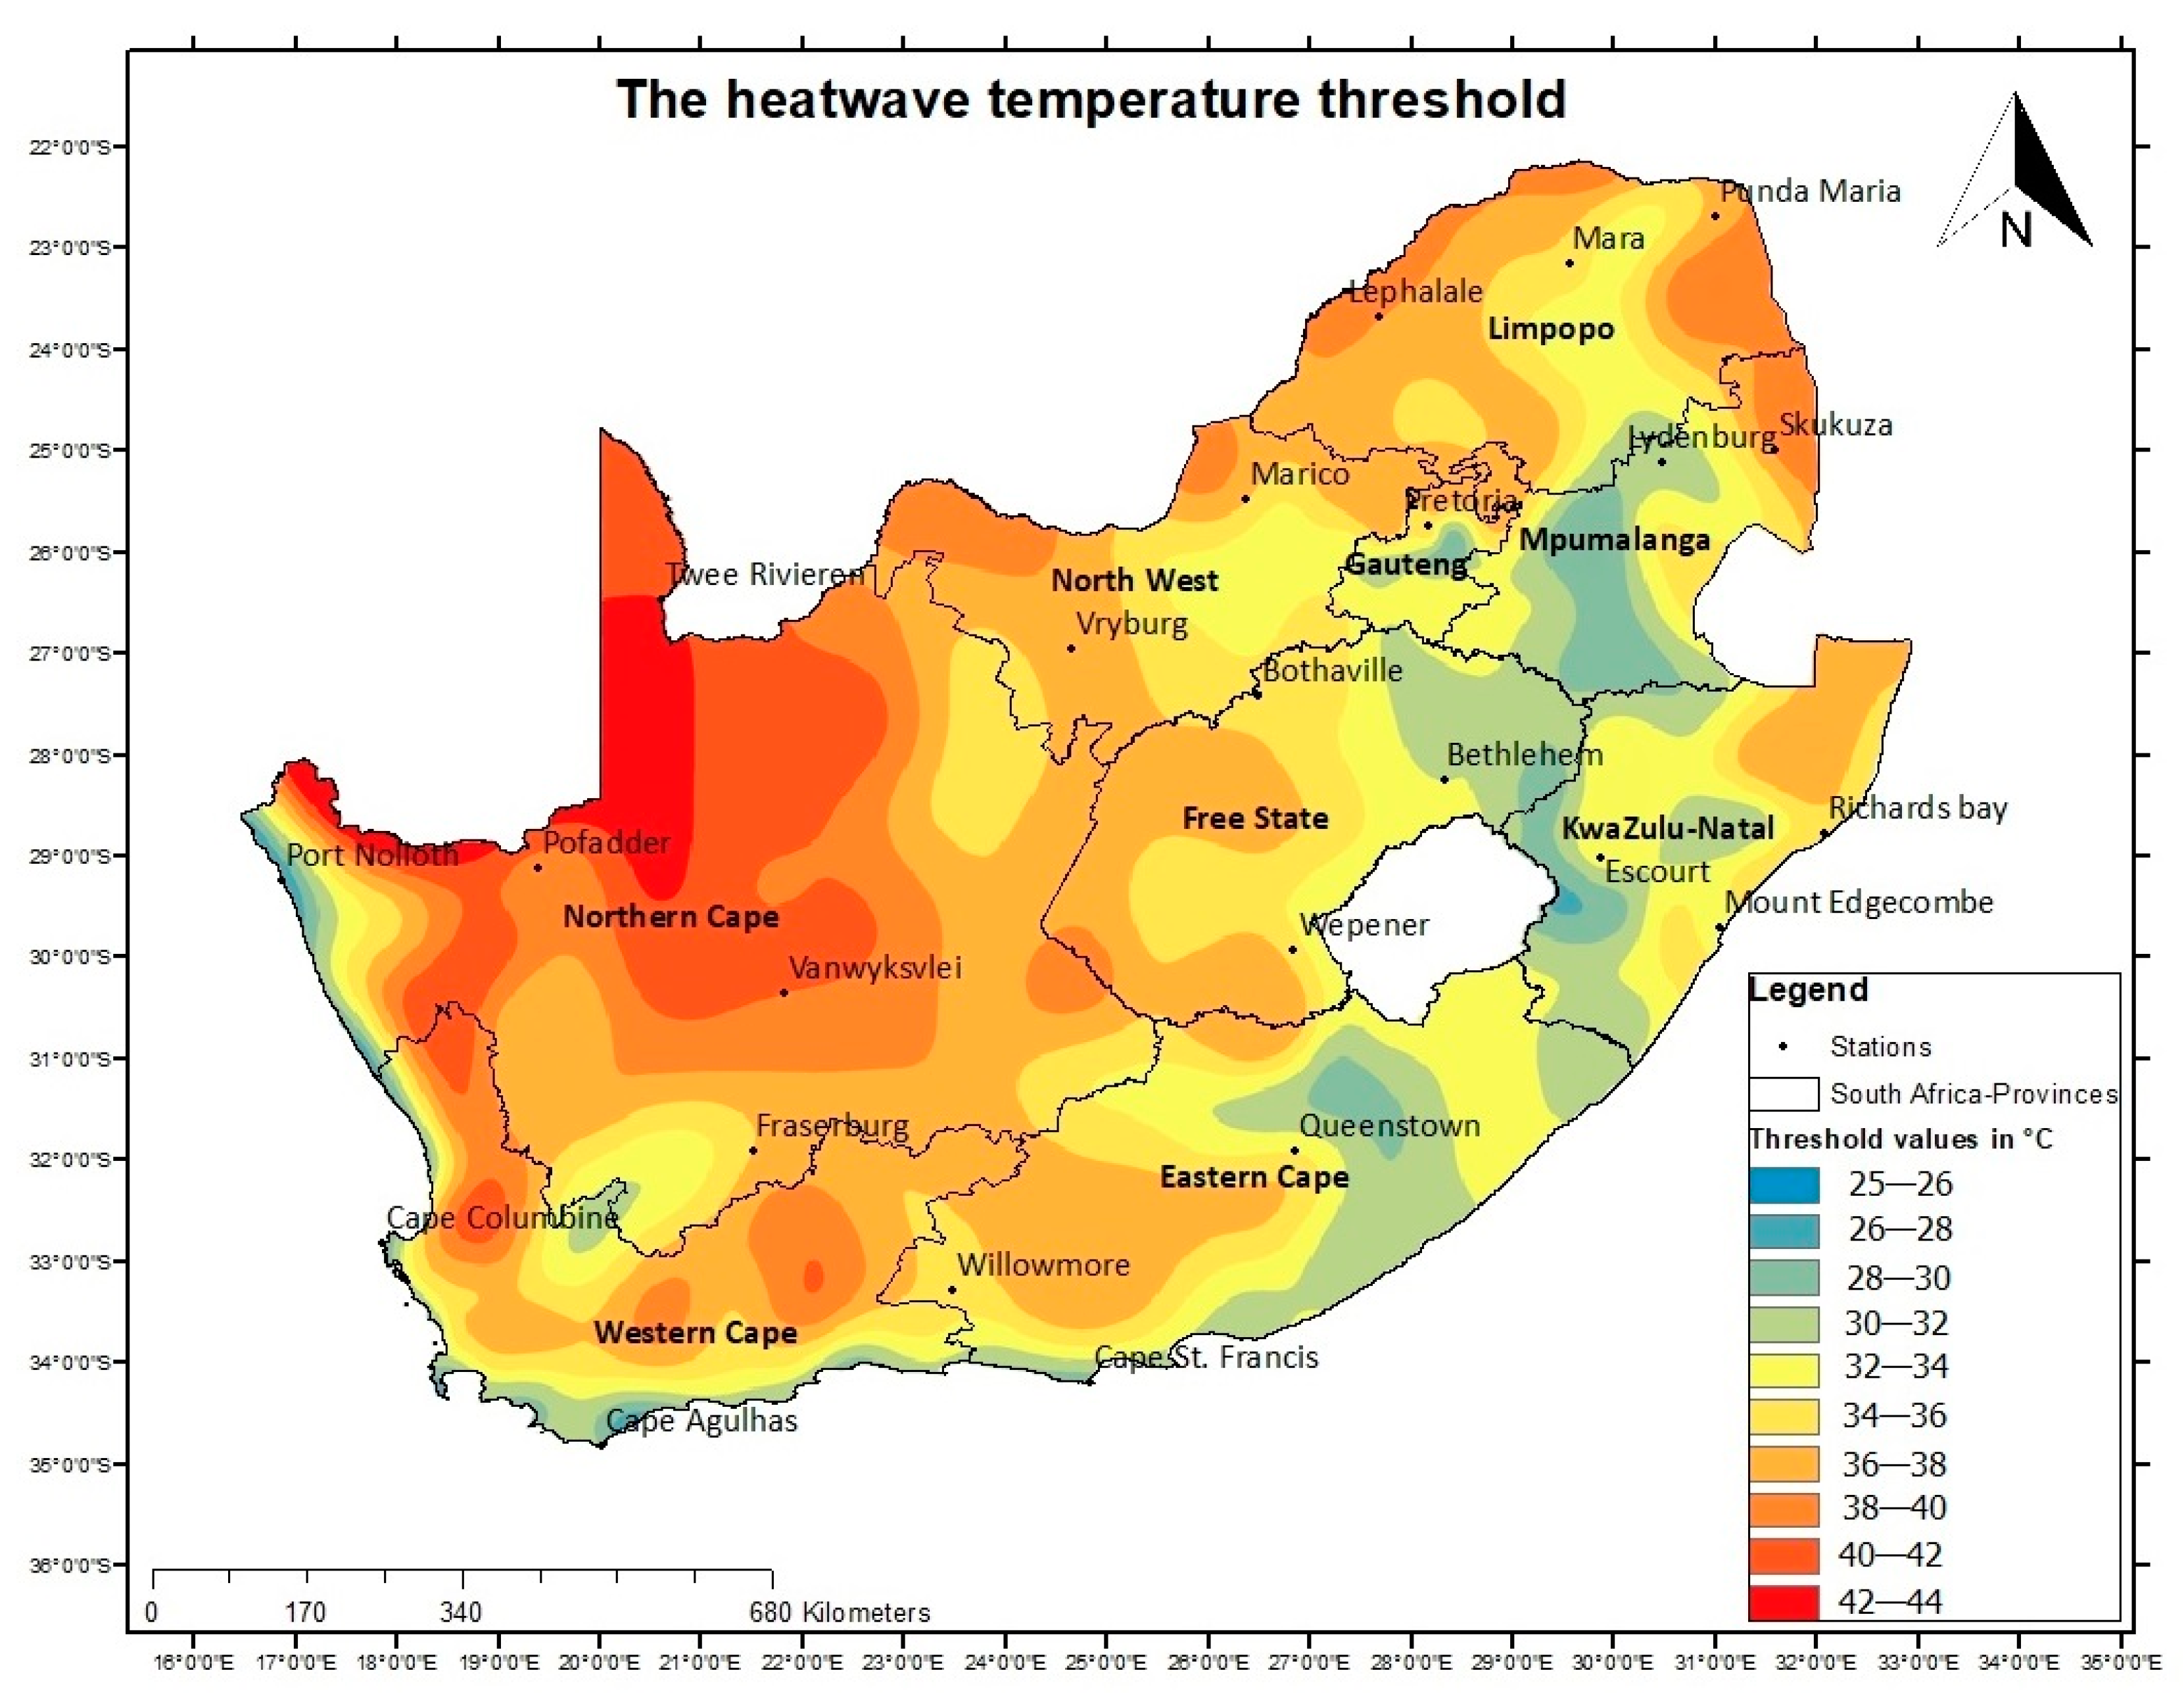
3.1. Osberved vs. Simulated Average Daily Maximum Temperature (TX) and HW Thresholds
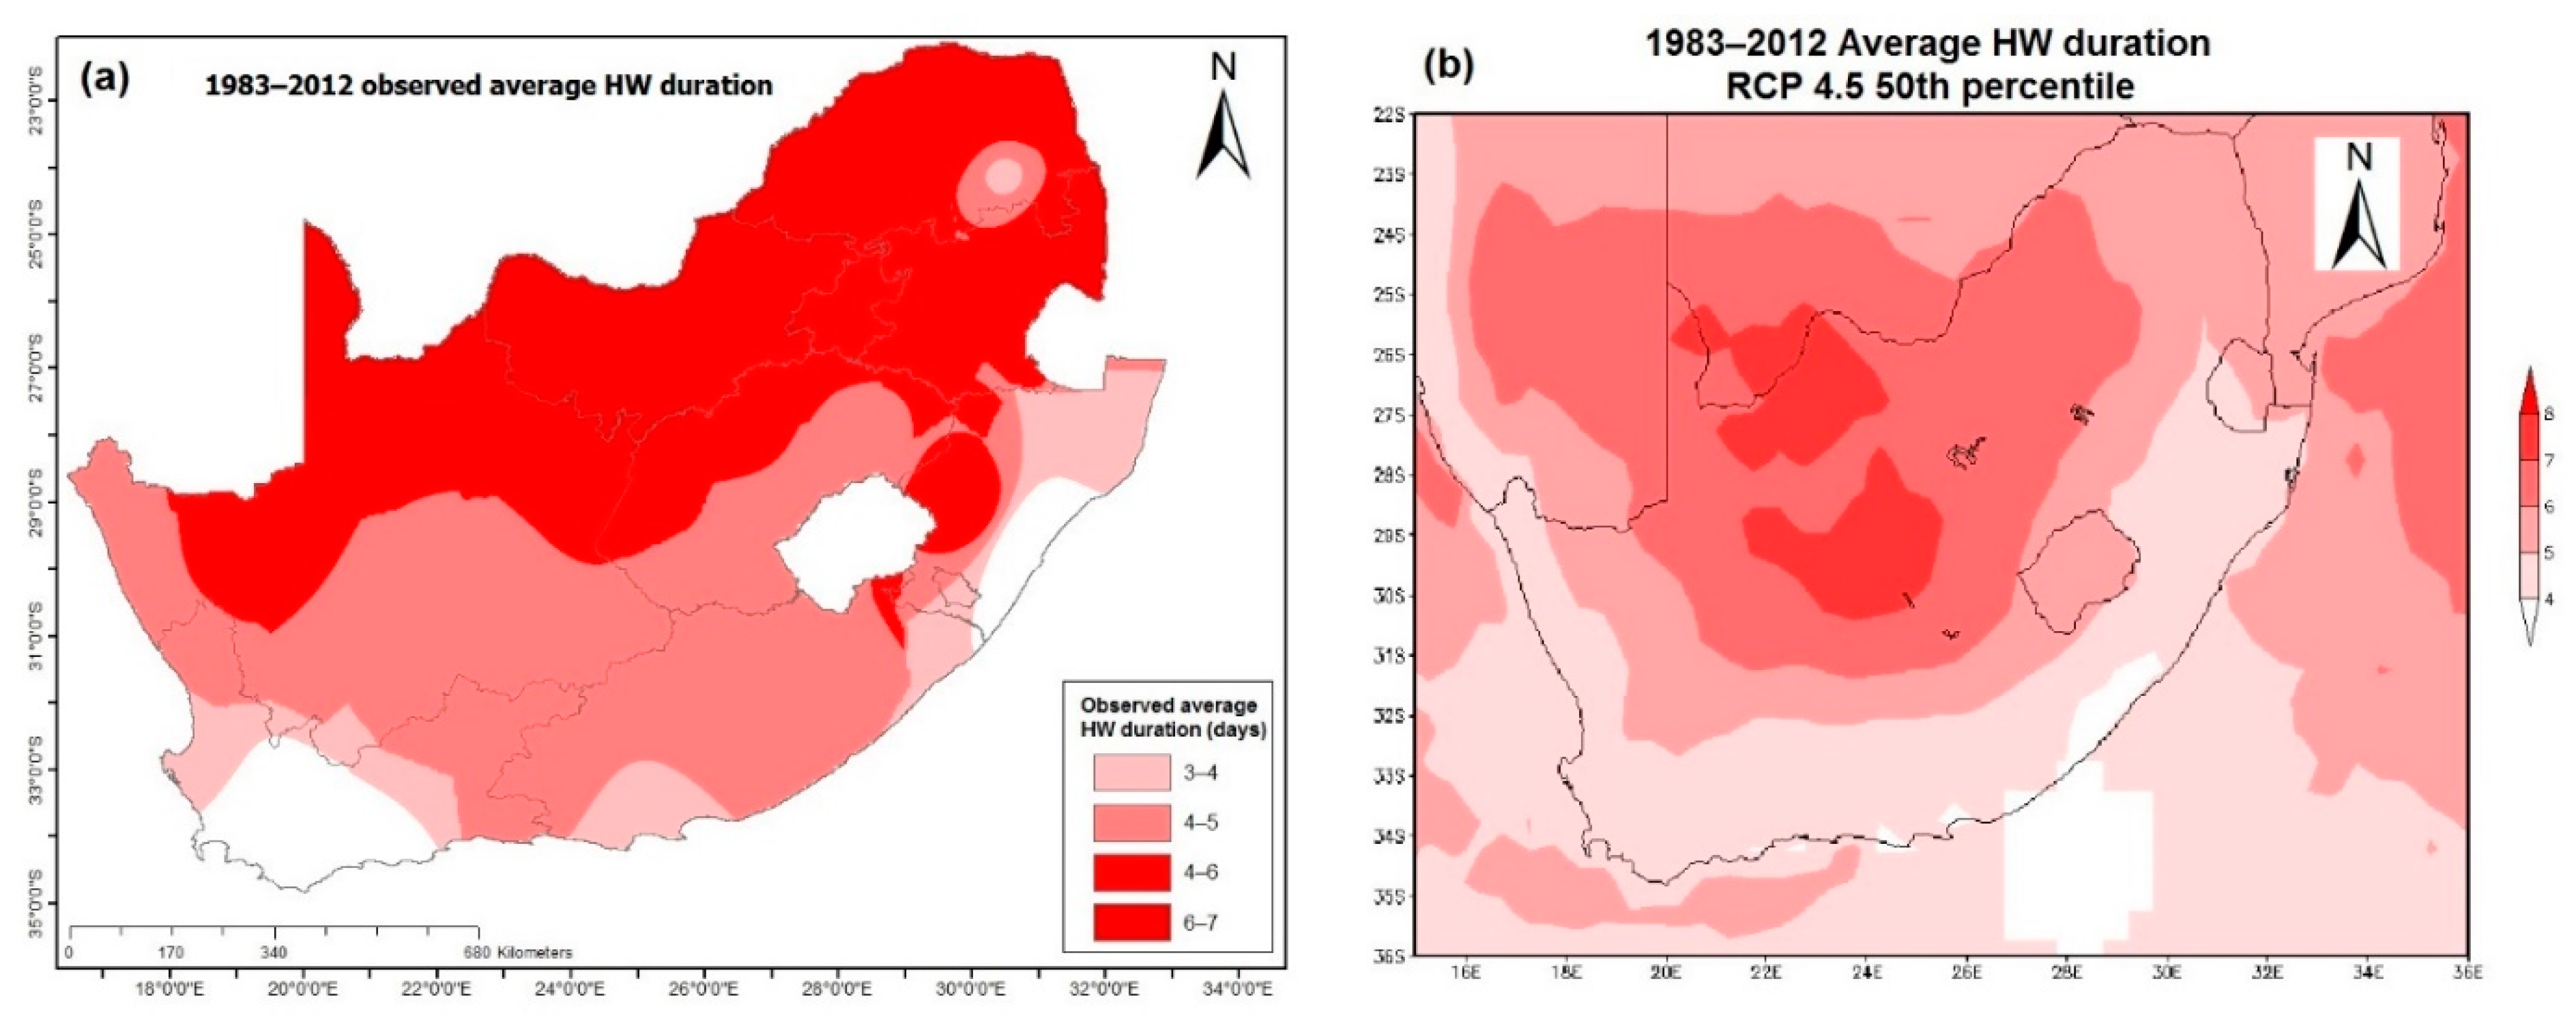
3.2. Observed vs. Simulated HWs
3.3. HWs in Future Climates
3.3.1. Period 2010 to 2039
3.3.2. Period 2040 to 2069
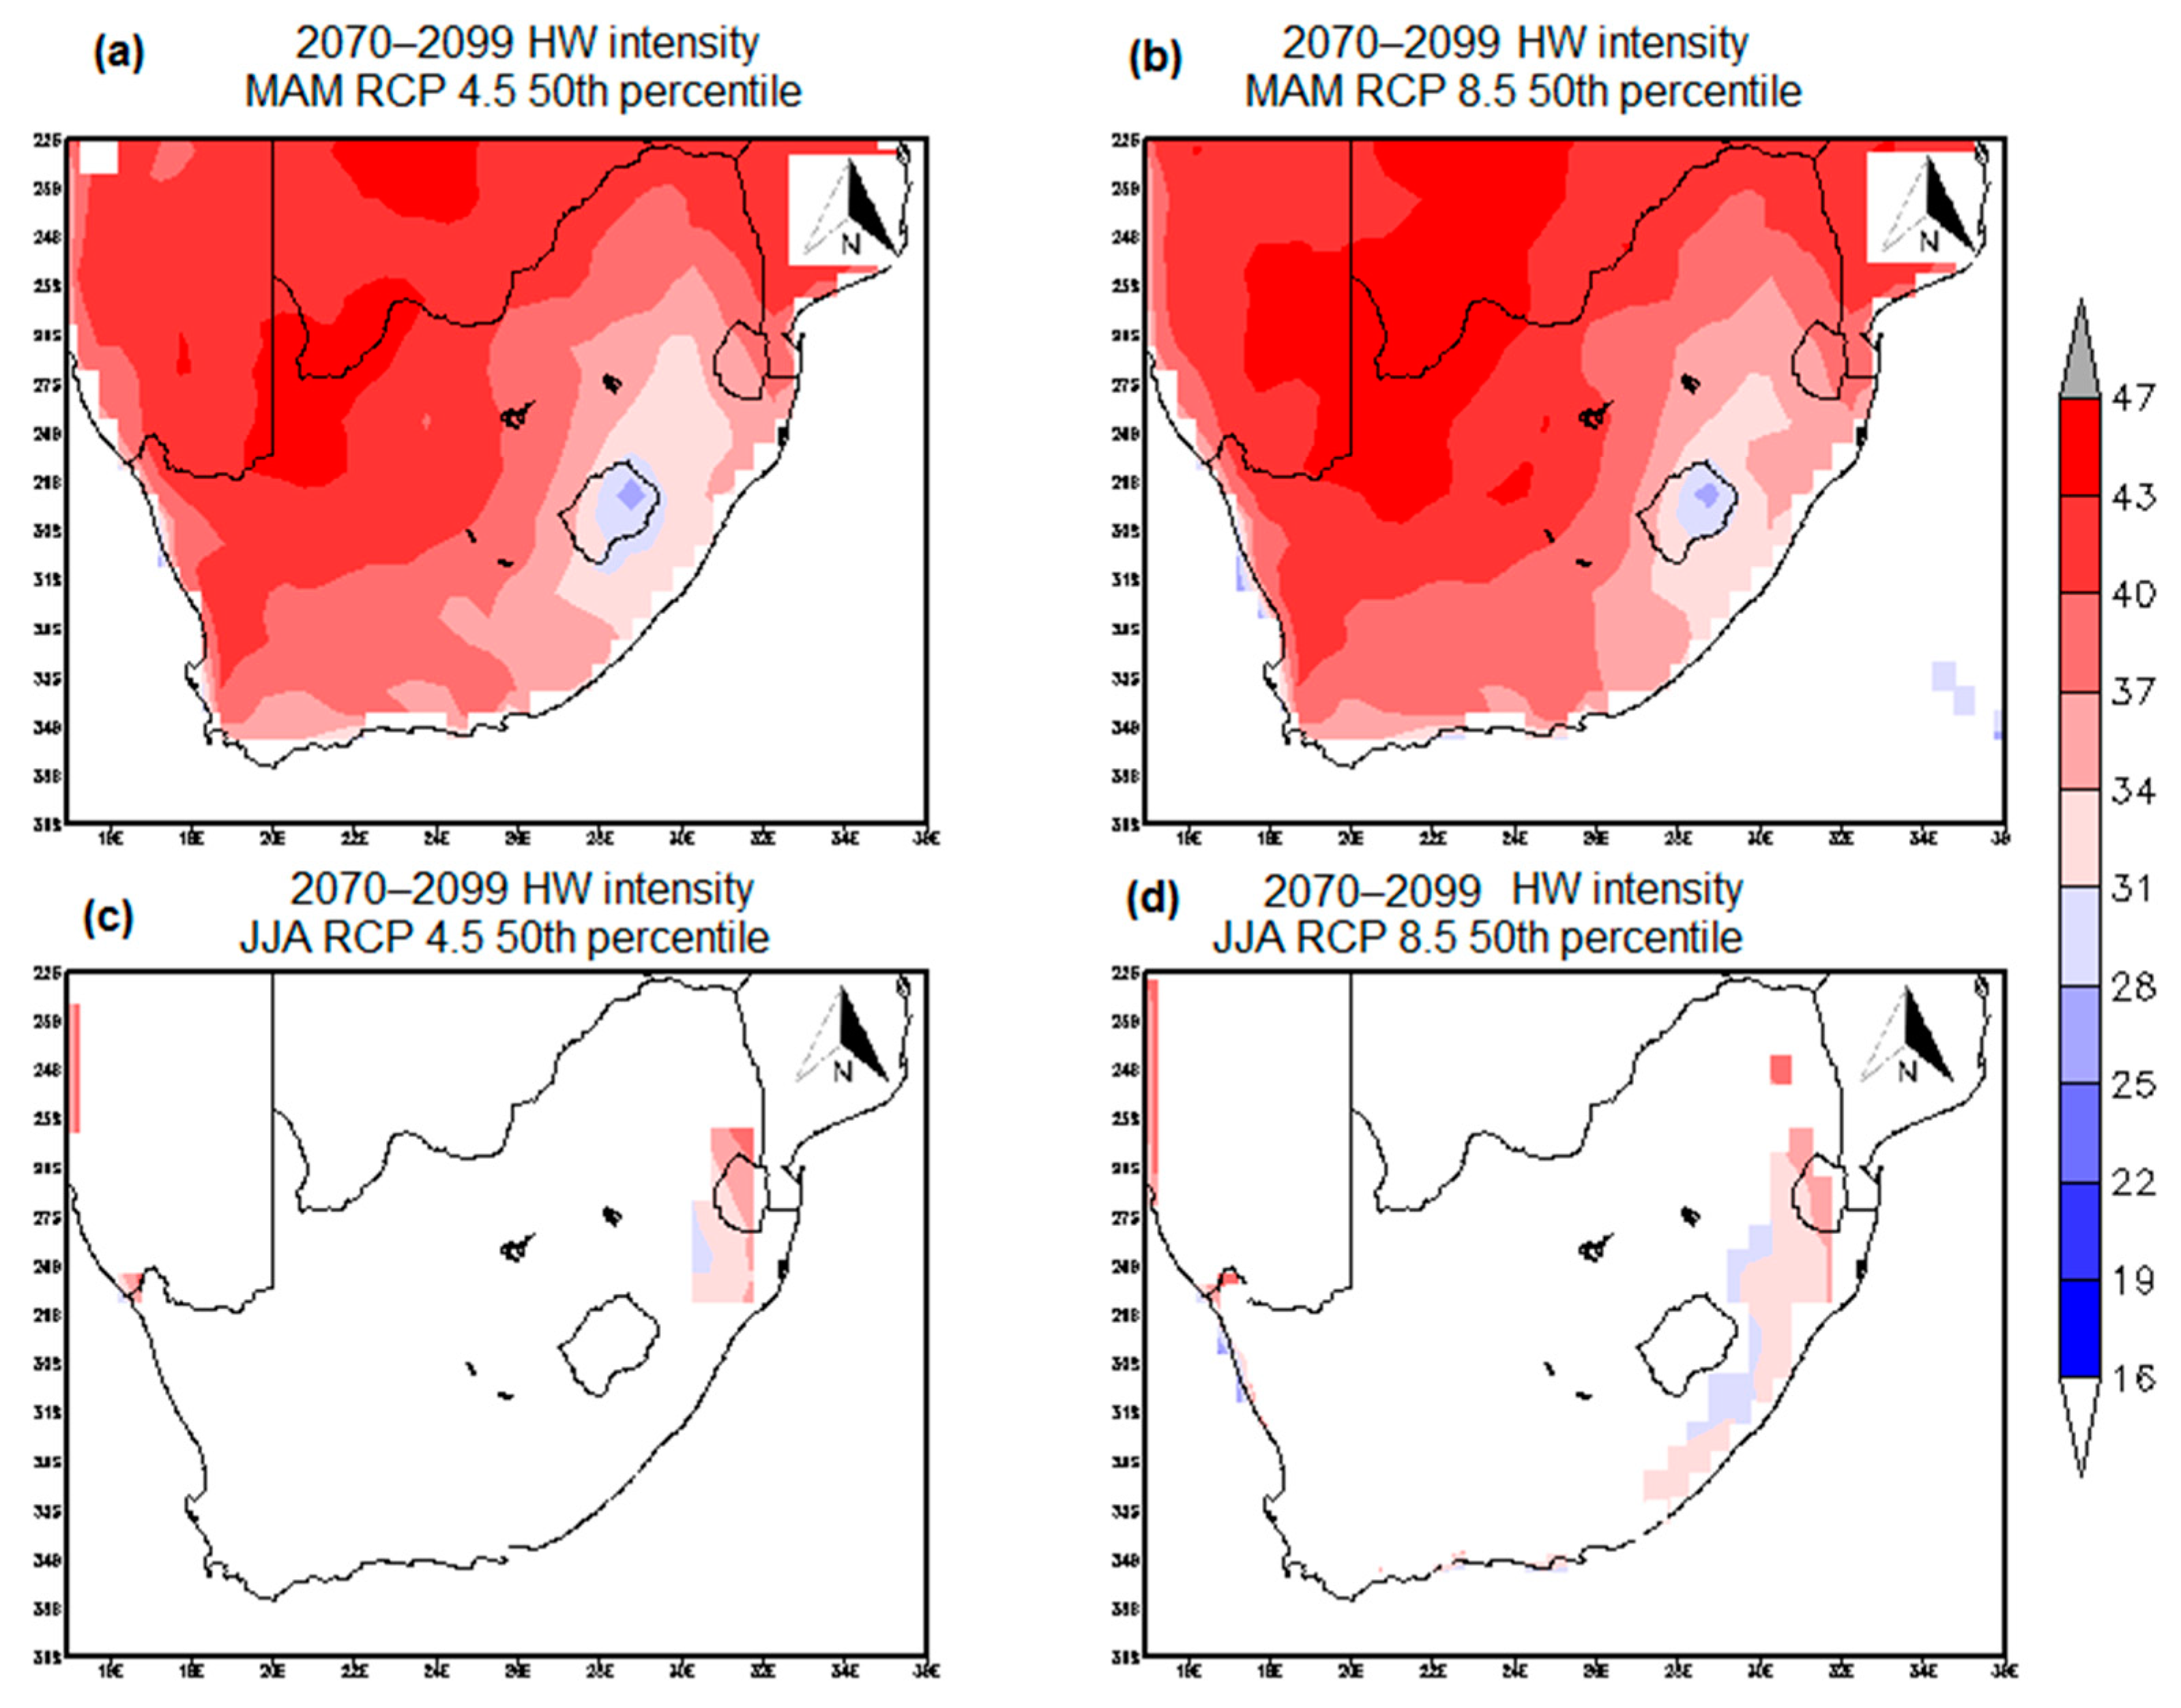
3.3.3. Period 2070 to 2099
4. Summary and Conclusions
Author Contributions
Funding
Acknowledgments
Conflicts of Interest
References
- Hawkins, E.; Ortega, P.; Suckling, E.; Schurer, A.; Hegerl, G.C.; Jones, P.D.; Joshi, M.; Osborn, T.J.; Masson-Delmotte, V.; Mignot, J.; et al. Estimating changes in global temperature since the pre-industrial period. Bull. Am. Meteorol. Soc. 2017, 98, 1841–1856. [Google Scholar] [CrossRef]
- Masson-Delmotte, V.; Zhai, P.; Pörtner, H.O.; Roberts, D.; Skea, J.; Shukla, P.; Pirani, A.; Moufouma-Okia, W.; Péan, C.; Pidcock, R.; et al. Global Warming of 1.5 °C. 2018. An IPCC Special Report on the Impacts of Global Warming of 1.5 °C Above Pre-Industrial Levels and Related Global Greenhouse Gas Emission Pathways, in The Context of Strengthening the Global Response to the Threat of Climate Change, Sustainable Development, and Efforts to Eradicate Poverty. Available online: https://www.ipcc.ch/sr15/ (accessed on 9 March 2020).
- Kruger, A.C.; Shongwe, M. Temperature trends in South Africa: 1960–2003. Int. J. Climatol. 2004, 24, 1929–1945. [Google Scholar] [CrossRef]
- MacKellar, N.; New, M.; Jack, C. Observed and modelled trends for rain and temperature for South Africa: 1960–2010. S. A. J. Sci. 2014, 110. [Google Scholar] [CrossRef] [Green Version]
- Engelbrecht, F.A.; Adegoke, J.; Bopape, M.J.; Naidoo, M.; Garland, R.M.; Thatcher, M.; McGregor, J.; Katzfey, J.; Werner, M.; Ichoku, C.; et al. Projections of rapidly rising surface temperatures over Africa under low mitigation. Environ. Res. Lett. 2015, 10. [Google Scholar] [CrossRef]
- Kruger, A.C.; Nxumalo, M.P. Historical rainfall trends in South Africa: 2021–2015. Water SA 2017, 2, 285–297. [Google Scholar] [CrossRef] [Green Version]
- Burls, N.J.; Blamey, R.C.; Cash, B.A.; Swenson, E.T.; Fahad, A.A.; Bopape, M.-J.; Straus, D.M.; Reason, C. The Cape Town “Day Zero” drought and Hadley cell expansion. NPJ Clim. Atmos. Sci. 2019, 2, 27. [Google Scholar] [CrossRef] [Green Version]
- Kruger, A.C.; Sekele, S.S. Trends in extreme temperature indices in South Africa: 1962–2009. Int. J. Climatol. 2013, 33, 661–676. [Google Scholar] [CrossRef]
- Zacharias, S.; Koppe, C.; Mücke, H.G. Climate change effects on HWs and future HW-associated IHD mortality in Germany. Climate 2015, 3, 100–117. [Google Scholar] [CrossRef] [Green Version]
- Min, S.-K.; Zhang, X.; Zwiers, F.W.; Hegerl, G.C. Human contribution to more-intense precipitation extremes. Nature 2001, 470, 378–381. [Google Scholar] [CrossRef]
- Coumou, D.; Rahmstorf, S. A decade of weather extremes. Nat. Clim. Chang. 2012, 2, 491–496. [Google Scholar] [CrossRef]
- Hunt, B.G. A climatology of HWs from a multi-millenial simulation. J. Clim. 2007, 20, 3802–3821. [Google Scholar] [CrossRef]
- Beniston, M. The 2003 HW in Europe: A shape of things to come? An analysis based on Swiss climatological data and model simulations. Geophys. Res. Lett. 2004, 31, L02202. [Google Scholar]
- Cassou, L.; Terray, L.; Phillips, A. Tropical Atlantic influence on European HWs. J. Clim. 2005, 18, 2805–2811. [Google Scholar] [CrossRef]
- Perkins, S.E.; Pitman, A.J.; Sisson, S.A. Systematic differences in 20-year temperature extremes in AR4 model projections over Australia as a function of model skill. Int. J. Climatol. 2013, 33, 1153–1167. [Google Scholar] [CrossRef] [Green Version]
- Nairn, J.; Fawcett, R. Defining HWs: HW Defined as a Heat Impact Event Servicing all Community and Business Sectors in Australia; CAWCR Technical Report No. 060; Bureau of Meteorology: Melbourne, Australia, 2013.
- Boschat, G.; Pezza, A.B.; Simmonds, I.; Perkins, S.E.; Cowan, T.; Purich, A. Large scale and sub-regional connections in the lead up to summer HW and extreme rainfall events in eastern Australia. Clim. Dyn. 2014, 44. [Google Scholar] [CrossRef]
- Vandentorren, S.; Bretin, P.; Zeghnoun, A.; Mandereau-Bruno, L.; Croisier, C.; Riberon, J.; Declercg, B.; Ledrans, M. August 2003 HW in France: Risk factors for death of elderly people living at home. Eur. J. Public Health 2006, 19, 583–591. [Google Scholar] [CrossRef] [Green Version]
- Larsen, J. Record HW in Europe Takes 35,000 Lives; Earth Policy Institute: Washington, DC, USA, 2003. [Google Scholar]
- Fischer, E.M. The Role of Land–Atmosphere Interactions for European Summer HWs: Past, Present and Future. Ph.D. Thesis, University of Bern, Bern, Switzerland, 2007. [Google Scholar]
- Waggoner, P.E. Agriculture and a climate changed by more carbon dioxide. In National Research Council, Changing Climate. Rep. of the Carbon Dioxide Committee, Board of Atmospheric Sciences and Climate; National Academy Press: Washington, DC, USA, 1983; pp. 383–418. [Google Scholar]
- Maller, C.J.; Strengers, Y. Housing, heat stress and health in a changing climate: Promoting the adaptive capacity of vulnerable households, a suggested way forward. Health Promot. Int. 2001, 26, 492–498. [Google Scholar] [CrossRef] [Green Version]
- Kunkel, K.E.; Changnon, S.A.; Reinke, B.C.; Arritt, R.W. The July 1995 HW in the Midwest: A climatic perspective and critical weather factors. Bull. Am. Meteorol. Soc. 1996, 77, 1507–1518. [Google Scholar] [CrossRef] [Green Version]
- Karl, T.R.; Knight, R.W. The 1995 Chicago HW: How likely a recurrence? Bull. Am. Meteorol. Soc. 1997, 78, 1107–1119. [Google Scholar] [CrossRef] [Green Version]
- Fink, A.H.; Brucher, T.; Kruger, A.; Lackebusch, G.C.; Pinto, J.G.; Ulbrich, U. The 2003 European summer HWs and drought—Synoptic diagnosis and impacts. Weather 2004, 59, 209–216. [Google Scholar] [CrossRef] [Green Version]
- Dosio, A.; Panitz, H.-J. Climate change projections for CORDEX-Africa with COSMO-CLM regional climate model and differences with the driving global climate models. Clim. Dyn. 2016, 46, 1599–1625. [Google Scholar] [CrossRef] [Green Version]
- Russo, S.; Dosio, A.; Graversen, R.G.; Sillmann, J.; Carrao, H.; Dunbar, M.B.; Singleton, A.; Montagna, P.; Barbosa, P.; Vogt, J.V. Magnitude of extreme heat waves in present climate and their projection in a warming world. J. Geophys. Res. D Atmos. 2014, 199, 500–512. [Google Scholar] [CrossRef] [Green Version]
- Godsmark, C.N.; Irlam, J.; van der Merwe, F.; New, M.; Rother, H.-A. Priority focus areas for a sub-national response to climate change and health: A South African provincial case study. Environ. Int. 2008, 128, 177–184. [Google Scholar] [CrossRef]
- Garland, R.; Matoaane, M.; Engelbrecht, E.; Bopape, M.M.; Landman, W.A.; Naidoo, M.; van der Merwe, J.; Wright, C.Y. Regional projections of extreme apparent temperature days in Africa and the related potential risk to human health. Int. J. Environ. Res. Public Health 2015, 12, 12577–12604. [Google Scholar] [CrossRef]
- McGregor, J.L. C-CAM: Geometric Aspects and Dynamical Formulation. CSIRO Atmospheric Research Tech. Paper No. 70; CSIRO: Victoria, Australia, 2005; p. 43.
- McGregor, J.L.; Dix, M.R. An updated description of the conformal cubic atmospheric model. In High-Resolution Simulation of the Atmosphere and Ocean; Hamilton, K., Ohfuchi, W., Eds.; Springer: Berlin, Germany, 2008; pp. 51–76. [Google Scholar]
- Engelbrecht, F.A.; Landman, W.A.; Engelbrecht, C.J.; Landman, S.; Roux, B.; Bopape, M.J.; Roux, B.; McGregor, J.L. Multi-scale climate modelling over southern Africa using a variable-resolution global model. Water SA 2011, 37, 647–658. [Google Scholar] [CrossRef] [Green Version]
- Fischer, E.M.; Schär, C. Consistent geographical patterns of changes in high-impact European HWs. Nat. Geosci. 2010, 3, 398–403. [Google Scholar] [CrossRef]
- Engelbrecht, F.A.; McGregor, J.L.; Engelbrecht, C. Dynamics of the Conformal-Cubic Atmospheric Model projected climate change signal over southern Africa. Int. J. Climatol. 2009, 29, 1013–1033. [Google Scholar] [CrossRef]
- Rotstayn, L.D. A physically based scheme for the treatment of stratiform clouds and precipitation in large-scale models. I: Description and evaluation of the microphysical processes. Quart. J. R. Meteorol. Soc. 1997, 123, 1227–1282. [Google Scholar]
- McGregor, J.L. A new convection scheme using a simple closure. Curr. Issues Parameter. Convect. 2003, 93, 33–36. [Google Scholar]
- McGregor, J.L.; Gordon, H.B.; Watterson, I.G.; Dix, M.R.; Rotstayn, L.D. The CSIRO 9-level Atmospheric General Circulation Model. CSIRO Div. Atmospheric Research Tech; CSIRO: Victoria, Australia, 1993; p. 89.
- Holtslag, A.A.M.; Boville, B.A. Local versus nonlocal boundary-layer diffusion in a global climate model. J. Clim. 1993, 6, 1825–1842. [Google Scholar] [CrossRef] [Green Version]
- IPCC: Climate Change. Synthesis Report. Contribution of Working Groups I, II and III to the Fifth Assessment Report of the Intergovernmental Panel on Climate Change; Core Writing Team; Pachauri, P.K.; Meyer, L.A. (Eds.) IPCC: Geneva, Switzerland, 2014; p. 151. [Google Scholar]
- Meehl, G.A.; Tebaldi, C. More intense, more frequent, and longer-lasting HWs in the 21st century. Science 2004, 305, 994–997. [Google Scholar] [CrossRef] [PubMed] [Green Version]
- Zhang, X.; Yang, F. RClimDex (1.0), User Manual, Climate Research Branch, Environment Canada, Downsview, Ontario, Canada. 2004. Available online: http://cccma.seos.uvic.ca/ETCCDMI (accessed on 5 November 2015).
- CCDI/CRD Climate Change Indices. Available online: http://etccdi.pacificclimate.org/software.shtml (accessed on 28 April 2020).
- Dix, M.; Vohralik, P.; Bi, D.; Rashid, H.; Marsland, S.; O’Farrell, S.; Uotila, P.; Hirst, T.; Kowalczyk, E.; Sullivan, A.; et al. The ACCESS couple model: Documentation of core CMIP5 simulations and initial results. Aust. Meteorol. Oceanogr. J. 2013, 63, 83–99. [Google Scholar] [CrossRef]
- Gent, P.R.; Danabasoglu, G.; Donner, L.J.; Holland, M.M.; Hunke, E.C.; Jayne, S.R.; Lawrence, D.M.; Neale, R.B.; Rasch, P.J.; Vertenstein, M.; et al. The community climate system model version 4. J. Clim. 2011, 24, 4973–4991. [Google Scholar] [CrossRef]
- Griffies, S.M.; Winton, M.; Donner, L.J.; Horowitz, L.W.; Downes, S.M.; Farneti, R.; Gnanadesikan, A.; Hurlin, W.J.; Lee, H.-C.; Liang, Z.; et al. GFDL’s CM3 coupled climate model: Characteristics of the ocean and sea ice simulations. J. Clim. 2011, 24, 3520–3544. [Google Scholar] [CrossRef]
- Giorgetta, M.A.; Jungclaus, J.; Reick, C.H.; Legutke, S.; Bader, J.; Bottinger, M.; Brovkin, V.; Crueger, C.; Esch, M.; Fieg, K.; et al. Climate and carbon cycle changes from 1850 to 2100 in MPI-ESM simulations for the Coupled Model Intercomparison Project phase 5. J. Adv. Model. Earth Syst. 2013, 5, 572–597. [Google Scholar] [CrossRef]
- Bentsen, M.; Bethke, I.; Debernard, J.B.; Iversen, T.; Kirkevåg, A.; Seland, Ø.; Drange, H.; Roelandt, C.; Seierstad, I.A.; Hoose, C.; et al. The Norwegian Earth System Model, NorESM1-M—Part 1: Description and basic evaluation of the physical climate. Geosci. Model. Dev. 2013, 6, 687–720. [Google Scholar] [CrossRef] [Green Version]
- Salas-Mélia, D.F.; Chauvin, M.; Déqué, H.; Douville, H.; Gueremy, J.-F.; Marquet, P.; Planton, S.; Royer, J.F.; Tyteca, S. Description and validation of the CNRM-CM3 global coupled model. Clim. Dyn. 2005, 103. [Google Scholar]
- Fischer, E.M.; Schär, C. Future changes in daily summer temperature variability: Driving processes and role for temperature extremes. Clim. Dyn. 2009, 33, 917–935. [Google Scholar] [CrossRef]
- IPCC. Climate Change. The Scientific Basis. Contribution of Working Group I to the Third Assessment Report of the Intergovernmental Panel on Climate Change; Cambridge University Press: Cambridge, UK; New York, NY, USA, 2001. [Google Scholar]
- Russo, S.; Marchese, A.F.; Sillmann, J.; Immé, G. When will unusual heat waves become normal in a warming Africa? Environ. Res. Lett. 2016, 11, 054016. [Google Scholar] [CrossRef]
- Perkins-Kirkpatrick, S.E.; Gibson, P.B. Changes in regional heatwave characteristics as a function of increasing global temperature. Sci. Rep. 2017, 7, 12256. [Google Scholar] [CrossRef]


| Model | RCP 4.5 | RCP 8.5 |
|---|---|---|
| ACCESS 1-0 (BoM-CSIRO, Australia) [43] | ✔ | ✔ |
| CCSM4 (NCAR, USA) [44] | ✔ | ✔ |
| CNRM-CM5 (CNRM-CERFACS, France) [45] | ✔ | ✔ |
| GFDL-CM3 (NOAA, USA) [46] | ✔ | ✔ |
| MPI-ESM-LR (MPI, Germany) [47] | ✔ | ✔ |
| NorESM1M-M (NCC, Norway) [48] | ✔ | ✔ |
| Index | Description | Units |
|---|---|---|
| Tx | Daily maximum temperature | °C |
| Tn | Daily minimum temperature | °C |
| Tn10P | Annual number of days when Tn < 10th percentile | days |
| Tn90P | Annual number of days when Tn > 90th percentile | days |
| Tx10P | Annual number of days when Tx < 10th percentile | days |
| Tx90P | Annual number of days when Tx > 90th percentile | days |
| DTR | Annual diurnal temperature range | °C |
| Station Name | Tn10P (Days) | Tn90P (Days) | Tx10P (Days) | Tx90P (Days) | DTR (°C) | Total Number of HW Occurrences |
|---|---|---|---|---|---|---|
| Bethlehem | −0.063 * | 0.092 * | −0.057 * | 0.151 * | 0.007 | 9 |
| Bothaville | −0.324 * | 0.077 | −0.034 | 0.275 * | 0.045 * | 27 |
| Cape Agulhas | −0.199 * | 0.392 * | −0.199 * | 0.392 * | 0.01 | 0 |
| Cape Columbine | −0.211 * | 0.158 * | −0.046 * | 0.141 * | 0.001 | 15 |
| Cape St. Francis | −0.067 * | 0.165 * | −0.184 * | −0.107 * | 0.031 * | 6 |
| Escourt | −0.127 * | 0.108 * | −0.012 | 0.213 | 0.032 * | 18 |
| Fraserburg | −0.06 | 0.19 * | −0.04 | 0.244 | 0.003 | 6 |
| Lephalale | −0.354 | 0.453 * | −0.155 | 0.834 * | 0.052 * | 27 |
| Lydenburg | −0.163 * | 0.052 | −0.092 * | 0.336 * | 0.014 | 3 |
| Mara | −0.322 * | 0.027 * | −0.042 | 0.356 * | 0.038 * | 33 |
| Marico | −0.186 * | 0.113 | 0.148 * | 0.027 | 0.006 | 36 |
| Mount Edgecombe | −0.326 * | 0.206 * | −0.019 | 0.176 * | 0.008 | 0 |
| Pofadder | −0.063 | 0.151 * | −0.012 | 0.186 | −0.006 | 6 |
| Port Nolloth | −0.116 * | 0.018 * | −0.063 * | 0.218 * | 0.035 * | 71 |
| Pretoria | −0.314 * | 0.049 | −0.023 | 0.028 | −0.005 | 6 |
| Punda Maria | −0.438 * | 0.116 * | −0.038 * | 0.137 * | 0.034 * | 45 |
| Queenstown | −0.329 * | 0.208 * | −0.174 * | 0.051 | 0.001 | 24 |
| Richards bay | −0.339 * | 0.283 * | −0.143 * | 0.515 * | 0.069 * | 6 |
| Skukuza | −0.283 * | 0.109 | −0.114 * | 0.2 | 0.036 * | 21 |
| Twee Rivieren | −0.262 * | 0.065 * | −0.122 * | 0.832 * | 0.111 * | 12 |
| Vanwyksvlei | −0.118 * | 0.062 | −0.076 * | 0.091 | 0.018 * | 6 |
| Vryburg | −0.298 * | 0.123 * | 0.057 * | 0.166 * | 0.039 * | 21 |
| Wepener | −0.035 * | 0.173 * | −0.18 | 0.1 * | −0.037 * | 6 |
| Willowmore | −0.117 * | 0.305 * | −0.165 * | 0.183 * | 0.024 * | 24 |
© 2020 by the authors. Licensee MDPI, Basel, Switzerland. This article is an open access article distributed under the terms and conditions of the Creative Commons Attribution (CC BY) license (http://creativecommons.org/licenses/by/4.0/).
Share and Cite
Mbokodo, I.; Bopape, M.-J.; Chikoore, H.; Engelbrecht, F.; Nethengwe, N. Heatwaves in the Future Warmer Climate of South Africa. Atmosphere 2020, 11, 712. https://doi.org/10.3390/atmos11070712
Mbokodo I, Bopape M-J, Chikoore H, Engelbrecht F, Nethengwe N. Heatwaves in the Future Warmer Climate of South Africa. Atmosphere. 2020; 11(7):712. https://doi.org/10.3390/atmos11070712
Chicago/Turabian StyleMbokodo, Innocent, Mary-Jane Bopape, Hector Chikoore, Francois Engelbrecht, and Nthaduleni Nethengwe. 2020. "Heatwaves in the Future Warmer Climate of South Africa" Atmosphere 11, no. 7: 712. https://doi.org/10.3390/atmos11070712
APA StyleMbokodo, I., Bopape, M.-J., Chikoore, H., Engelbrecht, F., & Nethengwe, N. (2020). Heatwaves in the Future Warmer Climate of South Africa. Atmosphere, 11(7), 712. https://doi.org/10.3390/atmos11070712


