Article

UV-Index Climatology for Europe Based on Satellite Data

by
Ronja Vitt
1,2,†,
Gudrun Laschewski
1,*,†,
Alkiviadis F. Bais
3,
Henri Diémoz
4,5,
Ilias Fountoulakis
4,
Anna-Maria Siani
6 and
Andreas Matzarakis
1,†
1
Research Centre Human Biometeorology, Deutscher Wetterdienst, 79104 Freiburg, Germany
2
Chair of Environmental Meteorology, Albert-Ludwigs-University Freiburg, 79085 Freiburg, Germany
3
Laboratory of Atmospheric Physics, Aristotle University of Thessaloniki, 54124 Thessaloniki, Greece
4
Aosta Valley Regional Environmental Protection Agency (ARPA), 11020 Saint-Christophe, Italy
5
Institute of Atmospheric Sciences and Climate, National Research Council, 00185 Rome, Italy
6
Physics Department, Sapienza University of Rome, 00185 Rome, Italy
*
Author to whom correspondence should be addressed.
Current address: Stefan-Meier-Str. 4, D-79104 Freiburg, Germany.
Atmosphere 2020, 11(7), 727; https://doi.org/10.3390/atmos11070727
Submission received: 15 June 2020 / Revised: 3 July 2020 / Accepted: 6 July 2020 / Published: 8 July 2020
(This article belongs to the Special Issue Challenges in Applied Human Biometeorology)

Abstract

:
The UV-Index (UVI) is aimed at the prevention of skin cancer as well as other negative implications of ultraviolet radiation exposure. In order to support health related applications, assessments and planning that rely on long term data in high spatial resolution and as there exist only limited ground-based measurements, satellite products from reliable atmospheric monitoring services are used as sustainable data sources to create a climatology of the UVI at the local noon. In this study, the (all-sky) UVI as well as the hypothetically clear-sky UVI were analysed for the European region from 30° North to 65° North and from 25° West to 35° East in a spatial resolution of 0.05° for the time period 1983 to 2015. Maps of the monthly mean UVI provide an overview of the distribution of UVI for Europe as well as the spatial and temporal differences and regional variability at local solar noon. Additionally, eight selected locations provide insight into the effects of latitude and altitude on UVI in Europe. Monthly boxplots for each location provide information about regional differences in the variability of UVI, showing maximum variability in Northern and Central Europe in summer, where in Southern Europe this basically occurs in spring. The frequency of the World Health Organization exposure categories moderate, high and very high UVI is provided based on ten-day means for each month. The maximum difference between mean values per decade of 2006–2015 compared to 1983–1992 ranges from −1.2 to +1.2 for UVI and from −0.4 to +0.6 for UVI c l e a r s k y . All locations, except the Northern European site, show an increase of UVI during spring and early summer months. A statistically significant increase in the annual mean all-sky UVI has been found for four sites, which ranges from +1.2% to +3.6% per decade. The latest eleven-year period of the UVI climatology (2005–2015) has been validated with UVI measured in five sites. The sites that are located north of the Alps show an underestimation of the UVI, likely due to the cloud modification. In the south, the UVI climatology provides values that are on average overestimated, possibly related to the use of climatological aerosol information. For the site within the Alps, a switch between underestimation and overestimation during the course of the year has been found. 7% to 9% of the UVI values of the climatology differ from the measured UVI by more than one unit.

1. Introduction

Solar ultraviolet (UV) radiation is necessary for life on Earth, ecosystems and global biogeochemical cycles [1,2,3]. According to wavelength λ , UV radiation is classified as UV-A ( λ = 400–315 nm), UV-B ( λ = 315–80 nm) and UV-C ( λ = 280–100 nm). UV-C is absorbed by the ozone and oxygen in the upper atmosphere and doesn’t reach the Earth´s surface. Depending on the ozone layer thickness, UV-B is partly absorbed and only approximately 10% reaches the Earth surface. UV-A absorption in the atmosphere is very marginal [4]. The exposure to primary UV-B, but to a lower extent also to UV-A, is known to have positive and negative impacts on human health. UV radiation supports vitamin D synthesis, relevant i. a. for bone health, and is the main source of vitamin D in the human body [5,6]. On the other hand, UV radiation can provoke health disorders and diseases, such as sunburn, skin cancer, or cataracts, and alter the immune response of the human body [7]. The incidence of skin cancers has been markedly increased in fair-skinned populations since the 1970s, which is strongly associated with personal habits in relation to UV radiation exposure, and the societal view that a tan is desirable and healthy [8]. The global solar UV-Index (UVI) was developed by the World Health Organization (WHO) in collaboration with World Meteorological Organization (WMO), United Nations Environment Programme (UNEP) and International Commission on Non-Ionizing Radiation Protection (ICNIRP), and is a measure for the maximal erythemally effective UV radiation, induced by the sun at a specific day on a horizontal surface [8,9,10]. UVI is primary aimed to inform people about the need to adopt protective measures when exposed to UV radiation. The UVI is unitless and ranges from zero to 11+ and provides five exposure categories with related protective measures. The UVI is highly variable in time and space, mainly influenced by sun elevation, ozone, cloud cover, aerosols, ground reflection and altitude. Changes of sun elevation are reflected in the seasonal course of UVI and basically in changes of UVI with latitude. Additionally, the most significant absorber of solar radiation at UV-B wavelengths, the stratospheric ozone, usually exists in higher concentration over northern latitudes compared to southern latitudes. Hence, towards the equator, the UVIs are higher and generally decrease with increasing latitude. The depletion of the ozone layer and the consequent increase in UV radiation at the surface of Earth has been an issue for over forty years. Today, the ozone layer is showing indications of recovery and increases in UV radiation are being reversed [11]. The effect of stratospheric ozone depletion, expected ozone recovery, climate change, as well as other geophysical variables on UV radiation reaching the Earth´s surface was examined by Bais et al. [12]. The Montreal Protocol played a crucial role in reducing ozone-depleting substances and hence protecting the ozone layer. Over northern mid-latitudes, observed increases in UV radiation were rather small since the mid-1990s. Also, the observed increases were mainly affected by changes in aerosols and cloud cover, while changes in ozone had a smaller impact.
Clouds may have a strong effect on UV radiation ranging from almost complete extinction under heavy thunderstorms to enhancements of a factor of around 1.4 [13]. The mean reduction due to scattering of radiation in clouds is known to reach about 10% in Southern Europe and about 30–50% in Middle and Northern Europe [14]. High values of the aerosol optical depth in heavily polluted regions can significantly change the UVI at the ground level up to 20–30% [15]. Snow or ice on the Earth’s surface is the main cause for variable UV albedo, resulting in an increase of UVI that varies significantly from site to site. With increasing altitude, the air column for scattering of UV radiation is reduced, the amount of attenuating tropospheric ozone and aerosols is usually smaller and in case of snow covered terrain the albedo is higher. As these influencing factors are variable, the range of the increase of UVI with increasing altitude can differ on a regional level and usually accounts for about 5–25% per km [16,17,18]. Fountoulakis et al. analysed the short- and long-term variability of spectral UV irradiance at Thessaloniki, Greece, derived from a long-term and quality-controlled data set from two Brewer spectrophotometers [19]. For both, clear-sky and clouded conditions, they found positive changes between 2% to 6% per decade in annual mean anomalies of UV irradiance, which are generally greater for shorter wavelengths and for larger solar zenith angles. Increases of UV radiation during summer of 7% to 9% per decade and for 64° solar zenith angle, due to decreases in aerosol load and weakening of the attenuation, are detected. A recent analysis of long-term trends of UV irradiance at four European stations during the period 1996–2017 has come to the conclusion that the main drivers of changes in the UV are changes in aerosols, cloudiness and surface albedo [20]. Both, the magnitude and the direction of the trends and the main influencing factors vary significantly and changes in total ozone have been found to play a less significant role [20].
The study aims at the provision of long term UVI data in high spatial resolution. Various health related applications, assessments and planning rely on such data. Though local measurements are the best way to get accurate information, there exists only a limited number of ground-based measurements and consistency all over Europe is only partially guaranteed. Though there are about 160 stations in 25 European countries monitoring UVI, those sites are not equally distributed and a proportion of the European population is still uninformed about UV radiation and the involved health risks [21]. Especially in the south and south-east countries, ground-based measurements of UV radiation is deficient. Although 25 European countries provide online UVI values, it is complicated for example, for tourists getting information about their holiday destination, to find UVI for a specific region or country. In some countries there are several institutions on different web-pages publishing UVI and also the language can be a barrier. For a further promotion of UVI, satellite and ground-based measurements could be combined, in order to provide easily accessible information of UVI for overall Europe not only as a forecast, but also as a climatology. The estimation of UVI derived from on-board satellite measurements has the great advantage of spatial comprehensive coverage, although it must be considered that the lack of detailed knowledge of influencing parameters at specific locations limits accuracy [1,22,23,24]. There are studies that combine ground-based measurements or modelling and satellite data [25,26,27], but updating an existent climatology [6] is prevented by the fact that the procedures validated by ground based UV measurements and necessary input data are not completely free available. By contrast, satellite products from reliable atmospheric monitoring services in Europe not only allow for creating but also sustainable updating the UVI climatology in the future.

2. Materials and Methods

The notation UVI subsequently refers to the UVI at the local noon, unless something else is specified.

2.1. UVI Climatology Based on Satellite Data

In this study freely available clear-sky UVIs are used as initial input data and further processed by an adaptation to a high-resolution elevation model and subsequently by a high-resolution cloud modification. All necessary data are spatially available from 25° West to 35° East and from 30° North to 65° North for the time period from 1983 until 2015.
The initial clear-sky UVIs are extracted from the Tropospheric Emission Monitoring Internet Service (TEMIS; temis.nl), which is hosted by the Royal Netherlands Meteorological Institute (KNMI) [28,29,30]. At the time of data retrieval for this analysis, clear-sky UVI were available from 1970 until 2015 by a 0.25° grid and global coverage [31]. The TEMIS clear-sky UVIs are essentially computed by an empirically parametrization [32], as a function of the total ozone column and the solar zenith angle at local solar noon, taking into account the erythema action spectrum [9]. The selected data are based on Multisensor-Reanalysis (MSR-2) ozone records. The observation minus forecast statistics shows that the mean bias of the MSR-2 analysis is less than 1% [33]. A first guess of clear-sky UVI is corrected for surface albedo, varying sun-earth distance, surface elevation and aerosols [32]. Changes in surface albedo are prescribed using a monthly climatology of surface reflectivity [34]. The effects of aerosols are included implicitly in the parameterization [35]. The calculation of clear-sky UVI does not consider changes of aerosols in time.
The elevation correction used by TEMIS assumes an UVI increase of 5% per kilometre above sea level [32]. For further data processing this elevation correction was calculated back to sea level. In order to improve spatial resolution the UVI at sea level were interpolated to a 0.05° × 0.05° grid given by the elevation model of the Deutscher Wetterdienst (DWD) (Figure 1). According to several publications, the altitude effect of erythemally weighted UV radiation accounts for 5% to 25% per km [17,18,35]. In Germany, altitude effects between 7% and 16% per kilometer have been obtained [36]. Based on measurements in the Alps the altitude effect amounts to 18% per km for erythemal effective irradiance in summer, whereas in winter, the altitude effect is further 2–5% per km higher [35]. A field campaign in Spain evaluated an altitude effect for erythemally weighted irradiance ranging from 11% to 14% per km [6]. An altitude effect of 5% per km can be interpreted to stand for an atmosphere with very low aerosol load to be found apart from urban areas or above the boundary layer. Also, in mountainous regions with a detailed orography, or with an altitude-dependent snow cover, a much stronger altitude dependence of the UVI has been observed [37]. Therefore the clear-sky UVI in the 0.05° × 0.05° grid were corrected by an UVI increase of 10% per km above sea level to better represent human living zone and orographically structured terrain.
The altitude-corrected clear-sky UVI is further processed by cloud correction in a 0.05° resolution. Cloud impacts on the transfer of UV radiation through the atmosphere can be assessed by using a cloud modification factor, which is based on total global solar irradiance [38]. Global solar irradiance is a common product of satellite-based atmospheric monitoring services in Europe. It includes all relevant effects of radiation transmission, such as cloud optical depth, different cloud layers, multiple reflection. The EUMETSAT (European Organisation for the Exploitation of Meteorological Satellites) Satellite Application Facility on Climate Monitoring (CM SAF, cmsaf.eu) provides a continuous climate data record (currently 1983–2015) that contains the surface incoming solar radiation (SIS), the surface incoming direct irradiation (SDI), spectrally resolved irradiation (SRI) and the effective cloud albedo (CAL). Data from the visible channels of the Meteosat Visible and Infrared Imager MVIRI/Spinning Enhanced Visible and Infrared Imager SEVIRI instruments on-board EUMETSAT’s geostationary Meteosat satellites of the First and the Second Generation (Meteosat 2-10) are used [39]. The SIS, SDI and SRI climate data record are processed using a climate version of the Heliosat algorithm to obtain information about the CAL [40,41]. The CAL describes the amount of reflected radiation of the whole (cloudy and cloud-free) atmosphere, relative to the amount of the reflected radiation of a cloud-free atmosphere [40,42]. In the UV spectral range clouds decrease the irradiance to a lesser extent than in the visible spectral range (Equation (1)) [38], where the cloud reduction parameter p depends on the solar zenith angle (SZA; Table 1). According to the CM SAF validation report [43], the accuracy of CAL is derived from the SIS accuracy. A “worst case” target value of 0.1 is reached, except in winter for latitudes above 55 degrees, where higher uncertainties might occur.
Subsequent to altitude- and cloud-correction the UVIs are analysed with regard to monthly mean conditions, variability, frequency of exposure categories and temporal change. Maps of the monthly mean UVI give an overview of the spatial and temporal differences in Europe. Additionally, further details are calculated for 40 sites, eight of which are chosen here to illustrate the effects of latitude and altitude on UVI in Europe. The North-South variation of UVI is presented by four locations in different latitudes but similar altitudes: Trondheim (63.42° N, 70 m), Berlin (52.57° N, 36 m), Rome (41.90° N, 60 m), Heraklion (35.33° N, 5 m). In order to analyse the effect of altitude on UVI, two groups of locations are chosen. The first group of Munich (48.22° N, 495 m), Schauinsland (47.91° N, 1 206 m) and Zugspitze (47.42° N, 2 962 m) represent the impact of altitude on UVI in Central Europe. Rome (41.90° N, 60 m) and Madrid (40.45° N, 609 m) are the second group, representing the impact of altitude on UVI in Southern Europe. Rome is used both as part of the analysis of the latitudinal variation as well as the altitudinal variation. On a monthly basis, the variability of UVI is shown in boxplots. The box contains 50% of the values observed, where the top and the bottom of the box are the 75 and 25 percentiles, respectively. The line within the box shows the median of the data. The whiskers represent the minimum and the maximum values which are still within 1.5 times the interquartile range. The whiskers are set above the 75 percentile and below the 25 percentile. Any values that are beyond the upper and lower whisker range, are plotted as outliers. The relative frequency of the WHO exposure categories (low, moderate, high, very high, extreme) is calculated for 10-day means of UVI (Figure 2) [11]. Additionally the mean absolute number of days per month reaching the UVI classes “moderate” (UVI ≥ 3), “high” (UVI ≥ 6), and “very high” (UVI ≥ 8) are analysed. In order to evaluate temporal changes of UVI, the deviation of UVI and UVI c l e a r s k y for the ten year period 2006–2015 compared to the previous period 1983–1992 is computed.
U V I ( S Z A ) = U V I c l e a r s k y ( S Z A ) · 1 ( 1 + p ( S Z A ) · ( 1 C A L ) ) 0.27 1 ( 1 + p ( S Z A ) ) 0.27 .
In the following, the notation UVI c l e a r s k y is used for the UVI that occurs under (really or hypothetically) cloud-free conditions. The notation UVI represents all-sky conditions, for example, in contrast to UVI c l e a r s k y it additionally considers the reducing effect of cloud cover. In case of zero cloud cover under real conditions UVI and UVI c l e a r s k y are identical.

2.2. Comparison of UVI Climatology with Ground-Based Measurements

In Section 3.5 of the present study the UVI climatology was compared with UVI calculated from ground-based spectral and multiband measurements. Measured data have been made available from Trondheim, Norway (63.4° N, 10.4° E, 70 m a.s.l.), Uccle, Belgium (50.8° N, 4.4° E, 100 m a.s.l.), Saint-Christophe (Aosta), Italy (45.7° N, 7.4° E, 570 m a.s.l.) [44], Rome, Italy (41.9° N, 12.5° E, 60 m a.s.l.) and Thessaloniki, Greece (40.6° N, 23.0° E, 60 m a.s.l.). The sites of Rome, Saint-Christophe, Thessaloniki and Uccle were chosen because they provide good quality continuous spectral UV measurements and are located at different latitudes. In order to include Northern Europe the site of Trondheim providing multiband UV measurements has been added. The UVI was calculated from the measurements using the erythemal effective spectrum [45]. The selected UV measurement sites (Figure 1) are located north of the Alps (Trondheim, Uccle), within the Alps (Saint-Christophe) and south of the Alps (Rome, Thessaloniki). The measurements are available for different time ranges, but even the longest available time series starts in the 1990s and hence, it is not possible to validate the complete time range of the climatology beginning in 1983.
In order to have a common data set for all measurement sites the eleven-year period 2005 to 2015 has been chosen for validation. There is only one exception: measurements in Saint-Christophe cover the period 2006 to 2015.
In Table 2 are listed the name, location and surface description of the sites providing ground-based spectral or multiband UV measurements used in this study, the type of the measurements, the data availability for each station and the data sources. The UV datasets from the stations are proved by quality control/quality assurance, and are traceable to international reference standards [46,47,48].

3. Results

3.1. Mean Monthly UVI of Europe

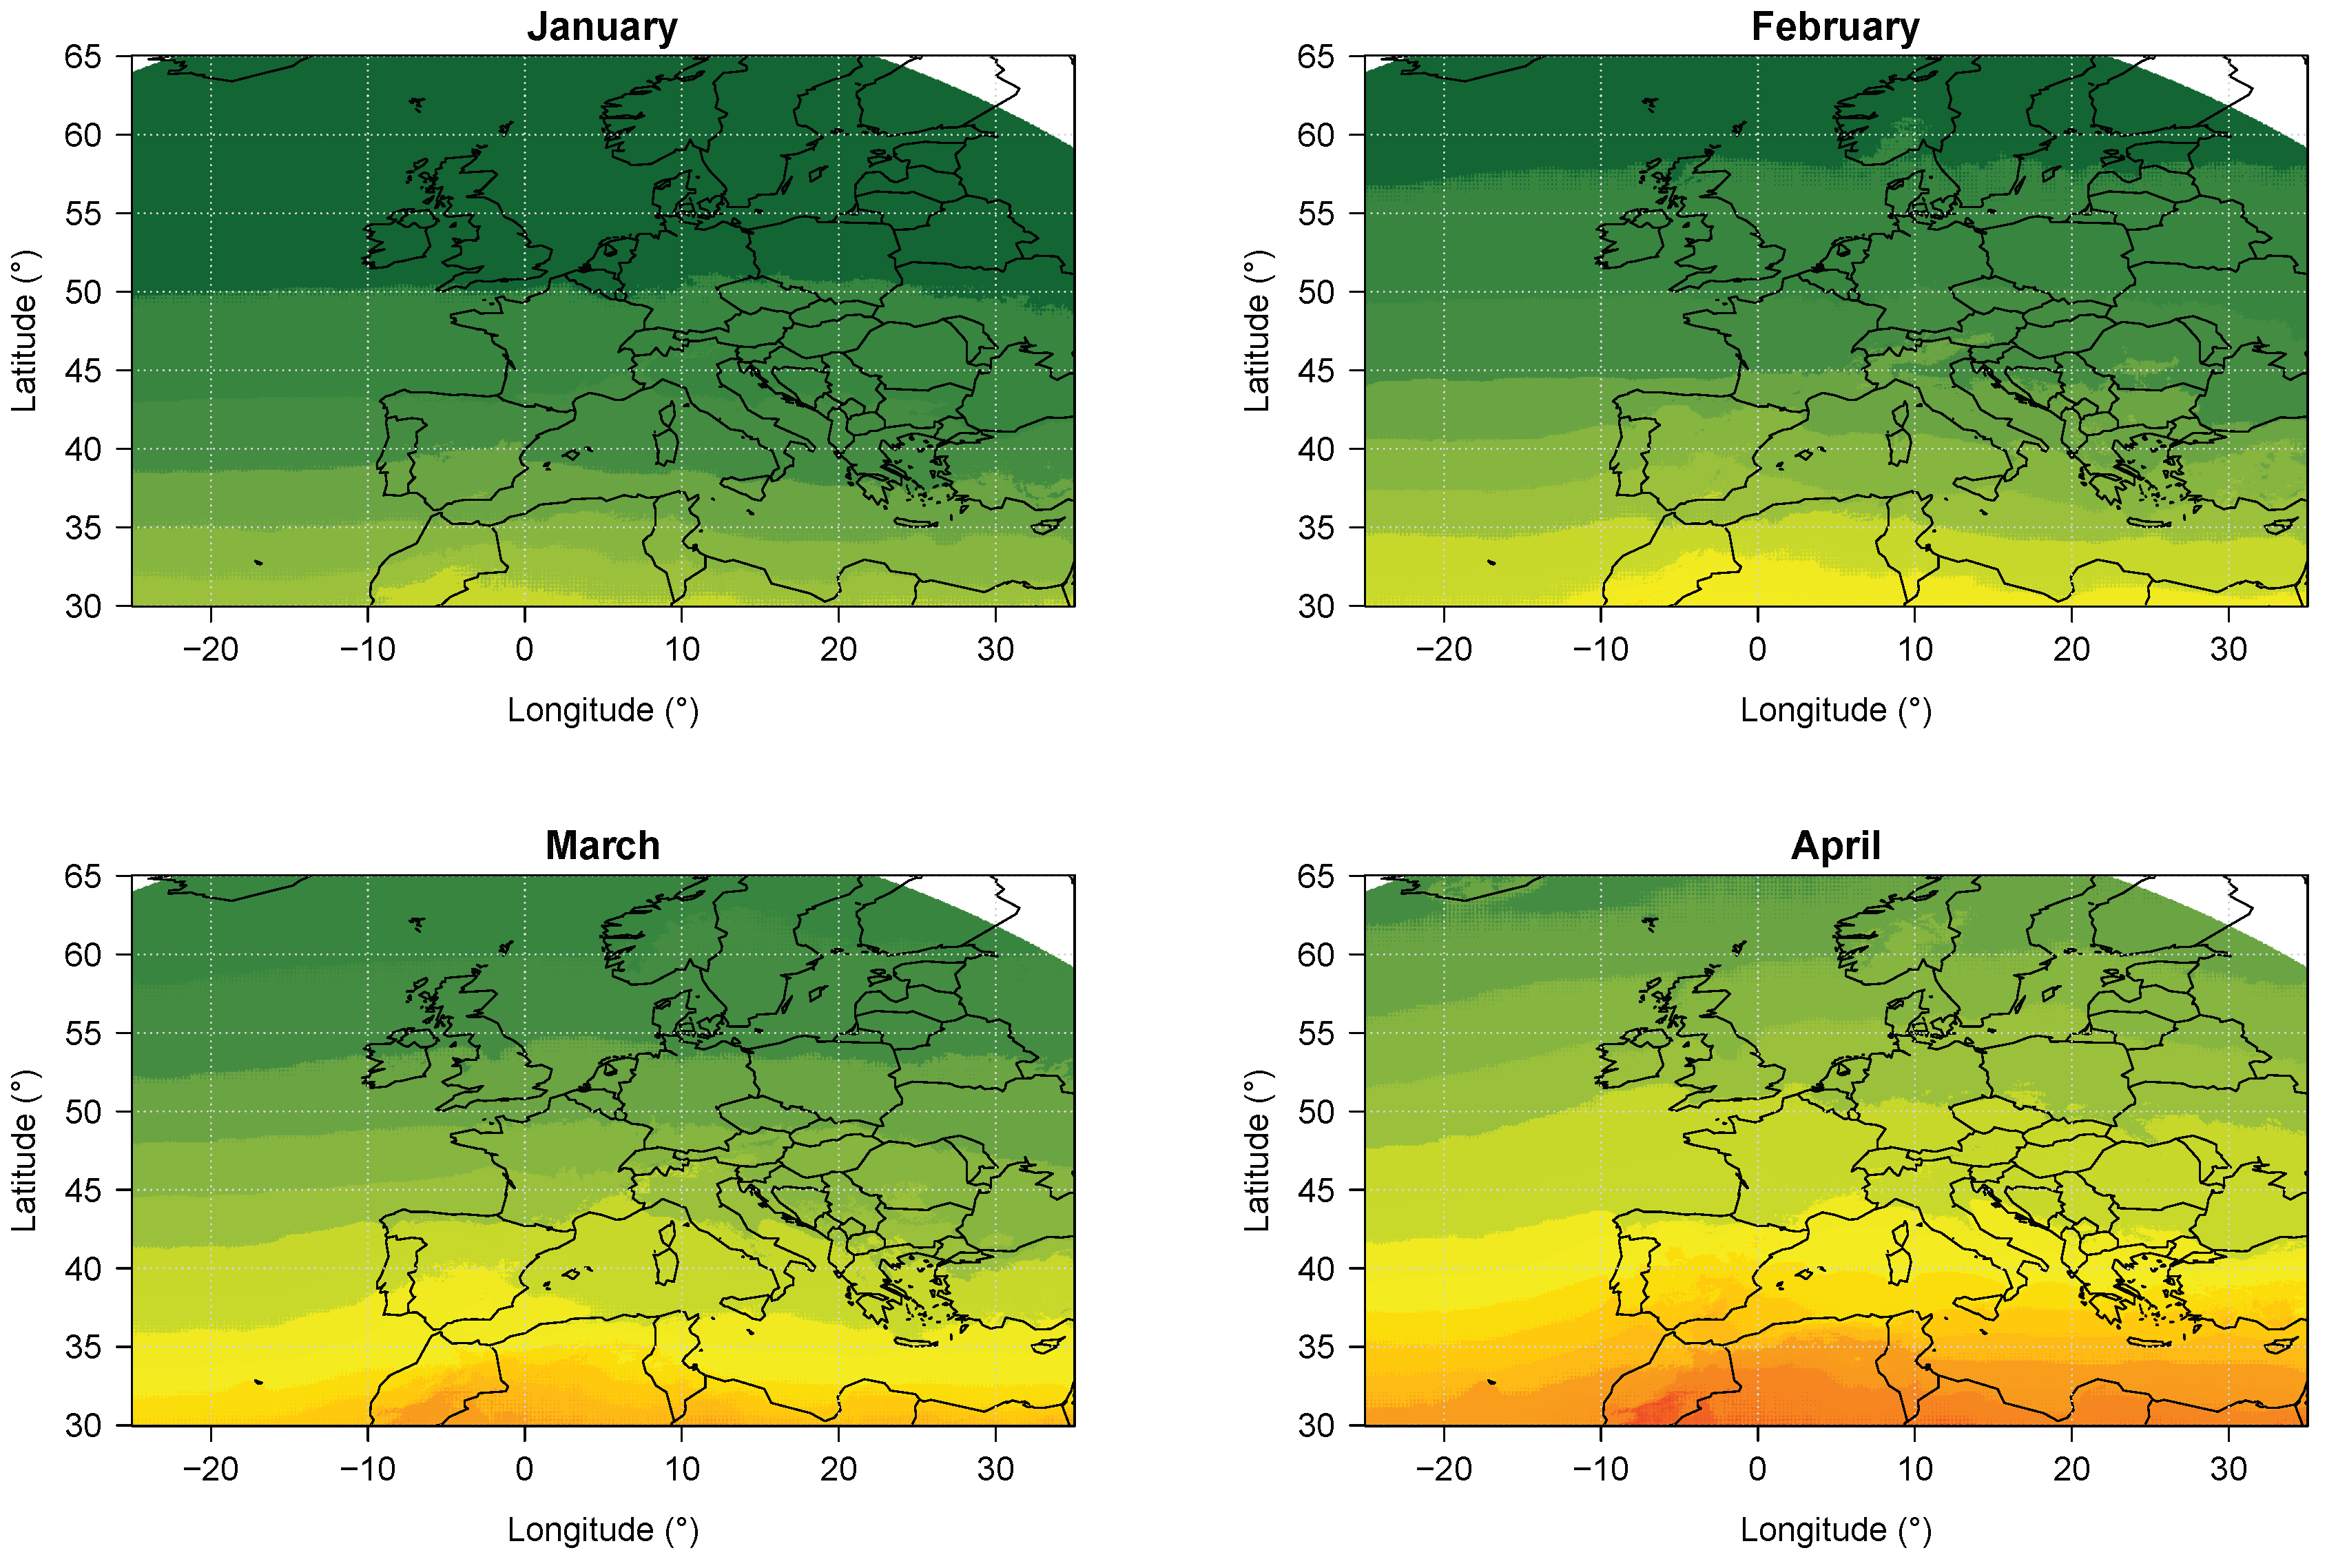
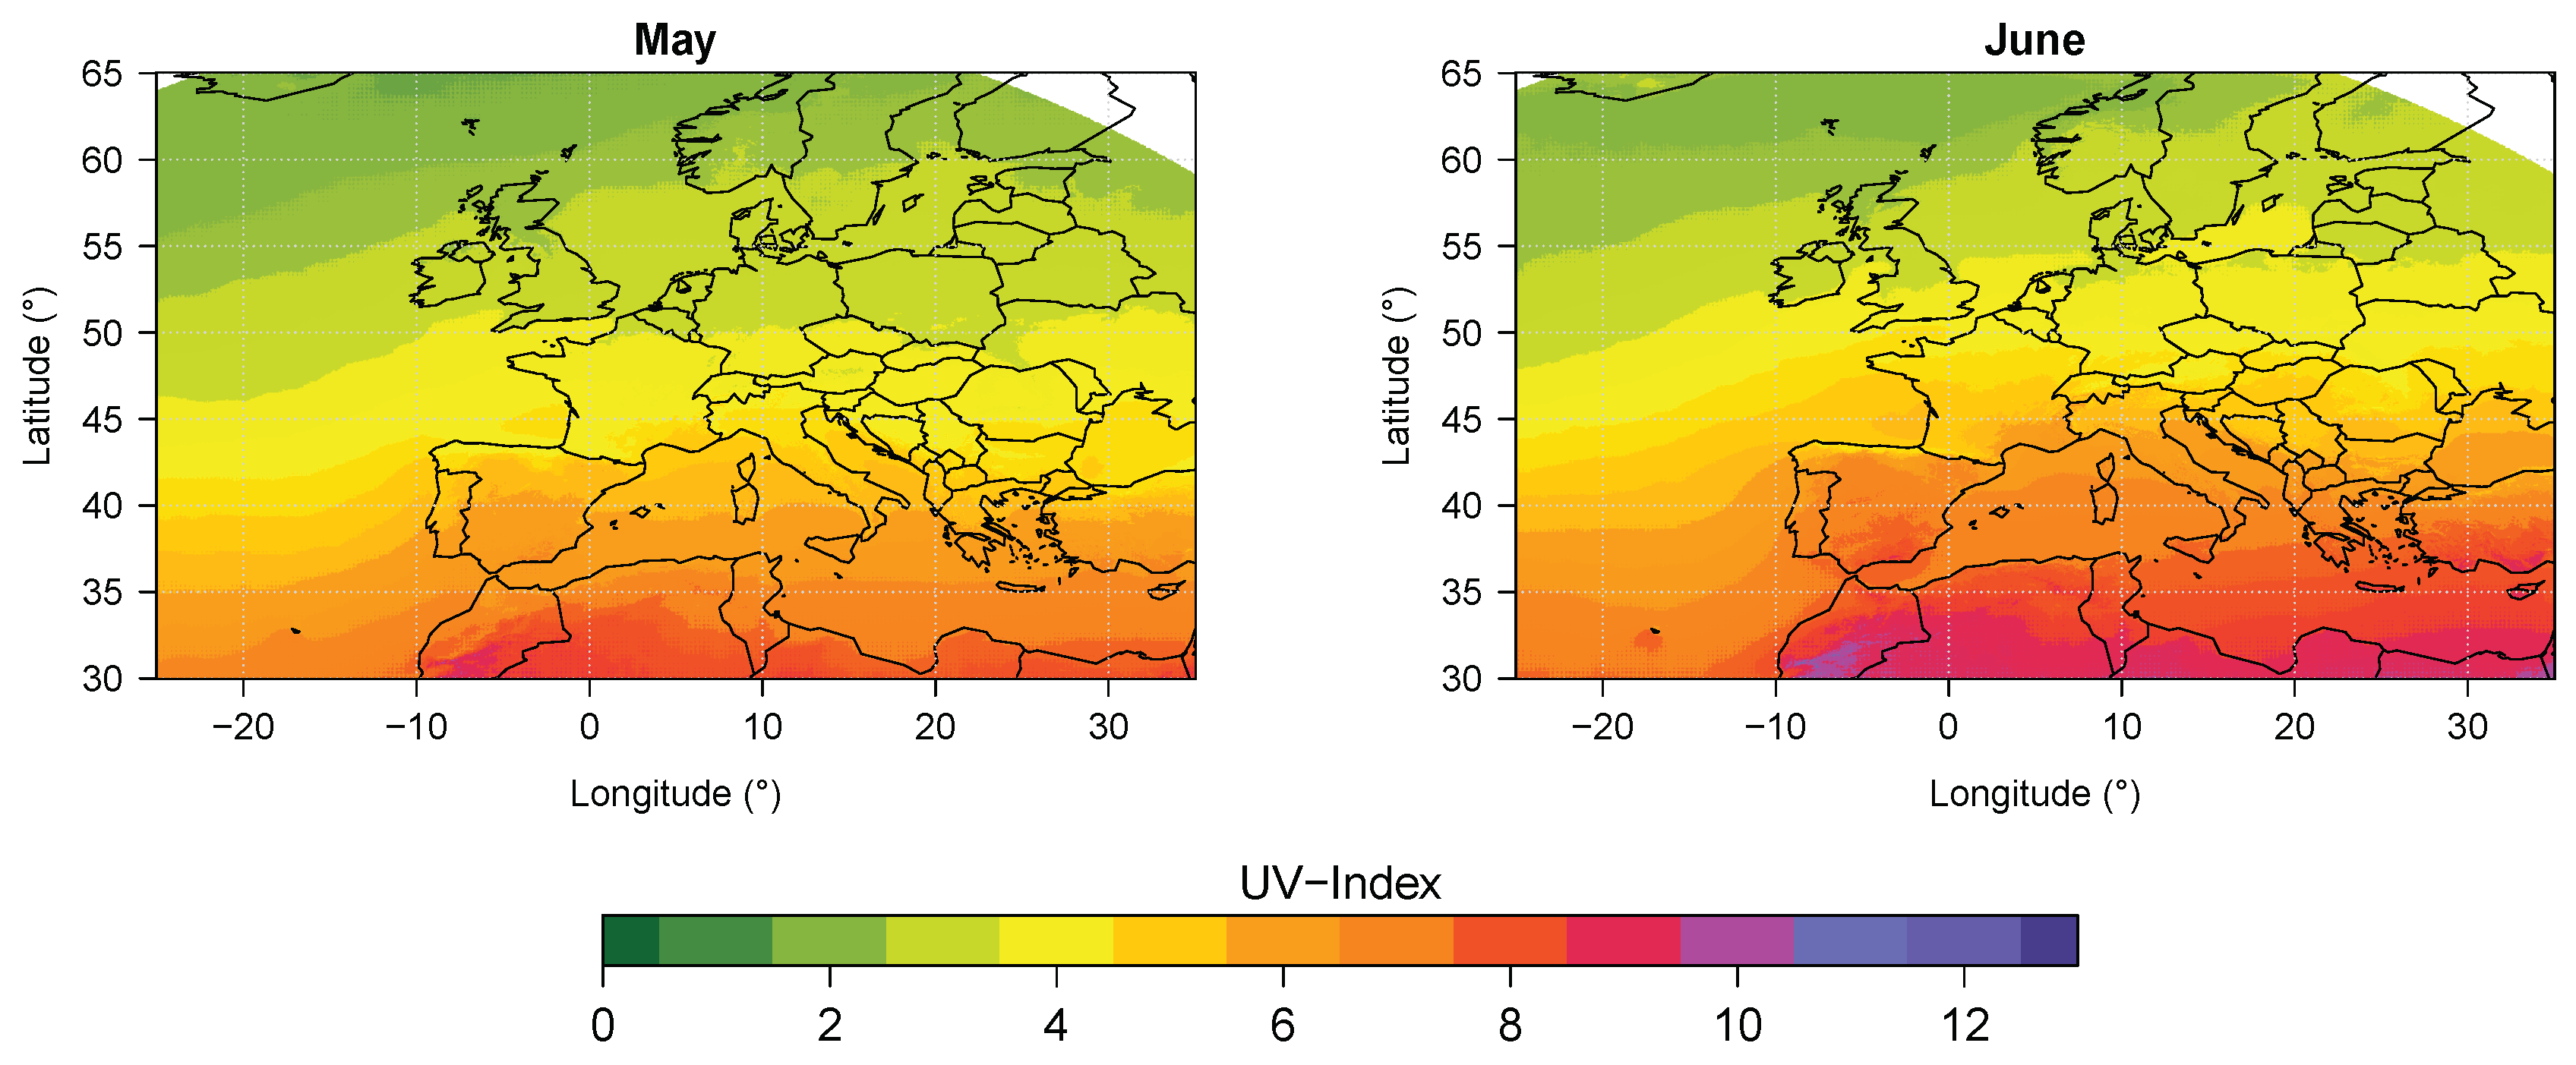
Maps of the monthly mean UVI over the period 1983–2015 (Figure 3 and Figure 4) give an overview of the distribution of UVI for Europe as well as the spatial and temporal differences and regional anomalies. In January, low mean UVI values dominate overall Europe north of 35° N. South of latitude 35° moderate UVI up to maximum values of 3.9 are detected, mainly over the North-African continent. UVI is slightly higher in February, but still exclusively low UVI values are observed north of 41° N and southern moderate UVI values up to 5.5 are reached. In the South-East of Europe and high altitude regions (for example Alps, Carpathians and Pyrenees) marginal higher UVI values are noticeable. The boundary where only low UVI values occur, moves northwards to 48° N in March. Moderate mean UVI values occur between 30° and 48° N and high UVI south of 35° N. Additionally, very high mean UVI up to 7.8 are detected south of 32° N.
In April there are only low mean UVI values north of 58° N and between 40° to 50° N there are exclusively moderate UVI values. South of 40° N high monthly mean UVI values and south of 34° N even very high UVI up to 10.0 occur in April. Between 55° and 65° N there are both low and moderate UVI values from 1.7 to 3.8, where south of 55° N solely UVI values ≥2.5 are detected in May. Exclusively moderate UVI values occur between 47° and 55° N. South of 38° N UVI values amount at least 7.5 or higher and reach high up to extreme UVI exposure with maximum mean monthly values of 11.5 around 30° N. In June, mean low and moderate UVI occur north of 59° N, where south of this latitude there are at least moderate or higher UVI values. South of 41° N all of UVIs are ≥5.5 with extreme mean UVI up to 12.7 maximum. There are lower mean UVI at the regions which are northerly bordering on the Alps, Carpathians, Pyrenees and the north coast of Spain due to a high cloud cover reducing UV radiation in the atmosphere.
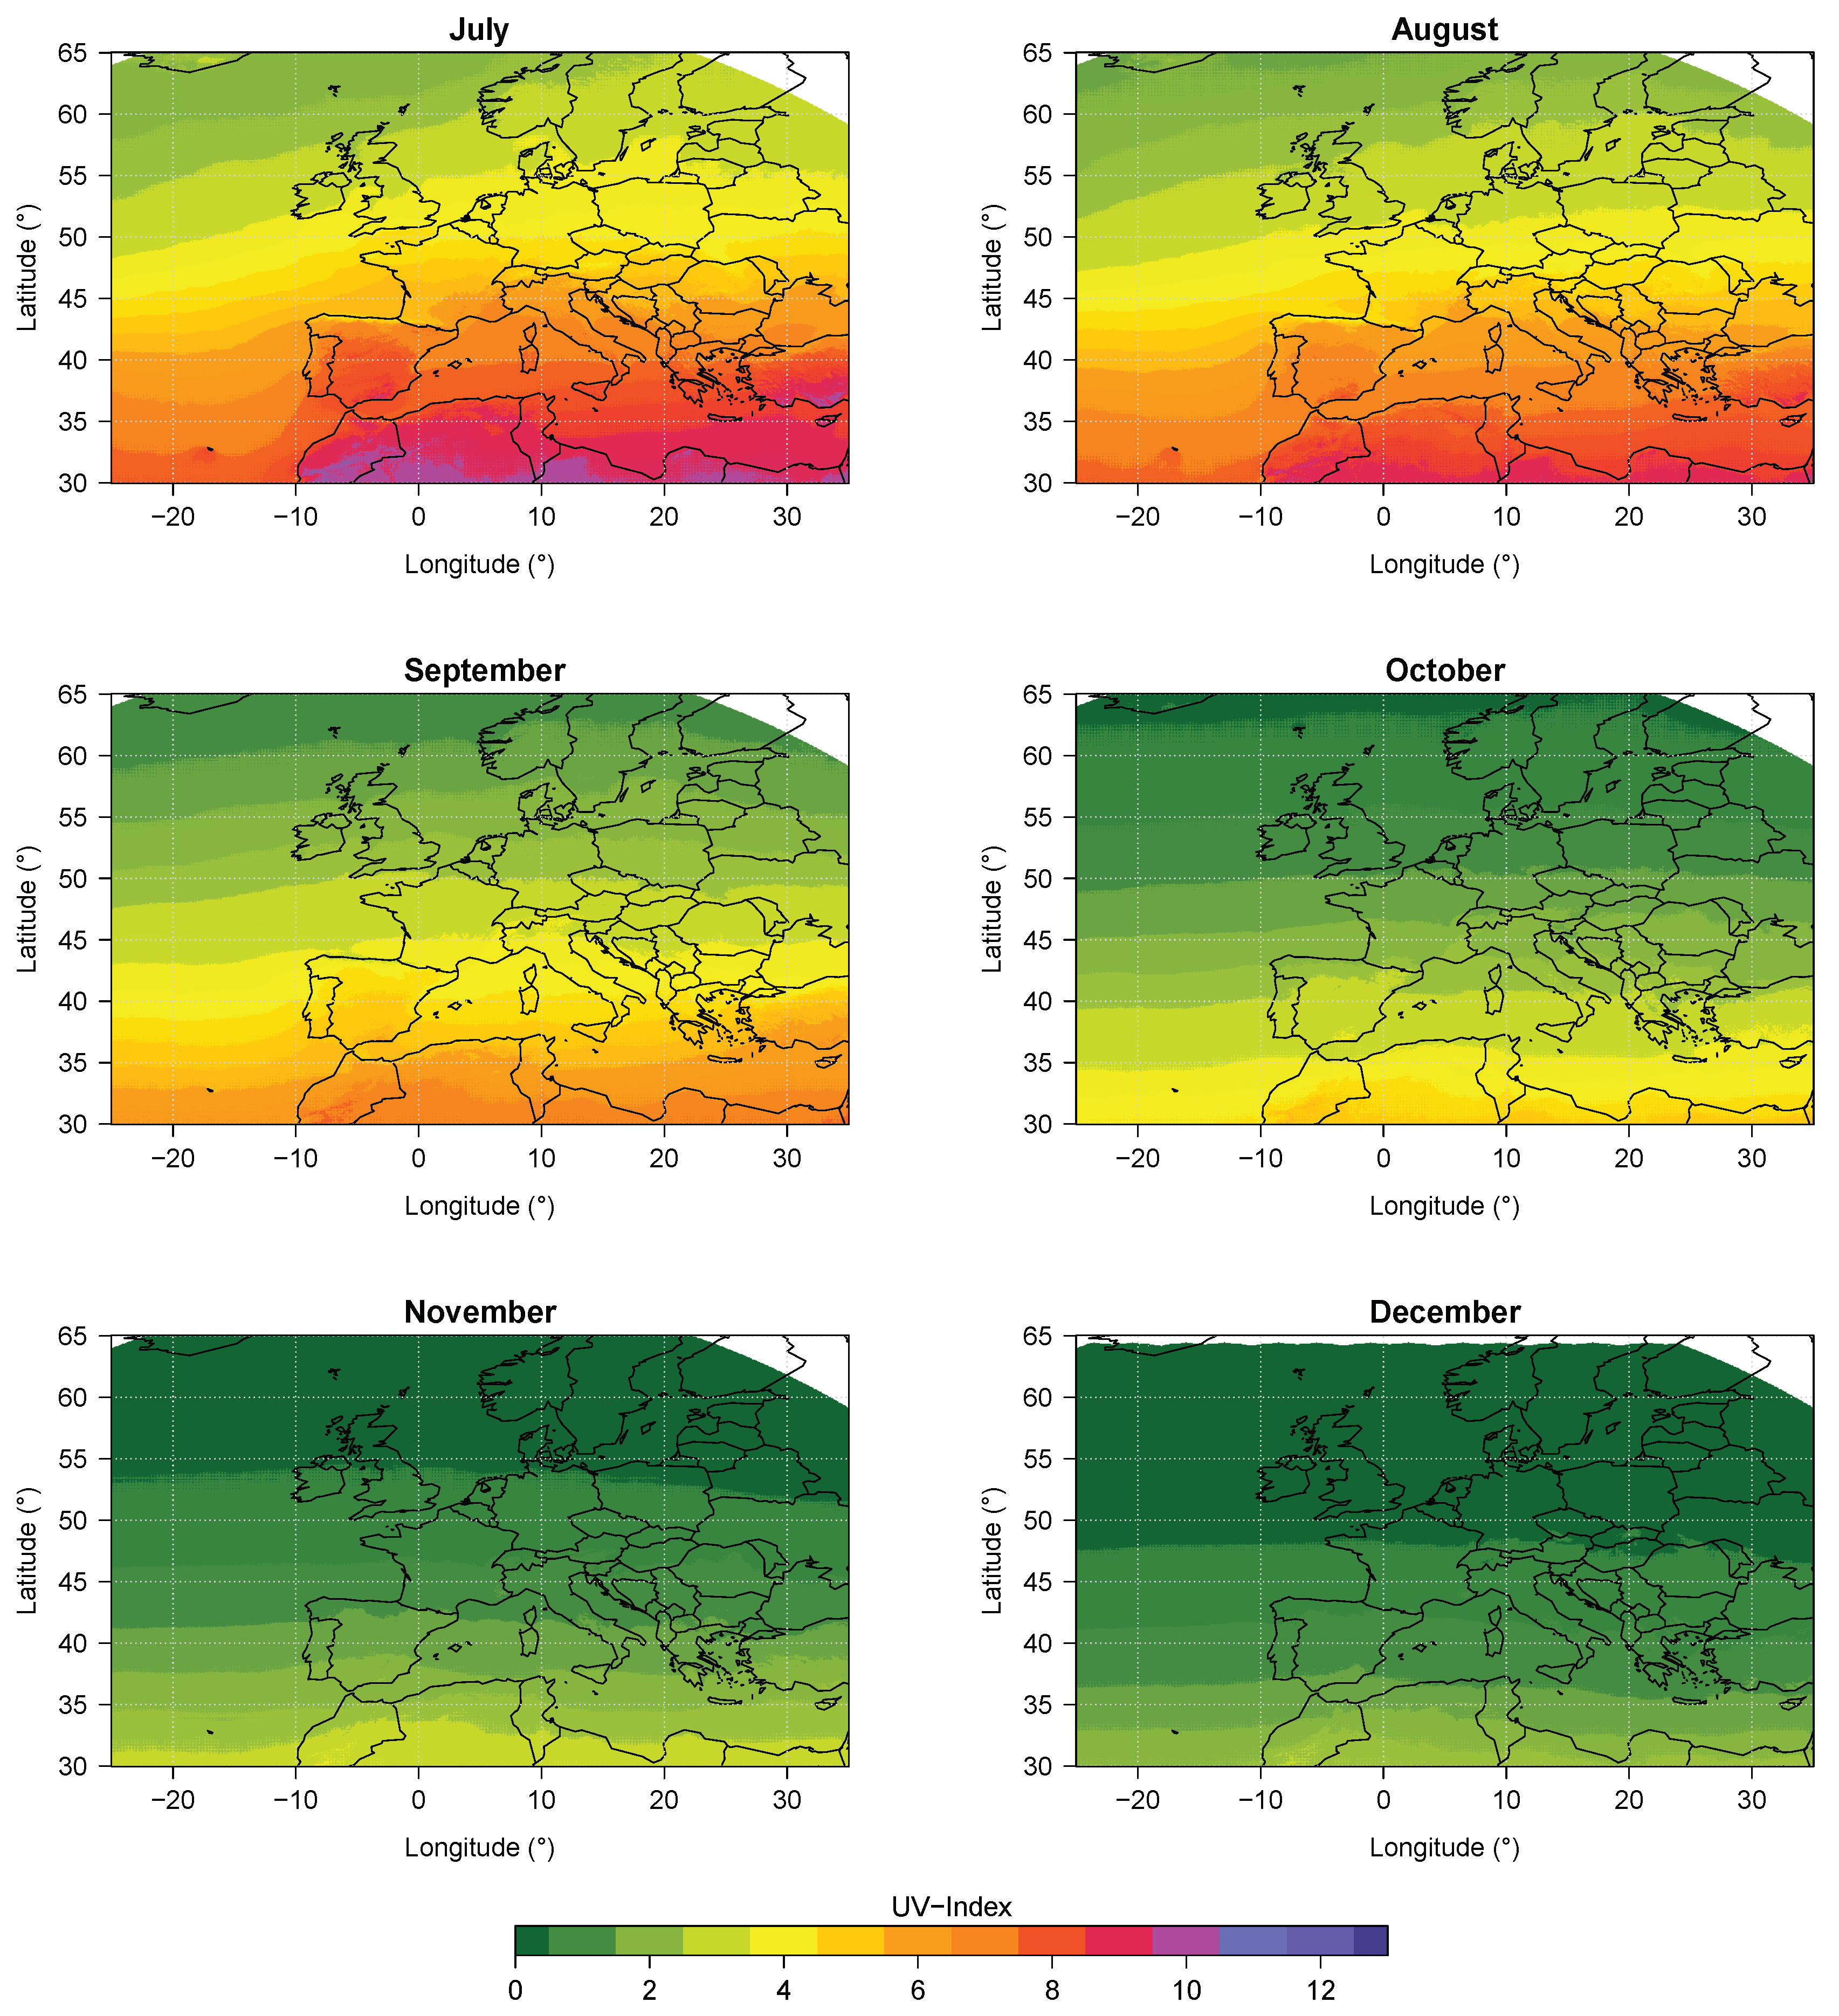
In July the lowest mean UVI value is 2.0 occurring in Europe north of 57° N. UVI of the category “high” or more are detected south of 43° N with values up to 12.1 in southern Spain and Turkey, and even up to 12.9 in North Africa. As in May and June, regions of which are northerly bordering on the Alps, Pyrenees, Carpathians and hills in south-east Iceland as well as coastal sites with high cloud cover, show lower mean UVI values than the surrounding regions. On the contrary, due to the lack of cloud reduction this anomaly is not visible in regions of south-east Spain and Turkey bordering on the high altitude regions there. July is the month with the highest UVI values over Europe. Compared to July, UVI is slightly decreasing in August. The border where there is no low UVI decreases by only 2° southwards. North of 43° N high UVI values are not reached on average, however south of this latitude all mean values are ≥5.5 with UVI up to 11.7 maximum in the very South.

3.2. UVI Overview for Chosen Locations

Figure 5 shows the mean course of the year of UVI and UVI c l e a r s k y for the time period 1983 until 2015. The annual variation is more pronounced in southern sites than in higher latitudes, which is mainly due to sun elevation.
UVI increases with decreasing latitude. The locations Trondheim, Berlin, Rome and Heraklion illustrate this North-South variation. The annual mean UVI increase from 1.2 in Trondheim, 2.2 in Berlin, 4.1 in Rome and up to 5.3 in Heraklion. Mean maximum values increase from 2.9 over 4.8 and 8.3 up to 10.1 and mean minimum values show the same development of 0.0, over 0.3 and 0.9 up to 1.2, respectively per location from North to South. In Trondheim and Berlin, mean maximum daily UVIs are 2.0 units lower than the hypothetical UVI c l e a r s k y and the annual mean UVI is 0.8 and 1.0 lower than the annual mean UVI c l e a r s k y , respectively. In Rome and Heraklion these differences between UVI and UVI c l e a r s k y are distinctly smaller, mainly with respect to mean maximum daily values with 0.5 and 0.2 respectively. Besides the increasing solar zenith angle, the effective cloud albedo (CAL) plays a major role reducing UVI in the atmosphere. An increase of CAL with increasing latitude is observed in Figure 5. Therefore, in comparison to the theoretically UVI c l e a r s k y , the UVI values during summer months are more reduced in the northern situated locations Trondheim and Berlin than the southern situated locations Rome and Heraklion.
In Figure 6, monthly boxplots for each location over the period 1983–2015 of UVI offer additional information about the variability of UVI (median, interquartile range, absolute extreme values). Trondheim shows the weakest course of the year of UVI. From November until February the sun elevation is very low and UVIs are around zero. Absolute maximum values of 5.5 are reached in June and July, where the median is constantly between 2.1 and 2.4 from May until August. The absolute maximum values in Berlin are 7.8 and 7.6 in June and July. The median reaches its maximum in July with a UVI of 4.4 in Berlin. There are differences in the variability of UVI between the Northern and Central European sites on the one hand and the Southern European sites on the other hand. The Northern and Central European sites basically show an increasing variability (interquartile and whisker range) of the UVI from the first months of the year till maximum variability in June and July and a decreasing variability later in the year. In contrast, the Southern European sites feature maximum variability in spring (April and May in Rome and Madrid, March and April in Heraklion), and a certain secondary minimum of variability in July and August. Hence, compared to Rome and Heraklion, the interquartile ranges of UVI during summer months are clearly wider in Berlin. In July, 50% of UVI values are between 3.2 and 5.6 in Berlin, where this range spans from 7.9 to 8.8 in Rome and from 9.5 to 10.3 in Heraklion. While UVI values around 0 are still possible during summer months in Trondheim and Berlin, UVI rarely drops below 6.7 except for some outliers in Rome and 8.7 in Heraklion. The highest median with 8.3 in Rome and even 10.0 in Heraklion is observed in July.
The effect of altitude was analysed for sites at a comparable latitude for Central Europe (Munich, Schauinsland and Zugspitze, with an altitude difference of 711 m between Munich and Schauinsland and 2467m between Munich and Zugspitze) and Southern Europe (Rome and Madrid with an altitude difference of 607 m). UVI values of Schauinsland are only slightly higher than in Munich. Mean daily maximum UVI of 6.2 (UVI c l e a r s k y 8.4) is reached, only 0.1 (UVI c l e a r s k y 0.5) units more than in Munich. At Zugspitze mean maximum UVI of 6.7 (UVI c l e a r s k y 9.4) is reached, 0.6 (UVI c l e a r s k y 1.5) units more than in Munich. The altitude effect is comparable for the median of UVI throughout the year with a difference of 0.1 units between Munich and Schauinsland (2.5 and 2.6, respectively) and is less pronounced with 0.4 units at Zugspitze (mean UVI 3.0). Double differences of mean values occur for UVI c l e a r s k y (4.0, 4.2 and 4.8, respectively) (Table 3). For all analysed parameters the altitude effect in Central Europe is less pronounced than would be expected by an isolated consideration of the altitude dependence of UVI, that is, UVI increases less than the assumed 10% per km above sea level. This can partly be attributed to the fact that a resolution of 0.05° of the elevation model still contains deviations from true topography. Also, the mountain sites are usually stronger affected by cloudiness. In Figure 6 similar courses of the year of UVI in Munich, Schauinsland and Zugspitze are observed, but especially the variability of UVI at the mountain site Zugspitze is larger in summer than at the two other locations.
Additionally, Rome and Madrid were chosen in order to analyse the effect of altitude on UVI in Southern Europe. The annual mean UVI is 4.7 in Madrid and hence 0.6 units higher than in Rome. The mean maximum UVI is 8.3 in Rome and 9.1 in Madrid (mean maximum UVI c l e a r s k y 8.8 and 9.5, respectively). Absolute maximum values are higher in Madrid with a UVI of 10.8 and 9.9 in Rome (Figure 6). The interquartile range of the UVI covers absolute values between 7.7–8.7 and 8.6–9.5 in July, respectively. In contrast to locations in Central and Northern Europe, the variability in summer is considerably smaller in Southern locations due to less cloudiness. Both Southern locations have comparable mean annual CAL of 0.2, that is half the mean annual CAL of the Central European sites. In contrast to Central Europe, the altitude effect in Southern Europe is somewhat more pronounced than would be expected by an isolated consideration of the altitude dependence of UVI, that is, UVI increases more than the assumed 10% per km above sea level.
There are two reasons, which can likely be responsible for the large differences. First, there is a difference in surface albedo caused by the fact that Madrid is much drier than Rome. The albedo product of the Modern-Era Retrospective Analysis for Research and Applications, Version 2 [49] shows in the visible that the albedo for Madrid in summer is approximately 0.23 while for Rome it is approximately 0.14. If it can be assumed that the difference is similar for the albedo in the UV, it would justify a difference of 0.2–0.3 in UVI at a solar zenith angle of 30 degrees. Second, a part of the unexpected difference in UVI could also be attributed to differences in the aerosol optical properties included in the retrieval and reflecting differences in aerosol type and load.

3.3. Relative Frequency and Absolute Number of UVI Classes

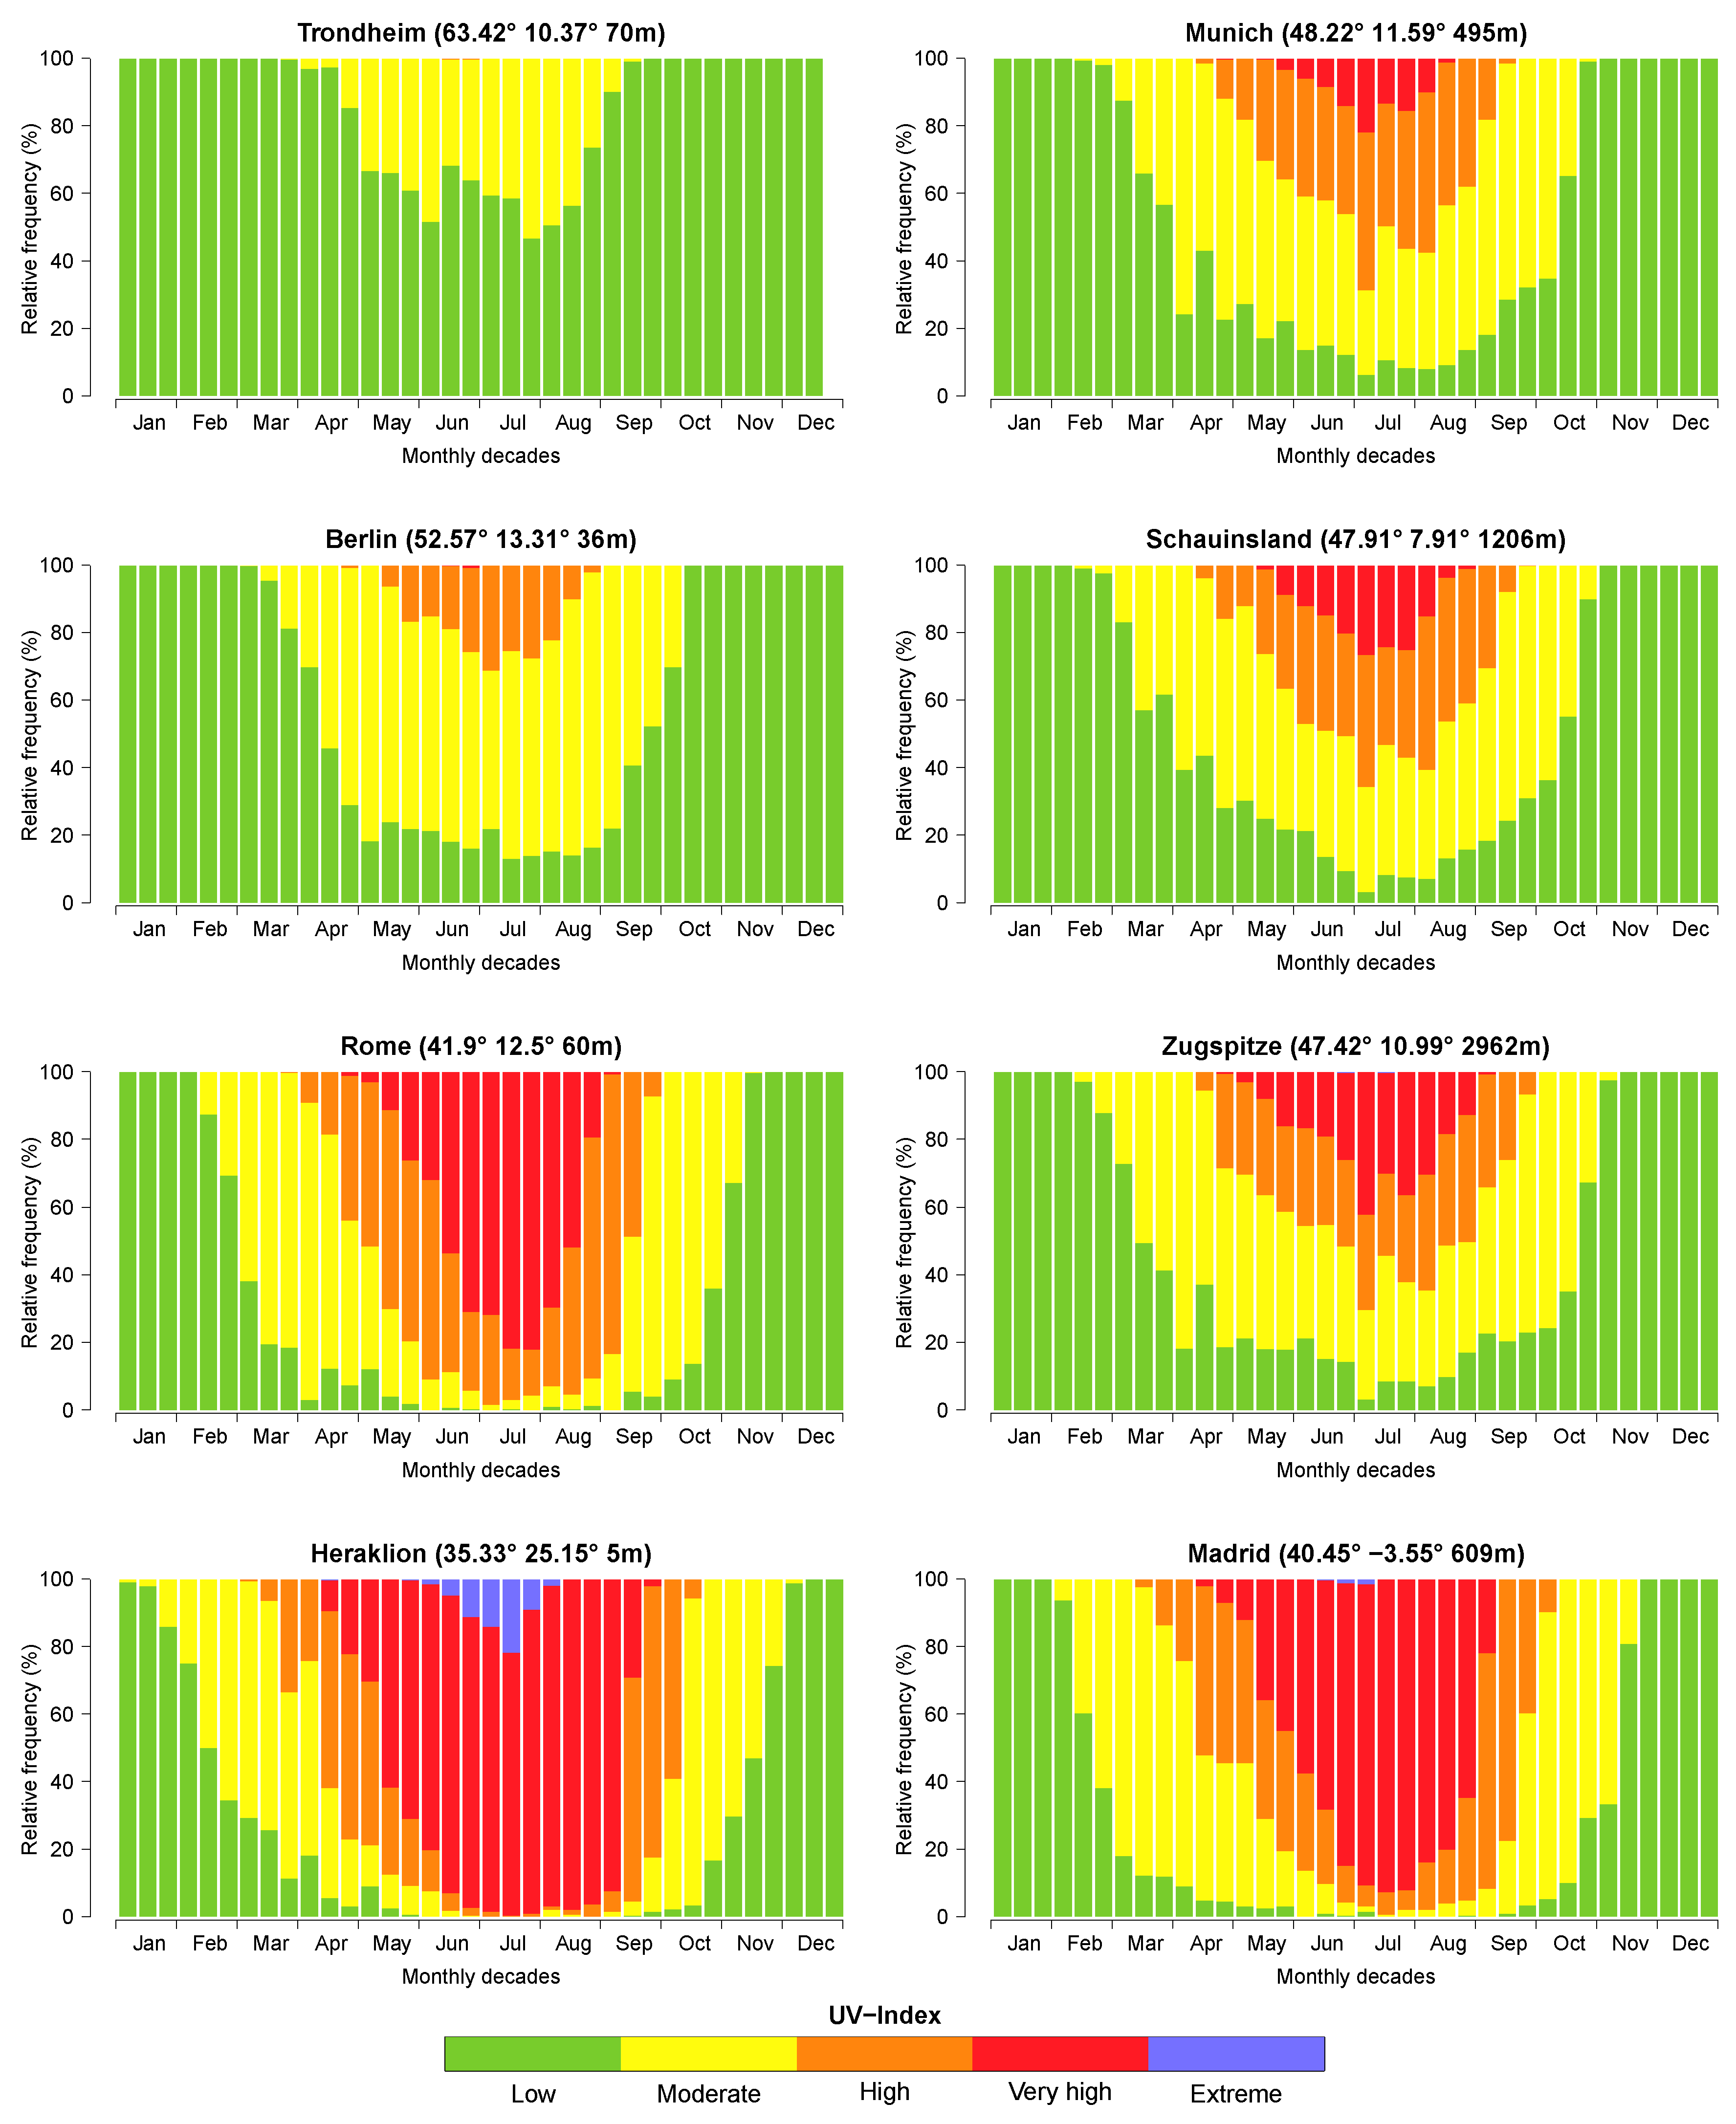
With special focus on user-oriented presentations the frequency of WHO UVI exposure categories is given in two different figures. The relative frequency of each UVI exposure class is provided in Figure 7, based on three ten-day means for each month. The averaged absolute number of days per month with moderate, high and very high UVI is presented in Figure 8. Between October and March, exclusively low UVI values are observed in Trondheim. During summer months, moderate UVI values reach up to 49% per decade, and there is even a minor probability of high UVI values in June with less than 1%. On average 11 days of moderate UVIs are observed in July and throughout the year there are 31 days of moderate UVI values in Trondheim (Table 3). In Berlin moderate or higher UVI values can occur between March and October with a maximum relative probability of 82% observed in May and August. High UVI values occur on 31% of the days in the first decade of July and there is also a very slight probability of 0.3% and 0.9% of very high UVI in the last two decades of June. In July, Berlin has up to 24 days of at least moderate UVI, whereof 6 days reach high UVI. Spread over the year, there are 112 days of at least moderate UVI and 12 days of high UVI values. In Rome there are moderate UVI values detected between February until November.
During summer months almost each decade has a 100% probability of moderate or even higher UV radiation exposure in Rome and Heraklion. In July very high UVI values are reached for averaged 79% of the days in Rome and 84% in Heraklion. In Rome there are no cases of extreme UVI values observed, whereas in Heraklion there is a probability up to 22% of the days in the second decade of July with extreme UV radiation exposure. In Rome and Heraklion at least moderate UVI values are reached every single day in July, of which between 29 to 31 days also reach high UVI conditions. Very high UVI values are detected at averaged 20 days in Rome and even 31 days in Heraklion during July. At least moderate UVI values are reached at 208 days per year and 239 days per year, of which 110 days and 157 days also reach high values in Rome and Heraklion per year.
Even 38 days and 102 days per year are detected with very high UVI, respectively. Moderate UVI values are detected between February and October at averaged 41%, 39% and 41% over this period with maximum frequency values per decade of 76%, 69% and 82% in Munich, Schauinsland and Zugspitze. At all three locations, high UVI values occur from the second decade of April until end of September with about 25% of the days. In Munich, very high UVI values are detected between the third decade of May until the second decade of August at averaged 10% of the days and a maximum probability of 22% during the first decade of July. At Schauinsland, the occurrence of very high UVI values is extended from the second decade of May until the third decade of August, when 14% of the days have UVI ≥ 8 during this period. There is a probability of up to 42% of very high UVI in the first decade of July at Zugspitze and even 19% of the days between the third decade of April and the first decade of September reach very high UVI values. Throughout the year, there are 41 days of high UVI in Munich, 45 days at Schauinsland and 56 days at Zugspitze. Also, days with very high UVI increase with the altitude, as Munich only has 3 days, Schauinsland has 8 days and even 17 days of UVI ≥ 8 are found at Zugspitze. During the third decade of June and the second decade of July, there is even a slight probability of extreme UVI values at Zugspitze with <1%, respectively.
In Rome high UVI values occur from April until September with a mean probability of 38%, where in Madrid there are also high UVI values possible in March and October at 28% during these decades. Very high UVIs are detected between April and September, with a maximum frequency of 79% and 91% in Rome and Madrid during the month of July. Additionally, Madrid reaches extreme UVI values in June and July of up to 2% in the first decade of July. In absolute values, there are averaged 30 days of high UVI at both locations Rome and Madrid in July. Very high UVI values are detected on averaged 11 days and 19 days in June, 20 days and 26 days in July, as well as 5 days and 15 days in August in Rome and Madrid, respectively.

3.4. Temporal Changes of UVI

Due to the methods of the satellite-based data retrieval, the temporal changes of the UVI here mainly reflect the effects of cloudiness and ozone. As the main drivers of changes in the UV are changes in aerosols, cloudiness and surface albedo and only to a less extend in total ozone [20], the analysis only covers a section of the temporal change and does only allow conclusions in this respect.
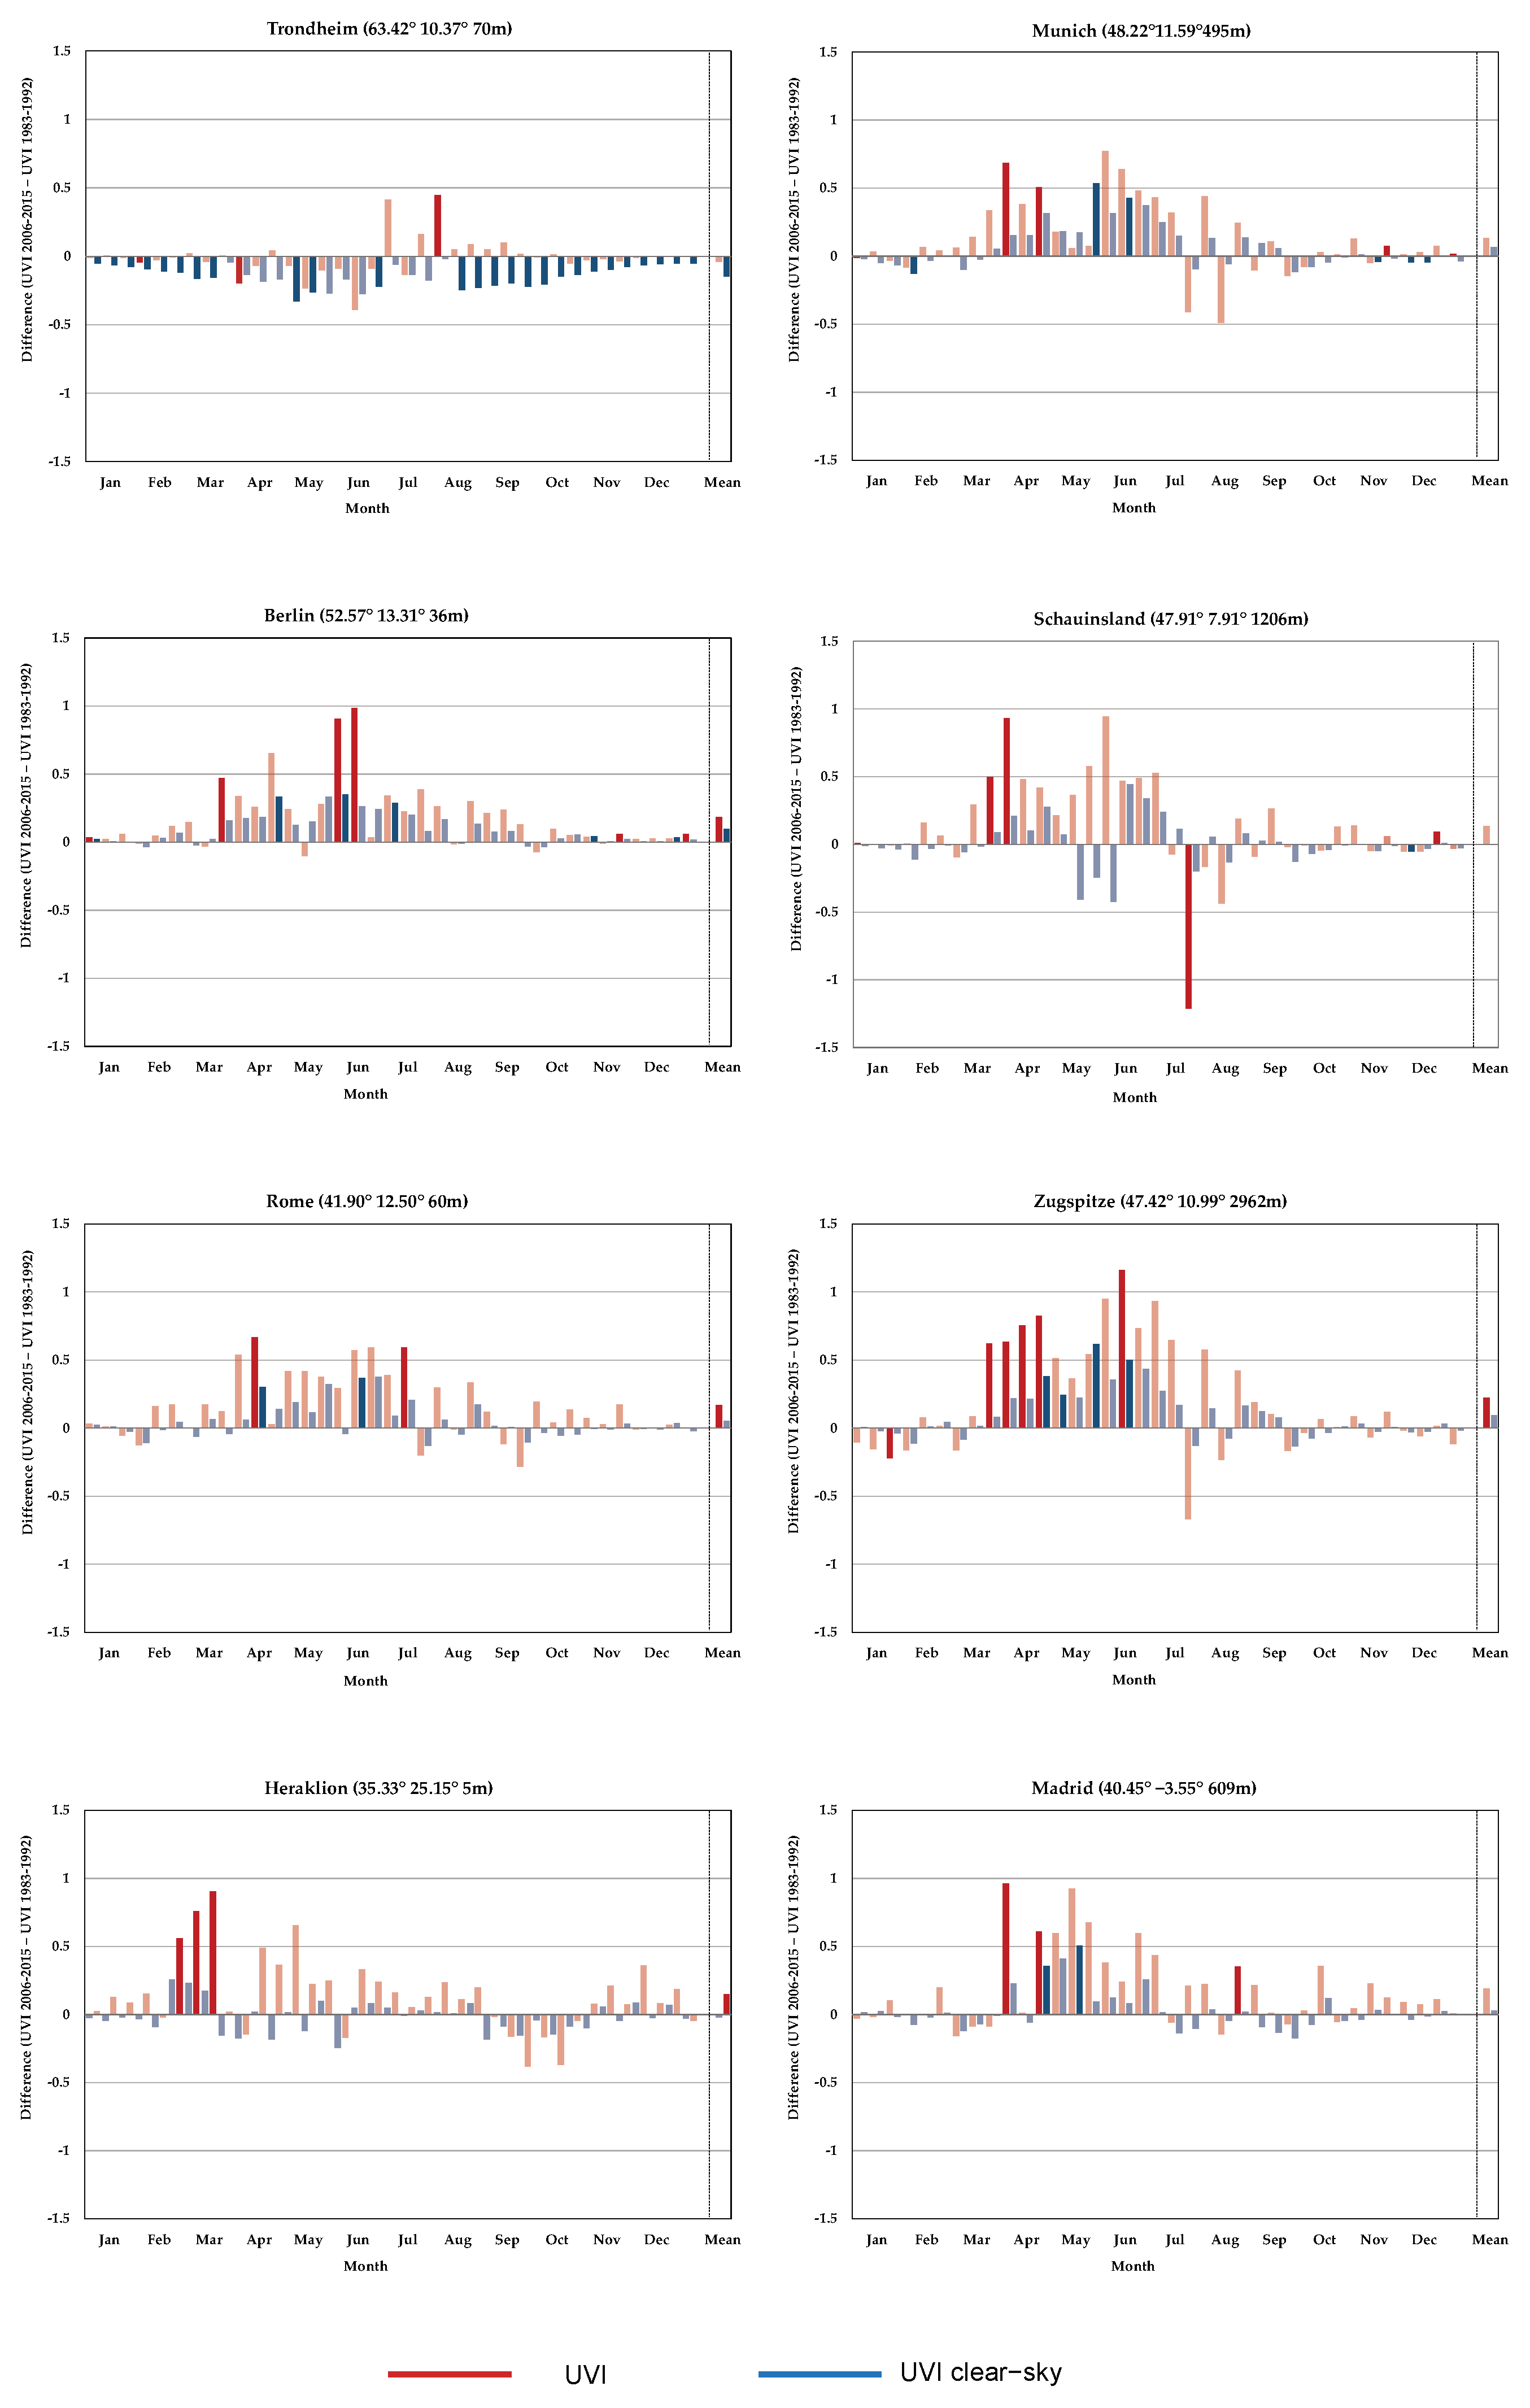
In order to analyse the long-term changes of UVI, 10-day mean values for the time period 1983–1992 and 2006–2015 were calculated (Figure 9). There are small increases in annual mean UVI for all locations except Trondheim. A statistically significant increase in the annual mean all-sky UVI has been found for four sites (Berlin 8%, Zugspitze 7%, Rome 4%, Heraklion 3%) on a significance level of 5% (Figure 9) and for all sites (except Trondheim) on a 10% significance level. The percentage of increase related to the analysed time intervals are given behind the name of the site. The statistically significant increase per decade ranges from +1.2% to +3.6% of the annual mean all-sky UVI. In all locations (except Trondheim) UVI and UVI c l e a r s k y mainly show an increase during spring and early summer months. In these sites statistically significant differences of at least 0.5 UVI of the 10-day means occur most frequent in March and April. On a yearly average the absolute values of UVI of all sites (except Trondheim) increased by +0.1 to +0.2. The maximum differences between mean values per decade of 2006–2015 compared to 1983–1992 ranges from −1.2 to +1.2 for UVI and from −0.4 to +0.6 for UVI c l e a r s k y . The only location with a decreasing trend is Trondheim. There, an 8% decrease in the annual mean of UVI c l e a r s k y is statistically significant, but no significant trend has been detected for all-sky UVI. UVI values decrease up to −0.4 in June, but also there is an increase of up to +0.4 during July to September for UVI on average.

3.5. Comparison of UVI Climatology with Ground-Based Measurements

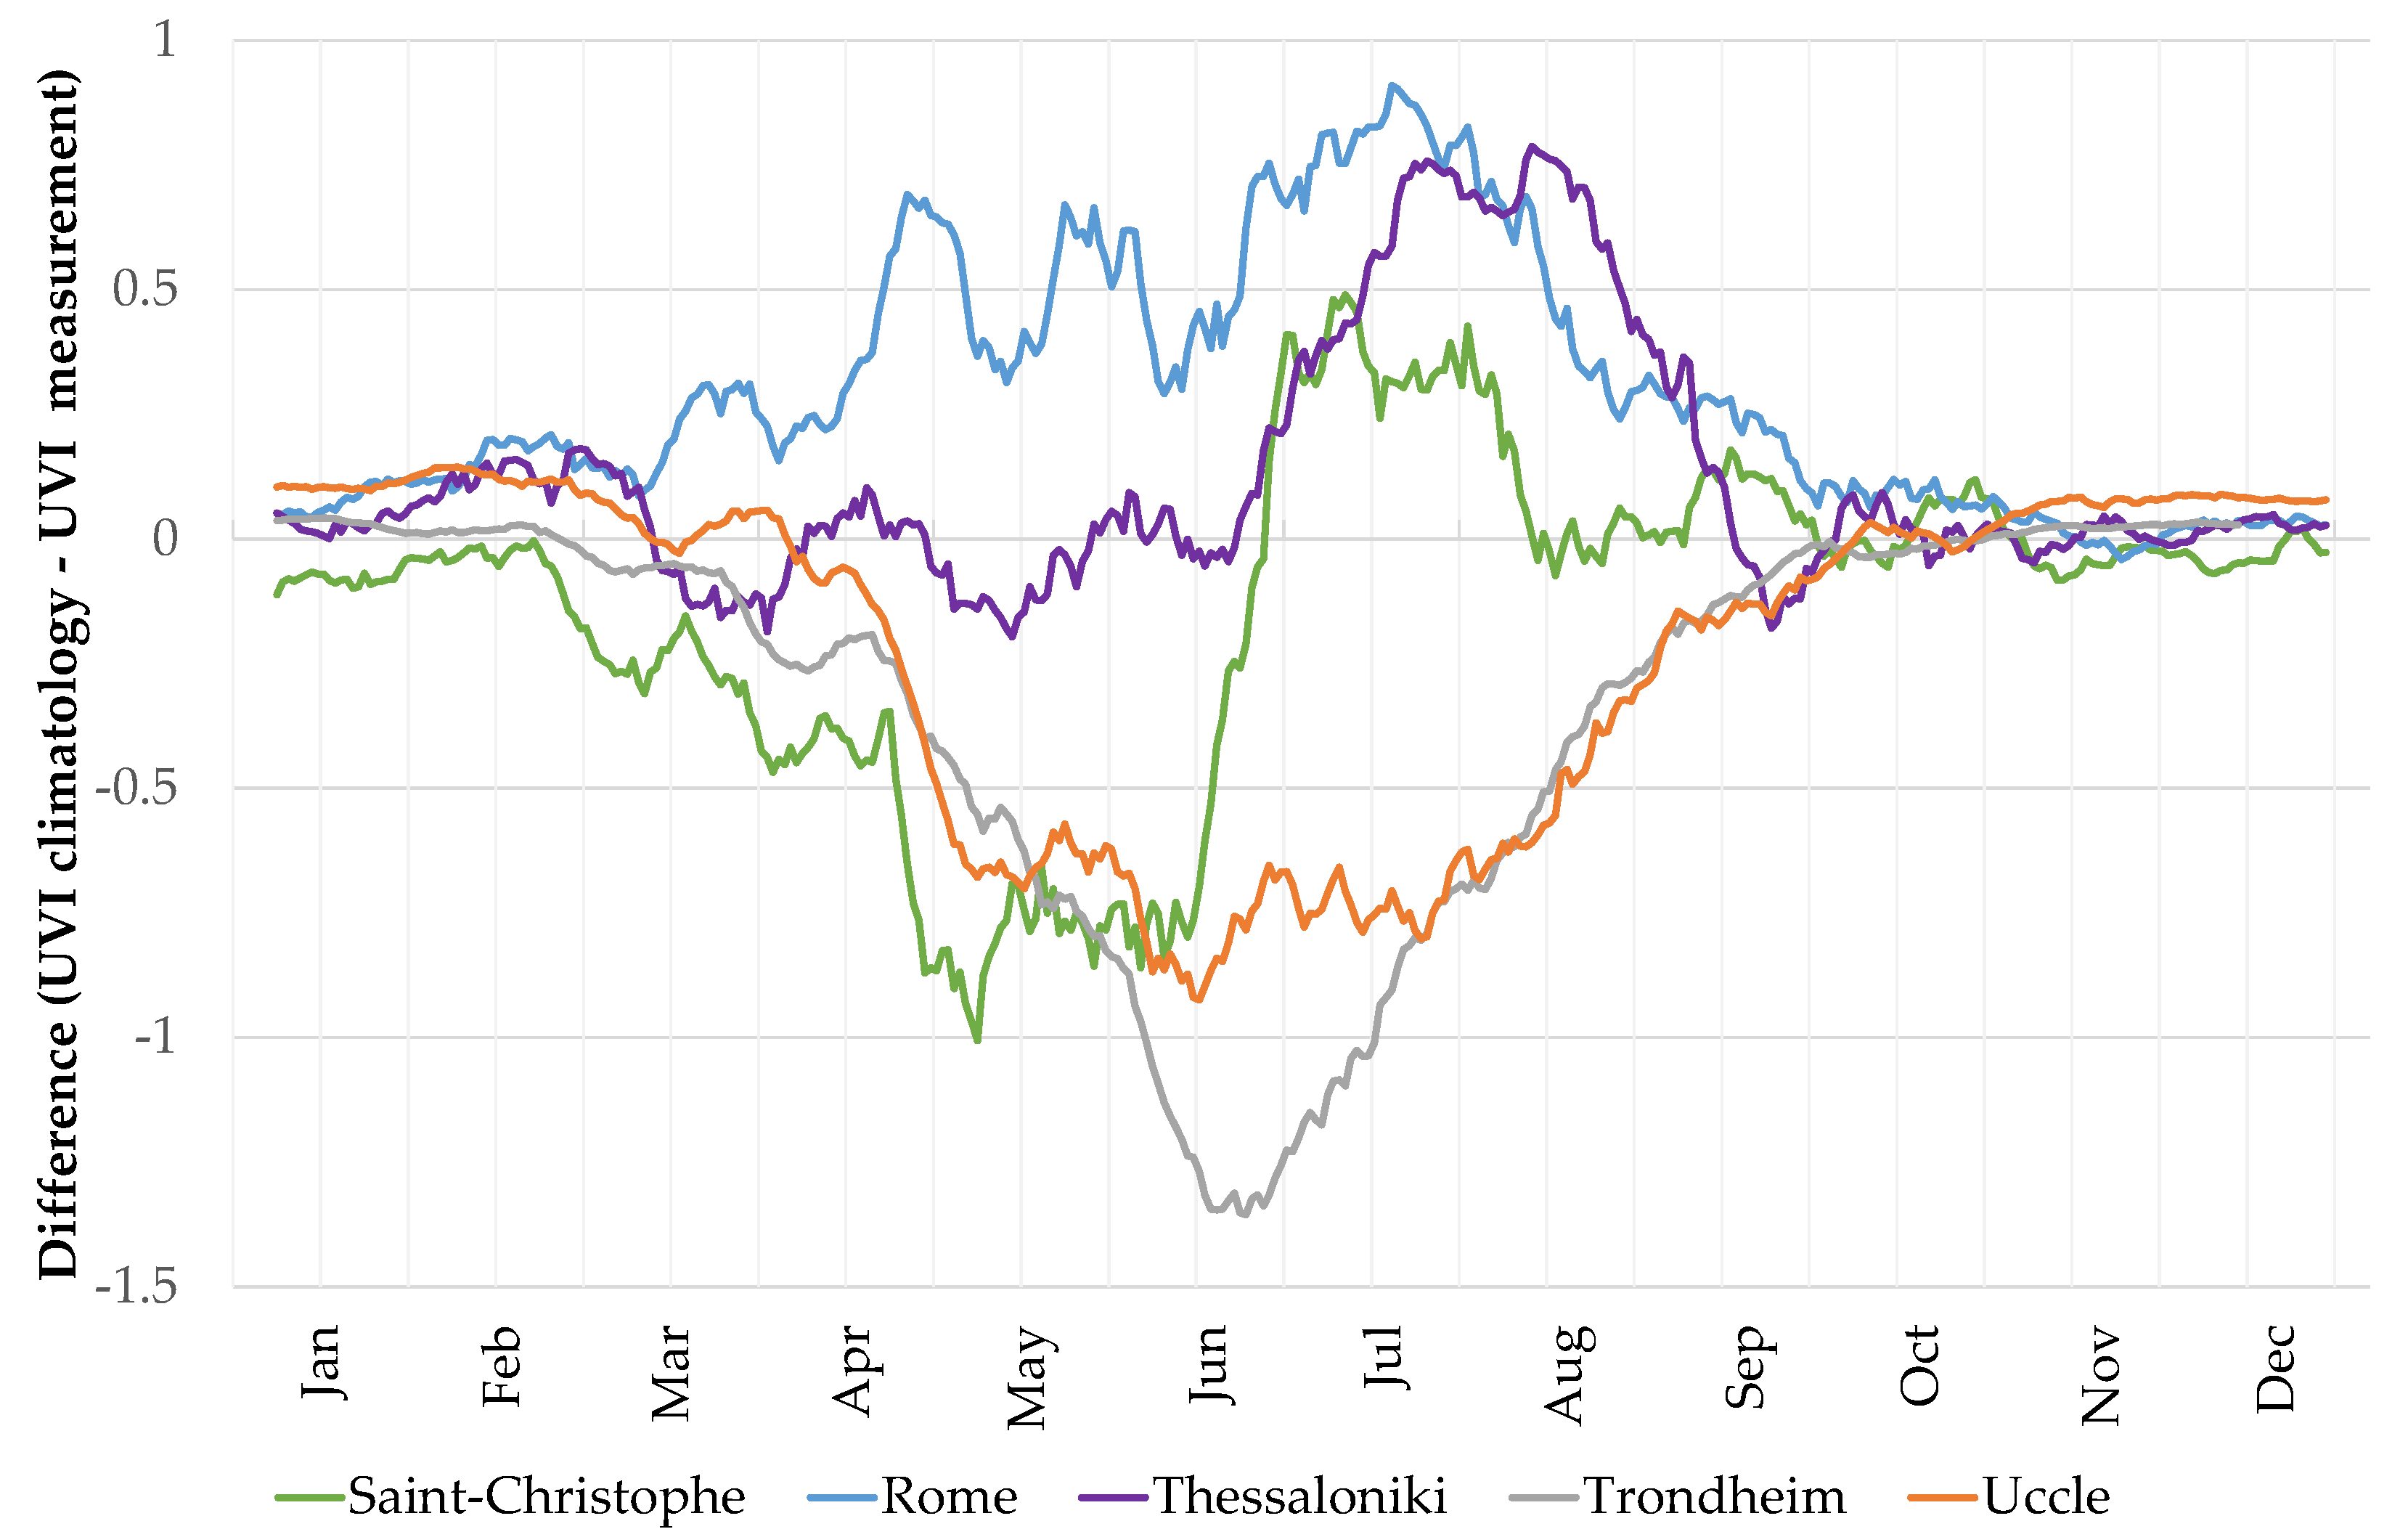
In this section, the UVI measured at the local noon in the sites of Trondheim, Uccle, Saint-Christophe, Rome and Thessaloniki have been compared with the latest eleven-year period of the UVI climatology (2005–2015) based on satellite data. About 7% of the UVI values of the climatology in Uccle and Trondheim, about 8% in Thessaloniki and about 9% in Rome and Saint-Christophe differ from the measured UVI by more than 1 unit. In Figure 10, the mean differences between the UVI climatology and the measurements are presented as smoothed averages for a ±7 days window. The differences show a different behaviour for the sites in the north of the Alps, the site in the Alps and the sites in the south of the Alps. In the south, the UVI climatology provides values that are on average overestimated. In Rome there are the strongest effects in the period April to July. The UVI of the climatology are also overestimated in Thessaloniki for the period June to September. In the Alps in Saint-Christophe, there is a switch between underestimation and overestimation in the middle of the year in June. The UVI are underestimated in Saint-Christophe in the first half of the year with strongest effects in May, the UVI are overestimated in the period July to Mid-August. The sites in the north of the Alps Trondheim and Uccle show an underestimation of the UVI of the climatology compared to ground-based measurements with strongest underestimation in the period May to August in Uccle and June to July in Trondheim.
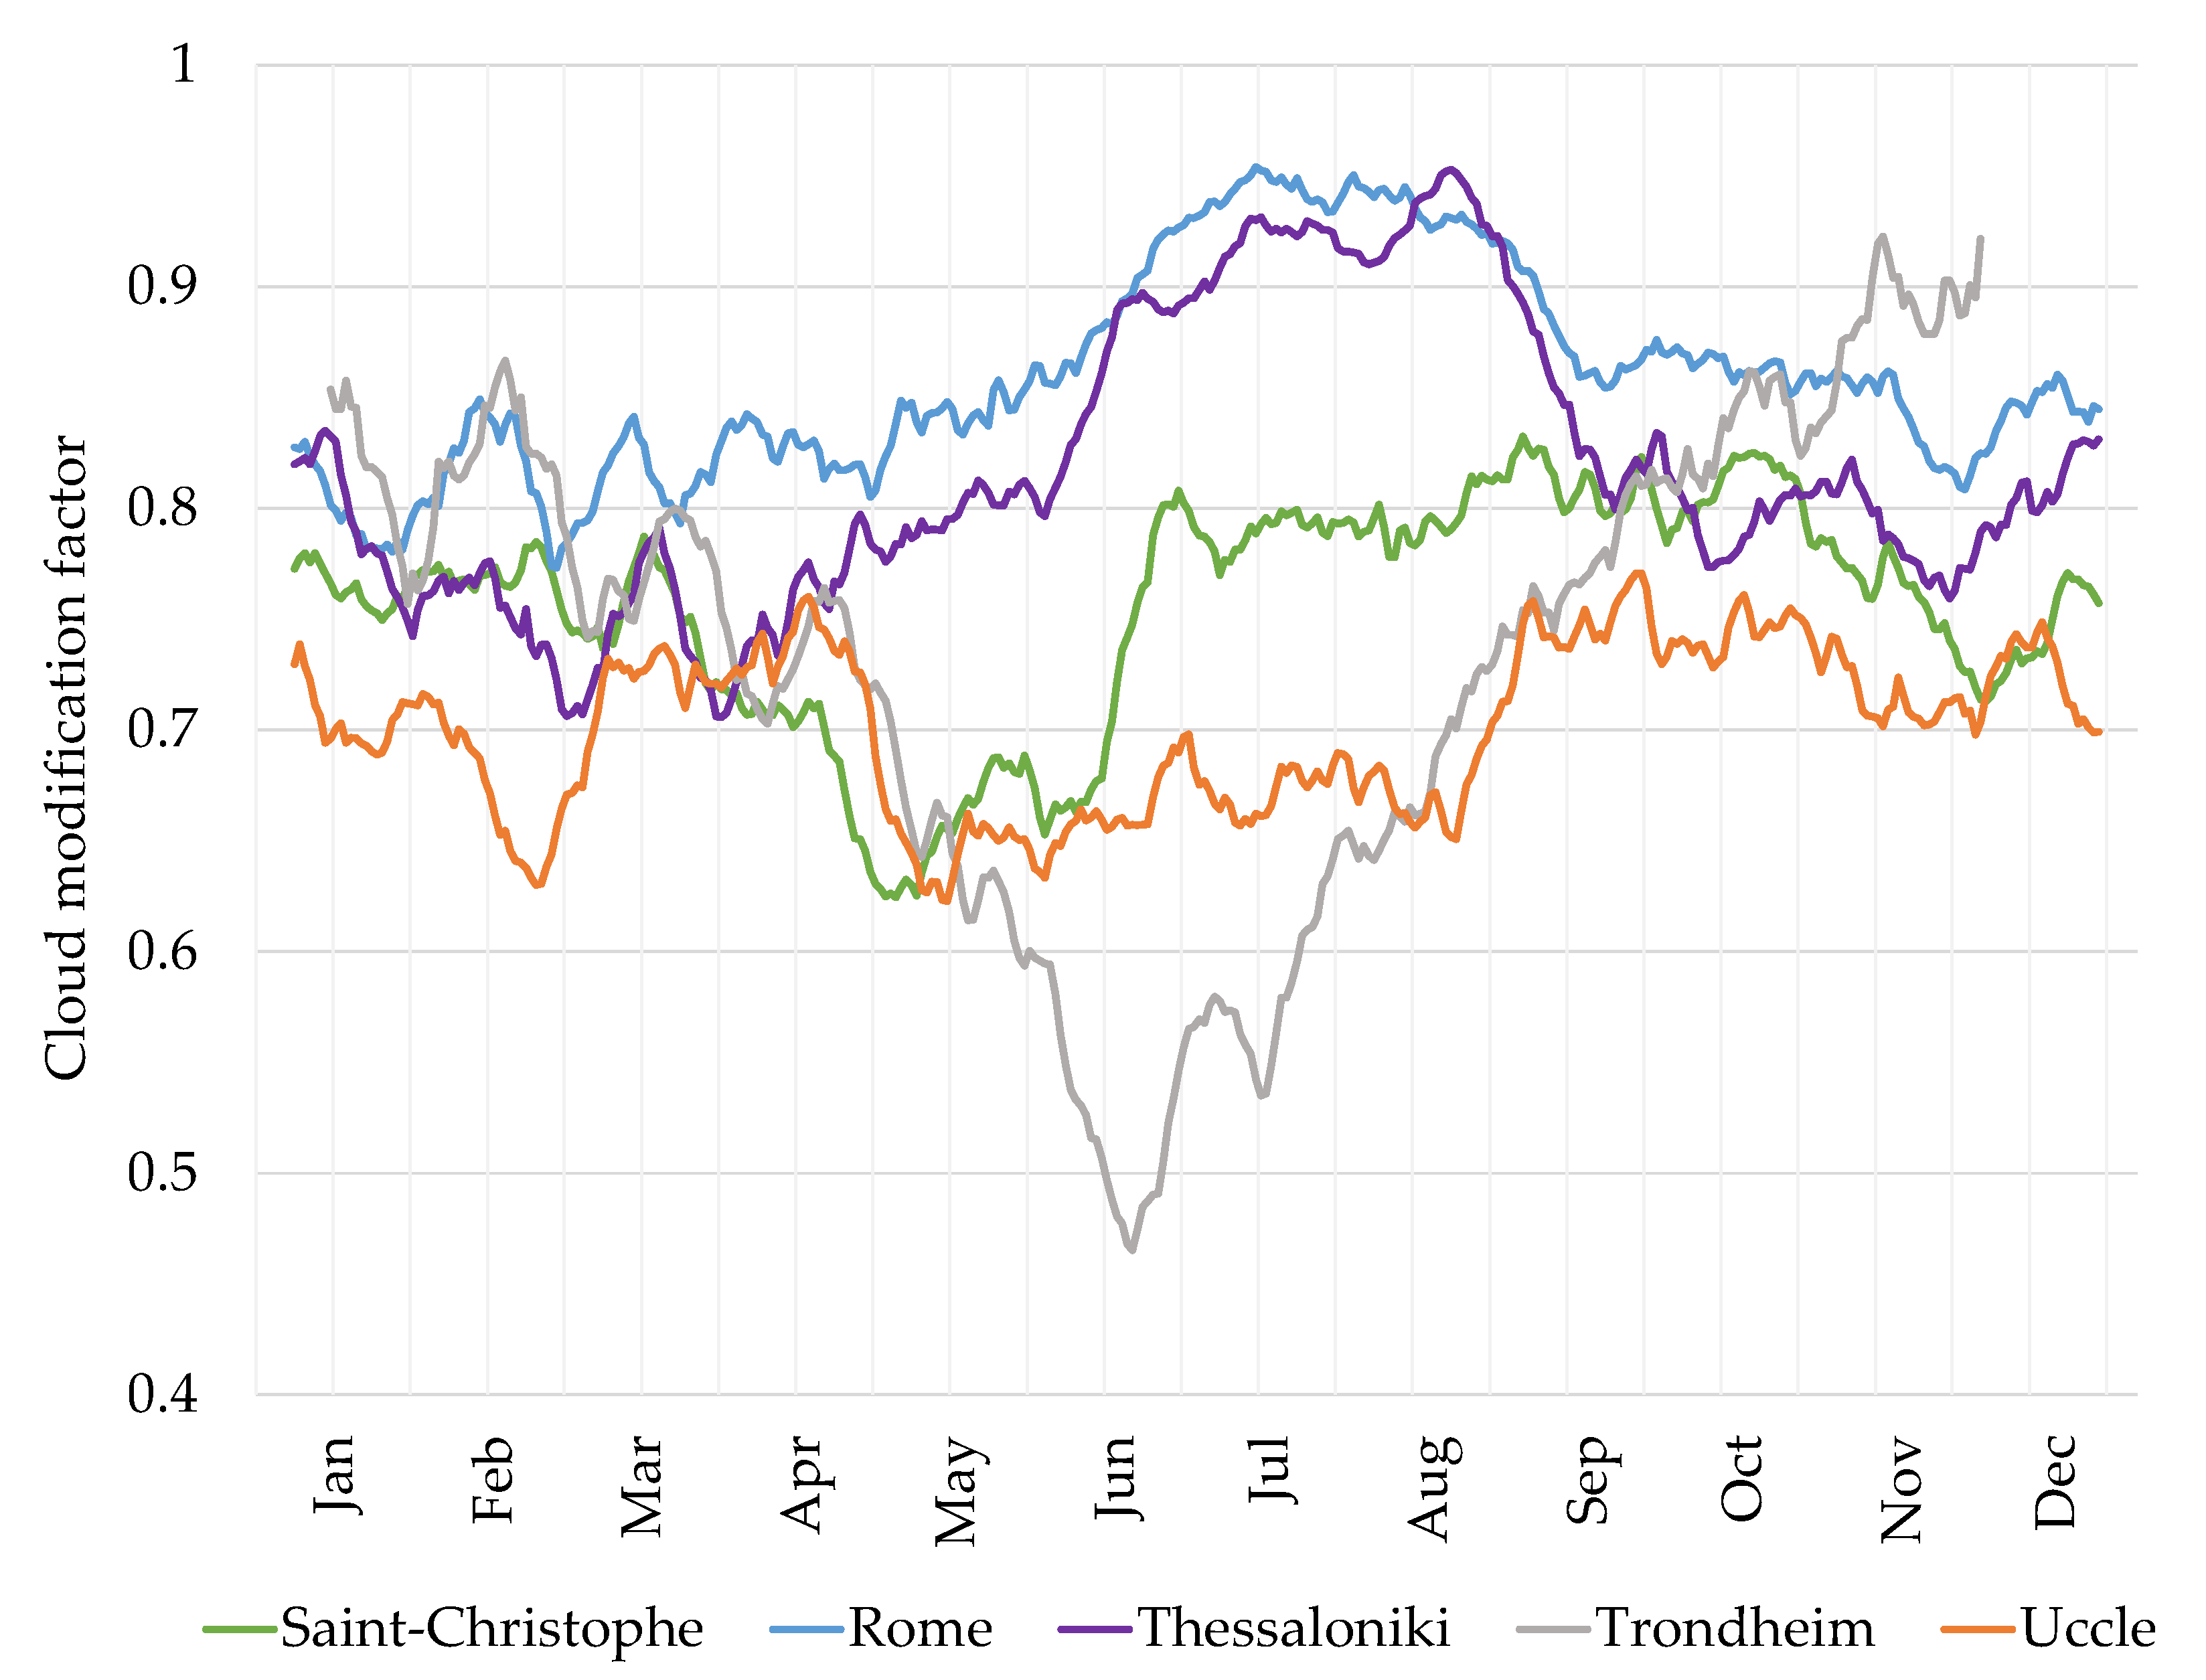
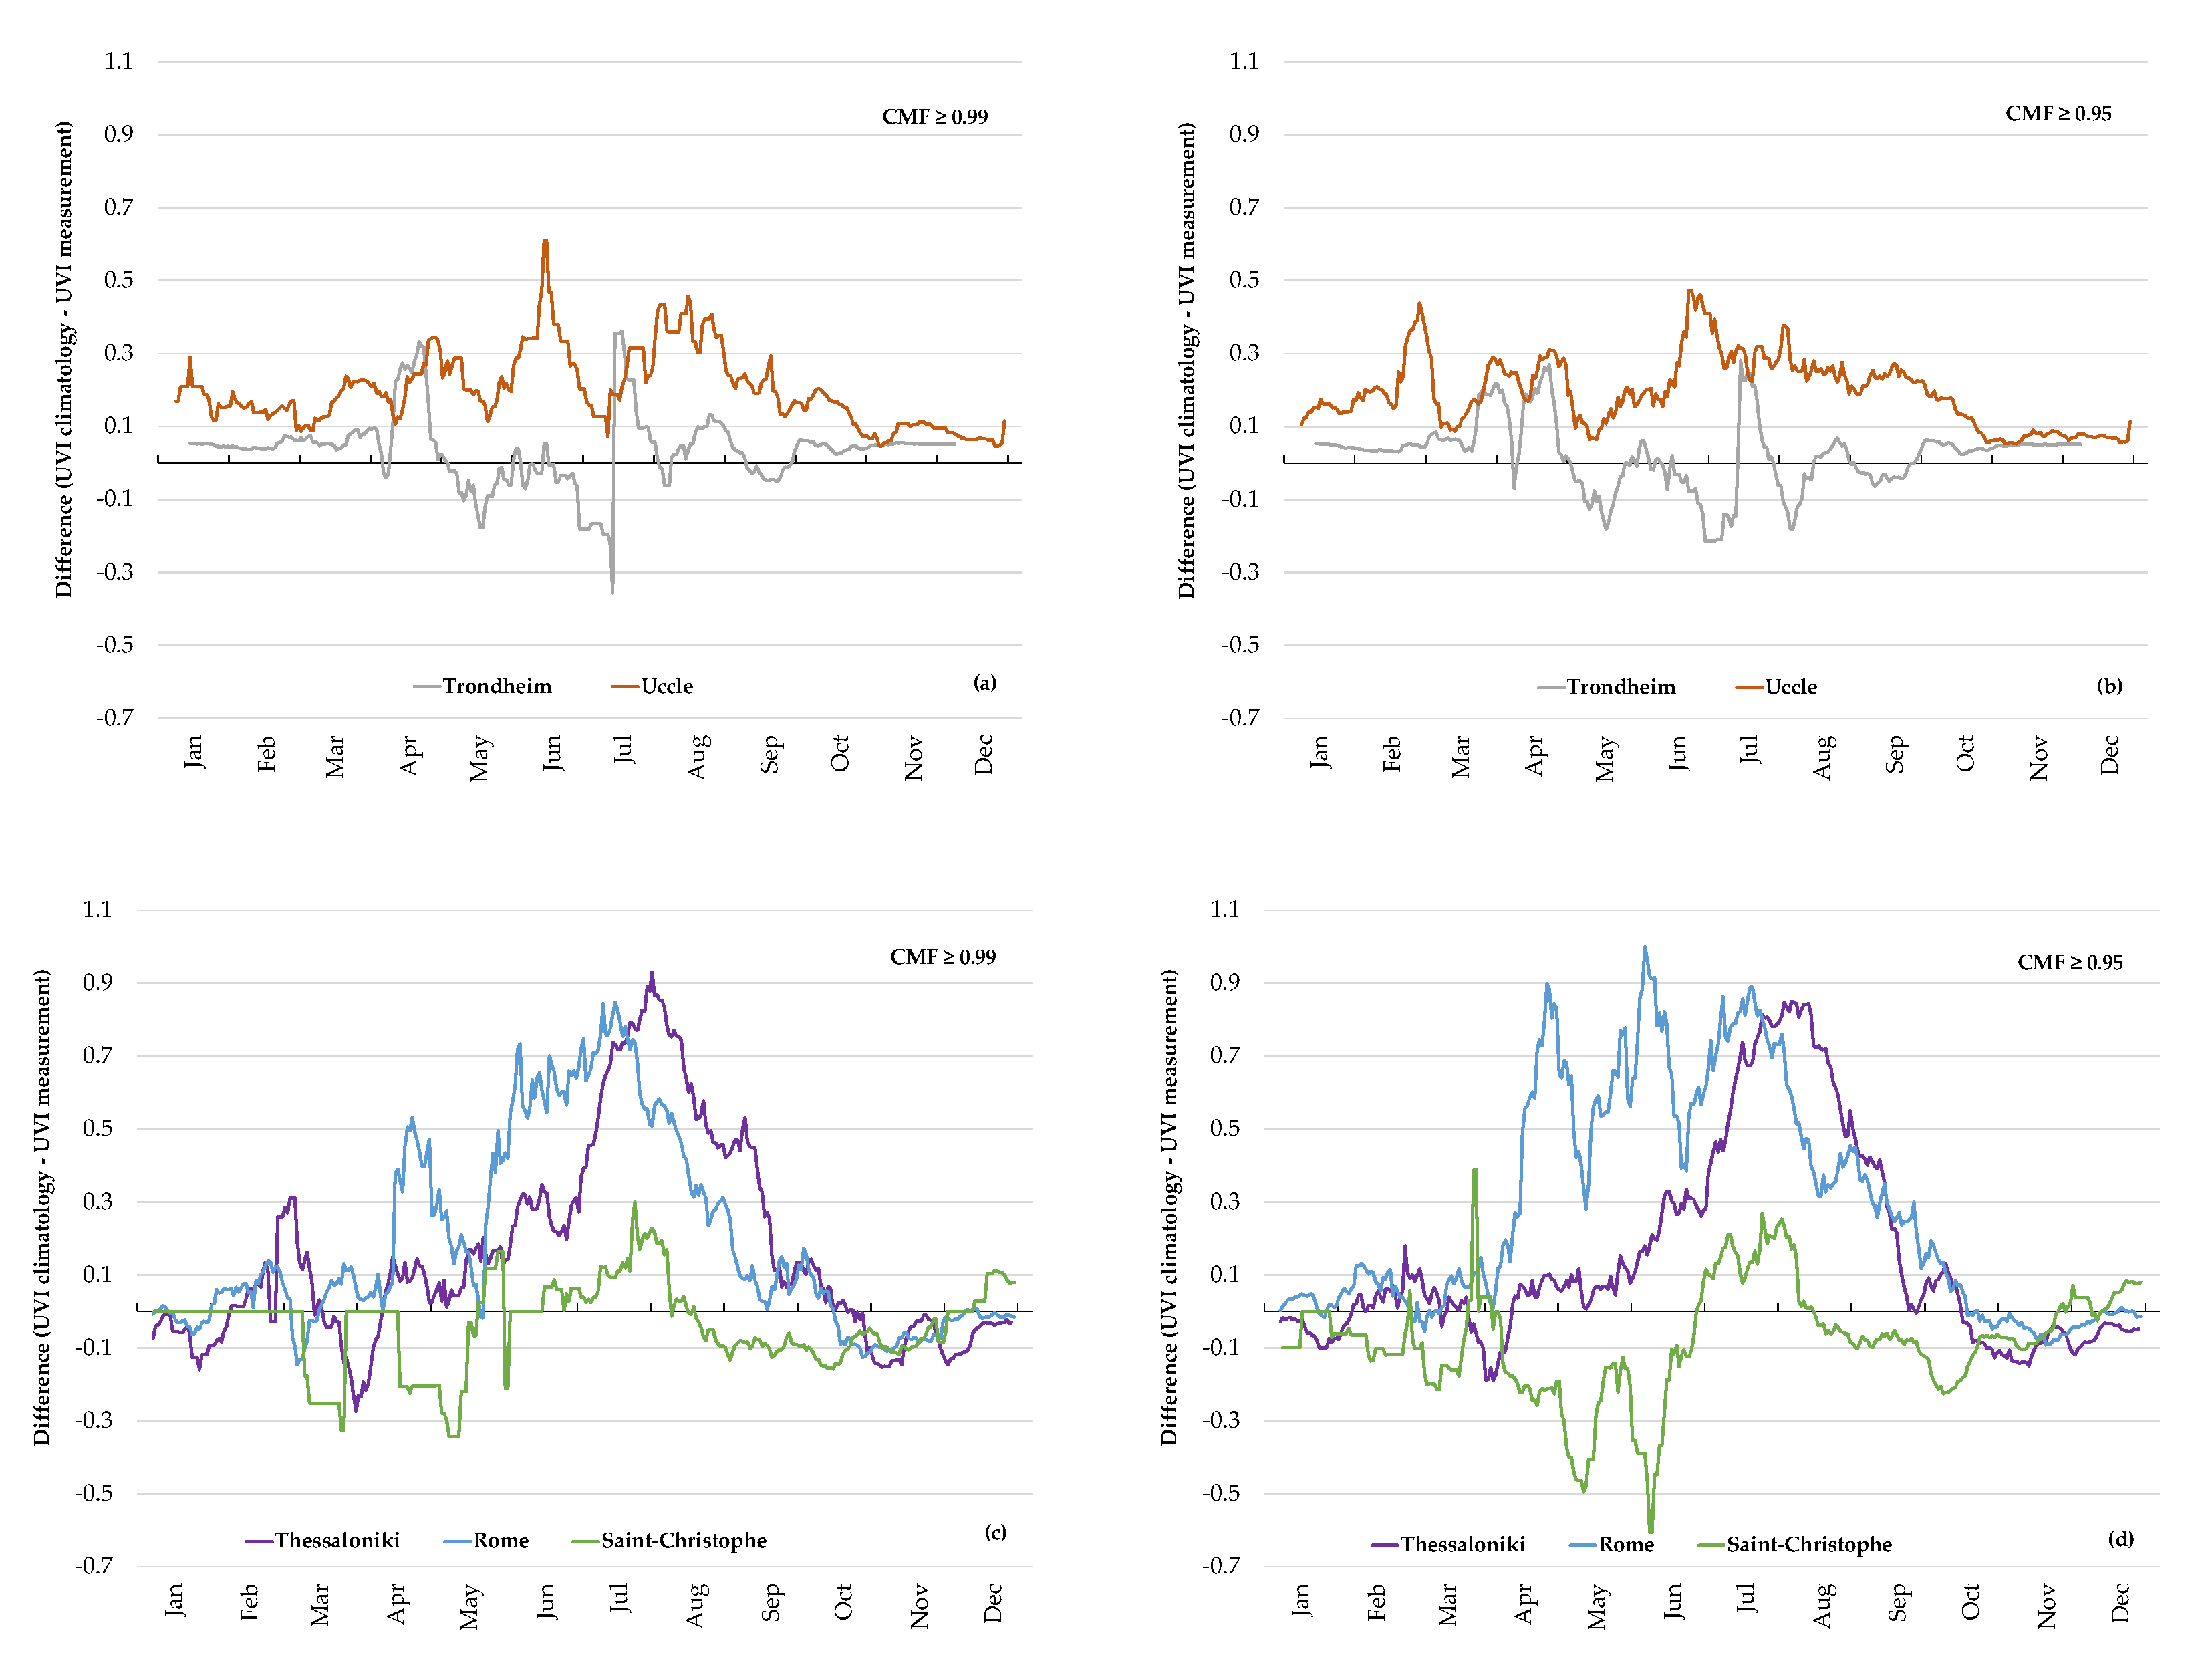
In order to find an indication whether or not these differences are mainly caused by the cloud information used to modify the UVI c l e a r s k y , the cloud modification factor CMF of the sites are plotted as smoothed averages for a ±7 days window in Figure 11. The annual course of the smoothed CMFs shows a similar shape as the differences between the climatological UVI and the measured UVI, if it is related to a CMF of about 0.75. Less cloud modification, that is, greater values of the CMF, correspond to UVI overestimation. A cloud modification stronger than 0.75, that is, lower values of the CMF, are in accordance with an UVI underestimation. Additionally, the mean difference between the noon UVI from the climatology and the UVI measurements are shown for all days with (nearly) clear sky in Figure 12. CMF ≥ 0.99 has been chosen to represent almost clear sky conditions. Depending on the local weather conditions at the measurement sites, this condition causes a strong reduction in the number of the available data points. Hence, the selection has been extended to include situations with CMF ≥ 0.95.
On nearly clear sky conditions there is again a non-uniform picture of the mean difference between the noon UVI from the climatology and the UVI measurements in the selected locations. To separate effects of the solar elevation the results have been divided by the mean UVI of each day of the year (not shown in the figure). In Trondheim the smoothed averages of the mean difference on almost clear sky days are located around zero and hence, the cloud modification can be assumed to cause the differences between climatology and measurements of the all-sky UVI. In Uccle the smoothed averages of the mean difference on almost clear sky days are located around a value of about +4.6% related to the UVI c l e a r s k y . This suggests a combination of different factors that influence the difference. There is the overestimation of the clear sky values and this seems to be counterbalanced and turned into an underestimation by the CMF. In Rome (mainly March to September), Thessaloniki (mainly April to September) and Saint-Christophe (mainly in July and the beginning of August) there is an overestimation of the clear sky values, the shape of which remains less changed even after division by the mean UVI of each day of the year. This can be seen as a hint, that there are further influencing factors rather than a constant bias of the UVI c l e a r s k y . In combination with the fact, that there is a large number of days with CMF ≥ 0.95 in Rome and Thessaloniki, the differences of the climatological values compared to the measurements mainly reflect the deficits of the UVI c l e a r s k y based on satellite data, such as inadequate consideration of aerosols, which have been found in other analyses as well [20]. In Saint-Christophe a stronger cloud modification especially in May and the beginning of June seems to increase already existing negative differences of the UVI c l e a r s k y during this time period. In Rome the comparison of the differences for days with CMF ≥ 0.99 and days with CMF ≥ 0.95 reveals an increase of the positive differences in case of CMF ≥ 0.95 mainly in the period April to June, a pattern that is only detected in Rome and the reason for it would need further investigation. The relative deviation in relation to the mean values of UVI exceeds 10% and is larger than all other differences during the course of the summer half of the year.

4. Discussion

In this study, the UVI and UVI c l e a r s k y were analysed for eight selected locations as well as for the European region from 30° North to 65° North and from 25° West to 35° East in a spatial resolution of 0.05° for the time period 1983 to 2015. Several analyses provide insight into the effects of mainly sun elevation, cloud cover and altitude on UVI in Europe. The locations Trondheim, Berlin, Rome and Heraklion illustrate the well-known North-South variation of UVI. There are increasing UVI with decreasing latitude, shown by higher mean and maximum values, a greater number of days within the exposure categories “high” or “very high”, and a more pronounced annual variation of daily mean UVI and UVI c l e a r s k y with maximum values during summertime and minimum values during wintertime. Also the UVI maps for whole Europe on a mean monthly basis illustrate this temporal and spatial distribution of UVI. While the annual course is mainly due to sun elevation, the North-South variation is additionally influenced by the decrease of the total column ozone with decreasing latitude. Also, the aerosol effect is smaller in lower latitudes as a consequence of its dependency on the sun elevation. The higher the sun elevation the shorter is the path, which the UV radiation has to pass through the atmosphere, where it is influenced by absorption and scattering. These results are in accordance with UV climatologies from other regions such as the United States and Canada [26] or Australia [50]. As can be concluded from the validation with ground-based measurements, a smaller aerosol effect in lower latitudes is very likely not valid for big southern cities such as Rome and Thessaloniki. Because of the higher urban aerosol loads in these areas the satellite-based UVI tend to be overestimated there.
In accordance with a lower effective cloud albedo, there is less reduction of UVI compared to UVI c l e a r s k y in southern parts of Europe than in higher latitudes, where UVI can be markedly reduced by clouds especially during the summer months. In all cases, the absolute reducing effect of cloudiness depends on sun elevation and on UVI value. It is greater for high values of UVI than for low values. This is in accordance with the fact that cloud reduction can be appropriately described by multiplication of UVI c l e a r s k y with a cloud modification factor [38]. As a known problem of satellite data, the retrievals are less accurate over mountainous sites [51] and the reducing effect of clouds might be overestimated over undetected snow-covered regions, which is relevant in winter or on high mountains [52]. Within the Alps, misdetection of snow cover can also be a problem in spring, or even summer, because only the visible channels of SEVIRI (Spinning enhanced visible and infrared imager) are used and the contrast can be very low. Parallax can also affect the snow-covered geographical distribution from the geostationary satellite. In valley sites, shadows can also cause misdetection, as well as low clouds (only affecting low-altitude sites) or fair-weather clouds (only affecting high-altitude sites). In this respect, even the 0.05° × 0.05° resolution could still be too coarse for Alpine valleys. The effect of aerosols on UV radiation is parameterised in the calculation of UVI, which is a basic limitation of the used satellite data. The known deficits of satellite data also come to light by comparison of the calculated UVI with the measured UVI. In regions and time periods during the course of the year, that are characterized by strong cloudiness, the climatological UVI are found to be underestimated. In contrast, in regions and time periods during the course of the year, that are characterized by little cloudiness, the climatological UVI are found to be overestimated. The latter is possibly related to the use of climatological aerosol information, that might be inadequate for the setting of the measurement site. The validation for Rome and Saint-Christophe for the period 2005–2015 provides very similar results as a comparison with another satellite UVI product at this locations for the period 2012–2015 [20].
Monthly boxplots for each location provide information about regional differences in the variability of UVI, showing maximum variability in Northern and Central Europe in summer, where in Southern Europe this basically occurs in spring. These regional differences in the variability of UVIs are mainly a result of the regional differences in cloudiness. This has also been found for ground based UVI observations in Barcelona 1999–2012 [53].
UVI is known to increase with increasing altitude. However, the representation of the altitude effect depends on the elevation model which is used for the calculation. The original dataset UVI c l e a r s k y (spatial resolution of 0.25° × 0.25°) was recalculated on the basis of the elevation model of DWD with a spatial resolution of 0.05° × 0.05° to better represent topography, such as high peaks in the Alps, Pyrenees or Carpathians. The UVI maps for whole Europe on a mean monthly basis illustrate that the regions of higher altitude show higher UVI values than lower lying surrounding areas. During winter months, this is a combined effect of higher UVI with increasing altitude and a reinforcing effect of snow and ice on UV radiation. During summer months, there are lower mean UVI at the regions which are northerly bordering on the Alps, Carpathians, Pyrenees and the north coast of Spain due to a high cloud cover reducing UV radiation in the atmosphere. Additionally, the effect of altitude was shown for three Central European locations and two Southern European locations. In both cases, a distinct increase of UVI with increasing altitude was detected. The median UVI of Zugspitze is 15.4% higher than at Schauinsland, and 20.0% higher than in Munich with height differences of 1 756 m and 2 467 m, respectively. Madrid even shows an increase of 12.8% of UVI and 16.7% of UVI c l e a r s k y compared to the median of Rome, which is 607 m lower (Table 3). Deviations from theoretical values of the altitude effect can partly be attributed to reasons related to the atmospheric conditions such as an usually stronger cloudiness in mountainous regions, an usually higher aerosol load in urban regions or differences in surface albedo (for instance caused by long-lasting dry weather conditions) and partly to non-meteorological reasons such as deviations from true topography caused by the elevation model.
With a special focus on user-oriented presentations both the relative frequency of the WHO exposure categories moderate, high and very high UVI is provided based on ten-day means for each month as well as the total number of days per month exceeding the threshold values UVI = 3, 6 and 8. As expected, the latter decrease with increasing latitude. The relative frequency diagrams of the higher elevation sites, such as Schauinsland and Zugspitze, show a higher frequency of the UVI categories high and very high compared to a site at a lower elevation, such as Munich. The results for Rome are similar to the categories published for the comparable situated site of Barcelona (41.2° N, 12 m) [53].
The difference between the decades mean UVI of 2006–2015 compared to 1983–1992 was analysed with respect to changes. All locations, except the Northern European site, show an increase of UVI in the annual mean, which is mainly driven by an increase during spring and early summer months. Also an increase of UVI c l e a r s k y is detected, except the Northern European site and the most Southern European location. With respect to northern high latitude locations (59°–71° N) in Finland and Northern America decreases in surface UV-B radiation based on measurements have also been reported for the time between 1980 and 2011 [54]. They concluded that the observed negative long term trend in the UV-B wavelength could be attributed to the positive trend in total ozone, as the UV radiation at 325 nm, AOD and cloudiness did not have significant long term trends. Also, an analysis of the erythemal UV doses in Southern UK (Chilton) for the time period 2004–2015 showed a statistically significant decrease due to increasing total ozone, while the trend was less associated with changes in cloud cover and aerosol optical depth [55]. As the impact of aerosols is only implicitly and temporally independent included in the retrieval of the UVI c l e a r s k y , the European “brightening” effect cannot directly be represented. Therefore the increase of UVI c l e a r s k y is connected to the changes in ozone content in the atmosphere during these months. This can be caused by both the ozone depletion and a higher frequency of weather situations with southerly flow bringing air masses with lower ozone content to these locations [36,56]. The additional increase of UVI compared to UVI c l e a r s k y indicates a further impact of reduced cloud cover during the spring and early summer months, which would also corroborate the latter hypothesis to some extent. The magnitude of the increase of UVI in the annual mean is 0.1–0.4% per year. In contrast, broad-band measurements over Belsk, Poland indicate that the erythemal irradiance remained relatively stable after the mid-2000s [57]. Stratospheric ozone levels are projected to be further altered due to climate change by alterations of stratospheric temperatures and circulation patterns which in turn would affect solar UV radiation [58]. In principle the findings are in line with an earlier study of the period 1980 to 2006 which states on the basis of UV radiation reconstruction models and ground-based measurements that on average, two thirds of the total change can be attributed to clouds, and one third to ozone change [59], though that study found an increase of erythemally weighted UV irradiance of 0.3% to 0.6% per year.

5. Conclusions

A satellite-derived UVI climatology in high spatial resolution of 0.05° has been developed for Europe for the time period 1983 to 2015. The results confirm fundamental features of UVI depending on sun elevation, cloud cover and altitude over the entire investigation area and for single locations in different user-oriented applications. The long term UVI data can be used for various health related applications, assessments and planning. The UVI climatology is intended to provide practitioners and planners with information about usually expectable UVI. Resulting applications in every day life benefit from a completion by ground-based measurements and by daily updated forecasts of the UVI taking into account the actual atmospheric conditions. The application of the UVI climatology ranges from employer information about the frequency of days when UV protection is required or is a must, to health resort information about the actinic conditions and epidemiological investigations. The UVI offers an advantageous tool, as it evaluates health risks of UV radiation exposure, it combines simple numbers with behavioral strategies and sun protection advice, and it is globally consistently used. Further applications of the UVI climatology can comprise the provision of information for recreation and tourism in Europe in terms of valuable information about UV radiation induced health risks at holiday destinations. Especially tourists from higher latitudes visiting southern countries often underestimate the UV radiation at their destination, and often risk severe sun burn due to incautious behavior and insufficient sun protection. Hence, the UVI climatology can be used to support health related travel behavior. As UVI is aimed at the prevention of skin cancer and other negative implications of UV radiation exposure, the UVI climatology can even be more generally applied for educational information about health threatening risks of UV radiation.
The data set provides a basis for further detailed analyses concerning the variability of UVI, trend and its influencing factors such as ozone or clouds. The calculation of this UVI climatology based on satellite products has the great advantage of spatial comprehensive coverage. Users need to be aware that the lack of detailed knowledge of influencing parameters at specific locations limits accuracy. In principle known sources of uncertainty are the use of a fixed altitude effect, a climatological albedo effect, an implicit and time independent consideration of aerosol effects and the problems of satellite based cloud detection in regions with snow or ice. A comparison of overlapping time periods with an existing more sophisticated climatology or additional measurements could allow further insight into the uncertainties, but the possibilities are limited by the availability of these data.
As atmospheric monitoring services in Europe are aimed at long term maintenance the method presented here allows for sustainable and seamless updating the UVI climatology in the future.

Author Contributions

A.M. and G.L. conceived and supervised the research questions, methodology and validations of the results. R.V. analysed and graphically prepared UVI and CAL datasets, G.L. analysed temporal changes and validation. A.F.B., H.D., I.F., A.-M.S. provided quality-controlled/quality-assured ground-based spectral UV measurements. All authors contributed in writing the paper. All authors have read and agreed to the published version of the manuscript.

Funding

This research received no external funding.

Acknowledgments

Special thanks to the Tropospheric Emission Monitoring Service TEMIS, the European Organisation for the Exploitation of Meteorological Satellites EUMETSAT and the Tropospheric Emission Monitoring Internet Service CM SAF for providing free access to long term data sets of various atmospheric satellite data products, which were used in this study. Special thanks also to the contributors—the Royal Meteorological Institute of Belgium and the Norwegian Radiation Protection Authority—to the UVI database established under the COST-713 Action “UV-B Forecasting” and to the host of this DB, the Finnish Meteorological Institute, for the provision of long-term UVI data on the basis of spectral and multiband UV measurements.

Conflicts of Interest

The authors declare no conflict of interest.

Abbreviations

The following abbreviations are used in this manuscript:
AODAerosol optical depth
CALEffective cloud albedo
CMFCloud modification factor
CM SAFSatellite Application Facility on Climate Monitoring
DWDDeutscher Wetterdienst
EUMETSATEuropean Organisation for the Exploitation of Meteorological Satellites
ICNIRPInternational Commission on Non-Ionizing Radiation Protection
KNMIRoyal Netherlands Meteorological Institute
MVIRIMeteosat visible and infrared imager
SDISurface incoming direct irradiance
SEVIRISpinning enhanced visible and infrared imager
SISSurface incoming solar radiation
SRISpectrally resolved irradiance
SZASolar zenith angle
TEMISTropospheric Emission Monitoring Internet Service
UNEPUnited Nations Environment Programme
UVIUV-Index
UVUltraviolet
WHOWorld Health Organization
WMOWorld Meteorological Organization

References

  1. Damiani, A.; Cordero, R.R.; Cabrera, S.; Laurenza, M.; Rafanelli, C. Cloud cover and UV index estimates in Chile from satellite-derived and ground-based data. Atmos. Res. 2014, 138, 139–151. [Google Scholar] [CrossRef]
  2. National Radiological Protection Board. Health Effects from Ultra-Violet Radiation: Report of an Advisory Group on Non-Ionising Radiation; Documents of the NRPB; Public Health England: London, UK, 2002; pp. 13–19. [Google Scholar]
  3. Slaper, H.; Velders, G.J.M.; Daniel, J.S.; Degruijl, F.R.; Vanderleun, J.C. Estimates of ozone depletion and skin cancer incidence to examine the Vienna convention achievements. Nature 1996, 384, 256–258. [Google Scholar] [CrossRef] [PubMed]
  4. Calbó, J.; Pagès, D.; González, J.-A. Empirical studies of cloud effects on UV radiation: A review. Rev. Geophys. 2005, 43. [Google Scholar] [CrossRef] [Green Version]
  5. Holick, M.F. Sunlight, UV-Radiation, Vitamin D and Skin Cancer: How Much Sunlight Do We Need. In Sunlight, Vitamin D and Skin Advances in Experimental Medicine and Biology; Reichrath, J., Ed.; Springer: New York, NY, USA, 2008; Volume 624. [Google Scholar] [CrossRef]
  6. Lityńska, Z.; Köpke, P.; De Backer, H.; Gröbner, J.; Schmalwieser, A.W.; Vuilleumier, L. Long term changes and climatology of UV radiation over Europe. In COST Action 726—Final Scientific Report; European Union: Luxembourg, 2012; p. 128. [Google Scholar]
  7. Armstrong, B.K.; Kricker, A. The epidemiology of UV induced skin cancer. J. Photochem. Photobiol. B. 2001, 63, 8–18. [Google Scholar] [CrossRef]
  8. WHO World Health Organization. Global Solar UV Index: A Practical Guide. A Joint Recommendation of the World Health Organization, World Meteorological Organization, United Nations Environmental Programme, and the International Commission on Non-Ionizing Radiation Protection; World Health Organization: Geneva, Switzerland, 2002; ISBN 92-4-159007. [Google Scholar]
  9. CIE International Commission on Illumination. A Reference Action Spectrum for Ultraviolet Induced Erythema in Human Skin; Elsevier Science Publishers: Amsterdam, The Netherlands, 1987; pp. 17–22. [Google Scholar]
  10. WHO World Health Organization. Ultraviolet Radiation. Environmental Health Criteria (EHC) 160; WHO World Health Organization: Geneva, Switzerland,, 1994. [Google Scholar]
  11. WMO (World Meteorological Organization). Assessment for Decision-Makers: Scientific Assessment of Ozone Depletion: 2014; Global Ozone Research and Monitoring Project—Report No. 56; WMO: Geneva, Switzerland, 2014; p. 88. [Google Scholar]
  12. Bais, A.F.; Bernhard, G.; McKenzie, R.L.; Aucamp, P.J.; Young, P.J.; Ilyas, M.; Jöckel, P.; Deushi, M. Ozone-climate interactions and effects on solar ultraviolet radiation. Photochem. Photobiol. Sci. 2019, 18, 602–640. [Google Scholar] [CrossRef] [Green Version]
  13. Staiger, H.; den Outer, P.N.; Bais, A.F.; Feister, U.; Johnsen, B.; Vuilleumier, L. Hourly resolved cloud modification factors in the ultraviolet. Atmos. Chem. Phys. 2008, 8, 2493–2508. [Google Scholar] [CrossRef] [Green Version]
  14. Kelfkens, G.; den Outer, P.N.; Slaper, H. Risks and Ultraviolet Budgets Using Earth Observation (RUBEO): Including a Non-Standard Atmosphere and Geographic Ozone Trend Differences in Risk Assessments; USP-2 01-33, USP-2 Project 4.1/DE-02; Netherlands Remote Sensing Board (BCRS): Delft, The Netherlands, 2001; pp. 1–82. ISBN 90 54 11 378 2. [Google Scholar]
  15. Krzyścin, J.W.; Puchalski, S. Aerosol impact on the surface UV radiation from the ground-based measurements taken at Belsk, Poland, 1980–1996. J. Geophys. Res. 1998, 103, 16175–16181. [Google Scholar] [CrossRef]
  16. Blumthaler, M.; Ambach, W.; Ellinger, R. Increase in solar UV radiation with altitude. J. Photochem. Photobiol. B. 1997, 39, 130–134. [Google Scholar] [CrossRef]
  17. Pfeifer, M.T.; Köpke, P.; Reuder, J. Effects of altitude and aerosol on UV radiation. J. Geophys. Res. 2006, 111, D01203. [Google Scholar] [CrossRef] [Green Version]
  18. Sola, Y.; Lorente, J.; Campmany, E.; de Cabo, X.; Bech, J.; Redano, A.; Martinez-Lozano, J.A.; Utrillas, M.P.; Alados-Arboledas, L.; Olmo, F.J.; et al. Altitude effect in UV radiation during the Evaluation of the Effects of Elevation and Aerosols on the Ultraviolet Radiation 2001 (VELETA-2002) field campaign. J. Geophys. Res. 2008, 113, D23. [Google Scholar] [CrossRef] [Green Version]
  19. Fountoulakis, I.; Bais, A.F.; Fragkos, K.; Meleti, C.; Tourpali, K.; Zempila, M.M. Short- and long-term variability of spectral solar UV irradiance at Thessaloniki, Greece: Effects of changes in aerosols, total ozone and clouds. Atmos. Chem. Phys. 2016, 16, 2493–2505. [Google Scholar] [CrossRef] [Green Version]
  20. Fountoulakis, I.; Diémoz, H.; Siani, A.-M.; Laschewski, G.; Filippa, G.; Arola, A.; Bais, A.F.; De Backer, H.; Lakkala, K.; Webb, A.R.; et al. Solar UV Irradiance in a Changing Climate: Trends in Europe and the Significance of Spectral Monitoring in Italy. Environments 2020, 7, 1. [Google Scholar] [CrossRef] [Green Version]
  21. Schmalwieser, A.W.; Hirschmann, G.; Cabaj, A.; Sommer, R. Method to determine the power efficiency of UV disinfection plants and its application to low pressure plants for drinking water. Water Sci. Technol. Water Supply 2017, 17, 947–957. [Google Scholar] [CrossRef]
  22. Herman, J.R.; Krotkov, N.; Celarier, E.; Larko, D.; Labow, G. Distribution of UV radiation at the Earth´s surface from TOMS-measured UV-backscattered radiances. J. Geophys. Res. Atmos. 1999, 104, 12059–12076. [Google Scholar] [CrossRef]
  23. Ialongo, I.; Arola, A.; Kujanpää, J.; Tamminen, J. Use of satellite erythemal UV products in analysing the global UV changes. Atmos. Chem. Phys. 2011, 11, 9649–9658. [Google Scholar] [CrossRef] [Green Version]
  24. Ziemke, J.; Chandra, S.; Herman, J.; Varotsos, C. Erythemal weighted UV trends over northern latitudes derived from NIMBUS 7 TOMS measurements. J. Geophys. Res. 2000, 105, 7373–7382. [Google Scholar] [CrossRef]
  25. Chen, Y.-C. UV and Aerosol Climatology Based on Simulations and Measurements by Satellites and Ground Station. Ph.D. Thesis, Department of Physics and Technology, University of Bergen, Bergen, Norway, 2012. [Google Scholar]
  26. Fioletov, V.E.; Kimlin, M.G.; Krotkov, N.; McArthur, L.J.B.; Kerr, J.B.; Wardle, D.I.; Herman, J.R.; Meltzer, R.; Mathews, T.W.; Kaurola, J. UV index climatology over the United States and Canada from ground-based and satellite estimates. J. Geophys. Res. 2004, 109, D22308. [Google Scholar] [CrossRef] [Green Version]
  27. Verdebout, J. A satellite-derived UV radiation climatology over Europe to support impact studies. Arct. Antarct. Alp. Res. 2004, 36, 357–363. [Google Scholar] [CrossRef] [Green Version]
  28. Van Geffen, J.; van Weele, M.; Allaart, M.; Eskes, H. Surface UV radiation monitoring based on GOME and SCIAMACHY. In Proceedings of the ENVISAT & ERS Symposium, Salzburg, Austria, 6–10 September 2004. [Google Scholar]
  29. Van Weele, M.; van der A, R.J.; van Geffen, J.; Roebeling, R. Space-based surface UV monitoring for Europe using SCIAMACHY and MSG. In Proceedings of the 12th SPIE International Symposium on Remote Sensing, Bruges, Belgium, 19–22 September 2005. [Google Scholar]
  30. Zempila, M.M.; van Geffen, J.H.G.M.; Taylor, M.; Fountoulakis, I.; Koukouli, M.E.; van Weele, M.; van der A, R.J.; Bais, A.; Meleti, C.; Balis, D. TEMIS UV product validation using NILU-UV ground-based measurements in Thessaloniki. Atmos. Chem. Phys. 2017, 17, 7157–7174. [Google Scholar] [CrossRef] [Green Version]
  31. Van Geffen, J.; van Weele, M.; Allaart, M. TEMIS UV Index and UV Dose MSR-2 Data Products, Version 2. Dataset; Royal Netherlands Meteorological Institute (KNMI): De Bilt, The Netherlands, 2017. [Google Scholar] [CrossRef]
  32. Allaart, M.; van Weele, M.; Fortuin, P.; Kelder, H. An Empirical model to predict the UV-index based on Solar Zenith Angle and Total Ozone. Meteorol. Appl. 2004, 11, 59–65. [Google Scholar] [CrossRef] [Green Version]
  33. Allaart, A.F.; Eskes, H.J. Extended and refined multi sensor reanalysis of total ozone for the perion 1970–2012. Atmos. Meas. Tech. 2015, 8, 3021–3035. [Google Scholar] [CrossRef] [Green Version]
  34. Herman, J.R.; Celarier, E.A. Earth surface reflectivity climatology at 340–380 nm from TOMS data. J. Geophys. Res. 1997, 102, 28003–28011. [Google Scholar] [CrossRef]
  35. Badosa, J.; van Weele, M. Effects of Aerosols on UV Index; KNMI Scientific Report WR-2002-07; Royal Netherlands Meteorological Institute (KNMI): De Bilt, The Netherlands, 2002. [Google Scholar]
  36. Kelfkens, G.; Bregman, A.; de Gruijl, F.; van der Leun, J.; Piquet, A.; van Oijen, T.; Gieskes, W.; Loveren, H.; Velders Guus, J.M.; Martens, P.; et al. Ozone Layer-Climate Change Interactions. Influence on UV Levels and UV Related Effects; Dutch National Research Programme on Global Air Pollution and Climate Change, Report 410 200 112; National Institute for Public Health and the Environment (RIVM): Bilthoven, The Netherlands, 2002; ISBN 90 5851 079 4. [Google Scholar]
  37. Gröbner, J.; Albold, A.; Blumthaler, M.; Cabot, T.; De la Casiniere, A.; Lenoble, J.; Martin, T.; Masserot, D.; Müller, M.; Philipona, R.; et al. Variability of spectral solar ultraviolet irradiance in an Alpine environment. J. Geophys. Res. 2000, 26, 991–1027. [Google Scholar] [CrossRef]
  38. den Outer, P.N.; Slaper, H.; Tax, R.B. UV radiation in the Netherlands: Assessing long-term variability and trends in relation to ozone and clouds. J. Geophys. Res. Atmos. 2005, 110. [Google Scholar] [CrossRef] [Green Version]
  39. Schulz, J.; Thomas, W.; Müller, R.; Behr, H.-D.; Caprion, D.; Deneke, H.; Dewitte, S.; Dürr, B.; Fuchs, P.; Gratzki, A.; et al. Operational climate monitoring from space: The EUMETSAT satellite application facility on climate monitoring (CM-SAF). Atmos. Chem. Phys. Discuss. 2008, 8, 8517–8563. [Google Scholar] [CrossRef] [Green Version]
  40. Cano, D.; Monget, J.M.; Albuisson, M.; Guillard, H.; Regas, N.; Wald, L. A method for the determination of the global solar-radiation from meteorological satellite data. Sol. Energy 1986, 37, 31–39. [Google Scholar] [CrossRef] [Green Version]
  41. Posselt, R.; Mueller, R.W.; Stöckli, R.; Trentmann, J. Remote sensing of solar surface radiation for climate monitoring—The CM-SAF retrieval in international comparison. Remote Sens. Environ. 2012, 118, 186–198. [Google Scholar] [CrossRef]
  42. Hammer, A.; Heinemann, D.; Hoyer, C.; Kuhlemann, R.; Lorenz, E.; Müller, R.; Beyer, H.G. Solar energy assessment using remote sensing technologies. Remote Sens. Environ. 2003, 86, 423–432. [Google Scholar] [CrossRef]
  43. EUMETSAT. Meteosat Solar Surface Radiation and Effective Cloud Albedo Climate Data Record SARAH-2; EUMETSAT: Darmstadt, Germany, 2016. [Google Scholar] [CrossRef]
  44. Fountoulakis, I.; Diémoz, H.; Siani, A.M.; Hülsen, G.; Gröbner, J. Monitoring of solar spectral ultraviolet irradiance in Aosta, Italy. Earth. Sys. Sci. Data Discuss. 2020. accepted. [Google Scholar]
  45. Webb, A.R.; Slaper, H.; Koepke, P.; Schmalwieser, A.W. Know Your Standard: Clarifying the CIE 1140 Erythema Action Spectrum. Photochem. Photobiol. 2011, 87, 483–486. [Google Scholar] [CrossRef]
  46. Hülsen, G.; Gröbner, J.; Nevas, S.; Sperfeld, P.; Egli, L.; Porrovecchio, G.; Smid, M. Traceability of solar UV measurements using the Qasume reference spectroradiometer. Appl. Opt. 2016, 55, 7265–7275. [Google Scholar] [CrossRef] [PubMed]
  47. Johnsen, B. Intercomparison and harmonization of UV Index measurements from multiband filterradiometers. J. Geophys. Res. 2008, 113, D15206. [Google Scholar] [CrossRef]
  48. Schmalwieser, A.W.; Gröbner, J.; Blumthaler, M.; Klotz, B.; De Backer, H.; Bolsée, D.; Werner, R.; Tomsic, D.; Metelka, L.; Eriksen, P.; et al. UV Index monitoring in Europe. Photochem. Photobiol. Sci. 2017, 16, 1349–1370. [Google Scholar] [CrossRef] [PubMed] [Green Version]
  49. Gelaro, R.; McCarty, W.; Suárez, M.J.; Todling, R.; Molod, A.; Takacs, L.; Randles, C.A.; Darmenov, A.; Bosilovich, M.G.; Reichle, R.; et al. The Modern-Era Retrospective Analysis for Research and Applications, Version 2 (MERRA-2). J. Clim. 2017, 30, 5419–5454. [Google Scholar] [CrossRef] [PubMed]
  50. Lemus-Deschamps, L.; Rikus, L.; Grainger, S.; Gies, P.; Sisson, J.; Li, Z. UV Index and UV dose distributions for Australia (1997–2001). Aust. Met. Mag. 2004, 53, 239–250. [Google Scholar]
  51. Cadet, J.-M.; Bencherif, H.; Portafaix, T.; Lamy, K.; Ncongwane, K.; Coetzee, G.J.R.; Wright, C.Y. Comparison of Ground-Based and Satellite-Derived Solar UV Index Levels at Six South African Sites. Int. J. Environ. Res. Public Health 2017, 14, 1384. [Google Scholar] [CrossRef] [PubMed] [Green Version]
  52. UNEP (United Nations Environment Programme). Environmental Effects Assessment Panel: Environmental effects of ozone depletion and its interactions with climate change: Progress report, 2015. Photochem. Photobiol. Sci. 2016, 15, 141–174. [Google Scholar] [CrossRef] [Green Version]
  53. Bech, J.; Sola, Y.; Ossó, A.; Lorente, J. Analysis of 14 years of broadband ground-based solar UV index observations in Barcelona. Int. J. Climatol. 2015, 35, 45–56. [Google Scholar] [CrossRef]
  54. Eleftheratos, K.; Kazadzis, S.; Zerefos, C.S.; Tourpali, K.; Meleti, C.; Balis, D.; Zyrichidou, I.; Lakkala, K.; Feister, U.; Koskela, T.; et al. Ozone and Spectroradiometric UV Changes in the Past 20 Years over High Latitudes. Atmosphere-Ocean 2015, 53, 117–125. [Google Scholar] [CrossRef]
  55. Hunter, N.; Rendell, R.J.; Higlett, M.P.; O’Hagan, J.B.; Haylock, R.G.E. Relationship between erythema effective UV radiant exposure, total ozone, cloud cover and aerosols in southern England, UK. Atmos. Chem. Phys. 2019, 19, 683–699. [Google Scholar] [CrossRef] [Green Version]
  56. Van Dijk, A.; den Outer, P.; Slaper, H. Climate and Ozone Change Effects on Ultraviolet Radiation and Risks: Using a Validating Earth Observation; RIVM-Report 610002001; RIVM: Bilthoven, The Netherlands, 2008. [Google Scholar]
  57. Czerwińska, A.E.; Krzyścin, J.W. Climatological aspects of the increase of the skin cancer (melanoma) incidence rate in Europe. Int. J. Climatol. 2020, 40, 3196–3207. [Google Scholar] [CrossRef]
  58. Lamy, K.; Portafaix, T.; Josse, B.; Brogniez, C.; Godin-Beekmann, S.; Bencherif, H.; Revell, L.; Akiyoshi, H.; Bekki, S.; Hegglin, M.I.; et al. Clear-sky ultraviolet radiation modelling using output from the Chemistry Climate Model Initiative. Atmos. Chem. Phys. 2019, 19, 10087–10110. [Google Scholar] [CrossRef] [Green Version]
  59. Den Outer, P.N.; Slaper, H.; Kaurola, J.; Lindfors, A.; Kazantzidis, A.; Bais, A.F.; Feister, U.; Junk, J.; Janouch, M.; Josefsson, W. Reconstructing of erythemal ultraviolet radiation levels in Europe for the past 4 decades. J. Geophys. Res. 2010, 115, D10102. [Google Scholar] [CrossRef]
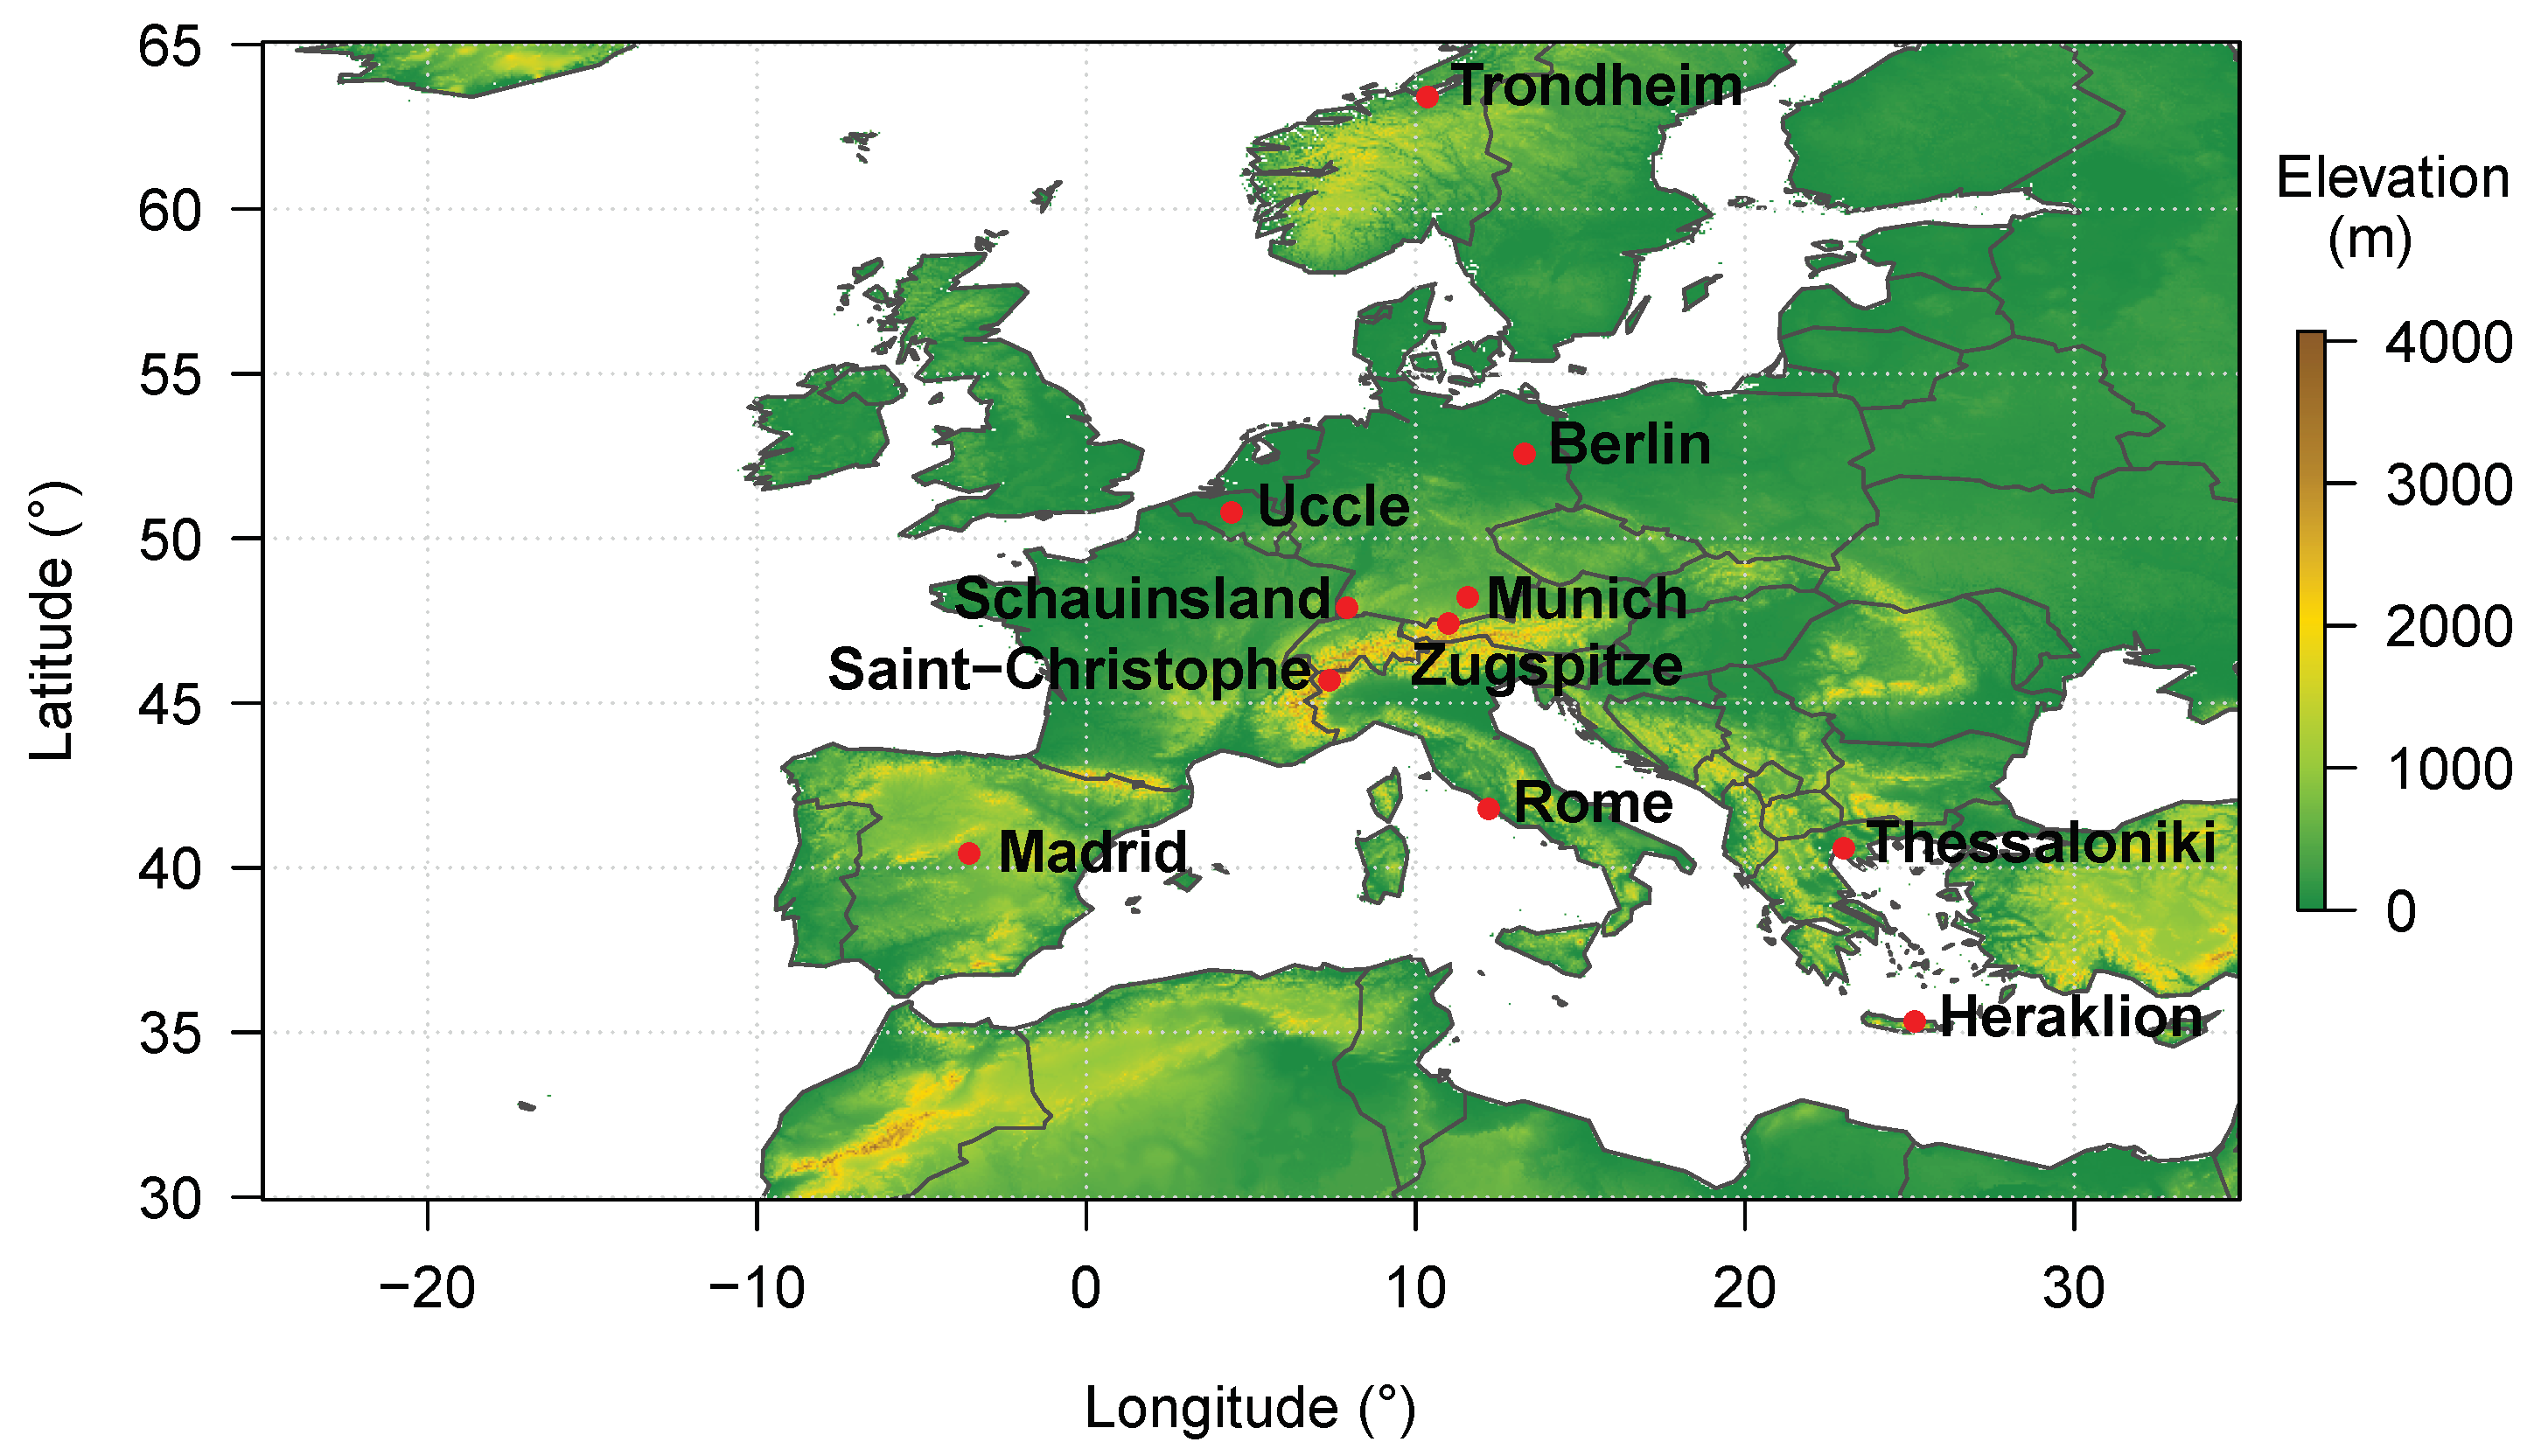
Figure 1. Digital elevation model of Deutscher Wetterdienst for the analysed area of Europe and locations of the selected sites for analysis of satellite-based data (Trondheim, Berlin, Munich, Schauinsland, Rome, Zugspitze, Heraklion, Madrid) and validation with ground-based data (Trondheim, Uccle, Saint-Christophe, Rome, Thessaloniki).
Atmosphere 11 00727 g001
Figure 2. UV radiation exposure categories and recommended sun protection scheme (modified after [8]).
Atmosphere 11 00727 g002
Figure 3. Monthly mean UVI at the local noon over Europe for January until June over the time period 1983–2015 based on satellite data.
Atmosphere 11 00727 g003aAtmosphere 11 00727 g003b
Figure 4. Monthly mean UVI at the local noon over Europe for July until December over the time period 1983–2015 based on satellite data.
Atmosphere 11 00727 g004
Figure 5. Mean course of the year for noontime UVI, noontime UVI c l e a r s k y and cloud albedo (CAL) over the time period 1983–2015 for each location based on satellite data.
Atmosphere 11 00727 g005
Figure 6. Monthly box plots of noontime UVI a l l s k y over the time period 1983–2015 for each location based on satellite data.
Atmosphere 11 00727 g006
Figure 7. Relative frequency of noontime UVI a l l s k y classes based on 10-day decades over the time period 1983–2015 for each location based on satellite data.
Atmosphere 11 00727 g007
Figure 8. Satellite-based absolute number of days per month reaching the noontime UVI a l l s k y classes “moderate” (UVI ≥ 3), “high” (UVI ≥ 6), and “very high” (UVI ≥ 8).
Atmosphere 11 00727 g008
Figure 9. Satellite-based difference of noontime UVI and noontime UVI c l e a r s k y between the time periods 2006–2015 and 1983–1992 based on 10-day means and the annual mean for each location. Statistically significant differences are shown in intense red colour for UVI and intense blue colour for UVI c l e a r s k y (5% significance level).
Atmosphere 11 00727 g009
Figure 10. Mean difference between the noontime satellite-based UVI from the climatology and the noontime ground-based UVI measurements in Saint-Christophe, Rome, Thessaloniki, Trondheim and Uccle during the time period 2005–2015, shown as smoothed averages for a ±7 days window.
Atmosphere 11 00727 g010
Figure 11. Mean cloud modification factors from the noontime satellite-based UVI climatology in Saint-Christophe, Rome, Thessaloniki, Trondheim and Uccle during the time period 2005–2015, shown as smoothed averages for a ±7 days window.
Atmosphere 11 00727 g011
Figure 12. Mean difference between the noontime satellite-based UVI from the climatology and the noontime ground-based UVI measurements in Saint-Christophe, Rome, Thessaloniki, Trondheim and Uccle on nearly clear sky days with cloud modification factor CMF ≥ 0.99 (a,c) and days with CMF ≥ 0.95 (b,d) during the time period 2005–2015, shown as smoothed averages for a ±7 days window.
Atmosphere 11 00727 g012
Table 1. Cloud reduction parameter p as a function of solar zenith angle [38].
Solar Zenith AngleParameter p
25.8–41.40.383
41.4–53.11.07
53.1–63.31.94
63.3–72.53.03
72.5–81.44.40
>81.46.13
Table 2. List of the stations providing ground-based UV measurements, used in this study for the validation of the satellite-based UV-Index (UVI) (Instrument model: Spectroradiometer Type Brewer MKII, MKIV; Spectroradiometer: Bentham DTMc300, Multichannel instrument: Biospherical instruments GUV-541; Data source: 1 Sapienza University of Rome—Physics Department, 2 Regional Environment Protection Agency—Aosta Valley,3 Aristotele University of Thessaloniki—Laboratory of Atmospheric Physics, 4 Finnish Meteorological Institute (host)— COST-713-Database—Royal Meteorological Institute of Belgium, 5 Finnish Meteorological Institute (host)—COST-713-Database—Norwegian Radiation and Nuclear Safety Authority).
Name of theLatitude,SurfaceType ofInstrument(Start ofData
StationLongitude,DescriptionMeasure-ModelMeasurement)/Source
Altitude Ment# SerialAvailability
NumberSince
Rome41.9 °N,urbanspectralBrewer(1992)/1996SUR-PD 1
12.5°E, MKIV #67
60 m
Saint-45.7 °N,semi-rural,spectralDTMc300(2006)/ 2006REPA-AV 2
Christophe7.4°E,alpine #5541
570 mvalley
Thessaloniki40.6 °N,urbanspectralBrewer(1993)/ 1993AUTH-LAP 3
23.0°E, MKIII #86
60 m
Uccle50.8 °N,urbanspectralBrewer(1989)/ 2005FMI-
4.4°E, MKII #16 COST713
100 m DB (RMIB) 4
Trondheim63.4 °N,urbanmultibandGUV-541(1996)/ 2005FMI-
10.4°E, #9274 COST713
70 m DB (NRNSA) 5
Table 3. Daily values of mean maximum, mean minimum and mean UVI and UVI c l e a r s k y at local solar noon, as well as annual mean number of days with UVI ≥ 3, UVI ≥ 6 and UVI ≥ 8 at local solar noon for each location based on satellite data.
Daily ValuesAnnual Values
MeanMeanMedianNumberNumberNumber
SiteMaximumMinimumUVIof Daysof daysof Days
(Latitude, Altitude)[Clear-Sky][Clear-Sky)][Clear-Sky]UVI ≥ 3UVI ≥ 6UVI ≥ 8
Results for different latitudes and similar altitudes
Trondheim2.90.01.13100
(63.42 , 70 m)[4.9][0.1][1.5]
Berlin4.80.32.0112120
(52.57 , 36 m)[6.8][0.4][2.9]
Rome8.30.93.920811038
(41.90 , 60 m)[8.8][1.1][4.6]
Heraklion10.11.25.0239157102
(35.33 , 5 m)[10.3][1.9][6.1]
Results for similar latitudes and different altitudes in Central Europe
Munich6.10.52.5138413
(48.22 , 495 m)[7.9][0.7][3.7]
Schauinsland6.20.42.6141458
(47.91 , 1206 m)[8.4][0.7][4.0]
Zugspitze6.70.63.01545617
(47.42 , 2962 m)[9.4][1.0][4.5]
Results for similar latitudes and different altitudes in Southern Europe
Rome8.30.93.920811038
(41.90 , 60 m)[8.8][1.1][4.6]
Madrid9.11.14.422612968
(40.45 , 609 m)[9.5][1.4][5.3]