Article

Impact of AERI Temperature and Moisture Retrievals on the Simulation of a Central Plains Severe Convective Weather Event

1
Space Science and Engineering Center, University of Wisconsin-Madison, Madison, WI 53706, USA
2
Cooperative Institute for Mesoscale Meteorological Studies, University of Oklahoma, Norman, OK 73072, USA
*
Author to whom correspondence should be addressed.
Atmosphere 2020, 11(7), 729; https://doi.org/10.3390/atmos11070729
Submission received: 22 June 2020 / Revised: 1 July 2020 / Accepted: 3 July 2020 / Published: 8 July 2020
(This article belongs to the Section Meteorology)

Abstract

:
In this study, bias-corrected temperature and moisture retrievals from the Atmospheric Emitted Radiance Interferometer (AERI) were assimilated using the Data Assimilation Research Testbed ensemble adjustment Kalman filter to assess their impact on Weather Research and Forecasting model analyses and forecasts of a severe convective weather (SCW) event that occurred on 18–19 May 2017. Relative to a control experiment that assimilated conventional observations only, the AERI assimilation experiment produced analyses that were better fit to surface temperature and moisture observations and which displayed sharper depiction of surface boundaries (cold front, dry line) known to be important in the initiation and development of SCW. Forecasts initiated from the AERI analyses also exhibited improved performance compared to the control forecasts using several metrics, including neighborhood maximum ensemble probabilities (NMEP) and fractions skill scores (FSS) computed using simulated and observed radar reflectivity factor. Though model analyses were impacted in a broader area around the AERI network, forecast improvements were generally confined to the relatively small area of the computational domain located downwind of the small cluster of AERI observing sites. A larger network would increase the spatial coverage of “downwind areas” and provide increased sampling of the lower atmosphere during both active and quiescent periods. This would in turn offer the potential for larger and more consistent improvements in model analyses and, in turn, improved short-range ensemble forecasts. Forecast improvements found during this and other recent studies provide motivation to develop a nationwide network of boundary layer profiling sensors.

1. Introduction

Severe thunderstorms and tornadoes (hereafter referred to as severe convective weather, SCW) are among the most spectacular of natural phenomena and have attracted the interest of observers for millennia. SCW also poses a significant risk to life and property. While advances have been made in the prediction of SCW over the past decade, due in large part to advances in numerical weather prediction (NWP) models and data assimilation (DA), significant challenges remain. Forecasters increasingly depend on guidance from NWP models, and continued improvements in the sophistication, accuracy and computational efficiency of these models will be necessary if forecasts are to continue to improve.
Progress toward these ends can be met in numerous ways, from increases in model resolution and more realistic physics [1], through the development of new DA algorithms [2], and through the inclusion of new observation types in the data stream that drives the DA. More effective DA methods that can take better advantage of cloud and thermodynamic information contained in remote-sensing observations from radar and satellite platforms are important because improved initialization datasets help constrain the evolution of the subsequent NWP forecast. Given the chaotic nature of flow at convective scales (and the corresponding rapidity with which error growth occurs and spreads upscale), increasing the accuracy of the initial conditions (i.e., properly resolving atmospheric flows on multiple scales) is crucial to obtaining more reliable forecasts [3,4,5], particularly for the shorter lead times (<6 h) important to forecasters making watch/warning decisions. This is especially true for ensemble forecasts, from which it is possible to generate probabilistic guidance whose reliability can be quantified and assessed. Narrowing the gap between NWP forecast production and operational decision making and, ultimately, closing the gap entirely, has been the goal of Warn-on-Forecast (WoF) during the past decade [6,7]. Within the past four years, a prototype WoF system (WoFS) has been developed and refined [8,9]. WoFS is capable of assimilating conventional and remotely-sensed observations at high frequency (every 15 min) and produces hourly ensemble analyses and forecasts at storm-scale resolution (grid spacing of 3 km). In this research, we employ the Weather Research and Forecasting Model (WRF) [10] in concert with the Data Assimilation Research Testbed (DART) [11] ensemble adjustment Kalman filter in a configuration that captures many of the essential features of the WoFS. Compared to variational techniques, the ensemble Kalman filter is a particularly attractive option for mesoscale DA, as it is able to provide ensemble estimates of the forecast error covariance that evolve in time (i.e., flow-dependence). With high spatial resolution, rapid cycling, and ensemble forecast capability, the WRF-DART system is well equipped to ascertain the impact of observations from an observing platform whose potential for improving convection-resolving NWP models is just now being explored.
The Atmospheric Emitted Radiance Interferometer (AERI) [12,13] is a commercially-available ground-based hyperspectral infrared radiometer that passively measures downwelling infrared radiances over the spectral range from 550 to 3300 cm−1 (3 to 18 μm) with a spectral resolution better than 1 cm−1 and a temporal resolution up to 30 s. Through the use of a Gauss–Newton optimal estimation scheme [14], profiles of temperature and water vapor (and their uncertainties) can be retrieved from the infrared spectra with a periodicity of mere minutes. These retrievals supply important information about low-level temperature and moisture profiles in the lowest several km of the troposphere with a temporal resolution that is much finer than that provided by the operational radiosonde network.
The AERI-based profile retrievals have been shown to have potential for improving situational awareness for operational forecasters, from monitoring atmospheric stability indices [15] to assessing changes in the environment associated with the development and propagation of SCW [16,17]. Ideally, an operational network of these systems would be deployed in weather-sensitive regions to assist forecasters with their assessment of current conditions and short-term forecasts. A permanent network of these systems would then possibly serve as a valuable source of data for assimilation into operational NWP. While the benefits of using AERI observations in NWP were previously explored by Otkin et al. [18] and Hartung et al. [19] using an Observing System Simulation Experiment (OSSE), it is only recently that studies have begun to explore their impact when assimilating real-world observations. Coniglio et al. [20] used targeted deployments of the AERI system contained within the Collaborative Lower Atmosphere Mobile Profiling System (CLAMPS) [21] and found, on balance, that a single profiling system could contribute positively to forecast skill for individual SCW events. Hu et al. [22] used AERI observations from a temporary AERI network deployed during the Plains Elevated Convection at Night (PECAN) [23] campaign to assist in the simulation of the 13 July 2015 Nickerson, Kansas, tornado. Degelia et al. [24] likewise used observations collected during the PECAN campaign, but their focus was to examine the impact of boundary layer observations on forecasts of nocturnal convective initiation associated with a single case from 26 June 2015. Though each of these studies demonstrated encouraging results, they relied on temporary AERI deployments that cannot be incorporated into long-term, real-time efforts to model the atmosphere.
In the present work, we focus on a network of four AERIs located in north-central Oklahoma as part of the extended facilities of the Atmospheric Radiation Measurement (ARM) [25] Southern Great Plains (SGP) facility. As the network is maintained in a quasi-operational state, it serves as an excellent prototype of a future operational ground-based profiling network, such as that identified as a high priority by the National Research Council [26]. To explore the potential value of a network of AERIs in operational NWP, and to build upon the work presented in Coniglio et al. [20], Hu et al. [22], and Degelia et al. [24], we examine the impact of AERI observations on the simulation of an SCW event that occurred over the central plains during 18–19 May 2017. The AERI instrument provides high-density temperature and moisture observations of the atmospheric boundary layer, and it is our hypothesis that these observations will lead to improved model depictions of surface temperature and moisture when assimilated with the WRF-DART system.
The remainder of the paper is organized as follows. In Section 2, the methodology employed in the research (including descriptions of the NWP model, DA system, observations, and experiment design) is presented. Section 3 presents the results of the numerical experiments, and Section 4 is devoted to summarizing the results and stating the related conclusions, respectively.

2. Experiments

2.1. Model and Data Assimilation System

Our forecast system employs the Weather Research and Forecasting (WRF-ARW) model V3.8.1 [10] during the forecasting step. The Data Assimilation Research Testbed (DART) Manhattan release [11] employing an ensemble adjustment Kalman filter [27,28] is used to assimilate the observations. For this study, the WRF and DART systems were installed and configured on the S4 supercomputer [29] located at the Space Science and Engineering Center at the University of Wisconsin-Madison.
As mentioned in the introduction, our modeling and DA system captures many of the essential features of the WoFS, the complete description of which is provided in Wheatley et al. [8] and Jones et al. [9]. Here, we provide a brief overview of the more important details as well as differences specific to this study. For this work, a 36-member ensemble is generated from the first 18 members of the Global Ensemble Forecast System (GEFS) using a physics diversity approach similar to that advocated by Stensrud et al. [30] and Fujita et al. [31]. The details are summarized in Table 1. Atmospheric initial conditions are provided by the GEFS analyses valid at 1200 UTC, and boundary conditions are updated using GEFS 6-hourly forecasts valid at 18:00, 00:00 and 06:00 UTC, respectively. Soil moisture and soil temperature are initialized using NCEP’s North American Mesoscale Forecast System (NAM) analysis, and their evolution is subsequently modeled using the Noah land-surface model [32].
The WRF configuration consists of a single nest using a 550 × 500 grid point domain with 3 km horizontal grid spacing and 56 vertical levels. The model top is set at 10 hPa. To accommodate the SCW event being studied (see Section 2.4), the model domain is located over the south-central United States (Figure 1). For our study, the half-width of the horizontal and vertical localization radii [33] for conventional observations (radiosonde observations, aircraft reports, surface observations) is set at 230 and 4 km, respectively, while those for the AERI observations are set at 200 and 4 km, respectively (values arrived at after a period of parameter tuning). The localization is determined by the three-dimensional distance between the observation location and the analysis grid point. In other words, the analysis increment does not fill a cylinder determined by the horizontal and vertical radii given above, but rather an ellipsoid. The locations of the AERI sites (green triangles) and the respective full localization radii (magenta circles) are shown in Figure 1. A spatially and temporally varying adaptive inflation scheme applied to the prior state [34] is used to improve the dispersion of the ensemble (and to prevent filter divergence) for the duration of the DA cycling, and the outlier parameter is set at 3.0, meaning that observations whose observation-minus-background (OMB) value is greater than 3 standard deviations times the total spread are rejected. The DART configuration is summarized in Table 2.
Observation errors for the AERI temperature and dewpoint retrievals are obtained by summing the measurement uncertainties obtained from the AERIoe algorithm (described in detail in Section 2.2) and a specified representativeness error (here taken to be 1 K for both temperature and dewpoint). The aggregate errors are quite similar to those shown in Figure 5 of Coniglio et al. [20] though somewhat smaller given that study assumed a representativeness error of 2 K.
Our WRF-DART modeling and DA system is run from 12:00 UTC to 18:00 UTC in free forecast mode (i.e., without assimilating any observations at 12:00 UTC) to allow the ensemble to develop flow-dependent covariances at finer scales. Beginning at 18:00 UTC, continuous data assimilation using a 15-min cycling period is commenced and continued until 03:00 UTC the following day. Ensemble forecasts are initialized from the posterior analyses at hourly intervals starting at 19:00 UTC and run until 04:00 UTC.

2.2. AERI Temperature and Water Vapor Retrievals

The impact experiments rely on retrievals of temperature and water vapor derived from the raw AERI measurements. The procedure for obtaining these retrievals is described here. Since the vertical distribution of temperature and moisture has a pronounced impact on the atmosphere’s radiative characteristics, surface-based observations of the downwelling infrared spectrum are a function of the vertical thermodynamic profiles. The retrieval process attempts to invert that relationship by determining the most likely atmospheric state capable of producing an observed spectrum. This is an ill-posed problem because a finite number of observations must characterize the smoothly-varying vertical profiles. The AERI optimal estimation (AERIoe) [35] retrieval used in the present work is a physical retrieval in that it uses a forward radiative transfer model (in this case the LBLRTM, or line-by-line radiative transfer model, as described by Clough et al. [36] to map a first guess of the thermodynamic state into an infrared spectrum). The modeled spectrum is compared to the observed spectrum, and the first guess temperature and water vapor profiles are iteratively adjusted until they converge to a solution. The information content present within the AERI spectrum enables AERIoe to retrieve the thermodynamic profile in the lowest 3 km of the clear sky atmosphere. Since clouds are opaque in the infrared, AERIoe profiles are available only up to the cloud base. An automated precipitation-sensing hatch closes to protect the AERI optics from rain and snow; therefore, retrievals are also unavailable during active precipitation.
A given retrieval is constrained by a climatology consisting of the mean atmospheric state and its covariance, which provides information about typical atmospheric behavior and thus helps identify likely states. In this case, the climatology is calculated from a 10-plus year dataset of radiosondes launched four times daily from the SGP central facility in Lamont, OK; the large number of radiosonde observations allows the climatological state to be calculated for each month of the year. A three-month span of radiosonde launches centered on the current calendar month provides sufficient background about expected atmospheric behavior while the covariance matrix accounts for variability in that state and is used as the a priori estimate (i.e., first guess) for the retrieval.
As the radiance observations are inherently noisy [13], two techniques were applied to reduce that noise. First, a principal component analysis was applied to the radiance observations to separate uncorrelated noise [37]. Second, the noise-filtered spectra were averaged together over a finite period. Care was taken during the noise filtering process in this study to produce profiles that were proper analogues of those that would be available from an operational network operating in real time. First, an independent noise filter was applied that only used spectral observations from the period leading up to a given observation (since real-time observations could not rely on a dependent noise filter that used data from a period centered on the current time) and, second, data were averaged over discrete 15-min periods. This allowed a retrieval to be completed on present-day hardware before the next 15-min averaging period was concluded, thereby satisfying a necessary criterion for future operational application.
Finally, since the information content present in the retrievals drops off with height, the retrieved profiles were strongly weighted towards the a priori estimate as height increases from the surface. Therefore, only the retrieved values of temperature and water vapor within 3 km of the surface are retained for this study. Note that, for analysis purposes, subsequent sections refer to the AERI observations with respect to their height above mean sea-level (not above ground-level).
The 2017 Land Atmosphere Feedback Experiment (LAFE) [38] brought three AERIs within 2 km of the four daily radiosonde launches at the SGP site, providing an unprecedented opportunity to evaluate the performance of multiple AERIs concurrently. This helped assess the spread in AERI observations in effectively identical conditions and provided valuable insight into the repeatability of the AERI retrievals. From comparisons with the radiosonde launches, we were able to develop a simple bias correction technique by computing the mean differences between AERI temperature and dewpoint retrievals and their rawinsonde observation system (RAOB) counterparts. These differences were then subtracted from the AERI retrievals used in the present case to produce bias-corrected observations. It should be noted that bias-correction of AERI retrievals with respect to four daily RAOBs may not be practical in all areas; however, similar techniques could be derived using other readily available observation sets (e.g., aircraft reports) and, in principle, ought to work just as well.
A test was performed to compare the quality of model analyses made from cycling experiments using the original AERI dataset as well as the bias-corrected dataset. These results are presented in Section 3.

2.3. Forecast Period and Case Selection

To demonstrate the impact of the AERI retrievals, a SCW outbreak case from 2017 was chosen. Aside from being a high-impact event with widespread severe weather, the initiation and development of the associated convection occurred in two discrete areas advantageous for interpretation. The main line of convection developed between 18:00 and 19:00 UTC 18 May, along a dry line located to the west of the AERI sites described above, while a secondary area of severe weather initiated in central Kansas (just north of the AERI sites) near 2000 UTC. Given that the synoptic flow at this time was generally southwesterly (southerly at the surface, rapidly veering to west-southwesterly at 500 hPa), these separate convective initiations occurred upwind and downwind of the AERI sites, respectively. This scenario suggests that AERI observations assimilated every 15 min would in theory have time to modify the simulated pre-storm and inflow environments of the evolving storm system and potentially alter the spatial distribution and intensity of the main line of model-simulated convection as it approached central Oklahoma. The scenario also suggests that the AERI observations might be able to impact the initiation and development of model-simulated convection in central Kansas, as it developed in an area downstream of the AERI observing sites.
The synoptic set-up for this event is depicted in Figure 2. On the morning of 18 May, a vigorous mid-level vorticity maximum associated with a 500-hPa trough and closed low was situated over northern Utah, digging east-southeastward toward Colorado (Figure 2a). A cold front sagged from northern Missouri through Kansas into eastern Colorado then southwestward into Arizona. At the same time, a well-defined dry line was situated south-north across west-central Texas (Figure 2b). The cold front and dry line served as foci for convective activity that developed later in the day as they interacted with a shallow layer of warm, moist air flowing northward from the Gulf of Mexico and the favorable shear profile provided by the approaching vorticity maximum and trough. Given this set-up, the National Oceanic and Atmospheric Administration (NOAA) Storm Prediction Center (SPC) forecast a greater than 30% probability of tornadoes within 25 miles of a given point in central Kansas and Oklahoma (Figure 3a). Severe weather reports received by SPC indicate that 48 tornadoes occurred in two distinct bands: one oriented north-south from central Kansas to central Oklahoma (in the high-risk area mentioned above) and the other oriented southwest-northeast in eastern Oklahoma and Western Missouri (Figure 3b). In addition, there were numerous reports satisfying criteria for SCW (both with respect to hail size and wind gust magnitude) in this region.
Since the AERI instrument provides high-density temperature and moisture observations of the atmospheric boundary layer, it is our hypothesis that these observations, when assimilated using the WRF-DART system, will provide improved depictions of surface temperature and moisture. This in turn should lead to improved positioning of critical surface boundaries (the cold front and dry line mentioned above) which serve as foci for convective initiation and development.

2.4. Experiment Design and Evaluation Metrics

To quantify the impact of AERI observations on the analysis and forecast of the SCW event, we first conducted control (CTL) experiments using the model system described in Section 2.1. The CTL experiments assimilate only conventional observations from the National Centers from Environmental Prediction (NCEP) operational Global Data Assimilation System (GDAS). These included aircraft communications addressing and reporting system (ACARS) temperature and horizontal wind; universal RAOB temperature, specific humidity, and horizontal wind; and surface airways pressure (altimeter setting), temperature, dew point, and horizontal wind components. Next, we conducted impact experiments that are identical to CTL but which included assimilation of the AERI observations (hereafter referred to as “AERI”). Comparison of CTL and AERI thus provides an estimate of the impact of the AERI temperature and water vapor retrievals on the accuracy of WRF-DART analyses and the skill of forecasts initiated from these analyses.
To assess forecast quality, we employed two metrics: neighborhood maximum ensemble probability (NMEP) [39] and fractions skill score (FSS) [40,41]. NMEP and FSS are both spatial verification methods, meaning that they measure forecast model performance relative to the observations over discrete neighborhoods rather than point-by-point (as do more familiar metrics such as root-mean square error, or RMSE). In particular, NMEP searches within the neighborhood of a grid point to determine if the maximum value of a forecast model output exceeds a given threshold. This is done for each ensemble member, and the fraction of ensemble members which exceed the threshold gives the NMEP for that grid point. For FSS, on the other hand, the simulated and observed fraction of points within the neighborhood that exceed a given threshold are compared. Model forecasts of composite reflectivity (computed using the WRF Unified Post Processor version 3.2) were first mapped to a grid with 3-km spacing whose boundaries are indicated by the solid red rectangle in Figure 1. National Severe Storms Laboratory (NSSL) MRMS (multi-radar/multi-sensor) observations of composite WSR-88D radar reflectivity [42] were then mapped to the same 3-km grid before computation of NMEP and FSS values. In addition, a smaller subdomain (also with 3-km spacing) was constructed (dashed red rectangle in Figure 1) to assess forecast performance in that portion of the computational domain lying immediately downwind of the AERI sites (hereafter referred to as the “downwind” domain). For the NMEP calculations, a neighborhood of 24 km by 24 km (i.e., a half-width of 12 km) was used, whereas the FSS was computed from forecast aggregates at lead times of 1, 2, 3, 4, 5, and 6 h for neighborhoods ranging from 20 km by 20 km to 120 km by 120 km (i.e., radii ranging from 10 km to 60 km, respectively). Additionally, no attempt was made to account for model bias in the calculation of FSS as it was assumed that any bias present (on account of microphysical parameterization, model resolution, etc.) would impact both sets of experiments equally and become negligible when differences between CTL and AERI were computed. Only forecasts initiated from WRF-DART analyses valid at 19–22 UTC were evaluated. SCW began to impact the AERI network beginning at 23 UTC and made further retrieval of temperature and dewpoint profiles impossible.

3. Results

Before considering the impact of the AERI observations relative to CTL, it is first instructive to establish the superiority of the bias-corrected observation set. To do so, we conducted two cycling DA experiments. The first (AERI NOBC) assimilated the original (i.e., not bias-corrected) AERI dataset, and the second (AERI) assimilated the bias-corrected dataset. There is a small but noticeable improvement of the model fit to both RAOB temperature (Figure 4a) and RAOB specific humidity (Figure 4b) in terms of both RMSE and bias, especially in the lowest 150 hPa of the troposphere. The model fit to ACARS wind observations is most notable in the improvement in both RMSE and bias with respect to the meridional wind. These results provide confidence in the efficacy of the AERI bias-correction algorithm, and hereafter AERI refers to the simulation conducted with bias-corrected observations.
Both the AERI and CTL experiments successfully depict the broad synoptic features at play in the SCW outbreak (Figure 2). The 19:00 UTC WRF-DART ensemble-mean analyses in Figure 5a,b demonstrate that CTL and AERI possess a well-defined front evidenced by the gradient in 2-m temperatures from northwest Kansas to the Kansas-Oklahoma border. A large moisture gradient is also evident in both experiments (Figure 5d,e). The portion of the moisture gradient extending northeast-to-southwest across Kansas is associated with the cold front (mentioned above), while the second and much more pronounced gradient is associated with the dry line advancing across the Texas panhandle.
Despite these superficial similarities, there are crucial differences between the two experiments. These can be elicited by taking the difference of the CTL and AERI analyses (i.e., AERI-CTL), for both surface temperature (Figure 5c) and moisture (Figure 5f). It is now apparent that, after 1 h of DA using 15 min cycles, information from the AERI retrievals has already propagated some distance from the AERI observing sites themselves. This is to be expected since one of the strengths of ensemble data assimilation is that the flow-dependent error covariances are propagated forward within the ensemble to the next assimilation time.
While both experiments clearly depict the cold front stretching northeast-southwest across Kansas, the AERI temperature analysis is much cooler in south central Kansas and northern Oklahoma, intensifying the temperature gradient across the cold front and thus sharpening the boundary (Figure 5c). The AERI mixing ratio analysis is drier in the same region as well (Figure 5f), and this area extends southward across Oklahoma into the extreme northeastern portion of the Texas panhandle. A narrow strip of warmer surface temperatures (and enhanced surface water vapor mixing ratios) is apparent in the AERI analysis over central Kansas. The net effect of these changes is to sharpen the moisture and temperature gradients along the cold front over a small region in central Kanas (Figure 2b) along which convection initiated approximately 1 h after these analyses (i.e., 20:00 UTC). The area in question is along and just north of the narrow strip of warming/moistening mentioned above.
The positive impact of the AERI observations on the surface temperature and moisture analyses can be confirmed by considering analysis errors with respect to Automated Surface Observing System (ASOS) observations of 2 m temperature and dewpoint obtained from the Iowa Environmental Mesonet (https://mesonet.agron.iastate.edu). The AERI simulation produces analyses which consistently have lower RMSE and bias than its CTL counterparts (Table 3), and indeed reduces the bias of the 2-m dewpoint analyses significantly.
Corresponding impacts on the distribution of Convective Available Potential Energy (CAPE) and convective inhibition (CIN) are shown in Figure 6. While the CAPE fields are grossly similar in CTL and AERI (Figure 6a,b), there are noteworthy differences upon examination of the difference field in Figure 6c. In particular, a reduction in CAPE of nearly 1000 J kg−1 occurs in the AERI experiment over southern Kansas and northern Oklahoma, coincident with the cooler and drier areas identified in Figure 5c,f. At the same time, the entire domain, with the exception of areas north of the cold front, is either weakly capped or lacks any cap at all. (Figure 6d,e). Of particular note are a strip of increased CAPE and lower (i.e., more negative) CIN located over central Kansas (Figure 6c,f). The combination of these surface cooling/drying patterns has implications for convective initiation in Kansas and suggests that the AERI experiment would tend to produce forecasts with less convection in central Kansas except along the narrow strip where CAPE has increased (as identified above). This possibility, and the broader question of forecast impact, will be examined next.
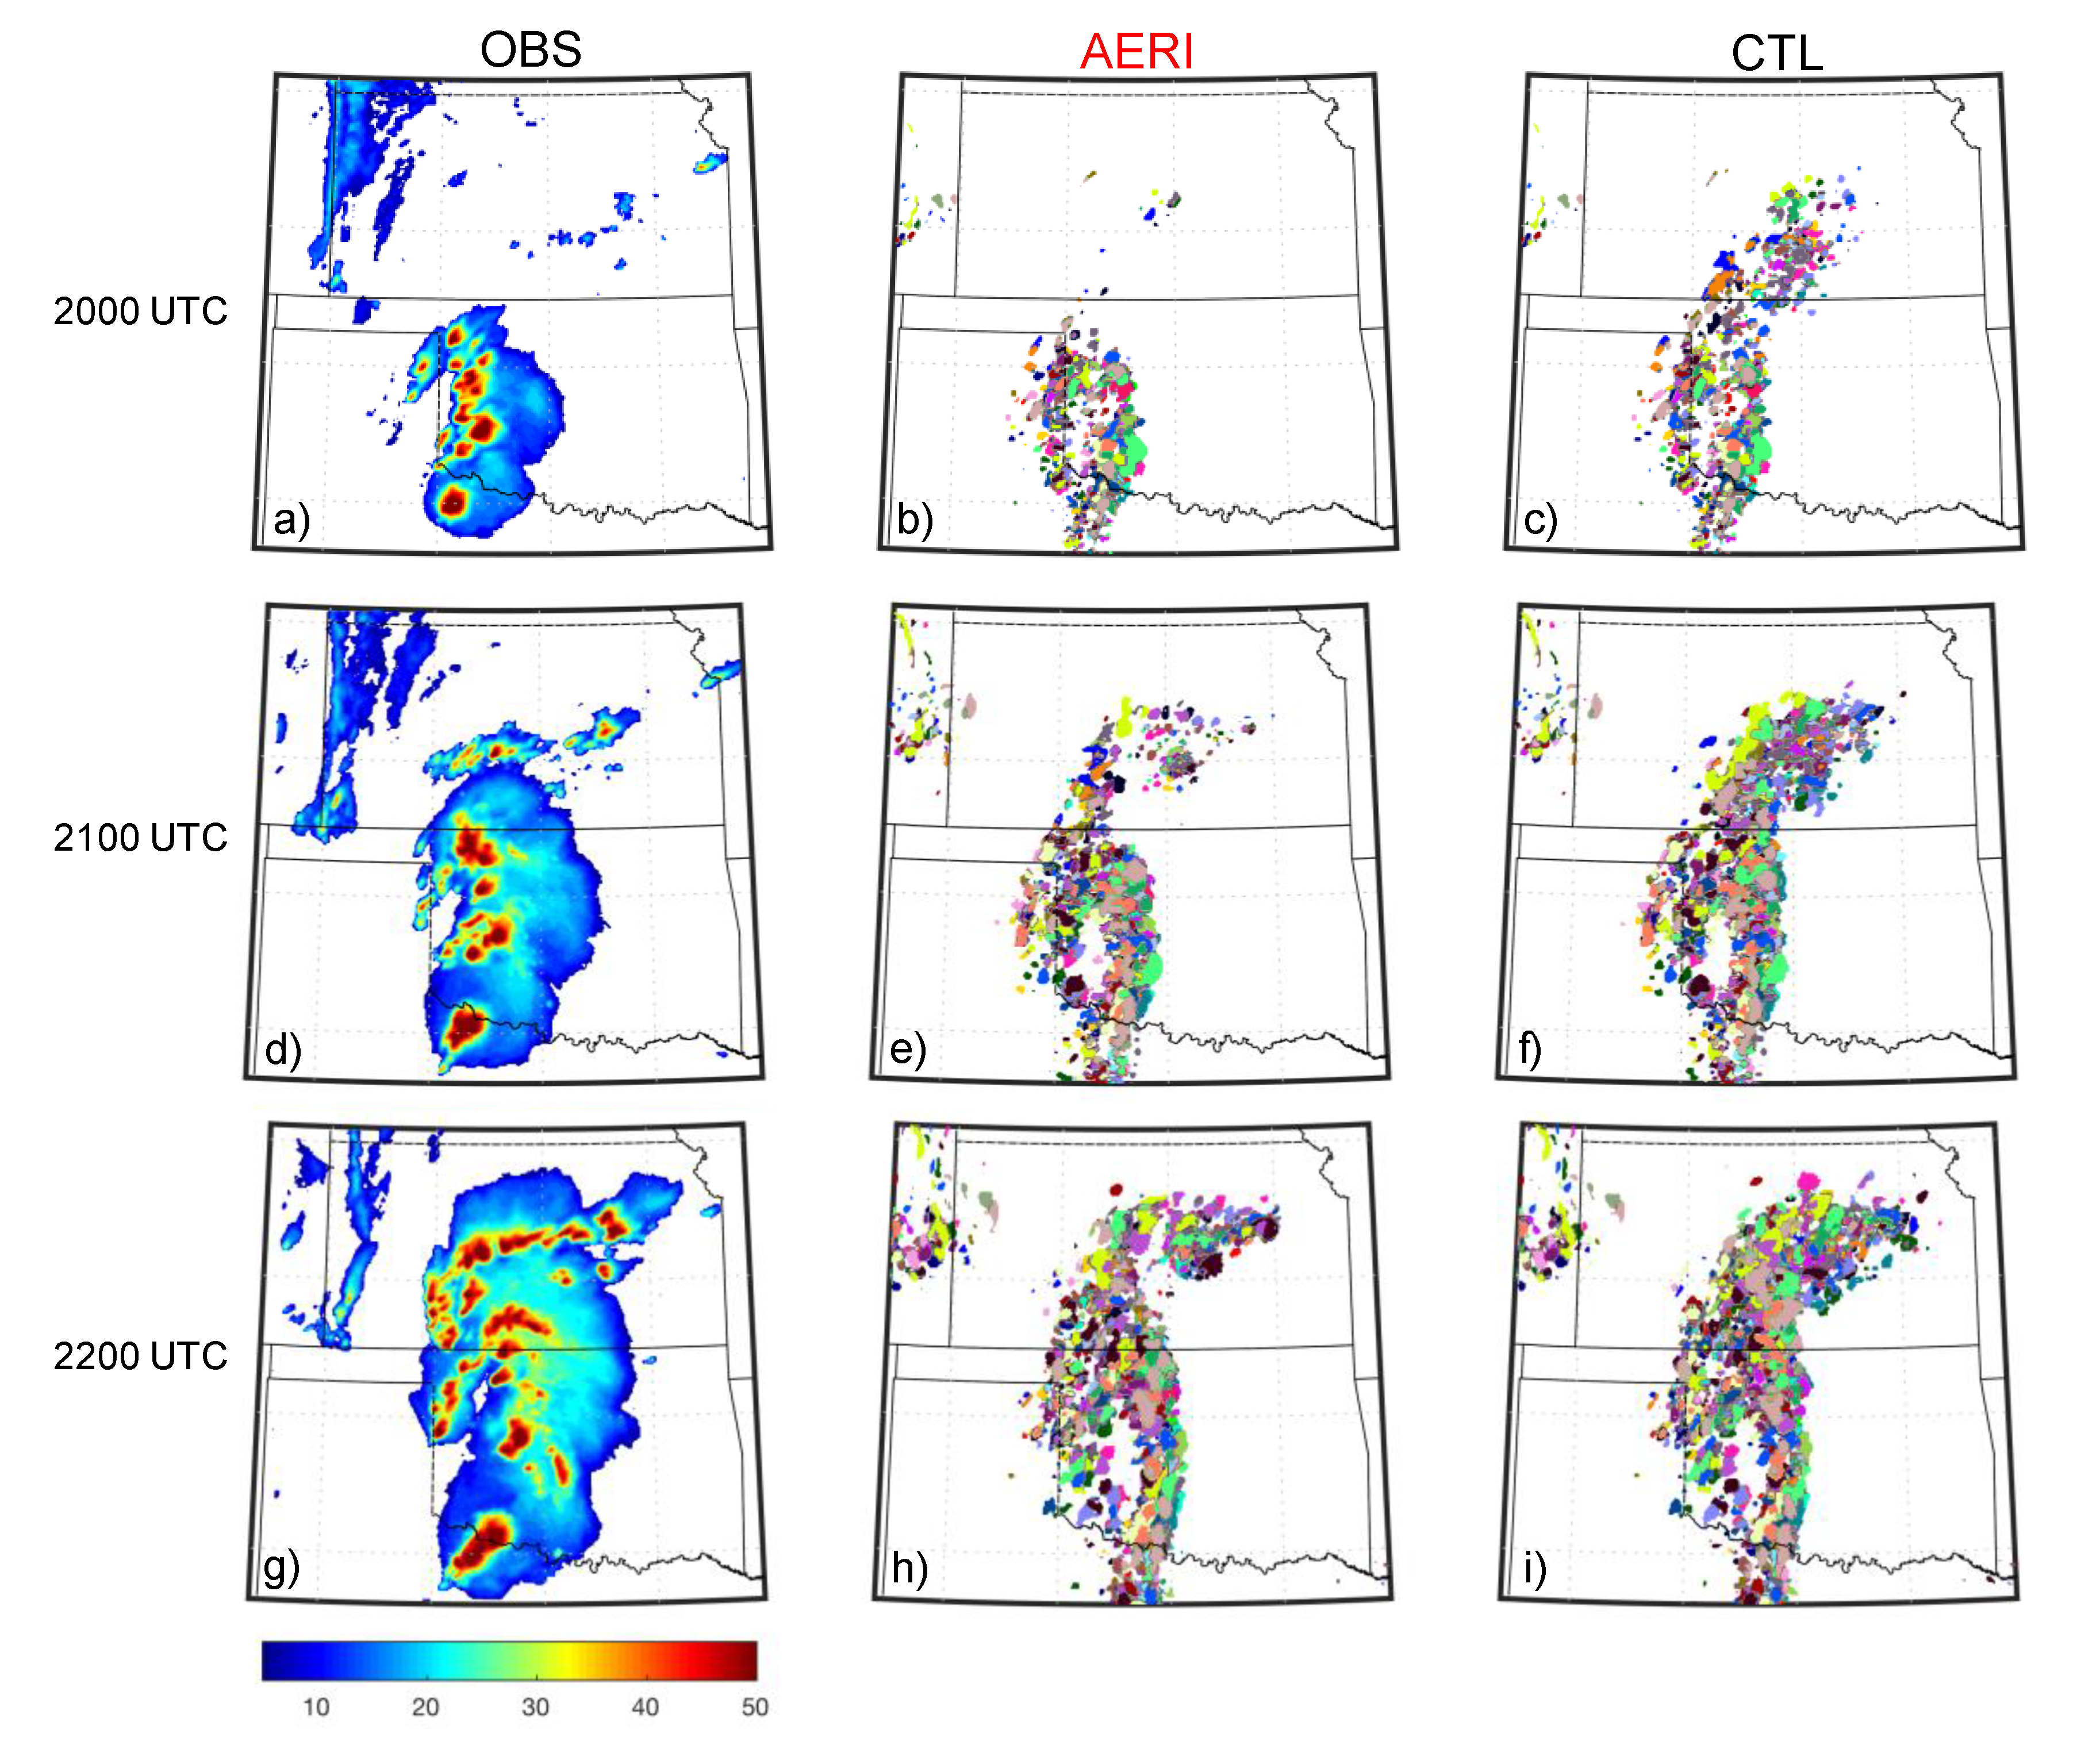
Composite reflectivity factor observed at 20:00, 21:00 and 22:00 UTC is shown in Figure 7a,d,g, respectively. The development and east–west progression of the dry line convection is evident in this sequence of images as is the initiation and intensification of convection in central Kansas. AERI and CTL ensemble forecasts initiated from the respective WRF-DART analyses valid at 19 UTC are displayed in the middle (Figure 7b,e,h) and rightmost (Figure 7c,f,i) columns as composite reflectivity paintballs using a threshold composite reflectivity factor of 40 dBZ. The 1-h AERI forecast valid at 20:00 UTC (Figure 7b) shows a distribution of convective clusters in roughly the proper locations relative to the observations (Figure 7a). The 1-h CTL forecast (Figure 7c) contains numerous spurious convective cells in southern Kansas. The differences between AERI and CTL become less apparent with time, although the CTL forecast maintains slightly greater coverage of intense convection in southern Kansas. Overall, these forecast results are consistent with the implications posed by the 19:00 UTC surface analyses examined in Figure 5 and Figure 6.
AERI observation forecast impact is further assessed by considering NMEPs for 1-h AERI and CTL ensemble forecasts initiated at 21:00 UTC. Figure 8 shows NMEPs for composite radar reflectivity using a threshold of 30 dBZ, with the shaded areas in Figure 8a,b representing the fraction of ensemble members for which this threshold is achieved or exceeded within 12 km of a given grid point. The differences between the CTL and AERI experiments are shown in Figure 8c. Overall, inspection of Figure 8c shows that the largest differences occur over Kansas and northern Oklahoma. Although these forecasts were initiated at a time when convection in Kansas had already formed (cf. Figure 7), the pattern of positive and negative probability differences shows that, in the downwind portion of the domain, the AERI ensemble improves the depiction of the observed convection (indicated by the solid black line) relative to CTL. This indicates that information from the AERI retrievals is entering the model analysis and impacting the forecasts in a dynamically consistent manner (it should be noted that such an impact is not obvious in the portion of the domain not downwind of the AERI sites). The spatial coherence is improved most notably in eastern Kansas, where the AERI forecasts place a bullseye of increased probability directly within the observed 30 dBZ contour on the easternmost edge of the convective line. Around this bullseye is a horseshoe-shaped area of reduced probabilities. This indicates that the AERI ensemble forecasts do a better job of focusing the convection where it actually occurred by eliminating spurious convection in extreme eastern Kansas. The results are not entirely consistent, however, as the probability differences do not coincide precisely with the observed line of convection in central Kansas, and in fact there is a large area of spurious increase to the north of the observations. Elsewhere in the domain, there is little difference between the two sets of forecasts.
To examine whether CTL and AERI ensemble forecasts offer practical guidance regarding the location and timing of severe weather (and, indeed, whether AERI offers improved performance in this regard) we compared NMEPs computed using a threshold value of 50 dBZ with observed indicia of severe weather (in this case, the observed location of hail per SPC reports). Overall, neither CTL nor AERI seems particularly skillful in depicting the precise timing and location of hail threats (Figure 9). However, comparison of the two experiments does indicate that, at least in the downwind portion of the domain. AERI does show increased probabilities of intense convection (i.e., greater than 50 dBZ, known to be associated with an increased risk of hail) in the general vicinity of 7 hail reports in east central Kanas.
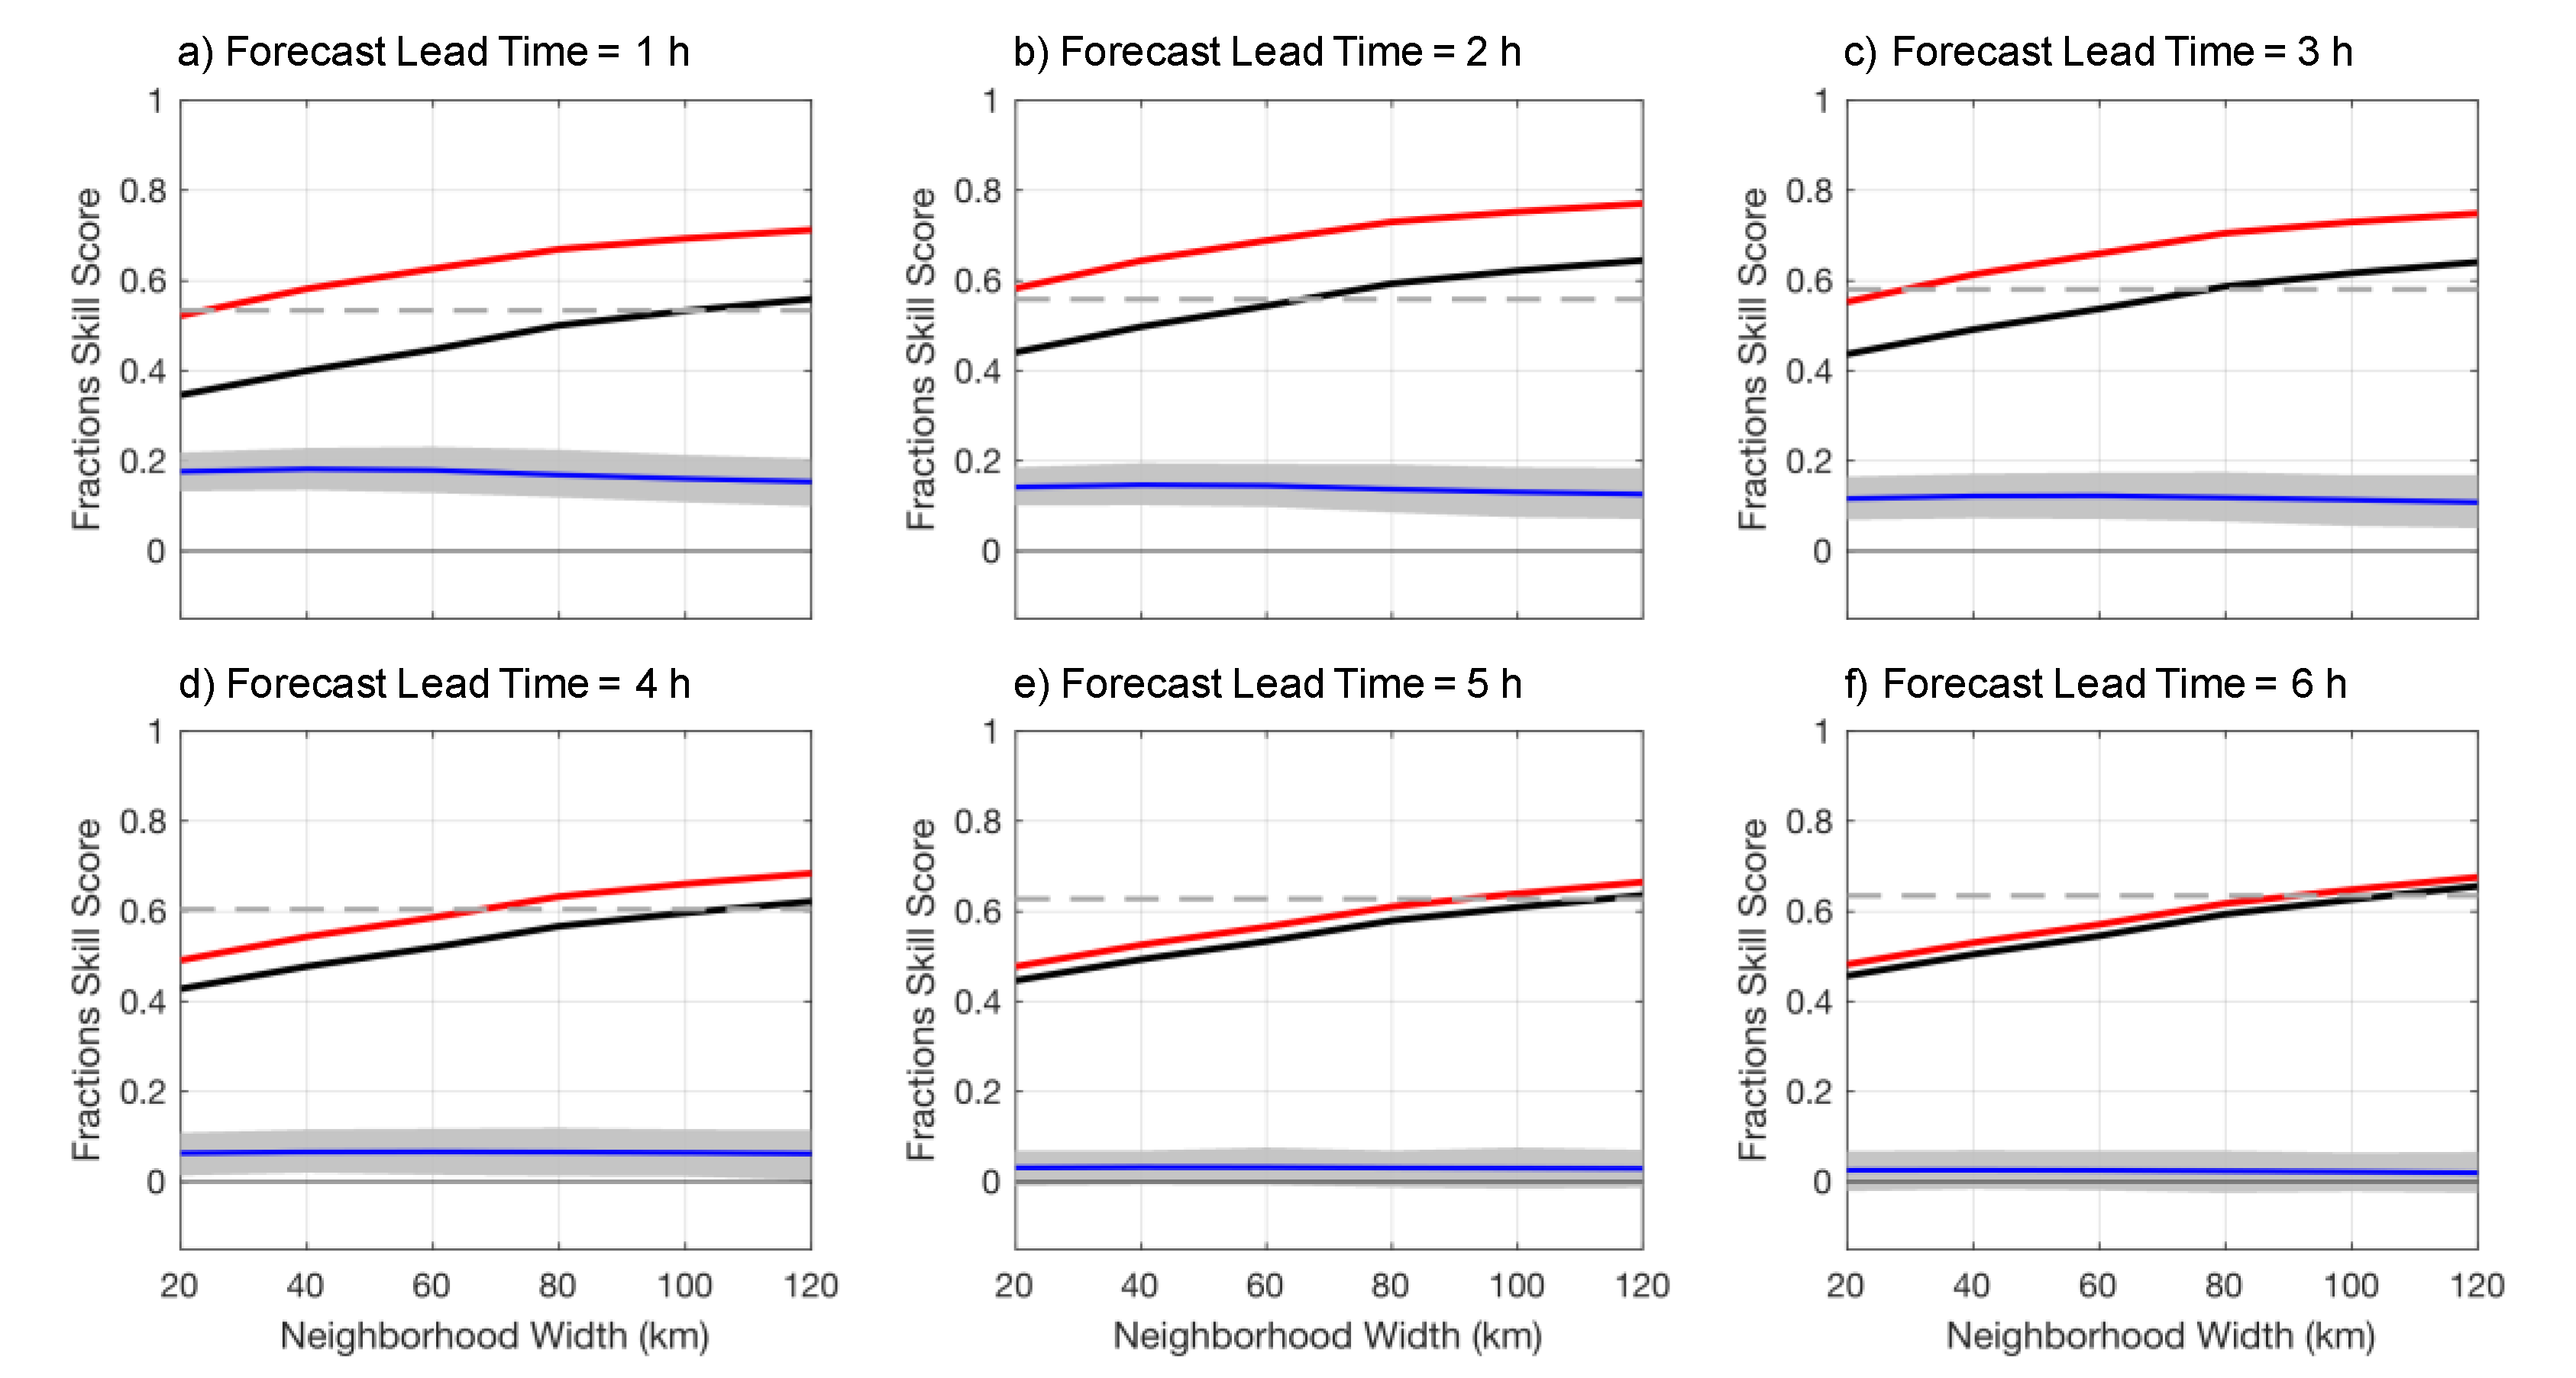
Having investigated the AERI observation impact on single forecasts, we now examine how the forecast errors vary with lead time and spatial scale. To do so, we aggregate forecasts initiated at 19:00, 20:00, 21:00 and 22:00 UTC by lead time on the domain defined by the solid red rectangle in Figure 1 and then compute FSS from the aggregates using the same composite radar reflectivity thresholds used in Figure 8 (i.e., 30 dBZ). These are shown in Figure 10. The dashed gray line represents the minimum skillful (or useful) FSS value and is given by
FSSuseful = 0.5 + f0/2,
where f0 represents, in this case, the aggregate observed frequency of composite reflectivity factor exceeding the threshold value of 30 dBZ over the entire domain. Although both CTL and AERI are skillful at some spatial scales and lead times (neighborhood widths greater than 70 km at 1 h, for example), there is very little difference between the two experiments when assessed over the entire domain. This is emphasized by taking the difference in FSS (AERI-CTL) and computing 95% confidence intervals with a bootstrap resampling method [43] using 1000 replicates. The blue lines in Figure 10 represent FSSAERI–FSSCTL and the shaded gray regions depict the 95% bootstrap confidence intervals. None of the differences is significant, and we conclude that the AERI observations have no appreciable impact in FSS when computed over the entire analysis domain.
However, when the FSS are aggregated over the smaller “downwind” domain (the dashed red rectangle in Figure 1) the positive impact of the AERI observations becomes apparent (Figure 11). AERI forecasts are skillful for all neighborhoods larger than 20 km at lead times up to 3 h (Figure 10a–c) and the differences between AERI and CTL at these lead times are all significant at the 95% confidence level. Beyond three hours the differences diminish and gradually become insignificant for lead times of 5 and 6 h. The results for the “downwind” domain demonstrate that the AERI observations contribute to significant improvement in ensemble forecasts of strong convection in Kansas. The limited geographical extent of the impact is also consistent with the fact that the observations are only available for a small area in central Oklahoma. Use of a more extensive network would likely lead to a larger impact as suggested by the results of Otkin et al. [18] and Hartung et al. [19].
To ensure that improvements are not gained in the “downwind” domain at the expense of significant degradations elsewhere, we compute FSS for the portion of the domain not defined as downwind of the AERI sites (i.e., excluding the area enclosed by the dashed red lines in Figure 1). Figure 12 shows that there is a slight (though statistically insignificant) reduction in FSS relative to CTL at the 1 h lead time, but very little difference thereafter.
Finally, to clarify the capability of CTL and AERI to provide skillful guidance regarding the location and timing of severe weather, we compute FSS using the 50-dBZ threshold employed in Figure 9. The results (Figure 13) confirm that, while neither CTL nor AERI has any skill in this regard, at earlier lead times the AERI experiment is significantly better than CTL. This indicates that the AERI observations are, indeed, improving the forecasts of severe weather, although not to a degree sufficient enough to be considered significant per se.

4. Summary and Conclusions

Temperature and moisture retrievals were obtained from the Atmospheric Emitted Radiance Interferometer (AERI) and then subjected to a simple bias-correction procedure using a large sample of radiosonde observations from a nearby site. The bias-corrected AERI observations were assimilated using a WRF-DART modeling and DA system to demonstrate the observation impact on analyses and forecasts of a SCW event that impacted parts of Kansas and Oklahoma on 18–19 May 2017. Relative to a control simulation (CTL) which only assimilated conventional observations, the AERI experiment produced analyses that were better fit to surface temperature and moisture observations and which displayed a sharper depiction of surface boundaries (cold front, dry line) known to be important in the initiation and development of SCW. Although neither CTL nor AERI ensemble forecasts were skillful in predicting the location and timing of discrete severe weather events (as defined by SPC hail reports), the AERI experiment exhibited significantly higher fractions skill scores (FSS) for threshold values of 50 dBZ than CTL for early forecast lead times in the downwind portion of the forecast domain. This positive impact was even more evident in improvement of FSS for a lower threshold value of 30 dBZ, suggesting that the improved surface temperature and moisture analyses in the AERI experiment led to forecasts with more realistic distributions of convection.
While these results are encouraging, the impact of AERI observations in a fully configured, quasi-operational data assimilation system (including radar observations) would likely be somewhat smaller than presented here due to inevitable overlap of at least some information content between the AERI and radar observation sets. For this reason, future work will include a larger selection of cases designed to gauge performance in a wide range of synoptic and mesoscale regimes and will include larger observation sets (including radar and satellite observations). The role of AERI observation density will also be tested, since understanding the relationship between the density of observing sites and analysis/forecast impact could provide important insights regarding the potential benefits of a larger network.
While the impacts discussed in this study were generally confined to a relatively small area of the computational domain, they were consistent in appearing downwind of the small cluster of AERI observing sites. These results could also be interpreted as providing additional evidence that a national network of boundary layer profiling sensors has the potential to improve forecasts that are sensitive to moisture and thermodynamics in the lower troposphere. Increasing the number of profiling sites would increase the geographic scope of their impact and provide larger and more consistent improvements in model analyses and short-range ensemble forecasts that are the essence of the WoF credo. This is consonant with the goals of the National Research Council’s 2009 report [26] on the wisdom of establishing a nationwide network of networks capable of collecting observations representative of mesoscale phenomena.

Author Contributions

Conceptualization, W.E.L., T.J.W., J.A.O.; methodology, W.E.L.; software, T.A.J., W.E.L.; validation, W.E.L.; formal analysis, W.E.L.; investigation, W.E.L.; resources, T.J.W.; data curation, W.E.L.; writing—original draft preparation, W.E.L.; writing—review and editing, W.E.L., T.J.W., J.A.O., T.A.J.; visualization, W.E.L.; supervision, T.J.W., J.A.O.; project administration, T.J.W.; funding acquisition, T.J.W., J.A.O. All authors have read and agreed to the published version of the manuscript.

Funding

This research was funded by NOAA Office of Weather and Air Quality Joint Technology Transfer Initiative (JTTI) via award NA16OAR4590241.

Acknowledgments

The authors thank David Turner of the NOAA Earth Systems Research Laboratories for reviewing an early version of this manuscript and offering many helpful suggestions. The authors are also grateful to three anonymous reviewers whose comments have improved the quality of the manuscript substantially.

Conflicts of Interest

The authors declare no conflict of interest.

References

  1. Wolff, J.K.; Ferrier, B.S.; Mass, C.F. Establishing Closer Collaboration to Improve Model Physics for Short-Range Forecasts. Bull. Am. Meteorol. Soc. 2012, 93, 51. [Google Scholar] [CrossRef]
  2. Kwon, I.-H.; English, S.; Bell, W.; Potthast, R.; Collard, A.; Ruston, B. Assessment of Progress and Status of Data Assimilation in Numerical Weather Prediction. Bull. Am. Meteorol. Soc. 2018, 99, ES75–ES79. [Google Scholar] [CrossRef]
  3. Rotunno, R.; Snyder, C. A Generalization of Lorenz’s Model for the Predictability of Flows with Many Scales of Motion. J. Atmos. Sci. 2008, 65, 1063–1076. [Google Scholar] [CrossRef]
  4. Durran, D.; Gingrich, M. Atmospheric Predictability: Why Butterflies Are Not of Practical Importance. J. Atmos. Sci. 2014, 71, 2476–2488. [Google Scholar] [CrossRef]
  5. Nielsen, E.R.; Schumacher, R.S. Using Convection-Allowing Ensembles to Understand the Predictability of an Extreme Rainfall Event. Mon. Weather. Rev. 2016, 144, 3651–3676. [Google Scholar] [CrossRef]
  6. Stensrud, D.J.; Wicker, L.J.; Kelleher, K.E.; Xue, M.; Foster, M.P.; Schaefer, J.T.; Schneider, R.S.; Benjamin, S.G.; Weygandt, S.S.; Ferree, J.T.; et al. Convective-Scale Warn-on-Forecast System. Bull. Am. Meteorol. Soc. 2009, 90, 1487–1500. [Google Scholar] [CrossRef]
  7. Stensrud, D.J.; Wicker, L.J.; Xue, M.; Dawson, D.T.; Yussouf, N.; Wheatley, D.M.; Thompson, T.E.; Snook, N.A.; Smith, T.M.; Schenkman, A.D.; et al. Progress and challenges with Warn-on-Forecast. Atmos. Res. 2013, 123, 2–16. [Google Scholar] [CrossRef] [Green Version]
  8. Wheatley, D.M.; Knopfmeier, K.H.; Jones, T.A.; Creager, G.J. Storm-Scale Data Assimilation and Ensemble Forecasting with the NSSL Experimental Warn-on-Forecast System. Part I: Radar Data Experiments. Weather. Forecast. 2015, 30, 1795–1817. [Google Scholar] [CrossRef]
  9. Jones, T.A.; Knopfmeier, K.; Wheatley, D.; Creager, G.; Minnis, P.; Palikonda, R. Storm-Scale Data Assimilation and Ensemble Forecasting with the NSSL Experimental Warn-on-Forecast System. Part II: Combined Radar and Satellite Data Experiments. Weather. Forecast. 2016, 31, 297–327. [Google Scholar] [CrossRef]
  10. Skamarock, W.C.; Coauthors. A description of the Advanced Research WRF version 3. NCAR Tech. Note. 2008, NCAR/TN-475+STR. p. 113.
  11. Anderson, J.; Hoar, T.; Raeder, K.; Liu, H.; Collins, N.; Torn, R.; Avellano, A. The Data Assimilation Research Testbed: A Community Facility. Bull. Am. Meteorol. Soc. 2009, 90, 1283–1296. [Google Scholar] [CrossRef] [Green Version]
  12. Knuteson, R.; Revercomb, H.E.; Best, F.A.; Ciganovich, N.C.; Dedecker, R.G.; Dirkx, T.P.; Ellington, S.C.; Feltz, W.F.; Garcia, R.K.; Howell, H.B.; et al. Atmospheric Emitted Radiance Interferometer. Part I: Instrument Design. J. Atmos. Ocean. Technol. 2004, 21, 1763–1776. [Google Scholar] [CrossRef]
  13. Knuteson, R.; Revercomb, H.E.; Best, F.A.; Ciganovich, N.C.; Dedecker, R.G.; Dirkx, T.P.; Ellington, S.C.; Feltz, W.F.; Garcia, R.K.; Howell, H.B.; et al. Atmospheric Emitted Radiance Interferometer. Part II: Instrument Performance. J. Atmos. Ocean. Technol. 2004, 21, 1777–1789. [Google Scholar] [CrossRef]
  14. Rodgers, C. Inverse Methods for Atmospheric Sounding: Theory and Practice; World Scientific: Singapore, 2000; p. 238. [Google Scholar]
  15. Blumberg, W.G.; Wagner, T.J.; Turner, D.D.; Correia, J. Quantifying the Accuracy and Uncertainty of Diurnal Thermodynamic Profiles and Convection Indices Derived from the Atmospheric Emitted Radiance Interferometer. J. Appl. Meteorol. Clim. 2017, 56, 2747–2766. [Google Scholar] [CrossRef]
  16. Wagner, T.J.; Feltz, W.F.; Ackerman, S. The Temporal Evolution of Convective Indices in Storm-Producing Environments. Weather Forecast. 2008, 23, 786–794. [Google Scholar] [CrossRef]
  17. Loveless, D.M.; Wagner, T.J.; Turner, D.D.; Ackerman, S.A.; Feltz, W.F. A Composite Perspective on Bore Passages during the PECAN Campaign. Mon. Weather Rev. 2019, 147, 1395–1413. [Google Scholar] [CrossRef]
  18. Otkin, J.; Hartung, D.C.; Turner, D.D.; Petersen, R.A.; Feltz, W.F.; Janzon, E. Assimilation of Surface-Based Boundary Layer Profiler Observations during a Cool-Season Weather Event Using an Observing System Simulation Experiment. Part I: Analysis Impact. Mon Weather. Rev. 2011, 139, 2309–2326. [Google Scholar] [CrossRef]
  19. Hartung, D.C.; Otkin, J.; Petersen, R.A.; Turner, D.D.; Feltz, W.F. Assimilation of Surface-Based Boundary Layer Profiler Observations during a Cool-Season Weather Event Using an Observing System Simulation Experiment. Part II: Forecast Assessment. Mon. Weather Rev. 2011, 139, 2327–2346. [Google Scholar] [CrossRef]
  20. Coniglio, M.C.; Romine, G.S.; Turner, D.D.; Torn, R.D. Impacts of Targeted AERI and Doppler Lidar Wind Retrievals on Short-Term Forecasts of the Initiation and Early Evolution of Thunderstorms. Mon. Weather. Rev. 2019, 147, 1149–1170. [Google Scholar] [CrossRef]
  21. Wagner, T.J.; Klein, P.M.; Turner, D.D. A New Generation of Ground-Based Mobile Platforms for Active and Passive Profiling of the Boundary Layer. Bull. Am. Meteorol. Soc. 2019, 100, 137–153. [Google Scholar] [CrossRef]
  22. Hu, J.; Yussouf, N.; Turner, D.D.; Jones, T.A.; Wang, X. Impact of Ground-Based Remote Sensing Boundary Layer Observations on Short-Term Probabilistic Forecasts of a Tornadic Supercell Event. Weather Forecast. 2019, 34, 1453–1476. [Google Scholar] [CrossRef]
  23. Geerts, B.; Parsons, D.; Ziegler, C.L.; Weckwerth, T.M.; Biggerstaff, M.; Clark, R.D.; Coniglio, M.C.; Demoz, B.B.; Ferrare, R.; Gallus, W.A.; et al. The 2015 Plains Elevated Convection at Night Field Project. Bull. Am. Meteorol. Soc. 2017, 98, 767–786. [Google Scholar] [CrossRef]
  24. Degelia, S.K.; Wang, X.; Stensrud, D.J. An Evaluation of the Impact of Assimilating AERI Retrievals, Kinematic Profilers, Rawinsondes, and Surface Observations on a Forecast of a Nocturnal Convection Initiation Event during the PECAN Field Campaign. Mon. Weather Rev. 2019, 147, 2739–2764. [Google Scholar] [CrossRef]
  25. Stokes, G.M.; Schwartz, S.E. The Atmospheric Radiation Measurement (ARM) program: Programmatic back- ground and design of the Cloud and Radiation Test Bed. Bull. Am. Meteor. Soc. 1994, 75, 1201–1221. [Google Scholar] [CrossRef]
  26. National Research Council. Observing Weather and Climate from the Ground Up: A Nationwide Network of Networks; National Academies Press: Washington, DC, USA, 2019; p. 250. Available online: www.nap.edu/catalog/12540 (accessed on 8 July 2020).
  27. Anderson, J.L.; Collins, N. Scalable Implementations of Ensemble Filter Algorithms for Data Assimilation. J. Atmos. Ocean. Technol. 2007, 24, 1452–1463. [Google Scholar] [CrossRef]
  28. Anderson, J.L. An ensemble adjustment filter for data assimilation. Mon. Weather Rev. 2001, 129, 2884–2903. [Google Scholar] [CrossRef] [Green Version]
  29. Boukabara, S.-A.; Zhu, T.; Tolman, H.L.; Lord, S.; Goodman, S.; Atlas, R.; Goldberg, M.; Auligne, T.; Pierce, B.; Cucurull, L.; et al. S4: An O2R/R2O Infrastructure for Optimizing Satellite Data Utilization in NOAA Numerical Modeling Systems: A Step Toward Bridging the Gap between Research and Operations. Bull. Am. Meteorol. Soc. 2016, 97, 2359–2378. [Google Scholar] [CrossRef]
  30. Stensrud, D.J.; Bao, J.W.; Warner, T.T. Using initial condition and model physics perturbations in short-range ensemble simulations of mesoscale convective systems. Mon. Weather Rev. 2000, 128, 2077–2107. [Google Scholar] [CrossRef]
  31. Fujita, T.; Stensrud, D.J.; Dowell, D.C. Surface Data Assimilation Using an Ensemble Kalman Filter Approach with Initial Condition and Model Physics Uncertainties. Mon. Weather Rev. 2007, 135, 1846–1868. [Google Scholar] [CrossRef] [Green Version]
  32. Ek, M.B.; Mitchell, K.E.; Lin, Y.; Rogers, E.; Grunmann, P.; Koren, V.; Gayno, G.; Tarpley, J.D. Implementation of Noah land surface model advances in the National Centers for Environmental Prediction operational mesoscale Eta model. J. Geophys. Res. Space Phys. 2003, 108, 752–771. [Google Scholar] [CrossRef]
  33. Gaspari, G.; Cohn, S.E. Construction of correlation functions in two and three dimensions. Q. J. R. Meteorol. Soc. 1999, 125, 723–757. [Google Scholar] [CrossRef]
  34. Anderson, J.L. Spatially and temporally varying adaptive covariance inflation for ensemble filters. Tellus A: Dyn. Meteorol. Oceanogr. 2009, 61, 72–83. [Google Scholar] [CrossRef]
  35. Turner, D.D.; Löhnert, U. Information Content and Uncertainties in Thermodynamic Profiles and Liquid Cloud Properties Retrieved from the Ground-Based Atmospheric Emitted Radiance Interferometer (AERI). J. Appl. Meteorol. Clim. 2014, 53, 752–771. [Google Scholar] [CrossRef]
  36. Clough, S.; Shephard, M.; Mlawer, E.; Delamere, J.; Iacono, M.; Cady-Pereira, K.; Boukabara, S.-A.; Brown, P. Atmospheric radiative transfer modeling: A summary of the AER codes. J. Quant. Spectrosc. Radiat. Transf. 2005, 91, 233–244. [Google Scholar] [CrossRef]
  37. Turner, D.D.; Knuteson, R.O.; Revercomb, H.E.; Lo, C.; Dedecker, R.G. Noise Reduction of Atmospheric Emitted Radiance Interferometer (AERI) Observations Using Principal Component Analysis. J. Atmos. Ocean. Technol. 2006, 23, 1223–1238. [Google Scholar] [CrossRef]
  38. Wulfmeyer, V.; Turner, D.D.; Baker, B.; Banta, R.; Behrendt, A.; Bonin, T.; Brewer, W.; Buban, M.; Choukulkar, A.; Dumas, E.; et al. A New Research Approach for Observing and Characterizing Land-Atmosphere Feedback. Bull. Am. Meteorol. Soc. 2018, 136, 78–97. [Google Scholar] [CrossRef]
  39. Schwartz, C.S.; Sobash, R.A. Generating Probabilistic Forecasts from Convection-Allowing Ensembles Using Neighborhood Approaches: A Review and Recommendations. Mon. Weather Rev. 2017, 145, 3397–3418. [Google Scholar] [CrossRef]
  40. Roberts, N.M. Assessing the spatial and temporal variation in the skill of precipitation forecasts from an NWP model. Meteorol. Appl. 2008, 15, 163–169. [Google Scholar] [CrossRef] [Green Version]
  41. Roberts, N.M.; Lean, H.W. Scale-Selective Verification of Rainfall Accumulations from High-Resolution Forecasts of Convective Events. Mon. Weather. Rev. 2008, 136, 78–97. [Google Scholar] [CrossRef]
  42. Smith, T.M.; Lakshmanan, V.; Stumpf, G.J.; Ortega, K.; Hondl, K.; Cooper, K.; Calhoun, K.M.; Kingfield, D.; Manross, K.L.; Toomey, R.; et al. Multi-Radar Multi-Sensor (MRMS) Severe Weather and Aviation Products: Initial Operating Capabilities. Bull. Am. Meteorol. Soc. 2016, 97, 1617–1630. [Google Scholar] [CrossRef]
  43. Davison, A.C.; Hinkley, D.V. Bootstrap Methods and their Application. Cambridge Series in Statistical and Probabilistic Mathematics; Cambridge University Press: Cambridge, UK, 1997; p. 592. [Google Scholar]
Figure 1. Boundaries of the WRF computational domain (blue) and localization radii (magenta) with respect to the Atmospheric Emitted Radiance Interferometer (AERI) sites (green triangles). The boundaries of the radar analysis and “downwind” subdomains are shown in solid and dashed red, respectively. Locations of Automated Surface Observing System (ASOS) observing sites used to verify WRF-DART model surface temperature and dewpoint analyses are shown by solid gray circles.
Atmosphere 11 00729 g001
Figure 2. Summary of the synoptic weather situation on 18 May 2017: (a) 12:00 UTC 500-hPa heights (brown) and temperatures (red) courtesy of the Storm Prediction Center (SPC) and (b) 12:00 UTC surface analysis depicting surface fronts and dry line courtesy of the Weather Prediction Center (WPC).
Atmosphere 11 00729 g002
Figure 3. SPC Tornado Outlook issued at 19:45 UTC 18 May and valid 20:00 UTC 18 May through 12:00 UTC 19 May shown in (a), with severe weather reports (red, blue, and green indicating locations of conditions satisfying tornado, wind, and hail criteria, respectively) for 18 and 19 May in (b). Note that though the day indicated in (b) is 18 May, the reports are for severe weather reports received from 19:00 UTC on 18 May through 11:00 UTC on 19 May.
Atmosphere 11 00729 g003
Figure 4. Comparison of analysis root mean square error (RMSE) (solid lines) and bias (dashed lines) for the AERI (red) and AERI NOBC (black) experiments. Errors and biases are averaged by vertical level over the duration of the nine-hour period of data assimilation (DA) cycling from 18:00 UTC 18 May to 03:00 UTC 19 May for (a) rawinsonde observation system (RAOB) temperature (K), (b) RAOB specific humidity (g/kg), (c) aircraft communications addressing and reporting system (ACARS) zonal wind (m/s) and (d) ACARS meridional wind (m/s).
Atmosphere 11 00729 g004
Figure 5. WRF-DART surface temperature (K) (a and b) and water vapor mixing ratio (g/kg) (d and e) ensemble-mean analyses valid at 19:00 UTC 18 May. Differences between the AERI and CTL experiments are shown in the rightmost column (temperature and dewpoint in c and f, respectively). Locations of AERI observing sites are depicted by green triangles.
Atmosphere 11 00729 g005
Figure 6. WRF-DART convective available potential energy (CAPE, J/kg) (a,b) and convective inhibition (CIN, J/kg) (d,e) ensemble-mean analyses valid at 19:00 UTC 18 May. Differences between the AERI and CTL experiments are shown in the rightmost column (CAPE and CIN in c,f, respectively). Locations of AERI observing sites are depicted by green triangles.
Atmosphere 11 00729 g006
Figure 7. Observed composite reflectivity factor valid at (a) 20:00, (d) 21:00 and (g) 22:00 UTC 18 May. Also shown are paintball plots of simulated composite reflectivity factor ≥40 dBZ for WRF AERI ensemble forecasts initiated at 19 UTC and valid at (b) 20, (e) 21, and (h) 22 UTC as well as the corresponding CTL ensemble forecasts valid at (c) 20, (f) 21, and (i) 22 UTC.
Atmosphere 11 00729 g007
Figure 8. Neighborhood maximum ensemble probabilities (NMEP) for 1-h WRF forecasts initiated at 21:00 UTC and valid at 22:00 UTC 18 May. CTL forecasts (a) and AERI forecasts (b) are evaluated using a threshold composite reflectivity factor of 30 dBZ. NMEP differences (AERI minus CTL) are shown in the rightmost column (c). The heavy black line depicts the threshold contour in the observed NSSL multi-radar/multi-sensor (MRMS) composite reflectivity. Locations of AERI observing sites are depicted by green triangles.
Atmosphere 11 00729 g008
Figure 9. Neighborhood maximum ensemble probabilities (NMEP) for 1-h WRF forecasts initiated at 22:00 UTC and valid at 23:00 UTC 18 May. CTL forecasts (a) and AERI forecasts (b) are evaluated using a threshold composite reflectivity factor of 50 dBZ. NMEP differences (AERI minus CTL) are shown in the rightmost column (c). Reported locations of hail occurring from 22:53 UTC and 23:07 UTC are shown by green squares (per SPC reports). Note: AERI site locations are not shown to avoid confusion.
Atmosphere 11 00729 g009
Figure 10. Fractions skill scores (FSS) for composite radar reflectivities ≥30 dBZ as a function of neighborhood width (where neighborhood width is one-half the neighborhood radius). FSS for CTL (black) and AERI (red) are aggregated by lead time—(a) 1 h, (b) 2 h, (c) 3 h, (d) 4 h, (e) 5 h, (f) 6 h—over all forecasts initiated from 19:00 UTC to 22:00 UTC. The difference between the AERI and CTL FSS is depicted by the solid blue line, and 95% bootstrap confidence intervals are indicated by the shaded gray region. The dashed gray line represents the minimum FSS for which forecasts are considered skillful (i.e., FSSuseful = 0.5 + f0/2, where f0 is the aggregate observed event frequency). The FSS were computed for the portion of the computational domain defined by the solid red rectangle in Figure 1.
Atmosphere 11 00729 g010
Figure 11. Fractions skill scores (FSS) for composite radar reflectivities ≥30 dBZ as a function of neighborhood width (where neighborhood width is one-half the neighborhood radius). FSS for CTL (black) and AERI (red) are aggregated by lead time—(a) 1 h, (b) 2 h, (c) 3 h, (d) 4 h, (e) 5 h, (f) 6 h—over all forecasts initiated from 19:00 UTC to 22:00 UTC. The difference between the AERI and CTL FSS is depicted by the solid blue line, and 95% bootstrap confidence intervals are indicated by the shaded gray region. The dashed gray line represents the minimum FSS for which forecasts are considered skillful (i.e., FSSuseful = 0.5 + f0/2, where f0 is the aggregate observed event frequency). The FSS were computed for the portion of the computational domain defined by the dashed red rectangle in Figure 1 (i.e., the “downwind” domain).
Atmosphere 11 00729 g011
Figure 12. Fractions skill scores (FSS) for composite radar reflectivities ≥30 dBZ as a function of neighborhood width (where neighborhood width is one-half the neighborhood radius). FSS for CTL (black) and AERI (red) are aggregated by lead time—(a) 1 h, (b) 2 h, (c) 3 h, (d) 4 h, (e) 5 h, (f) 6 h—over all forecasts initiated from 19:00 UTC to 22:00 UTC. The difference between the AERI and CTL FSS is depicted by the solid blue line, and 95% bootstrap confidence intervals are indicated by the shaded gray region. The dashed gray line represents the minimum FSS for which forecasts are considered skillful (i.e., FSSuseful = 0.5 + f0/2, where f0 is the aggregate observed event frequency). The FSS were computed for the portion of the computational domain defined as the difference between the areas enclosed by the solid red rectangle and dashed red rectangles in Figure 1.
Atmosphere 11 00729 g012
Figure 13. Fractions skill scores (FSS) for composite radar reflectivities ≥50 dBZ as a function of neighborhood width (where neighborhood width is one-half the neighborhood radius). FSS for CTL (black) and AERI (red) are aggregated by lead time—(a) 1 h, (b) 2 h, (c) 3 h, (d) 4 h, (e) 5 h, (f) 6 h—over all forecasts initiated from 19:00 UTC to 22:00 UTC. The difference between the AERI and CTL FSS is depicted by the solid blue line, and 95% bootstrap confidence intervals are indicated by the shaded gray region. The dashed gray line represents the minimum FSS for which forecasts are considered skillful (i.e., FSSuseful = 0.5 + f0/2, where f0 is the aggregate observed event frequency). The FSS were computed for the portion of the computational domain defined by the dashed red rectangle in Figure 1 (i.e., the downwind portion of the domain).
Atmosphere 11 00729 g013
Table 1. Ensemble configuration for the Weather Research and Forecasting Model-Data Assimilation Research Testbed (WRF-DART) system used in this study with respect to Ensemble Kalman Filter (EnKF) members, Global Ensemble Forecast System (GEFS) members Initial and Boundary Conditions (IC/BC), Radiation Schemes, Surface Layer schemes, and Planetary Boundary Layer (PBL) schemes.
EnKF MembersGEFS Members (IC/BC)Radiation SchemeSurface Layer SchemePBL Scheme
1–91–9RRTM LW Dudhia SWMM5YSU
10–1810–18RRTM LW Dudhia SWMYNNMYNN 2.5
19–2718–10RRTM LW/SWMM5YSU
28–369–1RRTM LW/SWMYNNMYNN 2.5
Table 2. Details of the DART configuration used in this study, including filter parameter settings and covariance localizations for radiosonde observations (RAOB), Aircraft Communications Addressing and Reporting System (ACARS) observations, Meteorological Aerodrome Report (METAR) observations, and Atmospheric Emitted Radiance Interferometer (AERI) observations.
ParameterValue
Filter TypeEnsemble Adjustment KF
Adaptive Inflation Parameters1.0 (initial mean), 0.6 (spread)
Inflation Damping Parameter0.9
Outlier Threshold3.0
Covariance Localization TypeGaspari–Cohn
RAOB horizontal/vertical localization half-width (km)230/4
ACARS horizontal/vertical localization half-width (km)230/4
METAR horizontal/vertical localization half-width (km)60/4
AERI horizontal/vertical localization half-width (km)200/4
Table 3. Control (CTL) and AERI analysis RMSE and bias (in parenthesis) with respect to Automated Surface Observing System (ASOS) observations of 2-m temperature and dewpoint temperature in Kansas and Oklahoma. Results presented are averaged over the duration of the nine-hour period of DA cycling from 18:00 UTC 18 May to 03:00 UTC 19 May. Statistically significant results (at the 99% level using a one-sided t-test) are shown in bold.
Simulation2 m Temperature (K)2 m Dewpoint Temperature (K)
CTL2.21 (0.69)1.39 (0.45)
AERI2.09 (0.61)1.38 (0.23)