Groundwater Vulnerability in the Piedmont Region under Climate Change

1
Earthresearch Company, Department of Hydrogeology, 400000 Cluj-Napoca, Romania
2
School of Civil and Environmental Engineering, Nanyang Technological University, Singapore 639798, Singapore
Atmosphere 2020, 11(8), 779; https://doi.org/10.3390/atmos11080779
Submission received: 12 June 2020
/
Revised: 16 July 2020
/
Accepted: 20 July 2020
/
Published: 23 July 2020
(This article belongs to the Special Issue Climatological and Hydrological Processes in Mountain Regions)
Abstract
:Groundwater vulnerability has increased in recent decades due to several factors, but mainly due to climate change. In this study, we applied a complex approach to determine groundwater vulnerability at a regional scale in the Piedmont region including high-resolution climate models. Aquifers, terrain model, climate data, land cover, and groundwater monitoring stations data of nitrate (NO3) concentration were the main layers used for the vulnerability and risk mapping. Validation of the groundwater vulnerability map consisted of pixel pair comparison (PPC) using the quality status of a monitored groundwater station, dating from 2005 to 2012. The groundwater vulnerability maps that related to the 1990s and 2020s periods indicated very high and high vulnerability of groundwater in the central and eastern parts of the region, especially in the porous aquifers of Po Plain. The areas with very low and low vulnerability extend into the north and west, mainly in the non-aquiferous media and fissured aquifers. The future scenarios of groundwater vulnerability indicate a consistent increase of the very high vulnerability class, from the 1990s to the 2050s periods, in all scenarios, and mainly in the Po Plain.
1. Introduction
Water resources investigations represent high interest for scientists and environmental authorities of each region. Nowadays, in many regions around the globe, surface waters and groundwater are facing high pressure from climate change, anthropogenic factors, land cover, and related practices [1]. Therefore, groundwater vulnerability mapping has become an indispensable tool for the delineation of protection zones, reduction of industrial activities, and intense agriculture [2]. In the last decade, several methods have been developed with respect to groundwater vulnerability assessment, both at a spatial scale and in situ locations.
The negative impacts of climate change on river flow discharge, sea-water intrusion, glacier melting, water table depletion, and poor groundwater quality have been reported in several studies [3,4]. The negative pressure of climate warming is reflected in water resources, and also in natural ecosystems, agriculture, and landslide risk areas [5,6,7,8]. The main impact of climate change on groundwater resources has been divided into the following two types: (i) direct impact with respect to the aquifer recharge and (ii) indirect impact which implies the groundwater demand [9]. At the same time, the contribution of land use and human impact on groundwater quality and quantity is mentioned [9]. However, there are many theoretical aspects and several direct and indirect effects of climate change on groundwater that have not already been explored, and they have not happened before [10,11].
Water availability is expected to decrease on the European continent in the near future and by mid-century [12]. Studies regarding these kinds of climate surveys have been based on climate data projections that were performed using different models and sources [13,14,15]. A few examples, based on the high-resolution precipitation data [16], have analyzed the rainfall erosivity for Europe. In the South Eastern Europe region, the climate impact on groundwater resources has been evaluated considering the high-resolution climate models of precipitations and temperature [17]. Throughout Europe, many regions have experienced an increase in evapotranspiration due to climate change and land cover practices [18].
In the Mediterranean areas, due to the negative influence of climate on groundwater resources, springs have been investigated using continuous monitoring of flow discharge, temperature, and electrical conductivity. On the basis of recorded data of temperature, discharge, and electrical conductivity, the VESPA index for groundwater vulnerability in springs was set up by [19]. They developed and tested the vulnerability of four fractured springs from the Piedmont region considering climate change and pollutants. Spatial analyses using various software are often used for the investigations of karstic and porous aquifers. For instance, a study by [1] analyzed groundwater vulnerability and pollution risk in the north of Greece using DRASTIC, EPIK, AVI, and DRASTIC-FM methods developed in GIS. Their study indicated the possibility of groundwater quality degradation under sea water intrusion into the karst aquifer and also due to the inadequate delineation of protection zones and agriculture planning. In a study by [20], the effect of climate including the water availability on the karst aquifers over the world was assessed. In contrast to the porous aquifers, where the changes have been more related to the water table, in the karst regions the effect of climate has been related to the discharge of springs [20].
An important aspect of groundwater vulnerability is related to intrinsic vulnerability, which refers to the sensitivity of groundwater quality to a certain contaminant and it accounts for the geological, hydrological, and hydrogeological characteristics of the respective area, and also the recharge rate, aquifer properties, and unsaturated zone [21,22]. The intrinsic characteristics of the aquifers control groundwater vulnerability to pollution load and contamination [21]. For an intrinsic vulnerability assessment of aquifers, hydrogeological properties are required. In order to support future plans and strategies regarding water resources, spatial evaluation of groundwater vulnerability could be performed using specific software. Thus, groundwater vulnerability mapping becomes a significant task for planning and decision making [23]. A study by [24] determined the intrinsic vulnerability of the quaternary aquifer in Baghdad using DRASTIC and GIS tools. As an example of intrinsic groundwater vulnerability mapping, [25] used the DRASTIC method in Datong City from China, emphasizing the advantage of the approach in regions with limited data. The DRASTIC method was also used to determine the aquifer vulnerability in western and southern Taiwan [26,27].
In the Piedmont region, climate change effects are more intense during dry periods. Because of this aspect, the porous aquifers located at low altitude are facing significant pressure due to water deficit and agriculture practices. A study on long-term analysis including future climate models and land cover scenarios is missing for this region. In addition, [28] found that DRASTIC, GOD, and TOT methods, applied for the groundwater vulnerability mapping, were not able to identify the most vulnerable areas. The nitrate concentration was used to validate these intrinsic methods, and a good correlation was only partially verified [28].
Past studies have indicated that the SINTACS and the DRASTIC methods were the two major approaches used for groundwater vulnerability assessment in some subzones of this region. Studies by [29,30] used the SINTACS method for groundwater vulnerability mapping. Using a combination of traditional Italian approaches, such as the GNDCI-CNR Basic method and PCSM SINTACS, the authors of [30,31] proposed a GIS method for groundwater vulnerability. In the Alessandria district from the east part of Piedmont region, a study by [31] carried out vulnerability mapping of groundwater using eight parameters at a spatial scale, for example, aquifers, land cover, slope, hydraulic conductivity, etc.
These methods are very useful for groundwater vulnerability mapping, while these approaches are based on multilayers analysis through GIS applications. However, climate data for future groundwater vulnerability prediction were rarely included in the previous methods at a regional scale.
The scope of this study is to determine the vulnerability of groundwater resources at a spatial scale for the Piedmont region, considering climate change factors. This region was chosen as a suitable study area because of its geographical position in the Mediterranean area and its various aquifer types (karst, fractured and fissured rocks aquifers, and porous). In addition, the region presents high variability of climate between the high Alps Mountains and the Po Plain, and also presents biodiversity from a land cover point of view.
2. Study Area
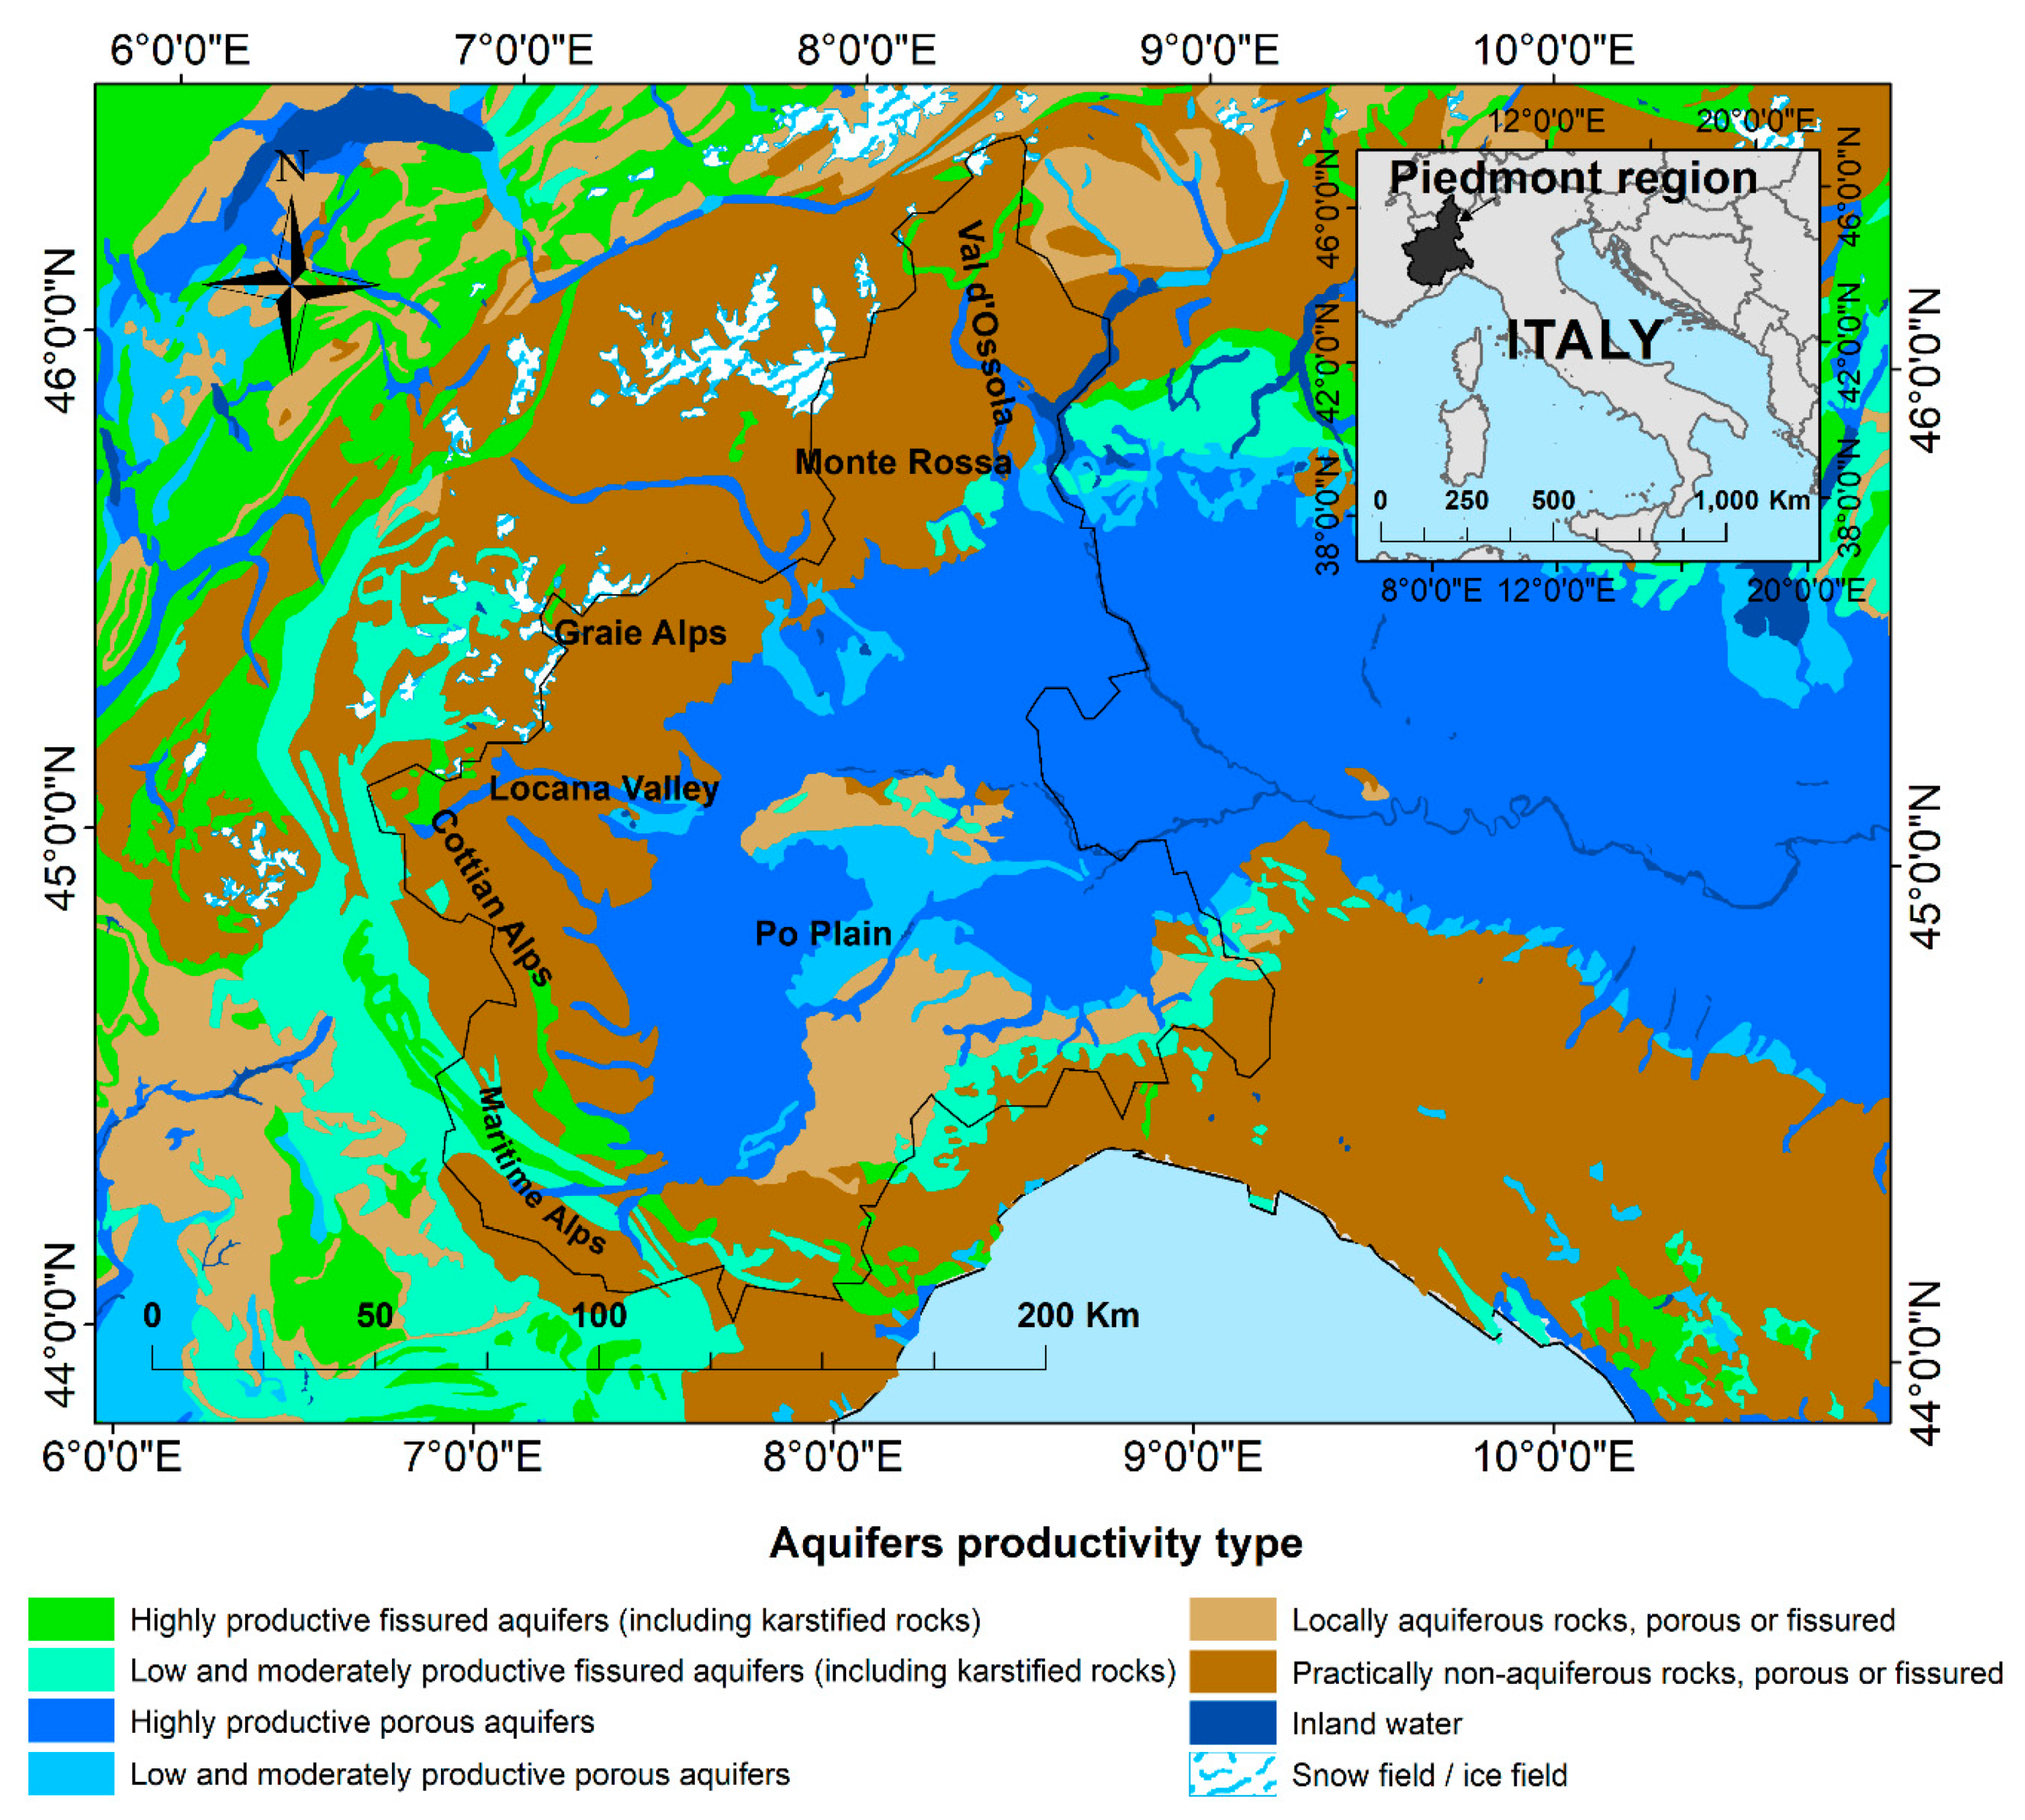
The Piedmont region extends from 44°3′ to 46°27′ N and from 6°38′ to 9°13′ E (Figure 1). Geographically, its position fits into the south of Europe, in the north-western part of Italy. The northern, western, and southern parts of the Piedmont region are mountainous areas of the Western Alps, while the central and eastern parts are represented by lowlands of the Po Plain. In December 2017, [32] reported a value of 235 L/person /day for domestic water demand, in the Piedmont region, registered for 2015. This value is higher than 180 L/person /day depicted in Northern Europe and proper management of water resources is needed for the near-future period.
Regarding the orography of the Piedmont region, the relief is distributed similar to an amphitheater, with high elevations in the north, west, and south, whereas the central and east parts are more occupied by plains. Because of these characteristics, the surface water flow converges over the east, where the main river collector is the Po. Groundwater flow and storage, and also groundwater vulnerability are related to the aquifers and climate. The aquifers characteristics are based on geological composition. In the mountain areas, there are predominantly the karstified limestones, marlstones, calystones, and also conglomerates. In the lowlands, the porous aquifers are composed of mainly gravels and sands. In a few locations, aquifers with volcanic and schists can be identified. Supplementary Material Figure S1 depicts the geological formations of the Piedmont region. The productivity of each aquifer type has been classified into the following six categories: highly productive fissured aquifers, highly productive porous aquifers, low and moderately productive fissured aquifers, low and moderately productive porous aquifers, locally aquiferous rocks (porous or fissured), practically non-aquiferous (porous or fissured) (Figure 1).
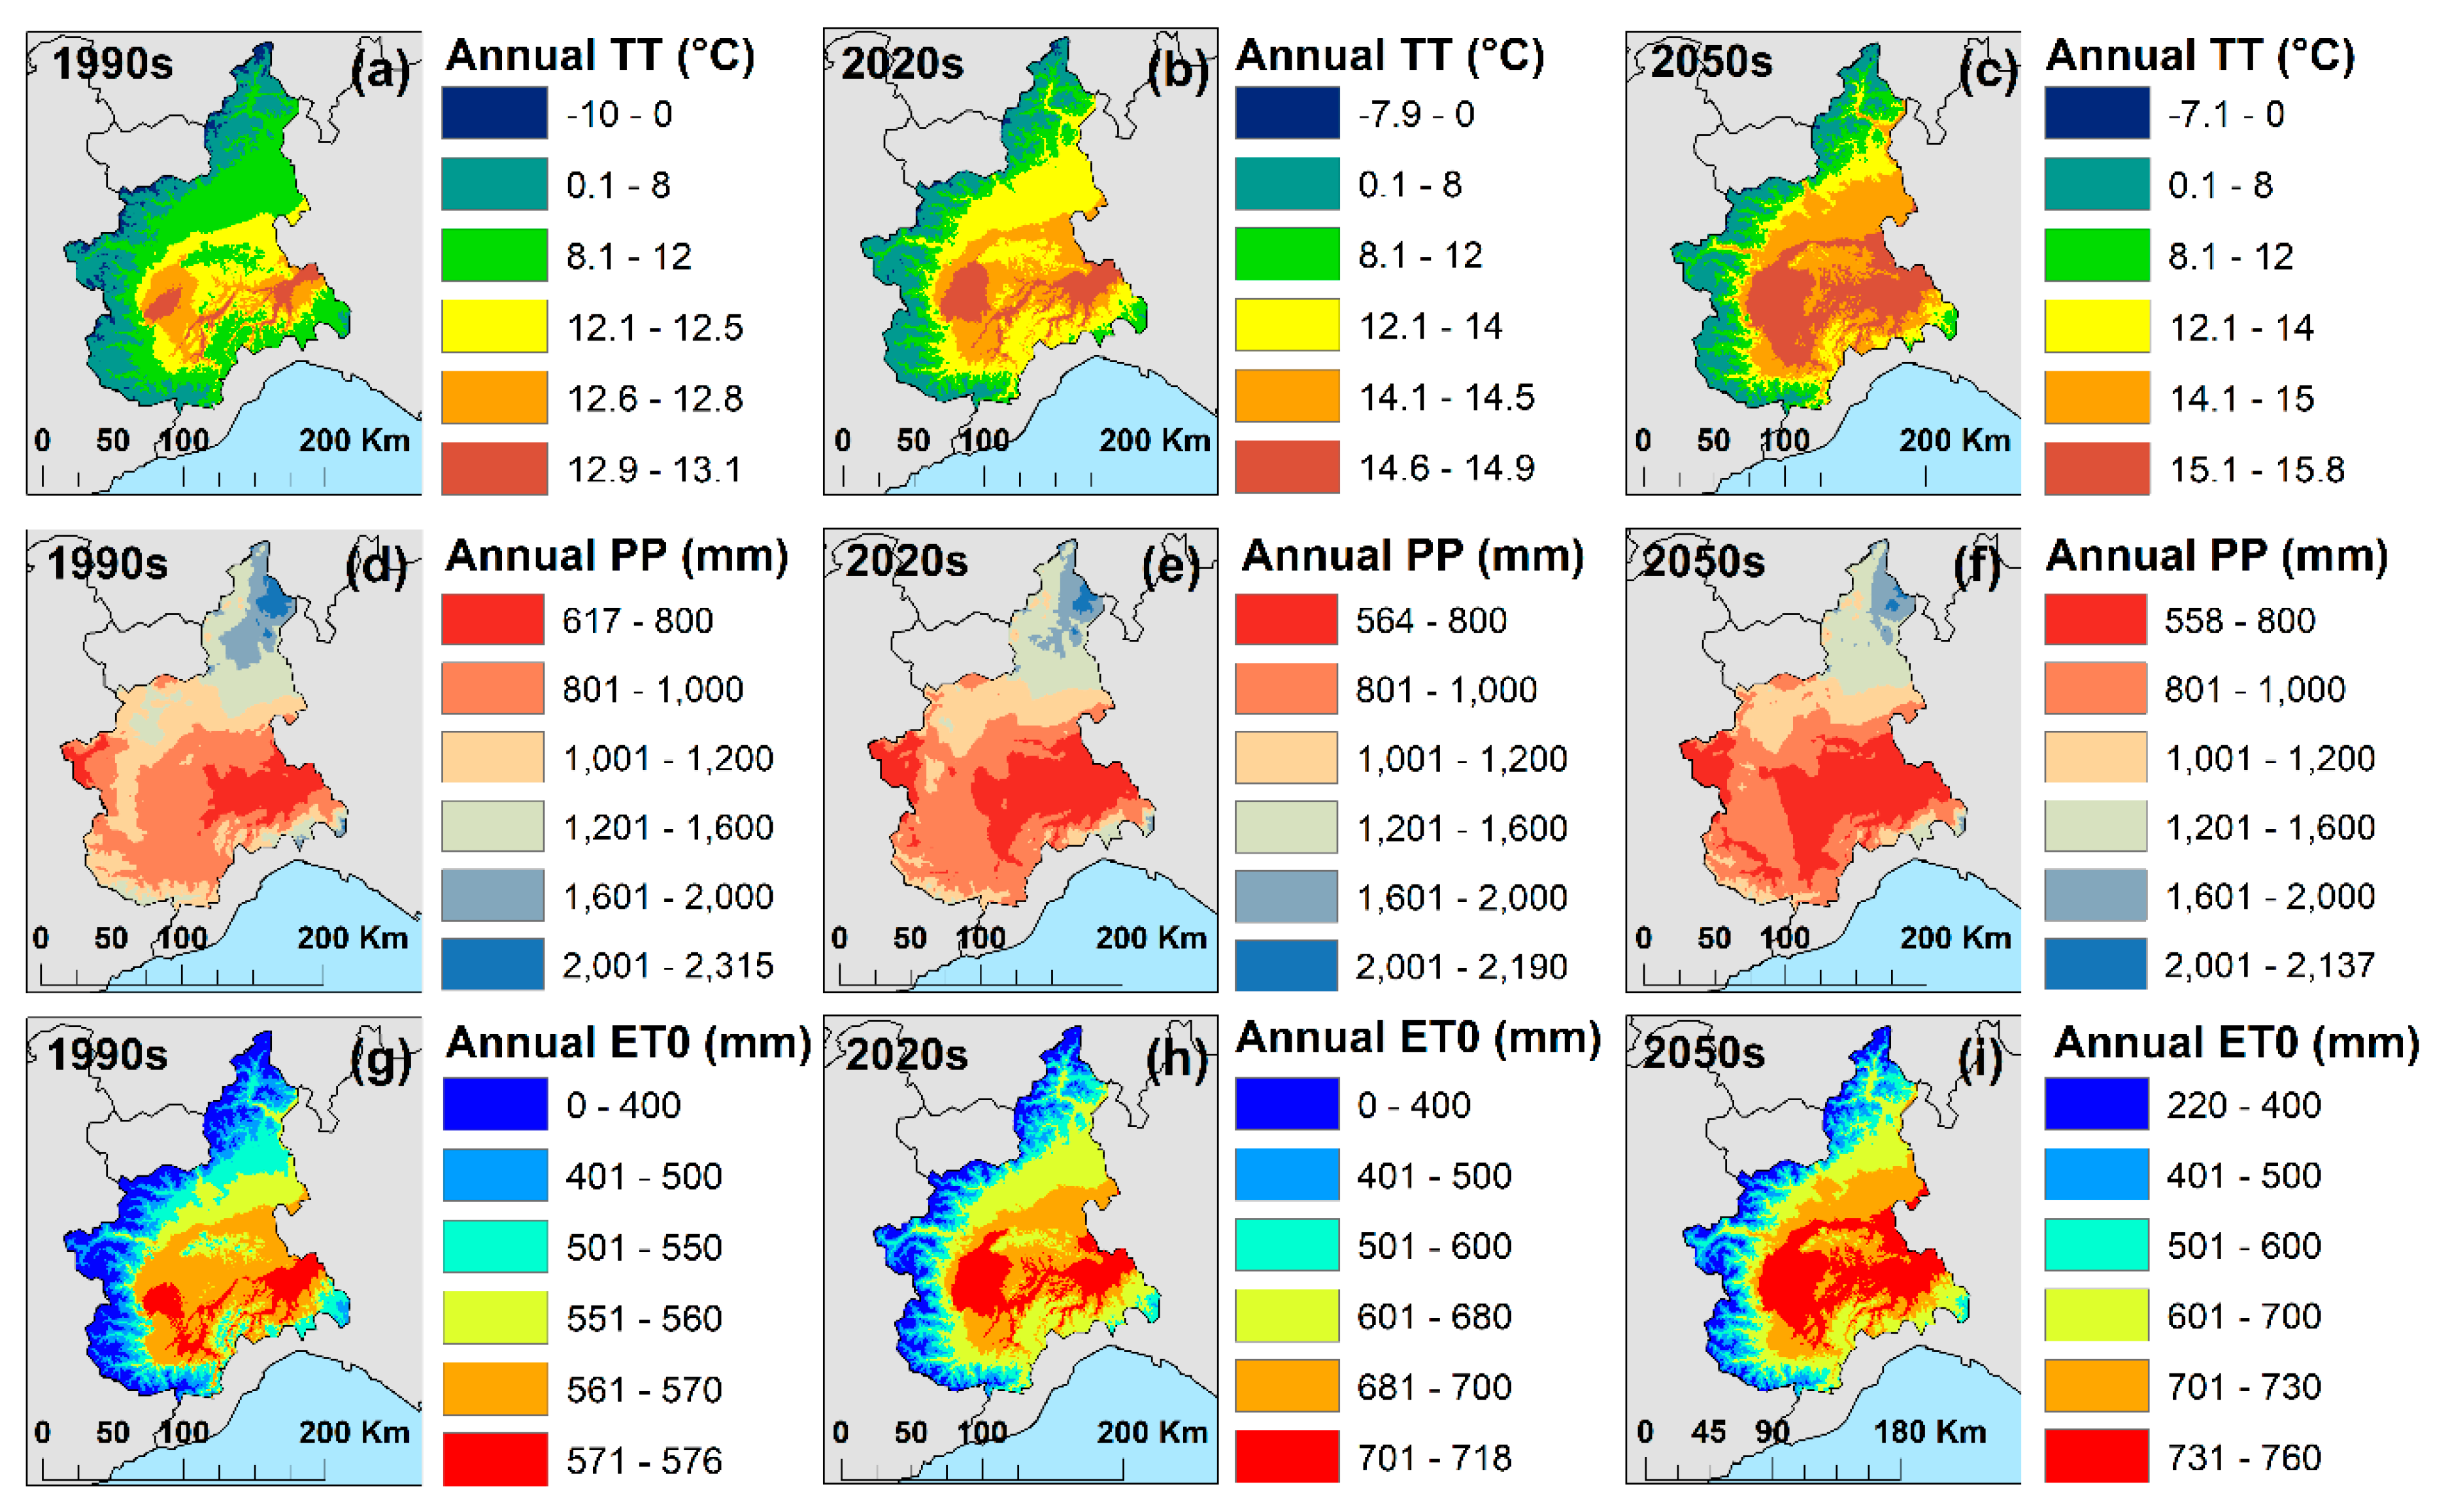
The climate of the region is warm temperate with a Mediterranean influence. According to the Köppen–Geiger climate classification, Cfa and Cfb (warm temperate with hot and warm summers) have been identified in the central, east, west, and north parts of the Piedmont region [33]. In the south, there is mainly warm temperate with dry summer (Csa), and within the high elevated lands, the Dfb climate (snow fully humid) is depicted [33]. The mean annual temperature indicated values between –10 °C and 13.1 °C during the 1990s period (Figure 2a). Future climate models show increases in the mean annual temperature from −7.9 °C to 14.9 °C during the 2020s period (Figure 2b) and from −7.1 °C to 15.8 °C in the 2050s period (Figure 2c). In the Piedmont region, values of precipitation have been identified which varied from 617 mm to 2315 mm /year during the 1990s period (Figure 2d), while in the future, the precipitation values vary from 564 mm to 2190 mm /year (2020s) and from 558 mm to 2137 mm /year (Figure 2e,f). The annual potential evapotranspiration (ET0) registers values between 0 mm and 576 mm during the 1990s period (Figure 2g). Significant increases are expected in the following future periods: from 0 mm to 718 mm during the 2020s period and from 220 mm to 760 mm during the 2050s period (Figure 2h,i).
The vegetation pattern is much diversified in the Piedmont region. In the mountain areas, forest types can be found. Agricultural lands and artificial areas mainly cover the plains. The villages and cities extend mainly in the hills and plains. The bigger urban agglomeration is Turin, located in the west-central side of the Piedmont region. For groundwater vulnerability determination, the importance of land cover study has two main directions which we followed. Firstly, the evapotranspiration and water availability in each type of land cover have a quantitative impact. Secondly, the phosphorous transfer in soils and the load pollution of each type of ecosystem influence direct the quality of the groundwater through an infiltration process.
3. Materials and Methods
3.1. Overview of the Methodology
For the determination of groundwater vulnerability, in the Piedmont region, we focused on two main approaches that included a ”quantity approach” and a ”quality approach”, and both consist of GIS analyses at a spatial scale. In this way, we combined the main factors that influence groundwater vulnerability from a quantity point of view (e.g., climate data, terrain data, and lithology data) and from a quality point of view (e.g., aquifers data, land cover data, and NO3 data). The way in which the layers were combined, and the groundwater vulnerability was determined, followed the NISTOR-GWV methodology [34].
3.2. Quantity Approach
3.2.1. Climate Data and Water Availability
In the present study, the high spatial resolution (1 km2) climate models of the monthly air temperature and annual precipitation were used to determine water availability in the Piedmont region. Baseline (1961–1990), present (2011–2040), and future (2041–2070) periods, thereafter, called here 1990s, 2020s, and 2050s periods, are the main temporal 30-year time spans for which we have complete analysis. The data grid of climate models was courtesy of Andreas Hamann, who runs models for all of Europe using the same procedures as for North America [14]. The parameter regression of independent slopes model (PRISM) was used for monthly precipitation models and the ANUSplin interpolation method was used to obtain the monthly temperature models. The representative concentration pathway (RCP) 4.5 emission for moderate climate change projection of globally prediction +1.4 °C (±0.5) was chosen for this study. The precipitation and temperature data are bias corrected and calibrated based on the anomaly method. Moreover, the climate projections are in agreement with the 15 AOGCMs of the CMIP5 multimodel dataset and are in line with the IPCC Fifth Assessment Report [35]. ClimateEU v4.63 software, which is available on the website (http://tinyurl.com/ClimateEU), was used for the model construction. For the low-resolution AOGCM grid cells located in the adjacent areas, a bilinear interpolation was used to correct the artefacts. Studies by [36,37] have proposed the procedure for the climate models projection. According to these models, water availability was carried out at a spatial scale of Europe [12], and data were available for public access (Zenodo. Available online: https://doi.org/10.5281/zenodo.1044306).
3.2.2. Potential Evapotranspiration (ET0)
Climate models of temperature and precipitation which were divided into three datasets of 30 years, were processed to carry out the annual ET0, ETc, actual evapotranspiration (AETc), and water availability, in the study area. The mathematical operations were executed in ArcGIS environment using raster grids data. At the European level, the authors of [12] calculated the evapotranspiration and water availability based on the Thornthwaite method [38] and their results are available on the website (Zenodo. Available online: https://doi.org/10.5281/zenodo.1044306). Since the Thornthwaite method (Equation (1)) is practical for agricultural and hydrological studies [39,40,41], we agreed with this method for our study because we were focused on regional territory and for long-term periods (1961–1990, 2011–2040, and 2041–2070).
where:
- ET0
- monthly potential evapotranspiration (mm);
- Ti
- average monthly temperature [°C], ET0 = 0 if mean temperature < 0;
- I
- heat index (Equation (2));
- α
- complex function of heat index (Equation (3)).
- Ti
- monthly air temperature.
- I
- annual heat index.
3.2.3. Crop Evapotranspiration (ETc) and Water Availability (WA)
A study by [42] brought forward the standard crop coefficient (Kc) values for various crops and vegetation types throughout the world. In the United State, the authors of [43] calculated Kc values related to urban areas. A study by [44] set the spatial approach for the seasonal and annual ETc mapping. For uses of direct annual ETc, the annual Kc values have been calculated by [18] and applied successfully for the hydrogeological purposes. The ETc determination is based on the product between ET0 and Kc (Equation (4)). In order to incorporate the land cover evapotranspiration, we proceeded with the ETc calculation. Thus, in this paper, we used the standard annual Kc values [45] to calculate the annual ETc for the 1990s, 2020s, and 2050s periods. In addition, using the Budyko approach (Equation (5)) [46], we determined the AETc calculation and further, the water availability.
where:
- ETc
- land cover evapotranspiration (mm);
- ET0
- potential evapotranspiration (mm);
- Kc
- crop coefficient (dimensionless).
The water availability was calculated subtracting the AETc from precipitation (Equation (5)). The climate data and land cover calculation were processed using the “raster calculator” function, in ArcGIS environment.
where:
- AETc
- actual land cover evapotranspiration (mm);
- PP
- total annual precipitation (mm);
- φ
- aridity index (Equation (6)).
- WA
- water availability (mm);
- PP
- total annual precipitation (mm);
- AETc
- actual land cover evapotranspiration (mm).
3.2.4. Terrain Data and Infiltration Map
The morphology of the terrain and the lithological composition primarily influenced the infiltration process. For this study, we used the digital elevation model and the potential infiltration coefficient (PIC) of aquifers to elaborate the infiltration map of the Piedmont region. On the basis of gravity, we assumed the higher infiltration rate values where the PIC was higher, and the slope angle was lower, and vice versa. A study by [47] agreed with the ratio between the PIC and slope angle, and obtained the infiltration map for their study about groundwater vulnerability in the mountain area of Western Carpathians. Adopting this method, we normalized (0 to 1) the GIS layers of the PIC and slope angle to carry out the infiltration map of the Piedmont region (Supplementary Material Figure S3).
3.3. Quality Approach
3.3.1. Aquifers Data
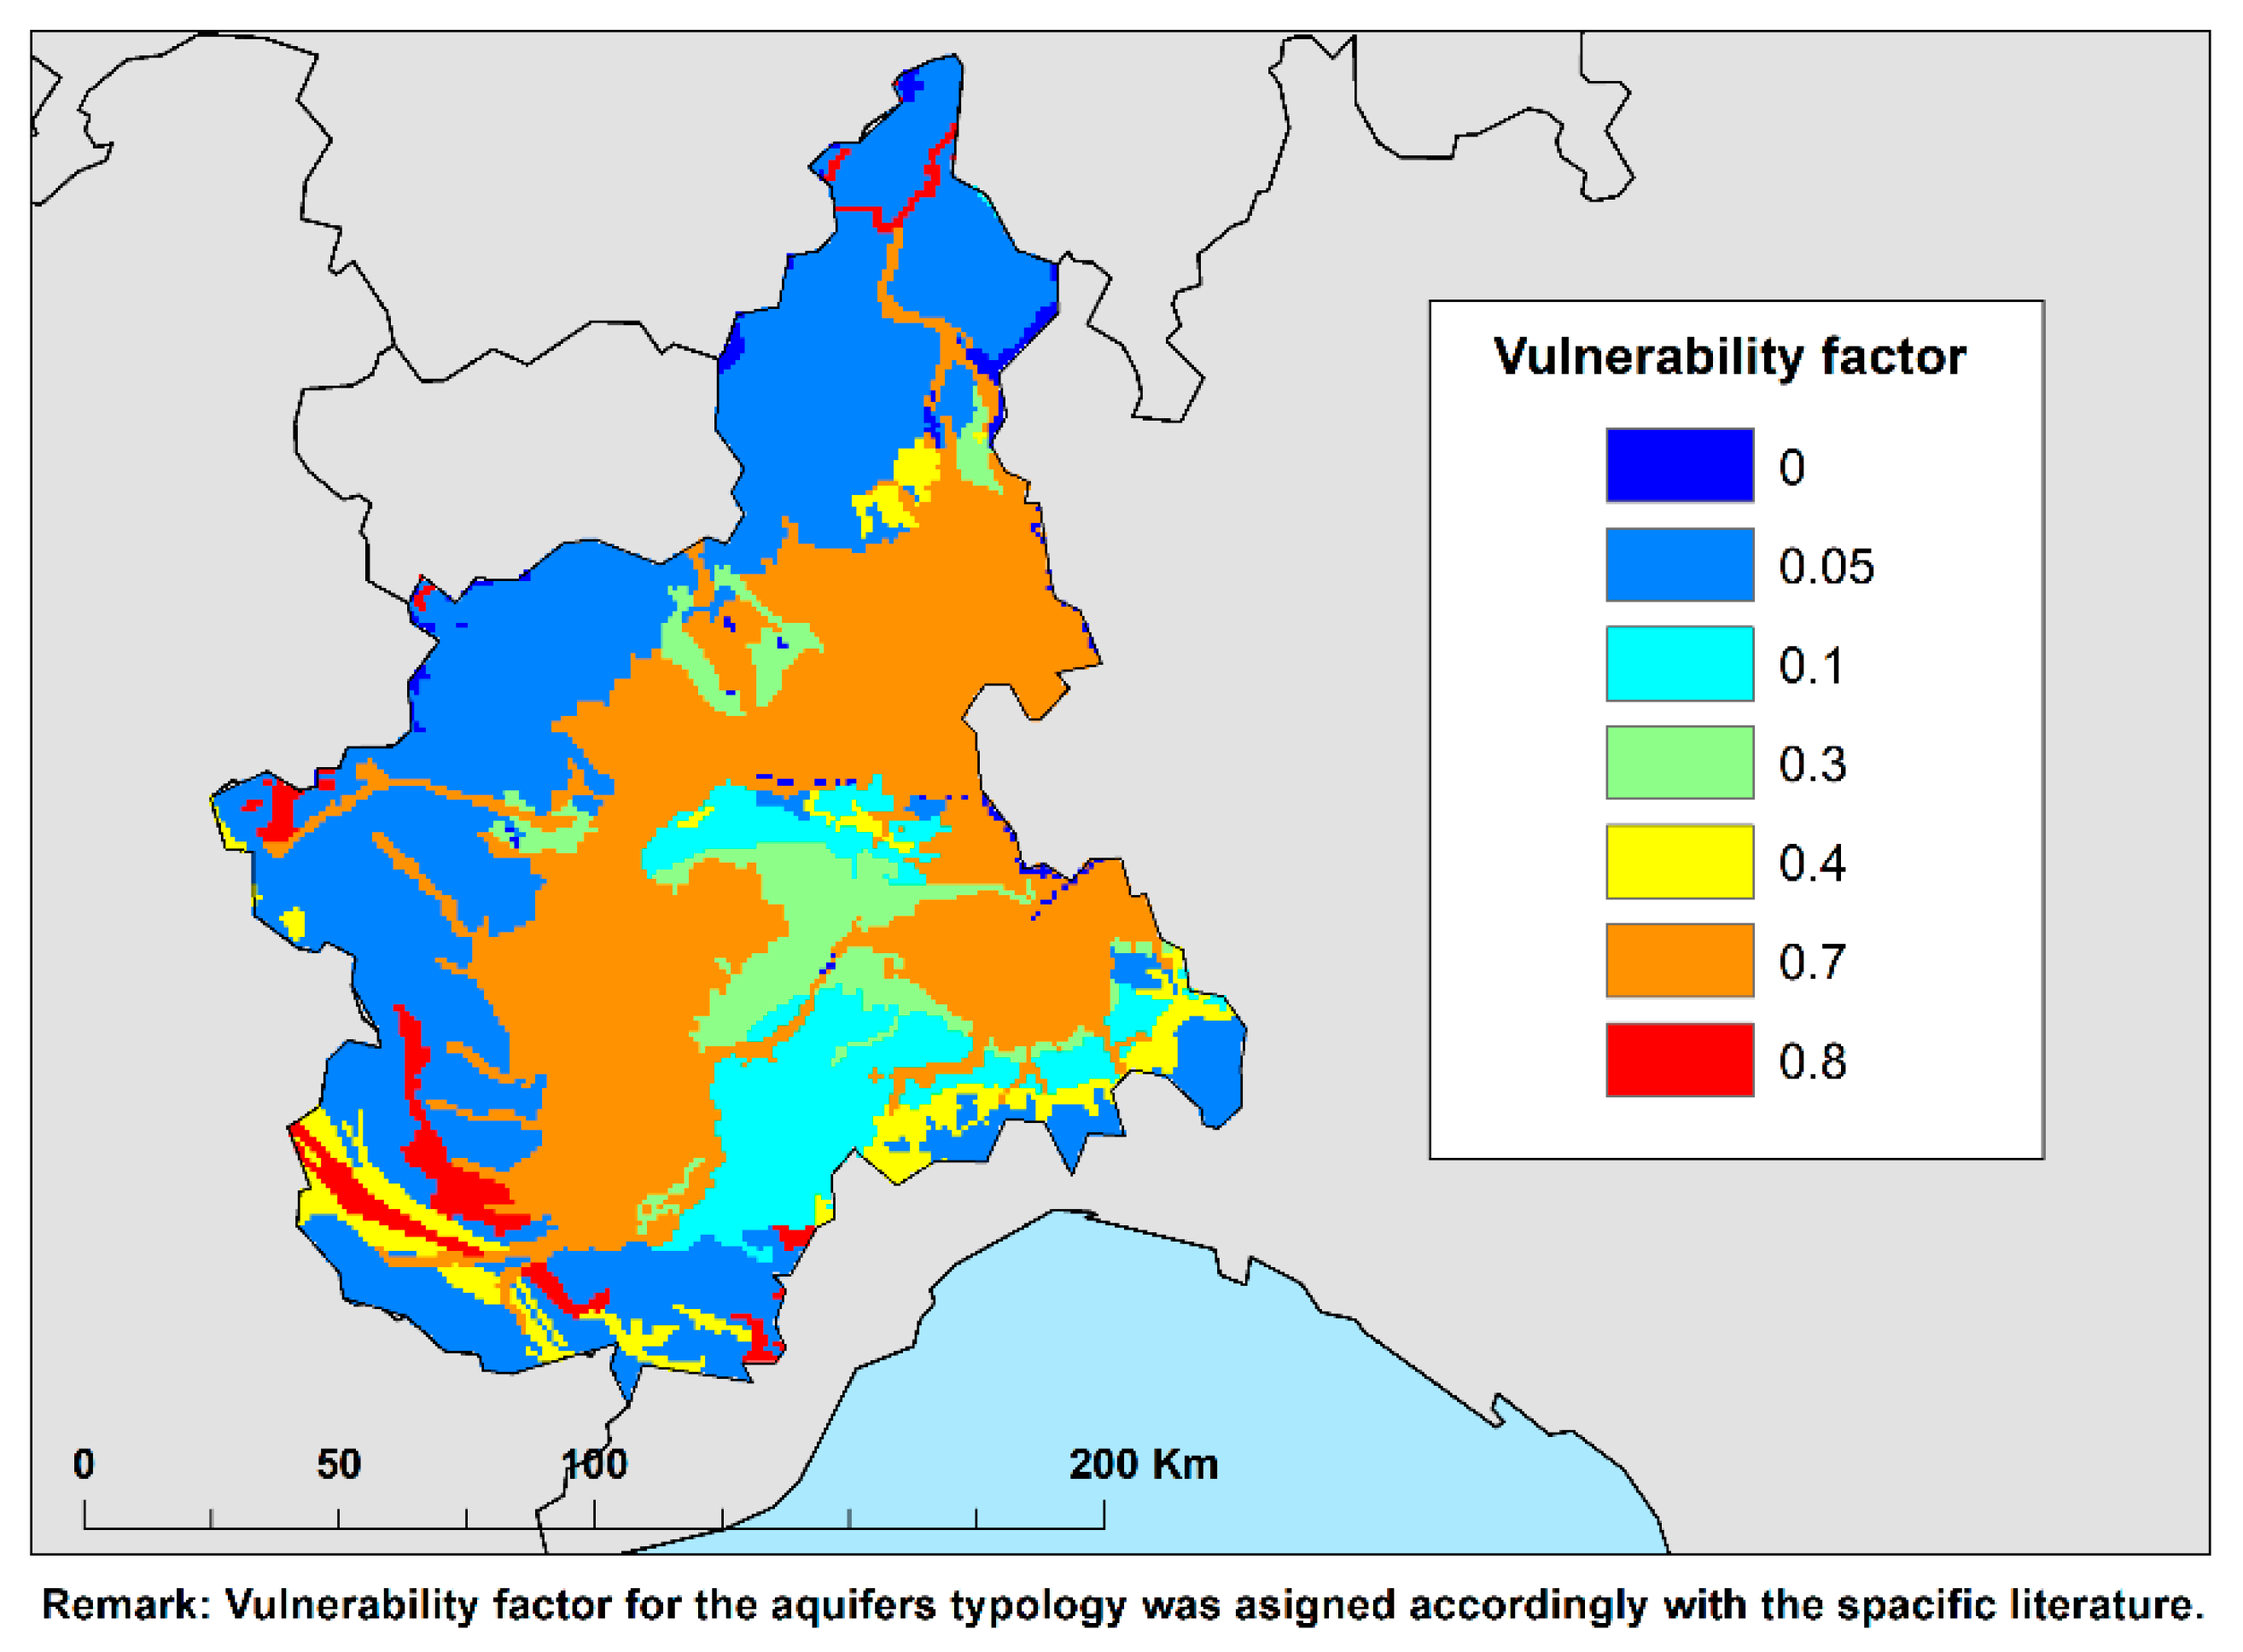
The International Hydrogeological Map of Europe (IHME), which was produced by [48] at a scale of 1:1,500,000, was used to determine the vulnerability factor (Figure 3) for each aquifer and the potential infiltration coefficient (PIC) at a spatial scale. According to the lithology of the aquifers, six types of productivity were established [48]. Table 1 reports the typologies of productivity and the vulnerability factors of the aquifers from the Piedmont region. The Western Alps and Po River Plain are two different units, which reflect the various geology of the Piedmont region. Thus, marlstones, limestones, gneisses, and volcanic rock in the western and northern parts mainly compose the geology of the mountain area. In the central and eastern sides, especially in the plains, clays, sands, gravels and silts can be identified. On the basis of the lithology of the aquifers, the specific PIC (Supplementary Material Figure S4) was assigned to each aquifer type, according to the hydrogeology literature [48]. These coefficients control the intrinsic vulnerability of the aquifers. Considering the steady-state analysis, the average values of the PIC were used in this paper. Moreover, through this coefficient, the groundwater quality sensitivity of each type of aquifer was ranked [47].
3.3.2. Land Cover Data
In order to estimate the evapotranspiration incorporating the vegetation pattern, and also to account for the pollution load index (PLI) induced by each ecosystem, we used two land cover databases and four projections. For the 2000 and 2012 calculations of crop evapotranspiration (ETc) and PLI, the CORINE Land Cover databases, available on the Copernicus Land Monitoring Services [49] (http://land.copernicus.eu/) were set at 1 km spatial resolution (Supplementary Material Figure S4). Future scenarios of Hercules land cover models (HERCULES Project. Available online: http://www.hercules-landscapes.eu/), related to 2040 (Supplementary Material Figure S5), were processed to determine the crop evapotranspiration (ETc) using the crop coefficient (Kc) and the PLI at a spatial scale. Four scenarios of land cover projections indicated the land trend changes based on fourteen trajectories. These projections were performed in the “Sustainable futures for Europe’s HERitage in CULtural landscapES” project, taking into consideration the macroeconomic models [49]. Scenario A1 focuses on a globalized world with an increase in economy, and high growth of food and feed demand [50,51]. This scenario has weak regulation on land use change and declining tropical forest areas [50,51]. Scenario A2 indicates modest economic growth with high population growth and high growth of food, but also with weak regulation on land use change [50,51]. Scenario B1 shows modest economic growth with slow growth of food and feed demand [50,51]. At the same time, this scenario has strong regulation on land use change and tropical forest protection [50,51]. Scenario B2 indicates a fragmented world with modest economic and food growth [50,51]. This scenario includes some regulations on land use change [50,51]. Table 2 and Table 3 report the values of the PLI assigned for each land cover type. Spatial distribution of PLI for CLC 2000 and 2012, and for Scenarios A1, A2, B1, and B2 are illustrated in the (Supplementary Material Figure S6).
3.3.3. NO3 Data
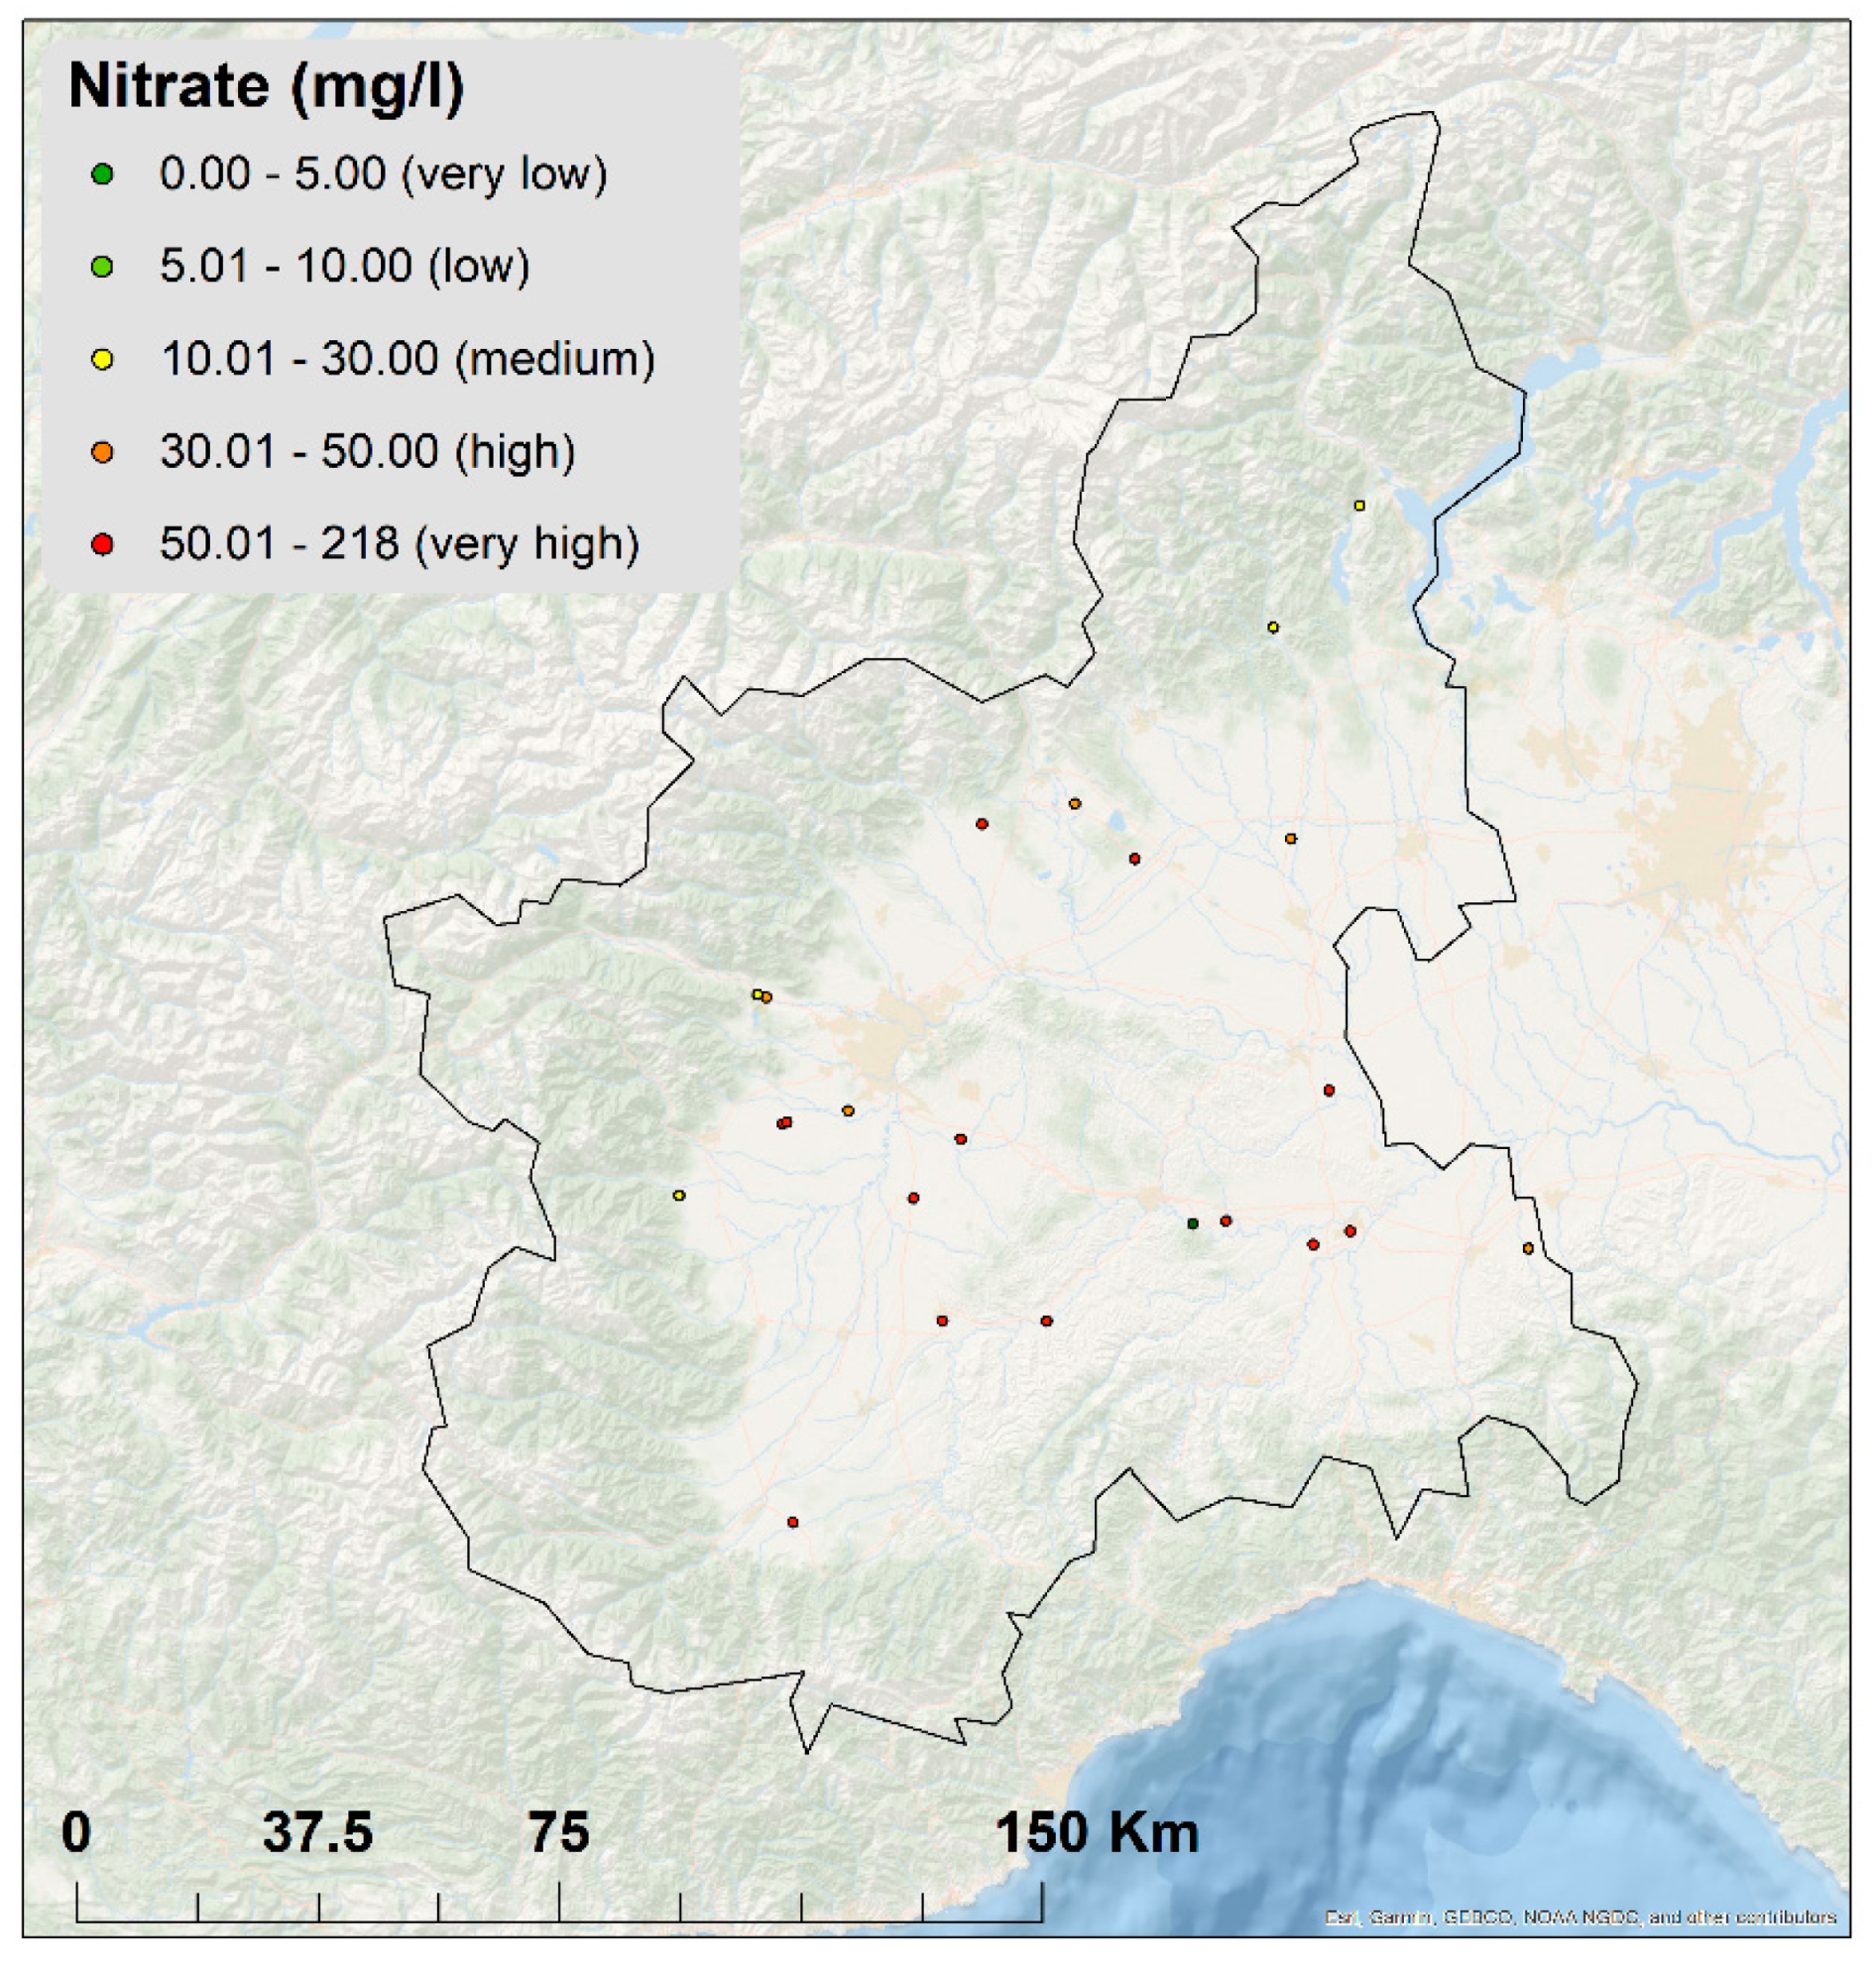
During 2005–2012, NO3 and other chemical elements were monitored at 39 surface and groundwater stations in the Piedmont region. The values and locations of this data are available on the European Environment Agency website. Following the ”Guidelines for Drinking Water Quality” [52], a limit of 50 mg/L of NO3 for very high concentrations in the drinking water was admitted. In the Piedmont region, the NO3 values ranged from 0 to 218 mg/L (Figure 4). A study by [28] used NO3 data to verify the methods of groundwater vulnerability mapping in various areas from Piedmont region.
Using the normalized values (0 to 1), the maximum values of NO3 were extracted and used for the spatial analysis of the groundwater vulnerability (see Section 3.4).
3.4. Groundwater Vulnerability Mapping and Validation
Groundwater vulnerability assessment in the Piedmont region was done using multilayers analysis to combine the sensitive factors which influence the vulnerability from a climate and land cover perspective. We performed the dataset processing using the GIS functions from Spatial Analyst Tools. The procedure for annual AETc was in conformity with a study by [45], in which they focused on the regional ETc and AETc (Table 4 and Table 5).
In this work, the aquifer vulnerability factor, PLI, infiltration map, and water availability were normalized (0 and 1) and weighted to generate the groundwater vulnerability map of the Piedmont region. The spatial analysis by weights steps followed the procedure presented by [53,54]. According to the standard procedure, the weights sum must be 100%, therefore, the appropriate weights for each factor map were set based on the literature [55,56,57]. Thus, the water availability and PLI layers were weighted by 50%, while the potential infiltration map and vulnerability factor were ranked as 40% and 50%, respectively (Equation (8)). The weights represent the relative importance of the parameter in the group. The balancing factor assigned to water availability and PLI means the relative importance related to the maximal deviations of the respective layer and the limitation of that layer to substitute another parameter, considering that the groundwater vulnerability should be calculated under these two main factors. Two groundwater vulnerability maps, one for the past and one for the present, and four maps for the future were generated as the main product of the work. The vulnerability was divided into equal classes between 0 and 1 as follows: 0–0.2 for very low, 0.21–0.4 for low, 0.41–0.6 for medium, 0.61–0.8 for high, and 0.81–1 for very high. The arsenic data were also used in the analysis, but only the NO3 data were used for validation. Spatial variation of NO3 and arsenic (As) was performed using ordinary kriging interpolation in ArcGIS environment.
where:
- GW V = Groundwater vulnerability;
- WA = Water availability;
- AV = Vulnerability factor of aquifer;
- PIM = Potential infiltration map;
- PLI = Pollution load index;
- NO3 = Nitrate;
- As = Arsenic.
All values were normalized between 0 and 1. The validation of the groundwater vulnerability was done for the 2020s period, using pixel pair comparison (PPC) with NO3 data [58]. For the validation, the difference of the vulnerability classes (five classes) between the groundwater vulnerability map and the NO3 reference layer was used as follows: When the difference indicates a null value, perfect confidence is verified and, when the difference indicates “−4”, the validation is null. Once calibrated and admitted as the groundwater vulnerability model for the 2020s period, determinations of groundwater vulnerability for the 1990s, and 2050s periods, were completed.
4. Results
4.1. Variation of Water Availability (WA)
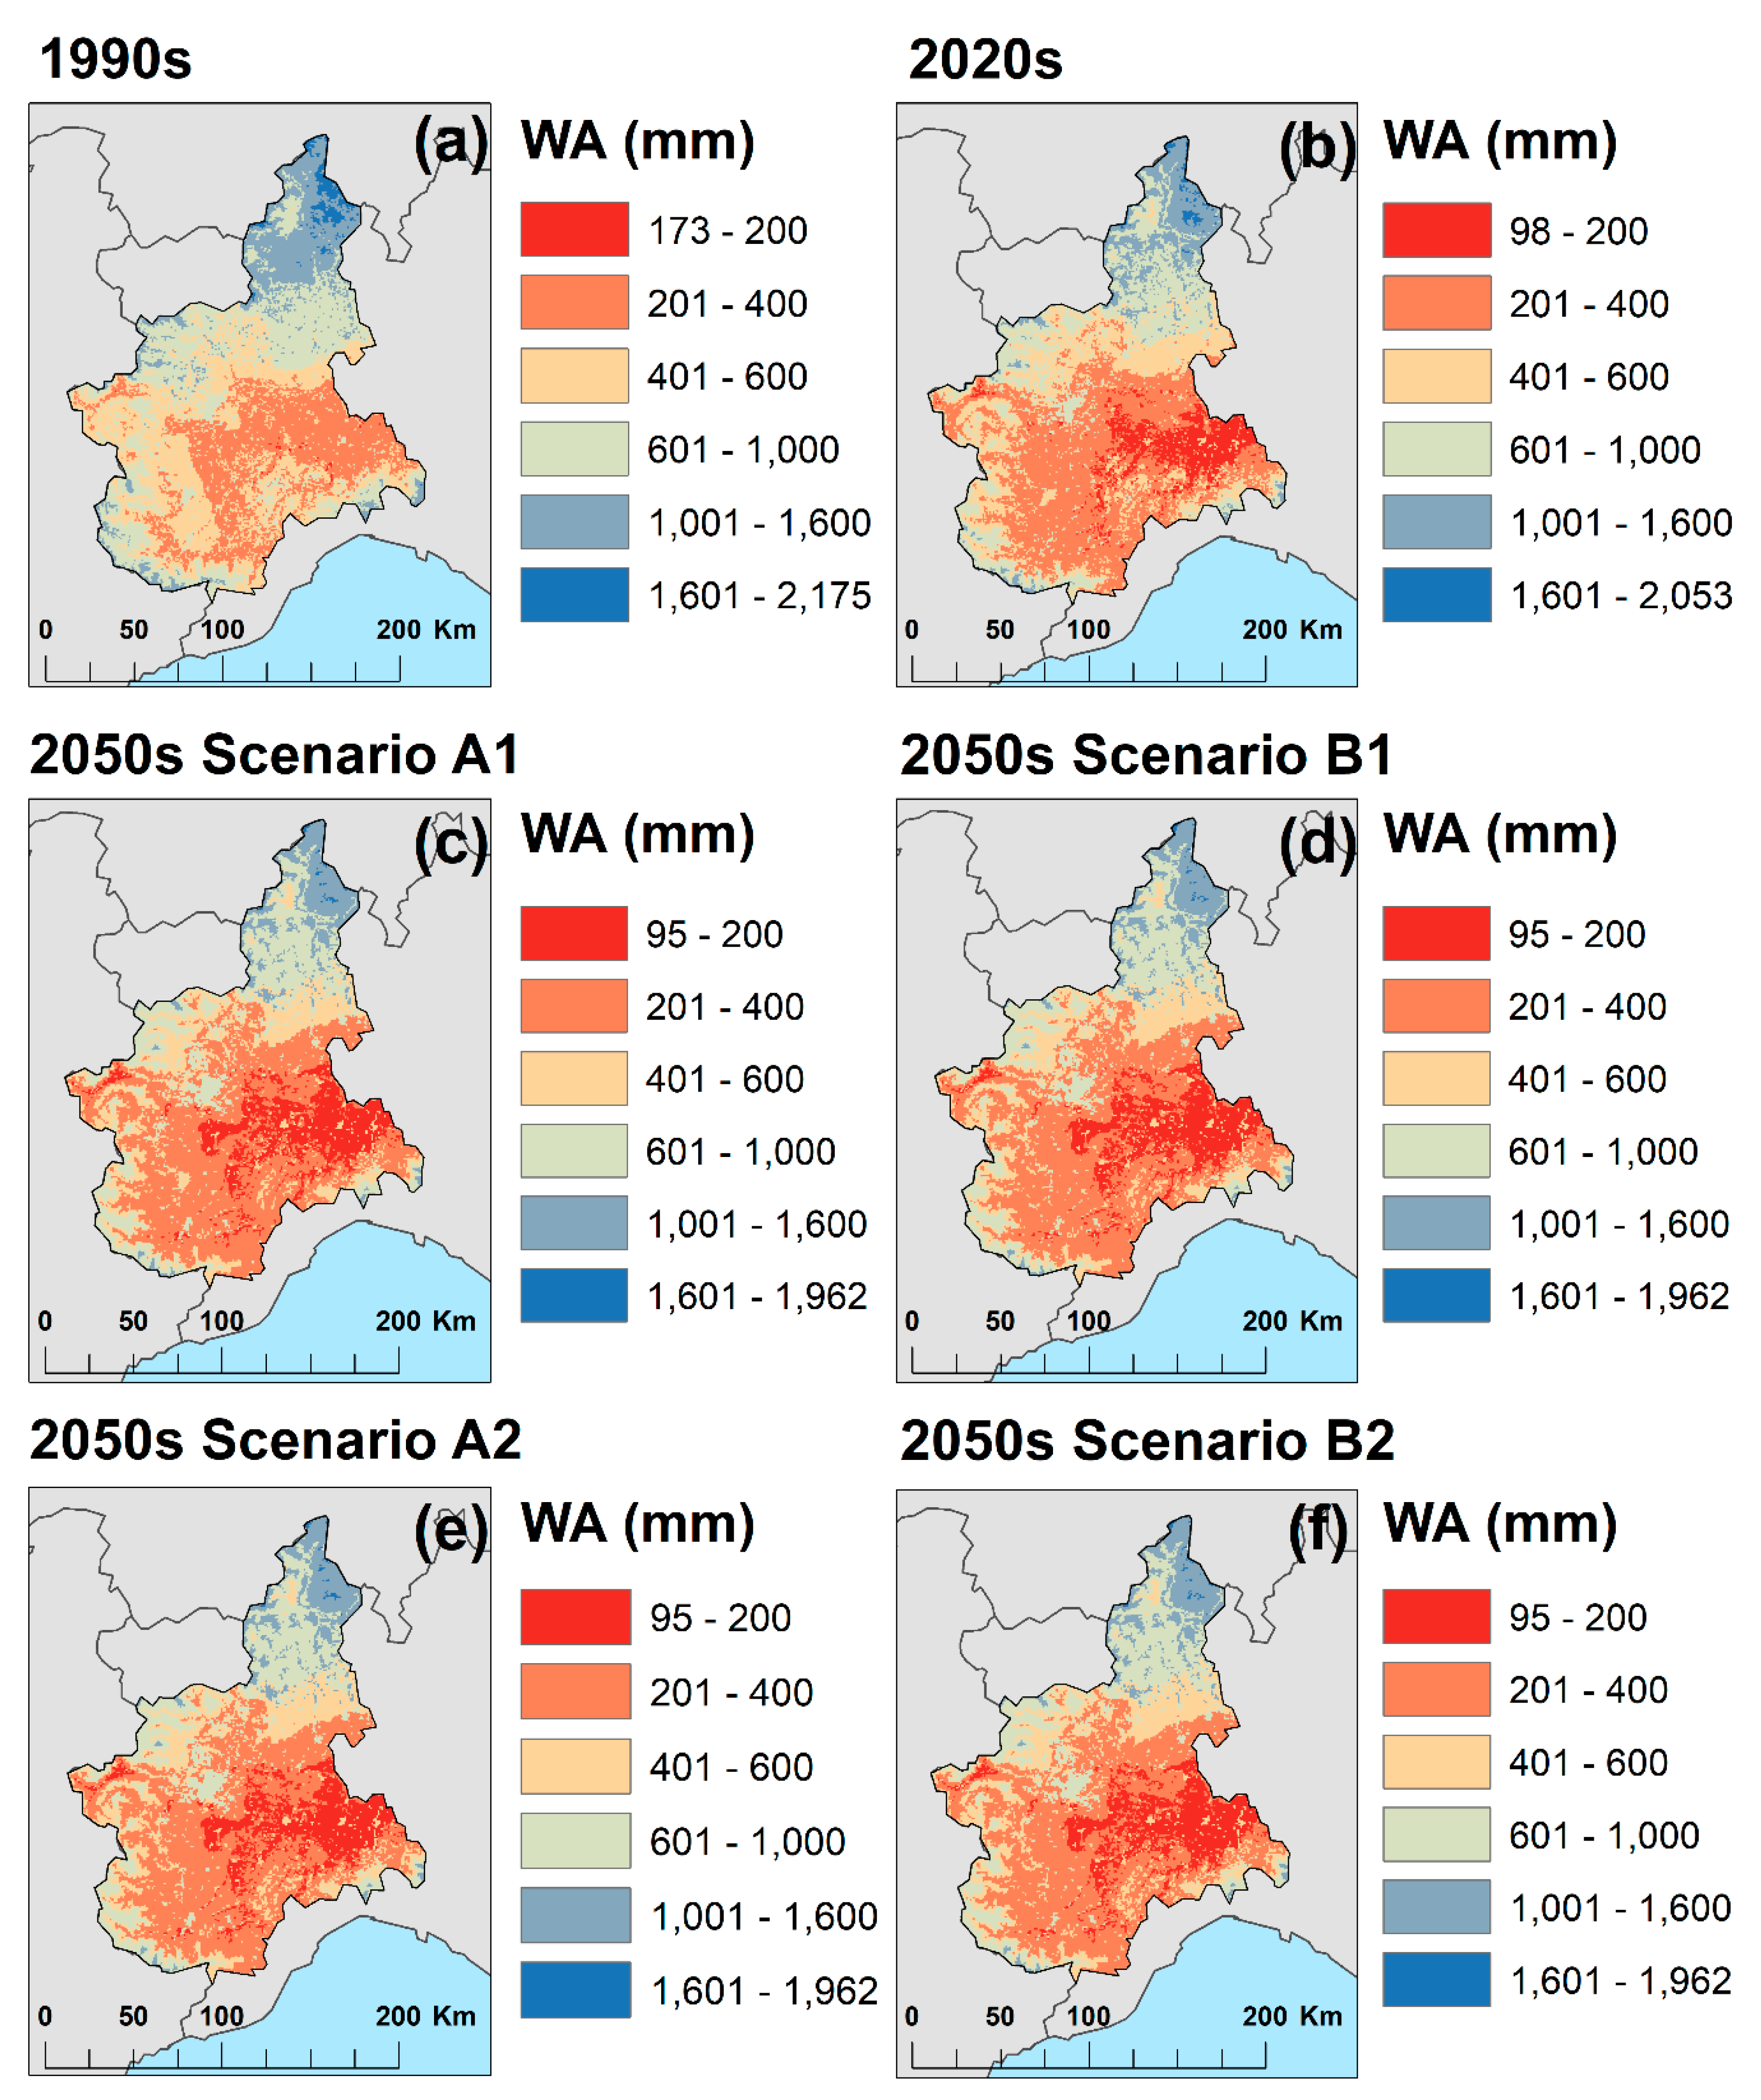
Groundwater vulnerability under climate change and land cover in the Piedmont region was evaluated using spatial analysis in ArcGIS. The impact of climate change on groundwater quantity was estimated through water availability. According to the annual AETc and precipitation distribution at a spatial scale, we performed the annual water availability for the 1990s, 2020s, and 2050s periods. During the past period (1990s), the water availability varied in the Piedmont region from 173 mm to 2175 mm. In the present period (2020s), the water availability ranges from 98 m to 2053 mm, while in the future period (2050s), the water availability indicates values between 95 mm and 1962 mm. The higher values (over 1600 mm) are located in the northern parts of the Piedmont region, especially in the Val d’Ossoia Valley. The lower values (below 400 mm) of water availability extend in the central, southern, western, and eastern sides of the Region. The dryer area is shown in the Po Plain and it is expected that the low values of water availability will occupy a larger territory in the 2050s period. From a quantity point of view, climate change has a negative impact on a major part of the Piedmont land. The areas with lower water availability influence the groundwater recharge and, consequently, the vulnerability due to climate change. Figure 5 depicts the water availability in the Piedmont region for the past, present, and future scenarios.
4.2. Variation of Pollution Load Index (PLI)
For the quality assessment of groundwater over a long term, we evaluated the spatial distribution of the vulnerability factor and PLI, using the aquifers respective land cover data. The most sensitive aquifers from the Piedmont region are the porous aquifers which are located in the lowlands and along the valleys. In these types of media, the vulnerability factor has high values (Figure 3). The mountains media indicate ”non-aquiferous” rock for a major part of Western Alps, therefore, the permeability is very low, and the vulnerability factor is low.
The PLI indicates high values in the Po Plain, where the agricultural lands extend and where the human impact is significant. These areas could be characterized as “low ecosystem services quality” for groundwater renewal and quality. In contrast, the mountains areas, covered by forest and pastures, supply both the surface water runoff and groundwater recharge and the quality of aquifers. Thus, the lower PLI was depicted in the north, west, and south of the Piedmont region, where the higher PLI could be find in the central and east parts of the region (Supplementary Material Figure S6).
4.3. Groundwater Vulnerability Map
The PPC includes an analogy between the groundwater vulnerability class in a certain location with the NO3 value converted into vulnerability class. This approach is highlighted in Figure 4. The PPC between the groundwater vulnerability map related to the 2020s period and the NO3 F layer indicates an 87% level of confidence, i.e., 48% with perfect confidence and 39% with only one class difference. A two class difference was found for two locations and a three class difference was found for one location, which represent about 9% respective 4% of the entire maps of the Piedmont region (Table 6).
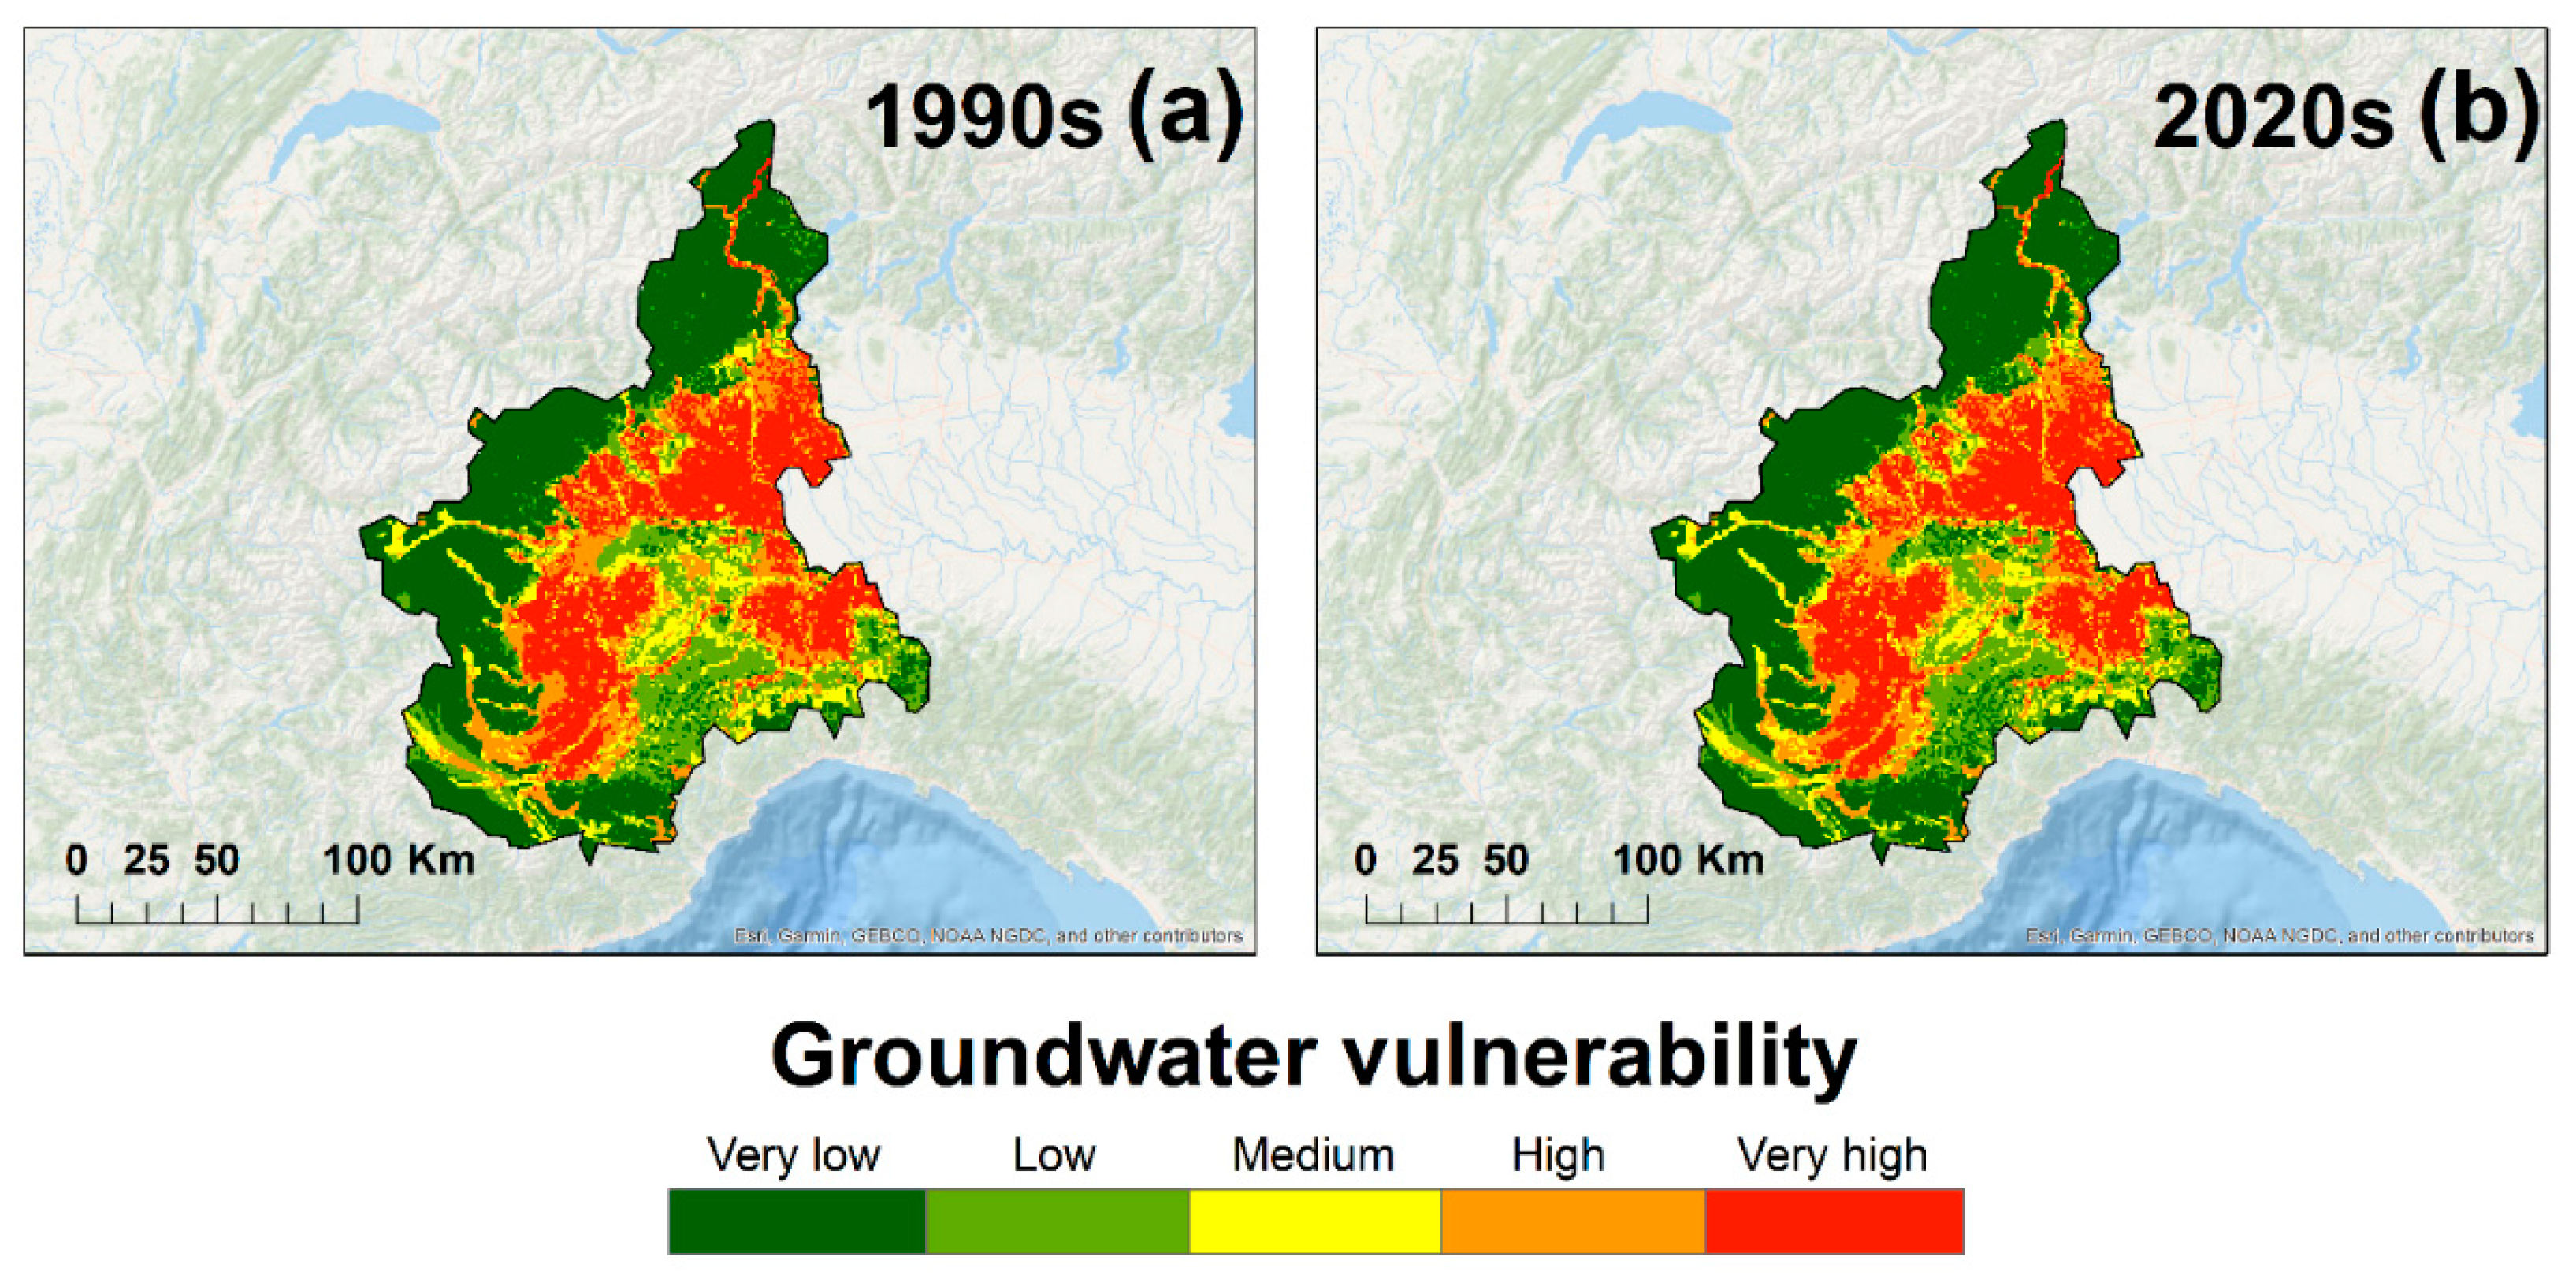
The spatial analysis by weights was generated using water availability, vulnerability factor, PLI, and infiltration map layers. These parameters represent the main factors that influence the groundwater vulnerability due to climate conditions, land cover aspects, terrain morphology, and geology of the area. Figure 6 shows the map of groundwater vulnerability in the Piedmont region for the past and present periods (1990s and 2020s). The Po Plain and eastern sides of the region represent the territory where there is a very high and high vulnerability of groundwater under climate and land cover. A medium vulnerability class extends, for both periods, in the central, south-west, and north-central parts of the Piedmont region. A low and very low vulnerability extend mainly in the peripheral parts of the region and in some locations from the central part. Interestingly, between the 1990s and 2020s periods, a very high vulnerability class occupies a larger territory in the second period, while the very low class is reduced.
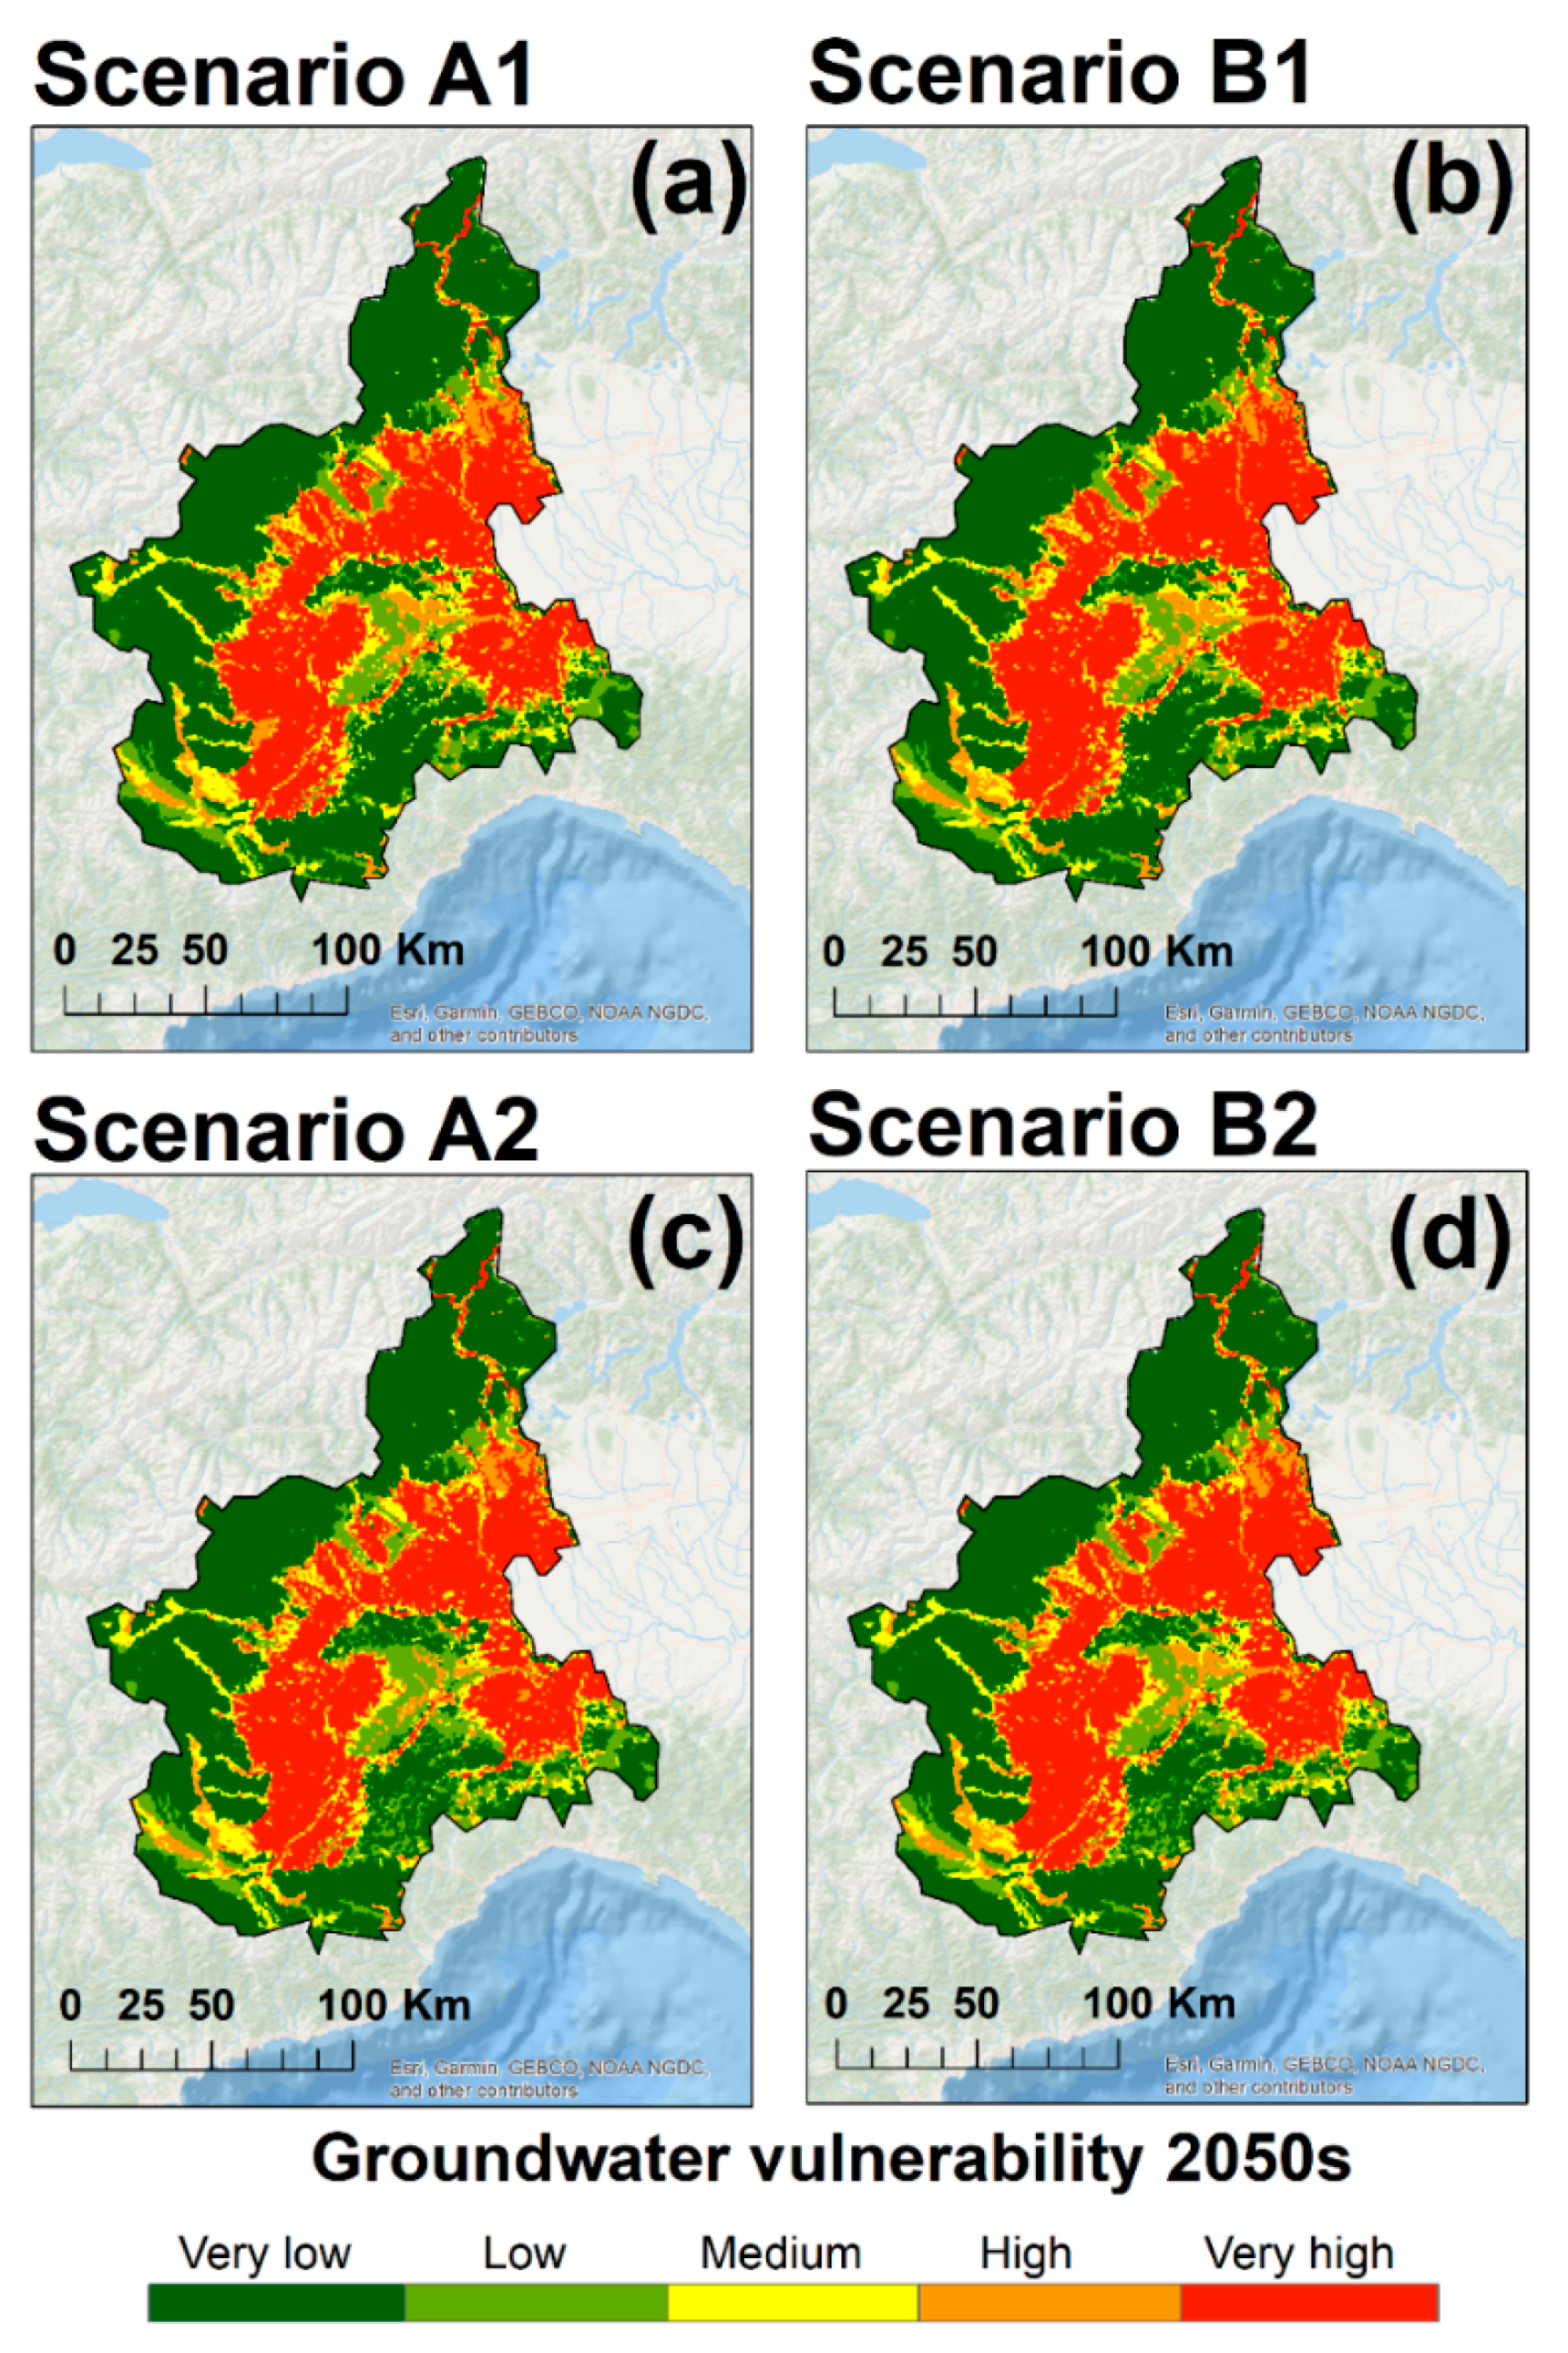
Future scenarios of groundwater vulnerability in the Piedmont region indicate a high and very high vulnerability class in the south-west and east parts, in all scenarios. A very low class was depicted in the north of the Piedmont region, whereas a low class extends mainly in the south and west. There were a few locations of low vulnerability class identified in the north and central parts. A medium class of groundwater vulnerability could be found in the south-west, north-central, central, and east parts of the study area. The spatial distribution of the groundwater vulnerability pattern is very similar in all four scenarios. We note that very high class of vulnerability increased in the area, and high and medium classes of vulnerability decreased in the area. A very low class of vulnerability also increased, during the 2050s period, in the south of the Piedmont region as a consequence of the forest presence in that area by mid-century. Future scenarios of groundwater vulnerability for the Piedmont region are depicted in Figure 7.
5. Discussion
The main goal of this work was to determine groundwater vulnerability and risk mapping in one of most important regions of Italy, in the Piedmont region. The applied methodology is based on GIS technology, which is able to combine spatial datasets and generate a groundwater vulnerability map. The input data has significant influences on the results. Climate influences are coming both from the temperature and annual ET0 values, and also from the annual precipitation, which register high variations at a spatial scale in the Piedmont region. These oscillations of ET0 and precipitation, together with the land cover, are reflected in the AETc and water availability amount. Thus, the Po Plain appears to be a very dry land, with high values of AETc and low values of water availability for all the analyzed periods, for a larger area, and due to this, groundwater recharge is expected to reduce, especially during the future period. In the mountain areas, the high quality of the ecosystems (low PLI) and the high values of water availability contribute to low and very low vulnerability of groundwater. According to [28], land use does not always control the transport of NO3, but the groundwater flow. In this sense, our method that includes PIC influences the intrinsic groundwater vulnerability a great deal at the same location as the aquifer. As a limitation of ArcGIS and spatial analysis, in this study, the applied approach does not quantify the groundwater flow and transfer of NO3 downstream to the measured points. However, the method performs well for the classes of groundwater vulnerability and, additionally, future projections are the strengths of our analysis.
The best of our application, the groundwater vulnerability mapping carried out in this study, also included the effects of climate change and land cover variation. These findings are in line with specific literatures that have indicated high vulnerability of groundwater resources in various regions from Southern and South Eastern Europe. In the south of Europe, the seasonality of dry period induces major changes in the water renewals, especially from May to September. The mean annual precipitation amount is expected to decrease in the Mediterranean area and also in Italy [39,40], and the Italian peninsula [45] as a consequence of climate change. In South Eastern Europe, groundwater vulnerability is also increasing [40] and the ecosystems are also negatively affected [7]. A study by [53] determined groundwater vulnerability under climate change in the Beliş district of the Western Carpathians.
Our study is not without limitations. The applied methodology focused on annual averages of 30 years climate data. This aspect represents a disadvantage because the water stress during drought periods is not considered. The present work considers long-term periods rather than seasonal analysis. At the same time, pollution risks during the short periods are not taken into account.
A comparison of this study with previous investigations of groundwater vulnerability in the Piedmont region shows that our findings are appropriate with the maps generated by [30,31]. In their groundwater vulnerability map, generated for the Alessandria district, a high class of vulnerability is predominant for that territory. This detail is in line with the vulnerability map generated in this work. Interestingly, studies by [30,31] also found extremely elevated vulnerability in the northern side of the Alessandria district and in some locations from west and south. The differences between our method and the approach by [30,31] are related to the input data. They included the hydraulic conductivity, weight strings, and depth to water data in their analysis. Because of the large area of the Piedmont region, we chose to use the PIC layer and PLI instead of hydraulic conductivity and depth to water data, therefore, the findings are slightly different. However, our method generated an accurate groundwater vulnerability map for the entire Piedmont region considering long-term period climate models and land cover projections. The method could be used for other regional studies without issues in performance.
6. Conclusions
This aim of this paper was to determine the groundwater vulnerability mapping over the Piedmont region, in Northern Italy, using spatial analysis in ArcGIS. The approach included high-resolution climate models, aquifers, terrain data, and the dynamic land cover for the past (1990s), present (2020s), and future (2050s) periods. Climate change and land cover have a negative impact on the groundwater resources in the Piedmont region. The groundwater vulnerability map indicates the northern, western, and southern sides of the Piedmont region have low and very low groundwater vulnerability. At the same time, in the Po Plain, high and very high vulnerability occur during the 1990s and 2020s periods. Moreover, during the 2050s period, the areas with high vulnerability are expected to increase in area.
The central and eastern parts of the region are facing climate change problems related to a decrease in water availability, intense agriculture, and highly sensitive aquifers of porous media in the Po Plain. In addition, the areas with high groundwater vulnerability also represent the cultivation lands, which influence water resources quality.
The risk mapping consists of integrating groundwater vulnerability mapping and types of aquifers. Thus, high and very high vulnerability corresponds to porous and karst aquifers because of the high hydraulic conductivity, and also because NO3 and as registered high values in the study area. Medium vulnerability could be identified in the porous aquifers with coarse sediments, but also in the fissured aquifers. Low and very low vulnerability was found in the non-aquiferous media, where the permeability was very low and the capacity of the water storage was reduced.
This application represents a reliable methodology with respect to groundwater vulnerability mapping at a regional scale. The accuracy of mapping carried out here can be improved with in situ measurements for the locations where these are missing. In addition, the groundwater vulnerability maps which were generated in this study, represent important instruments for water management plans in the Piedmont region.
Supplementary Materials
The following are available online at https://www.mdpi.com/2073-4433/11/8/779/s1, Figure S1: Geological formations of the Piedmont region; Figure S2: Potential Infiltration Coefficient assigned to each type of aquifer in the Piedmont region; Figure S3: Infiltration map of the Piedmont region; Figure S4: Land cover of the Piedmont region in 2000 and 2012; Figure S5: Land cover projections of the Piedmont region for 2040s; Figure S6: Pollution load index calculated in base of land cover in the Piedmont region; Figure S7: Spatial distribution of annual actual crop evapotranspiration (AETc) in the Piedmont region.
Funding
This research received no external funding.
Acknowledgments
The author would like to thank Andreas Hamann from Alberta University for the climate models data.
Conflicts of Interest
The author declares no conflict of interest.
References
- Kazakis, N.; Oikonomidis, D.; Voudouris, K.S. Groundwater vulnerability and pollution risk assessment with disparate models in karstic, porous, and fissured rock aquifers using remote sensing techniques and GIS in Anthemountas basin, Greece. Environ. Earth. Sci. 2015, 74, 6199–6209. [Google Scholar] [CrossRef]
- Antonakos, A.K.; Lambrakis, N.J. Development and testing of three hybrid methods for the assessment of aquifer vulnerability to nitrates, based on the drastic model, an example from NE Korinthia, Greece. J. Hydrol. 2007, 333, 288–304. [Google Scholar] [CrossRef]
- Loaciaga, H.A.; Maidment, D.R.; Valdes, J.B. Climate-change impacts in a regional karst aquifer, Texas, USA. J. Hydrol. 2007, 227, 173–194. [Google Scholar] [CrossRef]
- Jiménez Cisneros, B.E.; Oki, T.; Arnell, N.W.; Benito, G.; Cogley, J.G.; Döll, P.; Jiang, T.; Mwakalila, S.S. Freshwater resources. In Climate Change 2014: Impacts, Adaptation, and Vulnerability. Part A: Global and Sectoral Aspects. Contribution of Working Group II to the Fifth Assessment Report of the Intergovernmental Panel on Climate Change; Field, C.B., Barros, V.R., Dokken, D.J., Mach, K.J., Mastrandrea, M.D., Bilir, T.E., Chatterjee, M., Ebi, K.L., Estrada, Y.O., Genova, R.C., et al., Eds.; Cambridge University Press: Cambridge, UK; New York, NY, USA, 2014; pp. 229–269. [Google Scholar]
- IPCC. Climate change 2001: The scientific basis. In Contribution of Working Group I to the Third Assessment Report of the Intergovernmental Panel on Climate Change; Houghton, J.T., Ding, Y., Griggs, D.J., Noguer, M., van der Linden, P.J., Dai, X., Eds.; Cambridge University Press: Cambridge, UK; New York, NY, USA, 2001; p. 881. [Google Scholar]
- Haeberli, W.R.; Frauenfelder, R.; Hoelzle, M.; Maisch, M. On rates and acceleration trends of global glacier mass changes. Geogr. Ann. Ser. A Phys. Geogr. 1999, 81, 585–595. [Google Scholar] [CrossRef]
- Kløve, B.; Ala-Aho, P.; Bertrand, G.; Gurdak, J.J.; Kupfersberger, H.; Kværner, J.; Muotka, T.; Mykrä, H.; Preda, E.; Rossi, P.; et al. Climate change impacts on groundwater and dependent ecosystems. J. Hydrol. 2014, 518, 250–266. [Google Scholar] [CrossRef]
- Rahardjo, H.; Nistor, M.M.; Gofar, N.; Satyanaga, A.; Xiaosheng, Q.; Chui Yee, S.I. Spatial distribution, variation and trend of five-day antecedent rainfall in Singapore. Georisk Assess. Manag. Risk Eng. Syst. Geohazards 2019, 1–15. [Google Scholar] [CrossRef]
- Taylor, R.; Scanlon, B.; Döll, P.; Rodell, M.; van Beek, R.; Wada, Y.; Longuevergne, L.; LeBlanc, M.; Famiglietti, J.; Edmunds, M.; et al. Groundwater and climate change. Nat. Clim. Chang. 2012. [Google Scholar] [CrossRef] [Green Version]
- Green, T.R.; Taniguchi, M.; Kooi, H.; Gurdak, J.J.; Allen, D.M.; Hiscock, K.M.; Treidel, H.; Aureli, A. Beneath the surface: Impacts of climate change on groundwater. J. Hydrol. 2011, 405, 532–560. [Google Scholar] [CrossRef] [Green Version]
- Dettinger, M.D.; Earman, S. Western ground water and climate change—Pivotal to supply sustainability or vulnerable in its own right? Gr. Water 2007, 4, 4–5. [Google Scholar]
- Dezsi, Ş.; Mîndrescu, M.; Petrea, D.; Rai, P.K.; Hamann, A.; Nistor, M.M. High resolution projections of evapotranspiration and water availability for Europe under climate change. Int. J. Climatol. 2018, 38, 3832–3841. [Google Scholar] [CrossRef]
- Hamann, A.; Wang, T.L. Models of climatic normals for genecology and climate change studies in British Columbia. Agric. For. Meteorol. 2005, 128, 211–221. [Google Scholar] [CrossRef]
- Hamann, A.; Wang, T.; Spittlehouse, D.L.; Murdock, T.Q. A comprehensive, highresolution database of historical and projected climate surfaces for western North America. Bull. Am. Meteorol. Soc. 2013, 94, 1307–1309. [Google Scholar] [CrossRef]
- The Canadian Centre for Climate Modelling and Analysis. The First Generation Coupled Global Climate Model Publishing Web. 2014. Available online: http://www.ec.gc.ca/ccmac-cccma/default.asp?lang=En&n=540909E4-1 (accessed on 20 March 2015).
- Panagos, P.; Ballabio, C.; Borrelli, P.; Meusburger, K.; Klik, A.; Rousseva, S.; Tadić, M.P.; Michaelides, S.; Hrabalíková, M.; Olsen, P.; et al. Rainfall erosivity in Europe. Sci. Total Environ. 2015, 511, 801–814. [Google Scholar] [CrossRef] [PubMed] [Green Version]
- Nistor, M.M. Climate change effect on groundwater resources in South East Europe during 21st century. Quat. Int. 2019, 504, 171–180. [Google Scholar] [CrossRef]
- Nistor, M.M.; Ronchetti, F.; Corsini, A.; Cheval, S.; Dumitrescu, A.; Rai, P.K.; Petrea, D.; Dezsi, Ş. Crop evapotranspiration variation under climate change in South East Europe during 1991–2050. Carpathian J. Earth Environ. Sci. 2017, 12, 571–582. [Google Scholar]
- Galleani, L.; Vigna, B.; Banzato, C.; Lo Russo, S. Validation of a Vulnerability Estimator for Spring Protection Areas: The VESPA index. J. Hydrol. 2011, 396, 233–245. [Google Scholar] [CrossRef]
- Brenner, S.; Coxon, G.; Howden, N.J.K.; Freer, G.; Hartmann, A. Process-based modelling to evaluate simulated groundwater levels and frequencies in a Chalk catchment in south-western England. Nat. Hazards Earth Syst. Sci. 2018, 18, 445–461. [Google Scholar] [CrossRef] [Green Version]
- Krogulec, E. Intrinsic and Specific Vulnerability of Groundwater in a River Valley—Assessment, Verification and Analysis of Uncertainty. J. Earth Sci. Clim. Chang. 2013, 4, 1–12. [Google Scholar] [CrossRef]
- Neukum, C.; Hötzl, H.; Himmelsbach, T. Validation of vulnerability mapping methods by field investigations and numerical modelling. Hydrogeol. J. 2008, 16, 641–658. [Google Scholar] [CrossRef]
- Farjad, B.; Shafri, H.Z.M.; Mohamed, T.A.; Pirasteh, S.; Wijesekara, N. Groundwater intrinsic. vulnerability and risk mapping. Water Manag. 2012, 165, 441–450. [Google Scholar] [CrossRef]
- Al-Mallah, I.A.R.; Sabeh, W.; Al-Qurnawi, W.S. Intrinsic vulnerability assessment for the Quaternary aquifer in Baghdad area using DRASTIC model. Appl. Water Sci. 2018, 8, 1–14. [Google Scholar] [CrossRef]
- Kong, M.; Zhong, H.; Wu, Y.; Liu, G.; Xu, Y.; Wang, G. Developing and validating intrinsic groundwater vulnerability maps in regions with limited data: A case study from Datong City in China using DRASTIC and Nemerow pollution indices. Environ. Earth Sci. 2019, 78, 1–14. [Google Scholar] [CrossRef]
- Jang, C.S.; Lin, C.W.; Liang, C.P.; Chen, J.S. Developing a reliable model for aquifer vulnerability. Stoch. Environ. Res. Risk Assess. 2016, 30, 175–187. [Google Scholar] [CrossRef]
- Liang, C.P.; Jang, C.S.; Liang, C.W.; Chen, J.S. Groundwater Vulnerability Assessment of the Pingtung Plain in Southern Taiwan. Int. J. Environ. Res. Public Health 2016, 13, 1167. [Google Scholar] [CrossRef] [Green Version]
- Lasagna, M.; De Luca, D.A.; Franchino, E. Intrinsic groundwater vulnerability assessment: Issues, comparison of different methodologies and correlation with nitrate concentrations in NW Italy. Environ. Earth Sci. 2018, 77, 1–16. [Google Scholar] [CrossRef]
- Civita, M.; De Maio, M. Mapping groundwater vulnerability by the point count system model SINTACS. In Managing Hydrogeological Disasters in a Vulnerable Environment; Andah, K., Ed.; Cosponsorized by IHPUNESCO; Pubbl. GNDCI 1900: Perugia, Italy, 1998; pp. 243–273. [Google Scholar]
- Civita, M.; De Maio, M.; Vigna, B. A GIS methodology for evaluation active aquifer recharge. Proceedings of the 3rd nationalist convention on the protection and management of groundwater in the third millennium. Pap. Appl. Geol. 1999, 291–303. [Google Scholar]
- Civita, M. The Combined Approach When Assessing and Mapping Groundwater Vulnerability to Contamination. J. Water Resour. Prot. 2010, 2, 14–28. [Google Scholar] [CrossRef] [Green Version]
- ISTAT. Censimento Delle Acque Per Uso Civile. 2017. Available online: http://www.istat.it (accessed on 20 October 2018).
- Kottek, M.; Grieser, J.; Beck, C.; Rudolf, B.; Rubel, F. World Map of the Köppen-Geiger climate classification updated. Meteorol. Z. 2006, 15, 259–263. [Google Scholar] [CrossRef]
- Nistor, M.M. Groundwater vulnerability in Europe under climate change. Quat. Int. 2019, 1–12. [Google Scholar] [CrossRef]
- IPCC. Summary for Policymakers. In Climate Change 2013: The Physical Science Basis. Contribution of Working Group I to the Fifth Assessment Report of the Intergovernmental Panel on Climate Change; Stocker, T.F., Qin, D., Plattner, G.-K., Tignor, M., Allen, S.K., Boschung, J., Nauels, A., Xia, Y., Bex, V., Midgley, P.M., et al., Eds.; Cambridge University Press: Cambridge, UK; New York, NY, USA, 2013; p. 1308. [Google Scholar]
- Daly, C. Guidelines for assessing the suitability of spatial climate data sets. Int. J. Climatol. 2006, 26, 707–721. [Google Scholar] [CrossRef]
- Mbogga, M.S.; Hamann, A.; Wang, T. Historical and projected climate data for natural resource management in western Canada. Agric. Forest Meteorol. 2009, 149, 881–890. [Google Scholar] [CrossRef]
- Thornthwaite, C.W. An approach toward a rational classification of climate. Geogr. Rev. 1948, 38, 55–94. [Google Scholar] [CrossRef]
- Čenčur Curk, B.; Cheval, S.; Vrhovnik, P.; Verbovšek, T.; Herrnegger, M.; Nachtnebel, H.P.; Marjanović, P.; Siegel, H.; Gerhardt, E.; Hochbichler, E.; et al. CC-WARE Mitigating Vulnerability of Water Resources under Climate Change. WP3—Vulnerability of Water Resources in SEE, Report Version 5. 2014. Available online: http://www.ccware.eu/output-documentation/output-wp3.html (accessed on 5 May 2019).
- Cheval, S.; Dumitrescu, A.; Barsan, M.V. Variability of the aridity in the South-Eastern Europe over 1961–2050. Catena 2017, 151, 74–86. [Google Scholar] [CrossRef]
- Zhao, L.; Xia, J.; Xu, C.; Wang, Z.; Sobkowiak, L.; Long, C. Evapotranspiration estimation methods in hydrological models. J. Geogr. Sci. 2013, 23, 359–369. [Google Scholar] [CrossRef]
- Allen, R.G.; Pereira, L.S.; Raes, D.; Smith, M. Crop Evapotranspiration: Guidelines for Computing Crop Water Requirements; FAO Irrigation and Drainage Paper 56; FAO: Rome, Italy, 1998; p. 300. [Google Scholar]
- Grimmond, C.S.B.; Oke, T.R. Evapotranspiration rates in urban areas, impacts of urban growth on surface water and groundwater quality. In Proceedings of the IUGG 99 Symposium HS5, Birmingham, England, 18–30 July 1999; IAHS Publications no 259. IAHS Publications: Wallingford, UK, 1999; pp. 235–243. [Google Scholar]
- Nistor, M.M.; Porumb-Ghiurco, G.C. How to compute the land cover evapotranspiration at regional scale? A spatial approach of Emilia-Romagna region. GEOREVIEW Sci. Ann. Ştefan Cel Mare Univ. Suceava Geogr. Ser. 2015, 25, 38–54. [Google Scholar]
- Nistor, M.M.; Mîndrescu, M. Climate change effect on groundwater resources in Emilia-Romagna region: An improved assessment through NISTOR-CEGW method. Quat. Int. 2019, 504, 214–228. [Google Scholar] [CrossRef]
- Budyko, M.I. Climate and Life; Academic Press: New York, NY, USA, 1974; p. 508. [Google Scholar]
- Civita, M. Idrogeologia Applicata ed Ambientale; CEA: Milano, Italy, 2005; p. 794. (In Italian) [Google Scholar]
- BGR & UNESCO. International Hydrogeological Map of Europe (IHME1500) 1:1,500,000. International Association of Hydrogeologists. 2013. Available online: http://www.bgr.bund.de/ihme1500/ (accessed on 2 March 2020).
- Copernicus Land Monitoring Services. Corine Land Cover. 2012. Available online: http://land.copernicus.eu/pan-european/corine-land-cover (accessed on 18 July 2016).
- Schulp, C.J.E.; Tieskens, K.F.; Sturck, J.; Fuchs, R.; van der Zanden, E.H.; Schrammeijer, E.; Verburg, P.H. EU scale Analysis of Future cultural Landscape Dynamics; Report No. 1; WP 5 Fine- and Broad- Scale Modelling of Future Landscapes; HERCULES Publisher: Brussels, Belgium, 2015. [Google Scholar]
- Lotze-Campen, H.; Müller, C.; Bondeau, A.; Rost, S.; Popp, A.; Lucht, W. Global food demand, productivity growth, and the scarcity of land and water resources: A spatially explicit mathematical programming approach. Agric. Econ. 2013. [Google Scholar] [CrossRef]
- World Health Organization (WHO). Nitrate and Nitrite in Drinking-Water; Background Document for Development of WHO GUIDELINES for Drinking-Water Quality; WHO: Geneva, Switzerland, 2011. [Google Scholar]
- Nistor, M.M.; Dezsi, S.; Cheval, S. Vulnerability of groundwater under climate change and land cover: A new spatial assessment method applied on Beliş district (Western Carpathians, Romania). Environ. Eng. Manag. J. 2015, 14, 2959–2971. [Google Scholar]
- McCoy, J.; Johnston, K. Using ArcGIS™ Spatial Analyst; GIS by ESRI: Redland, CA, USA, 2002. [Google Scholar]
- Stempvoort, D.V.; Ewert, L.; Wassenaar, L. Aquifers vulnerability index: A GIS—Compatible method for groundwater vulnerability mapping. Can. Water Resour. J./Rev. Can. Ressour. Hydr. 1993, 18, 25–37. [Google Scholar] [CrossRef] [Green Version]
- Daly, D.; Dassargues, A.; Drew, D.; Dunne, S.; Goldscheider, N.; Neale, S.; Popescu, I.C.; Zwahlen, F. Main concepts of the “European approach” to karstgroundwater-vulnerability assessment and mapping. Hydrogeol. J. 2002, 10, 340–345. [Google Scholar] [CrossRef] [Green Version]
- Dixon, B. Groundwater vulnerability mapping: A GIS and fuzzy rule based integrated tool. Appl. Geogr. 2005, 25, 327–347. [Google Scholar] [CrossRef]
- Haidu, I.; Nistor, M.M. Groundwater vulnerability assessment in the Grand Est region, France. Quat. Int. 2019. [Google Scholar] [CrossRef]
Figure 1.
Location of the Piedmont region on the map of Italy and the main aquifers productivity type in the study area.
Figure 1.
Location of the Piedmont region on the map of Italy and the main aquifers productivity type in the study area.

Figure 2.
Spatial distribution of temperature, precipitation, and potential evapotranspiration (ET0) in the Piedmont region. (a) The average of the mean annual air temperature between 1960 and 1990 (1990s); (b) The average of the mean annual air temperature between 2011 and 2040 (2020s); (c) The average of the mean annual air temperature between 2041 and 2070 (2050s); (d) The average of the mean annual precipitation between 1960 and 1990 (1990s); (e) The average of the mean annual precipitation between 2011 and 2040 (2020s); (f) The average of the mean annual precipitation between 2041 and 2070 (2050s); (g) The average of the annual ET0 between 1960 and 1990 (1990s); (h) The average of the annual ET0 between 2011 and 2040 (2020s); (i) The average of annual ET0 between 2041 and 2070 (2050s). Source Nistor et al. (2019).

Figure 3.
Vulnerability factor distribution at a spatial scale of the Piedmont region. Source: Nistor et al. (2019).
Figure 3.
Vulnerability factor distribution at a spatial scale of the Piedmont region. Source: Nistor et al. (2019).

Figure 4.
Distribution of nitrate (NO3) monitoring points between 2005 and 2012, in the Piedmont region. Background image source: Esri, Garmin, GEBCO, NOAA NGDC, and other contributors. Source: Nistor et al. (2019).
Figure 4.
Distribution of nitrate (NO3) monitoring points between 2005 and 2012, in the Piedmont region. Background image source: Esri, Garmin, GEBCO, NOAA NGDC, and other contributors. Source: Nistor et al. (2019).

Figure 5.
Spatial distribution of water availability (WA) in the Piedmont region. (a) WA related to the present period (2020s); (b) WA related to the future period (2050s), Scenario A1; (c) WA related to the future period (2050s), Scenario B1; (d) WA related to the future period (2050s), Scenario A2; (e) WA related to the future period (2050s), Scenario B2. Source: Nistor et al. (2019).

Figure 6.
Groundwater vulnerability maps of the Piedmont region. (a) Vulnerability map related to the past period (1990s); (b) Vulnerability map related to the present period (2020s). Background image source: Esri, Garmin, GEBCO, NOAA NGDC, and other contributors.
Figure 6.
Groundwater vulnerability maps of the Piedmont region. (a) Vulnerability map related to the past period (1990s); (b) Vulnerability map related to the present period (2020s). Background image source: Esri, Garmin, GEBCO, NOAA NGDC, and other contributors.

Figure 7.
Groundwater vulnerability map of the Piedmont region. (a) Groundwater vulnerability map related to the future period (2050s), Scenario A1; (b) Groundwater vulnerability map related to the future period (2050s), Scenario B1; (c) Groundwater vulnerability map related to the future period (2050s), Scenario A2; (d) Groundwater vulnerability map related to the future period (2050s), Scenario B2. Background image source: Esri, Garmin, GEBCO, NOAA NGDC, and other contributors. Source: Nistor et al. (2019).


Table 1.
Aquifers productivity in the Piedmont region.
| Aquifers Type | Vulnerability Factor |
|---|---|
| Highly productive fissured aquifers (including karstified rocks) | 0.8 |
| Low and moderately productive fissured aquifers (including karstified rocks) | 0.4 |
| Highly productive porous aquifers | 0.7 |
| Low and moderately productive porous aquifers | 0.3 |
| Locally aquiferous rocks, porous or fissured | 0.1 |
| Practically non-aquiferous rocks, porous or fissured | 0.05 |
| Snow field/ice field | 0 |
Source: IHME (2013), Čenčur Curk et al. (2014).
Table 2.
Corine land cover classes and relative pollution load index applied for CLC 2000 and 2012, in the Piedmont region.
Table 2.
Corine land cover classes and relative pollution load index applied for CLC 2000 and 2012, in the Piedmont region.
| Corine Land Cover | |||
|---|---|---|---|
| CLC Code 2012 | CLC Description | Pollution Load Index | Normalized Vulnerability Coefficient |
| 111 | Continuous urban fabric | 6 | 0.40 |
| 112 | Discontinuous urban fabric | 5.5 | 0.36 |
| 121 | Industrial or commercial units | 5 | 0.33 |
| 122 | Road and rail networks and associated land | 7.5 | 0.50 |
| 123 | Port areas | 7 | 0.46 |
| 124 | Airports | 7 | 0.46 |
| 131 | Mineral extraction sites | 9 | 0.60 |
| 132 | Dump sites | 14 | 0.93 |
| 133 | Construction sites | 7 | 0.46 |
| 141 | Green urban areas | 3.5 | 0.23 |
| 142 | Sport and leisure facilities | 4 | 0.26 |
| 211 | Non-irrigated arable land | 12 | 0.80 |
| 212 | Permanently irrigated land | 15 | 1.00 |
| 213 | Rice fields | 13.5 | 0.90 |
| 221 | Vineyards | 6 | 0.40 |
| 222 | Fruit trees and berry plantations | 5 | 0.33 |
| 223 | Olive groves | 4.5 | 0.30 |
| 231 | Pastures | 3.5 | 0.23 |
| 241 | Annual crops associated with permanent crops | 9 | 0.60 |
| 242 | Complex cultivation patterns | 8.3 | 0.55 |
| 243 | Land principally occupied by agriculture, with significant areas of natural vegetation | 5.5 | 0.36 |
| 244 | Agro-forestry areas | 3 | 0.19 |
| 311 | Broad-leaved forest | 3.6 | 0.23 |
| 312 | Coniferous forest | 2.5 | 0.16 |
| 313 | Mixed forest | 2.8 | 0.18 |
| 321 | Natural grasslands | 2.5 | 0.16 |
| 322 | Moors and heathland | 2.7 | 0.17 |
| 323 | Sclerophyllous vegetation | 2.5 | 0.16 |
| 324 | Transitional woodland-shrub | 2.6 | 0.17 |
| 331 | Beaches, dunes, sands | 2.5 | 0.16 |
| 332 | Bare rocks | 1.5 | 0.09 |
| 333 | Sparsely vegetated areas | 2 | 0.13 |
| 334 | Burnt area | 5 | 0.33 |
| 335 | Glaciers and perpetual snow | 0.1 | 0.007 |
| 411 | Inland marshes | 2.3 | 0.15 |
| 412 | Peat bogs | 2.3 | 0.15 |
| 421 | Salt marshes | 2.3 | 0.15 |
| 422 | Salines | 2.3 | 0.15 |
| 423 | Intertidal flats | 3 | 0.19 |
| 511 | Water courses | 3 | 0.19 |
| 512 | Water bodies | 3 | 0.19 |
| 521 | Coastal lagoons | 3 | 0.19 |
| 522 | Estuaries | 3 | 0.19 |
| 523 | Sea and ocean | 3 | 0.19 |
Source: Wochna (2011), Čenčur Curk et al. (2014), and Nistor et al. (2015).
Table 3.
Corine land cover classes and relative pollution load index applied to future scenarios, in the Piedmont region.
Table 3.
Corine land cover classes and relative pollution load index applied to future scenarios, in the Piedmont region.
| Corine Land Cover | Kc | |||
|---|---|---|---|---|
| CLC Code 2012 | CLC Projection Code | CLC Description | Pollution Load Index | Normalized Vulnerability Coefficient |
| 133 | 0 | Built-up area | 7 | 0.46 |
| 211 | 1 | Arable land (non-irrigated) | 12 | 0.80 |
| 231 | 2 | Pasture | 3.5 | 0.23 |
| 324 | 3 | Natural and semi-natural vegetation (including Natural grasslands, scrublands, regenerating forest below 2 m, and small forest patches within agricultural landscapes) | 2.6 | 0.17 |
| 411 | 4 | Inland wetlands | 2.3 | 0.15 |
| 335 | 5 | Glaciers and snow | 0.1 | 0.00 |
| 212 | 6 | Irrigated arable land | 15 | 1.00 |
| 321 | 7 | Recently abandoned arable land (i.e., “long fallow”; includes very extensive farmland not reported in agricultural statistics, herbaceous vegetation, grasses and shrubs below 30 cm) | 2.5 | 0.16 |
| 241 | 8 | Permanent crops | 9 | 0.60 |
| 313 | 10 | Forest | 2.8 | 0.18 |
| 333 | 11 | Sparsely vegetated areas | 2 | 0.13 |
| 331 | 12 | Beaches, dunes and sands | 2.5 | 0.16 |
| 422 | 13 | Salines | 2.3 | 0.15 |
| 521 | 14 | Water and coastal flats | 3 | 0.19 |
| 322 | 15 | Heathland and moorlands | 2.7 | 0.17 |
| 324 | 16 | Recently abandoned pasture land (includes very extensive pasture land not reported in agricultural statistics, grasses and shrubs below 30 cm) | 2.6 | 0.17 |
Source: Wochna (2011), Čenčur Curk et al. (2014), and Nistor et al. (2015).
Table 4.
Corine land cover classes and appropriate annual crop coefficient (Kc) presently, in the Piedmont region.
Table 4.
Corine land cover classes and appropriate annual crop coefficient (Kc) presently, in the Piedmont region.
| Corine Land Cover | Kc Annual | |||||
|---|---|---|---|---|---|---|
| CLC code 2012 | CLC Description | Kc | Ks | Ku | Kw | Kclc |
| 111 | Continuous urban fabric | - | - | 0.3 | - | 0.29 |
| 112 | Discontinuous urban fabric | - | - | 0.2 | - | 0.21 |
| 121 | Industrial or commercial units | - | - | 0.3 | - | 0.3 |
| 122 | Road and rail networks and associated land | - | - | 0.3 | - | 0.25 |
| 123 | Port areas | - | - | 0.4 | - | 0.39 |
| 124 | Airports | - | - | 0.3 | - | 0.3 |
| 131 | Mineral extraction sites | - | - | 0.3 | - | 0.26 |
| 132 | Dump sites | - | - | 0.3 | - | 0.26 |
| 133 | Construction sites | - | - | 0.3 | - | 0.26 |
| 141 | Green urban areas | - | - | 0.2 | - | 0.21 |
| 142 | Sport and leisure facilities | - | - | 0.2 | - | 0.21 |
| 211 | Non-irrigated arable land | 1.14 | - | - | - | 1.14 |
| 212 | Permanently irrigated land | 1.25 | - | - | - | 1.25 |
| 213 | Rice fields | 0.94 | - | - | - | 0.94 |
| 221 | Vineyards | 0.5 | - | - | - | 0.5 |
| 222 | Fruit trees and berry plantations | 0.68 | - | - | - | 0.68 |
| 223 | Olive groves | 0.66 | - | - | - | 0.66 |
| 231 | Pastures | 0.7 | - | - | - | 0.7 |
| 241 | Annual crops associated with permanent crops | 0.67 | - | - | - | 0.67 |
| 242 | Complex cultivation patterns | 1.16 | - | - | - | 1.16 |
| 243 | Land principally occupied by agriculture, with significant areas of natural vegetation | 0.92 | - | - | - | 0.92 |
| 244 | Agro-forestry areas | 0.92 | - | - | - | 0.92 |
| 311 | Broad-leaved forest | 1.42 | - | - | - | 1.42 |
| 312 | Coniferous forest | 1 | - | - | - | 1 |
| 313 | Mixed forest | 1.33 | - | - | - | 1.33 |
| 321 | Natural grasslands | 0.97 | - | - | - | 0.97 |
| 322 | Moors and heathland | 0.92 | - | - | - | 0.92 |
| 323 | Sclerophyllous vegetation | 0.62 | - | - | - | 0.62 |
| 324 | Transitional woodland-shrub | 0.83 | - | - | - | 0.83 |
| 331 | Beaches, dunes, sands | - | 0.23 | - | - | 0.23 |
| 332 | Bare rocks | - | 0.15 | - | - | 0.15 |
| 333 | Sparsely vegetated areas | 0.48 | - | - | - | 0.48 |
| 334 | Burnt area | - | 0.1 | - | - | 0.1 |
| 335 | Glaciers and perpetual snow | - | - | - | 0.51 | 0.51 |
| 411 | Inland marshes | - | - | - | 0.45 | 0.45 |
| 412 | Peat bogs | - | - | - | 0.37 | 0.37 |
| 421 | Salt marshes | - | - | - | 0.32 | 0.32 |
| 422 | Salines | - | 0.1 | - | - | 0.1 |
| 423 | Intertidal flats | - | - | - | 0.64 | 0.64 |
| 511 | Water courses | - | - | - | 0.63 | 0.63 |
| 512 | Water bodies | - | - | - | 0.64 | 0.64 |
| 521 | Coastal lagoons | - | - | - | 0.68 | 0.68 |
| 522 | Estuaries | - | - | - | 0.62 | 0.62 |
| 523 | Sea and ocean | - | - | - | 0.74 | 0.74 |
Kc, crop coefficient for plants; Ks, evaporation coefficient for bare soils; Ku, crop coefficient for urban areas; Kw, evaporation coefficient for open water; and Kclc, crop coefficient for land cover. Source: From Allen et al. (1998) and Nistor and Mîndrescu (2019).
Table 5.
Corine land cover classes and calculated annual Kc for future scenarios, in the Piedmont region.
Table 5.
Corine land cover classes and calculated annual Kc for future scenarios, in the Piedmont region.
| Corine Land Cover | Kc | ||||||
|---|---|---|---|---|---|---|---|
| CLC code 2012 | CLC projection code | CLC Description | Kc | Ks | Ku | Kw | Kclc |
| 133 | 0 | Built-up area | - | - | 0.26 | - | 0.26 |
| 211 | 1 | Arable land (non-irrigated) | 1.14 | - | - | - | 1.14 |
| 231 | 2 | Pasture | 0.7 | - | - | - | 0.7 |
| 321 and 324 | 3 | Natural and semi-natural vegetation (including natural grasslands, scrublands, regenerating forest below 2 m, and small forest patches within agricultural landscapes) | 0.9 | - | - | - | 0.9 |
| 411 | 4 | Inland wetlands | - | - | - | 0.45 | 0.45 |
| 335 | 5 | Glaciers and snow | - | - | - | 0.51 | 0.51 |
| 212 | 6 | Irrigated arable land | 1.25 | - | - | - | 1.25 |
| 321 | 7 | Recently abandoned arable land (i.e. “long fallow”; includes very extensive farmland not reported in agricultural statistics, herbaceous vegetation, grasses, and shrubs below 30 cm) | 0.97 | - | - | - | 0.97 |
| 241 | 8 | Permanent crops | 0.67 | - | - | - | 0.67 |
| 313 | 10 | Forest | 1.33 | - | - | - | 1.33 |
| 333 | 11 | Sparsely vegetated areas | 0.48 | - | - | - | 0.48 |
| 331 | 12 | Beaches, dunes and sands | - | 0.23 | - | - | 0.23 |
| 422 | 13 | Salines | - | 0.1 | - | - | 0.1 |
| 423 and 521 | 14 | Water and coastal flats | - | - | - | 0.66 | 0.66 |
| 322 | 15 | Heathland and moorlands | 0.92 | - | - | - | 0.92 |
| 231 and 324 | 16 | Recently abandoned pasture land (includes very extensive pasture land not reported in agricultural statistics, grasses, and shrubs below 30 cm) | 0.76 | - | - | - | 0.76 |
Kc, crop coefficient for plants; Ks, evaporation coefficient for bare soils; Ku, crop coefficient for urban areas; Kw, evaporation coefficient for open water; and Kclc, crop coefficient for land cover. Source: From Allen et al. (1998) and Nistor and Mîndrescu (2019).
Table 6.
Pixel pair comparison of groundwater vulnerability model in the Piedmont region (2020s).
| Class Difference | No. of Pixels | Percentage Statistics (%) |
|---|---|---|
| 0, 1 | 20 | 87 |
| 2 | 2 | 9 |
| 3 | 1 | 4 |
| 4 | 0 | 0 |
© 2020 by the author. Licensee MDPI, Basel, Switzerland. This article is an open access article distributed under the terms and conditions of the Creative Commons Attribution (CC BY) license (http://creativecommons.org/licenses/by/4.0/).
Share and Cite
MDPI and ACS Style
Nistor, M.-M. Groundwater Vulnerability in the Piedmont Region under Climate Change. Atmosphere 2020, 11, 779. https://doi.org/10.3390/atmos11080779
AMA Style
Nistor M-M. Groundwater Vulnerability in the Piedmont Region under Climate Change. Atmosphere. 2020; 11(8):779. https://doi.org/10.3390/atmos11080779
Chicago/Turabian StyleNistor, Mărgărit-Mircea. 2020. "Groundwater Vulnerability in the Piedmont Region under Climate Change" Atmosphere 11, no. 8: 779. https://doi.org/10.3390/atmos11080779
Note that from the first issue of 2016, this journal uses article numbers instead of page numbers. See further details here.