Article

Characterization of Atmospheric PM2.5 Inorganic Aerosols Using the Semi-Continuous PPWD-PILS-IC System and the ISORROPIA-II

1
Institute of Environmental Engineering, National Chiao Tung University, Hsinchu 30010, Taiwan
2
School of Energy and Environmental Engineering, University of Science and Technology Beijing, Beijing 100083, China
3
Mechanical Engineering Department, University of Minnesota, Minneapolis, MN 55455, USA
*
Author to whom correspondence should be addressed.
Atmosphere 2020, 11(8), 820; https://doi.org/10.3390/atmos11080820
Submission received: 2 July 2020 / Revised: 29 July 2020 / Accepted: 31 July 2020 / Published: 4 August 2020
(This article belongs to the Special Issue Chemical Analysis Methods for Particle-Phase Pollutants)

Abstract

:
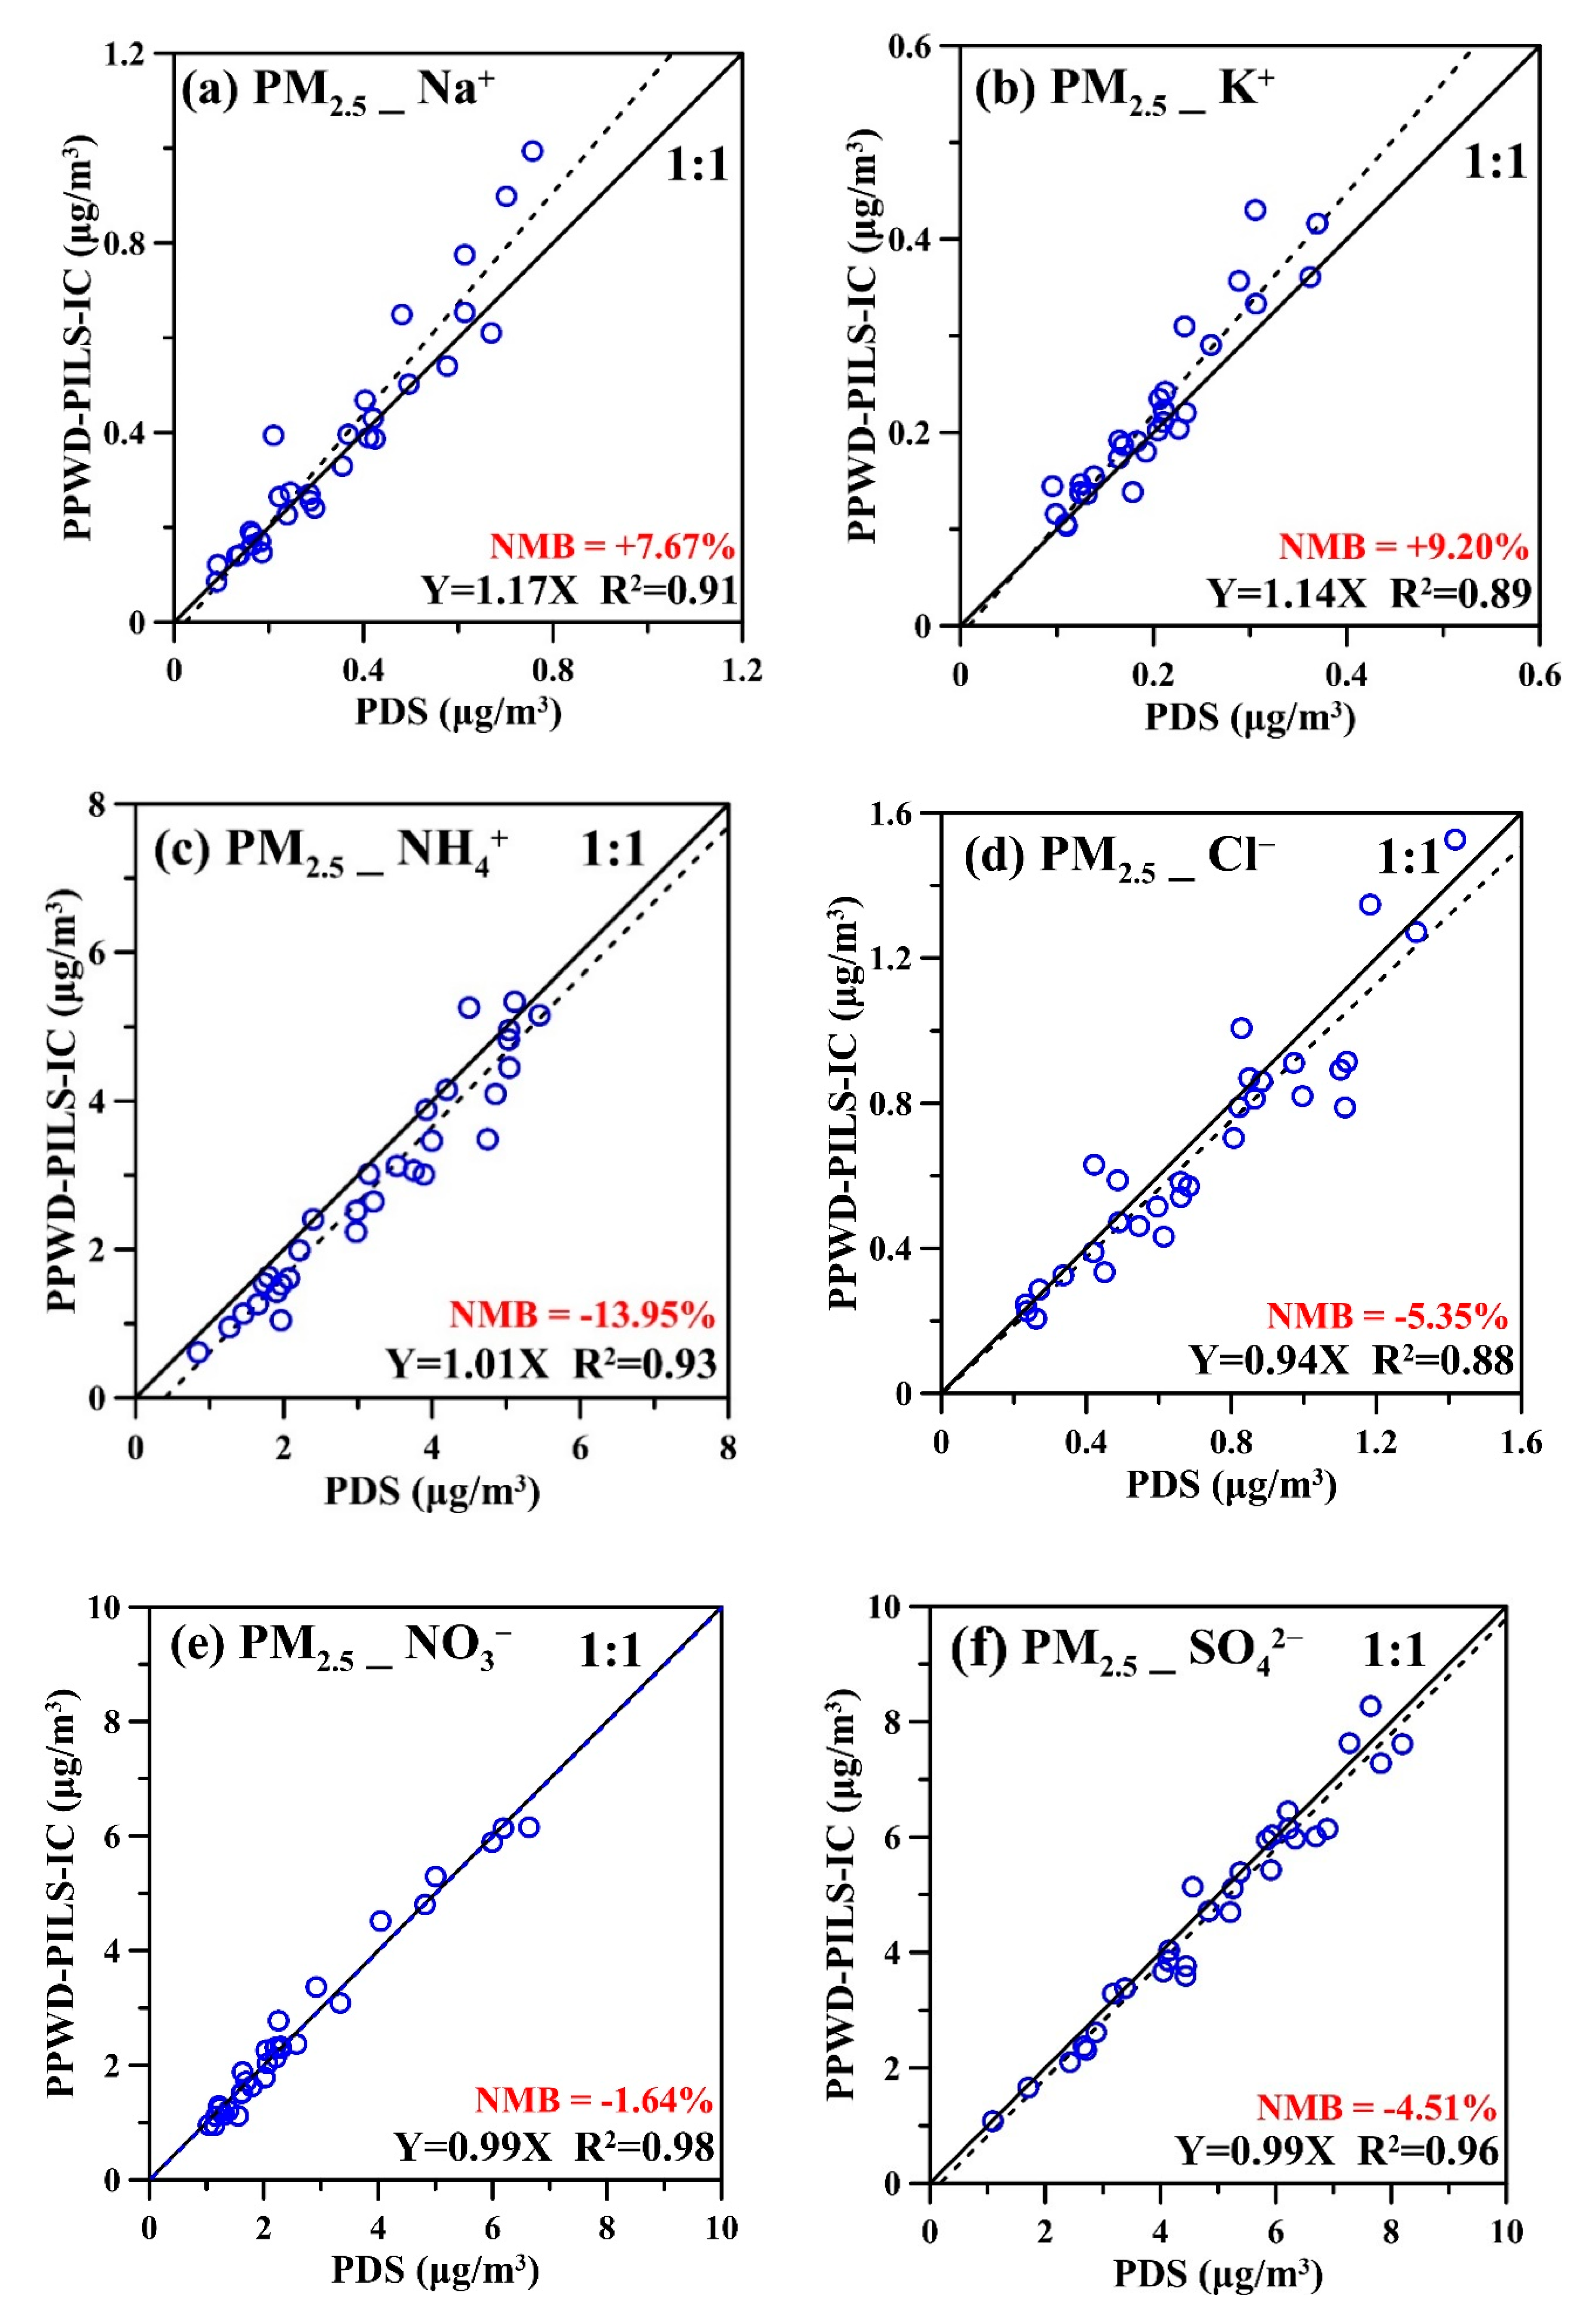
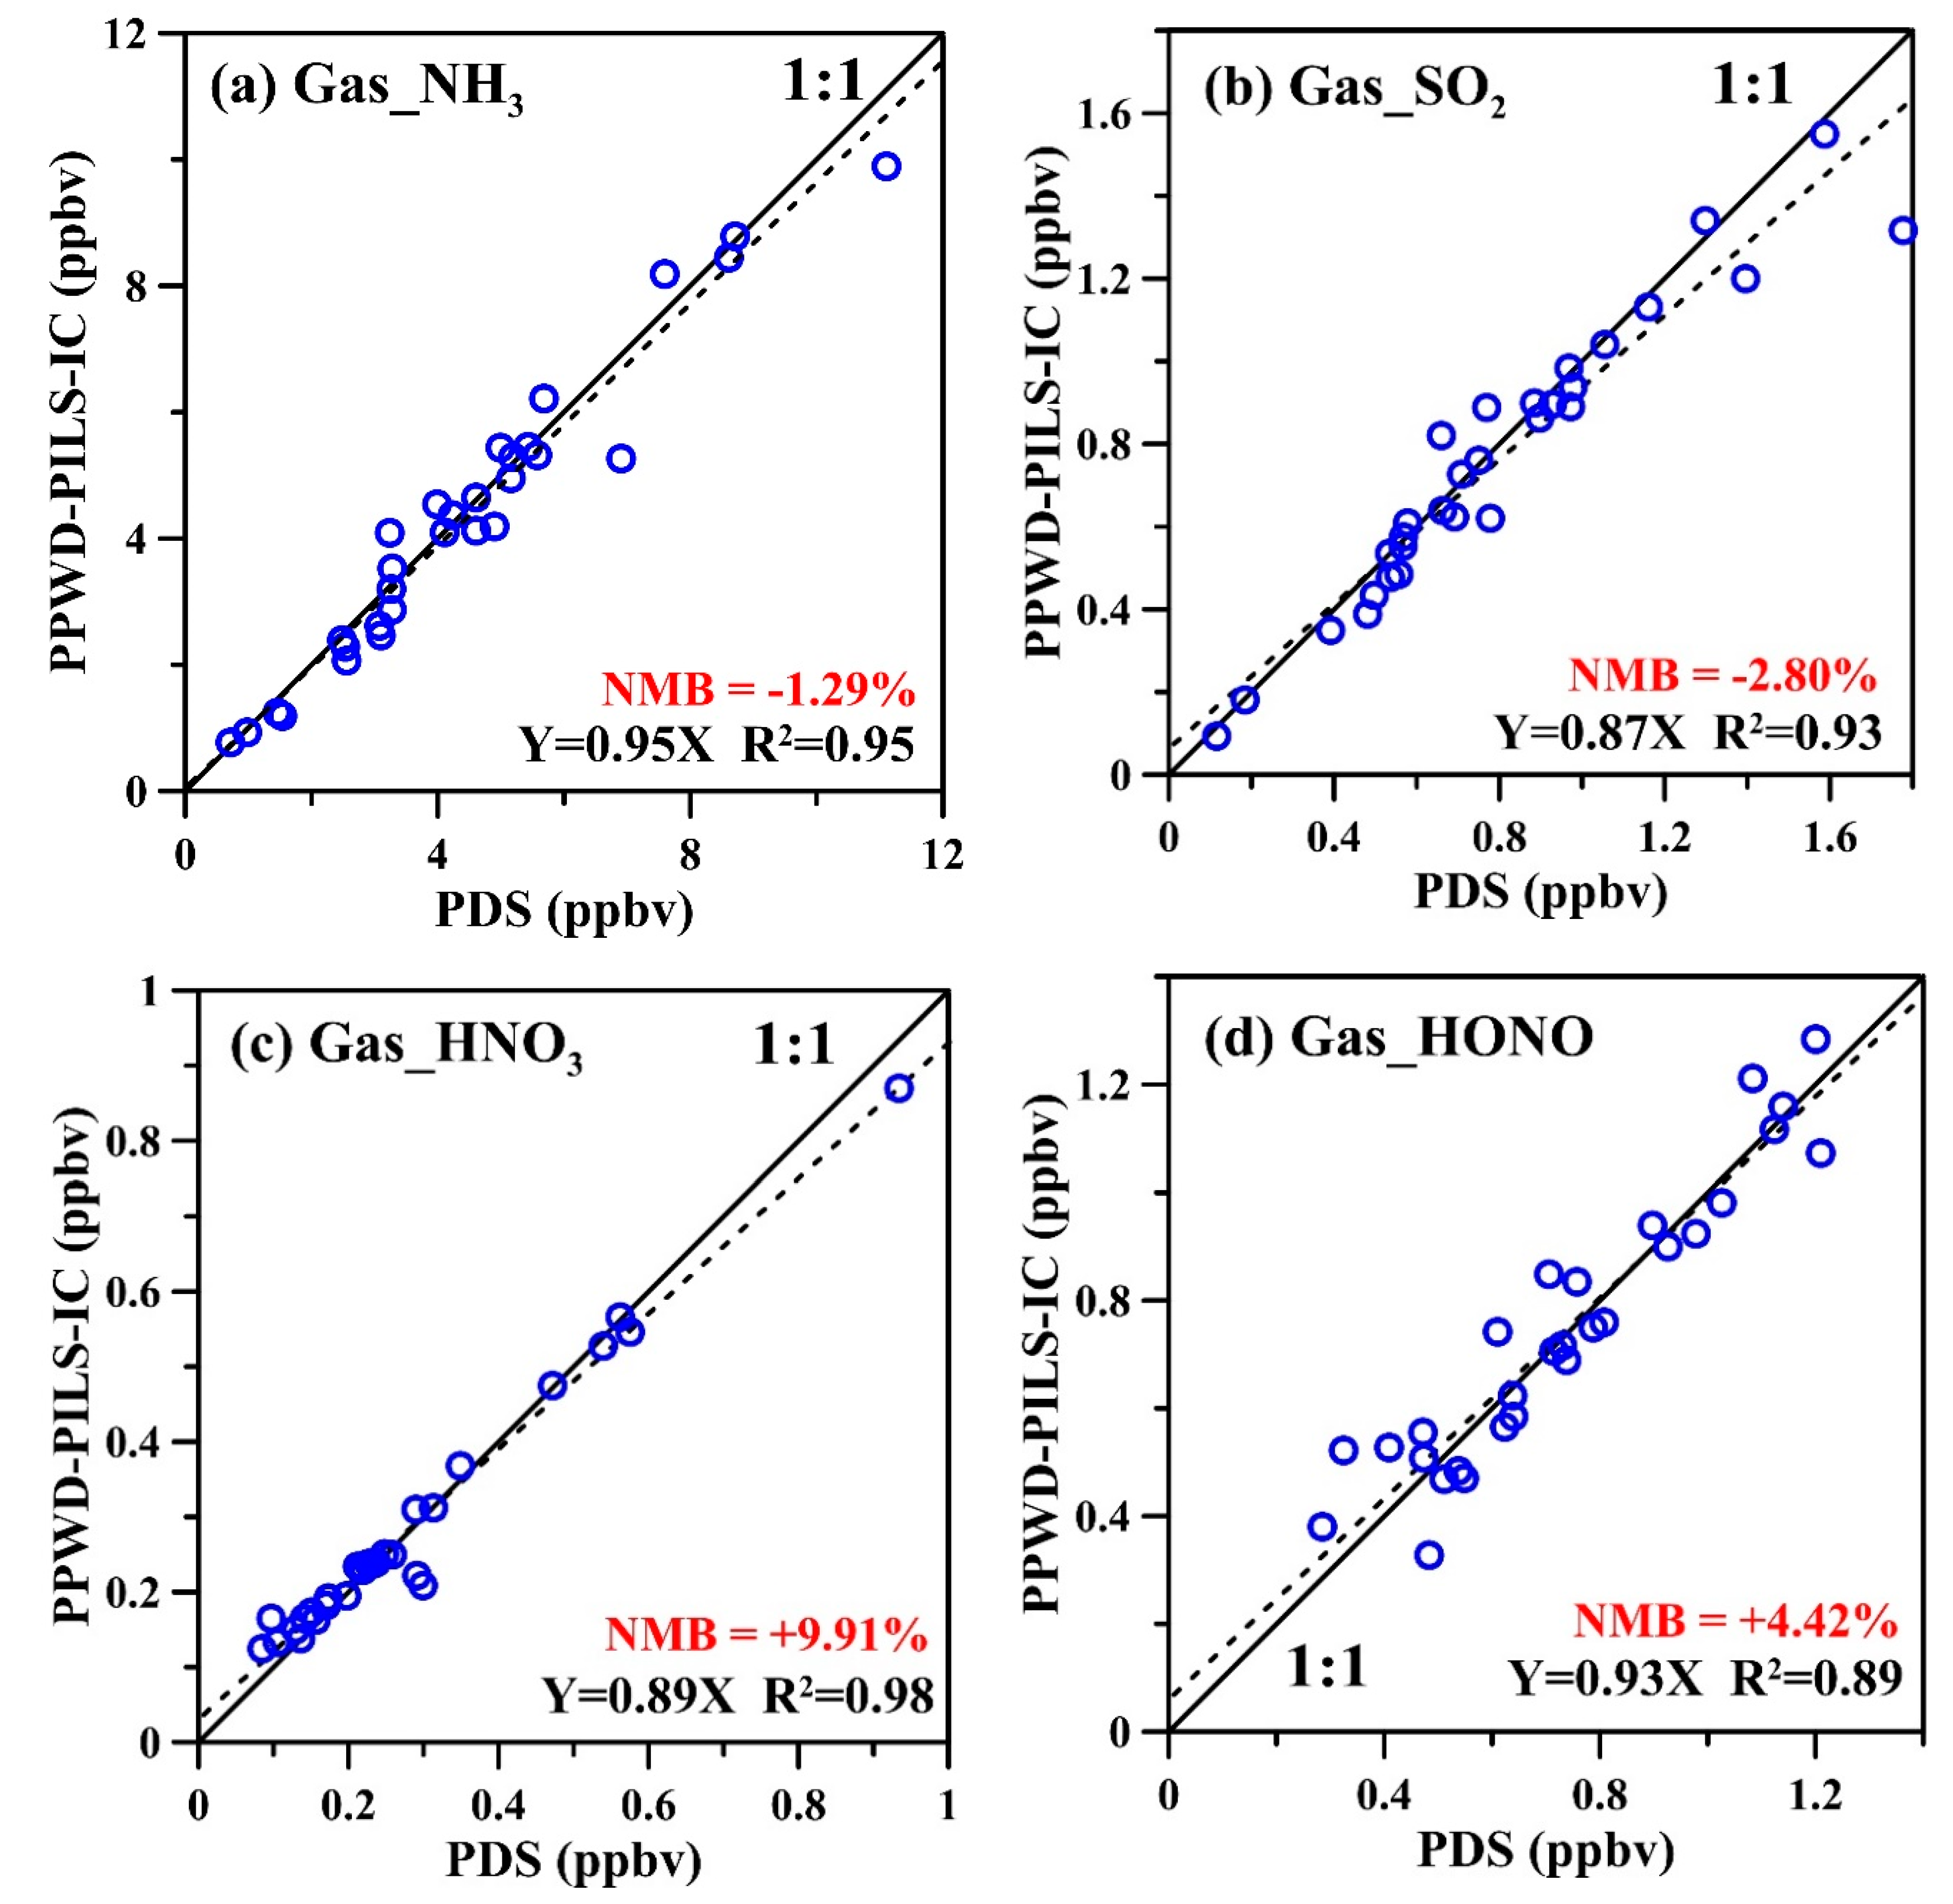
A semi-continuous monitoring system, a parallel plate wet denuder and particle into liquid sampler coupled with ion chromatography (PPWD-PILS-IC), was used to measure the hourly precursor gases and water-soluble inorganic ions in ambient particles smaller than 2.5 µm in diameter (PM2.5) for investigating the thermodynamic equilibrium of aerosols using the ISORROPIA-II thermodynamic equilibrium model. The 24-h average PPWD-PILS-IC data showed very good agreement with the daily data of the manual 5 L/min porous-metal denuder sampler with R2 ranging from 0.88 to 0.98 for inorganic ions (NH4+, Na+, K+, NO3, SO42−, and Cl) and 0.89 to 0.98 for precursor gases (NH3, HNO3, HONO, and SO2) and slopes ranging from 0.94 to 1.17 for ions and 0.87 to 0.95 for gases, respectively. In addition, the predicted ISORROPIA-II results were in good agreement with the hourly observed data of the PPWD-PILS-IC system for SO42− (R2 = 0.99 and slope = 1.0) and NH3 (R2 = 0.97 and slope = 1.02). The correlation of the predicted results and observed data was further improved for NH4+ and NO3 with the slope increasing from 0.90 to 0.96 and 0.95 to 1.09, respectively when the HNO2 and NO2 were included in the total nitrate concentration (TN = [NO3] + [HNO3] + [HONO] + [NO2]). The predicted HNO3 data were comparable to the sum of the observed [HNO3] and [HONO] indicating that HONO played an important role in the thermodynamic equilibrium of ambient PM2.5 aerosols but has not been considered in the ISORROPIA-II thermodynamic equilibrium model.

1. Introduction

Particles smaller than 2.5 µm in diameter (PM2.5) exposure has been confirmed to be associated with total mortality, cardiovascular and respiratory mortalities, lung cancer, influenza, etc. [1] due to its chronic adverse human health effects [2]. Some previous studies [3,4] have revealed that PM2.5 constituents such as sulfate, nitrate, and ammonium were responsible for these effects. Sulfate (SO42−), nitrate (NO3), and ammonium (NH4+) are the major water-soluble inorganic (WSI) species, which represent very large fractions in PM2.5 depending on source emissions, human activities, chemical reactions, and meteorological conditions [5]. For example, SO42−, NO3, and NH4+ ions accounted for 39% to 63% on the episode days and from 14.5% to 39% on the non-episode days in Taiwan [6]. These WSI species influence the hygroscopic nature, acidity properties, optical properties, and lifetime of PM2.5 [7,8] in which SO42−, NO3, and NH4+ ions are the secondary species mainly formed from the chemical reactions of precursor gases (NH3, HNO3, and H2SO4) and nucleation and condensation processes [9]. For instance, up to 80% of NO3 and NH4+ in PM2.5 can be formed from precursor gases in the South Coast Air Basin in the USA [10].
Generally, NH3 prefers to react homogeneously with H2SO4 to form (NH4)2SO4 first, and then the excess NH3 reacts with HNO3 to form NH4NO3 when the molar ratio of NH4+/SO42− is greater than two [11,12]. Therefore, the total molar concentration of SO42− and NO3 shows a good correlation (R2 > 0.9) with that of NH4+ [12]. The formation of sulfate and nitrate particles is also affected by environmental factors including temperature (T), relative humidity (RH) [12], wind speed [13], and pressure [11]. As compared with (NH4)2SO4, NH4NO3 is more unstable at high temperature and low relative humidity conditions [5] due to the reversible phase equilibrium with HNO3 and NH3. The NO3 concentration can also be increased by the uptake of HNO3 on particles at high RH and low T conditions [13,14]. In addition, NO3 (p) along with HONO can also be generated by the hydrolysis of NO2 on the particle surface with the NH3 promotion [15,16]. The additional HONO source also contributes to the formation of NO3(p) due to the enhanced oxidation of hydroxyl radical (OH) with NO2 to produce more HNO3 [17]. In addition, HNO3(g)/NO3(p) can be photolyzed to form HONO under moderate to low NO2 conditions [18,19].
To determine the chemical composition of PM2.5 aerosols by measuring the mass concentrations of precursor gases and particles simultaneously, a system consisting of a manual filter sampler and a denuder (i.e., annular denuder, coiled denuder, and honeycomb denuder) is usually used [20] since manual filter samplers show good measurement accuracy [21]. The samples are, then, extracted and mass concentrations are quantified using ion chromatography (IC). However, manual filter samplers have negative artifacts due to the semi-volatile nature of NH4+ and NO3 [22] resulting in underestimation [23,24]. A porous-metal denuder sampler (PDS) [25], which uses acidic/basic coated porous metal discs to capture the basic/acidic precursor gases combined with a Teflon filter to collect particles and back-up filters to collect the semi-volatile materials evaporated from collected particles, can be used for determining the accurate mass concentrations of gases and particles simultaneously without evaporation loss [26]. Nevertheless, this method can be time-consuming and labor-intensive and is not fast enough to characterize the rapid evolution of atmospheric particles.
Currently, there are some hourly monitoring systems for water-soluble ions in PM2.5 including the wet-annular denuder and steam-jet aerosol collector (WAD/SJAC) [27], the monitor for aerosols and gases in ambient air (MARGA) [28], the gas particle ion chromatography system (GPIC) [29], the ambient ion monitor ion chromatograph (AIM-IC) [30], and the parallel plate wet denuder and particle into liquid sampler) (PPWD/PILS) [31]. Some previous studies have shown that the WAD/SJAC measured NH4+ and SO42− ion concentration incorrectly at high mass loading conditions [27], the MARGA biased low HNO3 and NH3 gas concentrations as compared with those measured by the denuder/filter pack method [32], the GPIC overestimated NH3 and SO2 mass concentrations and underestimated HNO3 concentration as compared with the manual denuder sampler [33], and the AIM-IC overestimated SO42− ion concentration [34] and underestimated 11% NH3(g), 19% SO2(g) and 12% HNO3(g) [35]. In comparison, the PPWD/PILS consisting of PPWD [36,37] and PILS [38,39] and coupled with the IC (i.e., PPWD-PILS-IC) developed by our group [31] showed good agreement with the PDS for precursor gases (slope 0.92–.04) and PM2.5 ion species as well (slope 0.75–0.97 and R2: 0.77–0.94). In addition, the PPWD-PILS-IC system has low MDLs (method detection limit) which are less than 0.01 µg/m3 for Na+, Ca2+, NO2, and SO42− and 0.02 µg/m3 for NH4+, NO3, and Cl, respectively. However, the performance of the PPWD-PILS-IC needs to be studied further to improve the linear regression parameters for gases (R2 0.76–0.83) and NH4+ ion (slope 0.84 and R2 0.89).
The equilibrium partitioning of the WSI species in different phases (particle (p), aqueous (aq), and gas (g) phases) at different T and RH conditions is complex and nonlinear, which needs the support of some thermodynamic equilibrium models to simulate the physical and thermodynamic processes. To meet these needs, many thermodynamic equilibrium models have been developed including AIM2 [40], SCAPE2 [41], EQUISOLV II [42], ISORROPIA/ISORROPIA-II [43,44], GFEMN [45], EQSAM2 [46], HETV [47], MESA [48], and UHAERO [49]. Among these methods, the ISORROPIA-II was used extensively since it includes the crustal elements (K+, Ca2+, Mg2+, and Na+), can simulate the thermodynamic equilibrium of particles in the stable state or metastable state, and can be used to solve the forward problem or the reverse problem in which particle-phase species can be used to determine the partial pressure of the gas phase species under the equilibrium condition [47]. Additionally, the ISORROPIA-II thermodynamic equilibrium model has been proven to be an order of magnitude faster than the SCAPE2 [44]. Previous studies have shown that the ISORROPIA-II thermodynamic equilibrium model predicted accurately for NH3 but had biases for NH4, NO3, and HNO3 as compared with the observations due to the uptake of HNO3 on coarse particles [44,50,51] or the evaporation properties of NH4NO3 salt [52]. Therefore, this model should be studied further to improve its partitioning capability.
In this study, the hourly concentrations of precursor gases (NH3, HNO3, SO2, and HONO) and WSI ions (NH4+, Na+, K+, SO42−, NO3, and Cl) in PM2.5 were measured by the PPWD-PILS-IC monitoring system and the 24-h average data were averaged from the hourly concentrations and compared to the daily average data of the manual 5 L/min PDS (daily data no. (N) = 30). Then, the hourly data (N = 720) were input to the ISORROPIA-II thermodynamic equilibrium model to study the thermodynamic equilibrium of ambient PM2.5 WSI aerosols.

2. Experimental Method

2.1. Five Liters Per Minute PDS Design and Laboratory Test

In this study, the 5 L/min PDS was scaled up from the original 2 L/min PDS developed by our group [25,26] to increase the collected mass. The new thinner and larger porous metal discs could be cleaned easily to minimize the background influence. As shown in Figure 1, the 5 L/min PDS, henceforth referred to as PDS, consisted of a 2.5 µm cutpoint cyclone to remove particles larger than 2.5 μm, two coated porous metal discs with a diameter of 37 mm, a thickness of 2.5 mm, and a pore diameter of 100 μm (P/N1000, Mott Inc., Farmington, CT) to capture precursor gases, 47 mm Teflon filter to collect non-volatile species in PM2.5, and two back-up filters (47 mm nylon filter and 47 mm acid-coated quartz filter) to collect acidic and basic semi-volatile species, respectively. The first and second porous metal discs were coated with sodium carbonate/glycerin (1% w/v) and citric acid (1% w/v) to collect acid gases (HNO2, HNO3, and H2SO4) and basic gas (NH3), respectively. The inner wall of the PDS was coated with Teflon material to avoid gas adsorption and minimize the loss of acidic/basic gases. The mass concentration of each WSI species is the sum of those on Teflon filter and back-up filters.
The preparation of the porous metal discs and filters is shown in detail in Section S1 in the Supplementary Information (SI) and described briefly here. The porous metal discs were cleaned 4–5 times with deionized (DI) water under the vacuum condition and ultrasonicated for 15–30 min before every coating and sampling process to eliminate the background effect. After cleaning, the background concentrations of the cleaned porous metal discs were 0.002, 0.008, 0.035, and 0.005 ppbv for NH3, HCl, HNO2, HNO3, and SO2, respectively. After sampling, the porous metals were extracted with H2O2 solution (15 mL and 5 mM) under the vacuum condition and ultrasonicated for 30 min, and the filters were extracted with DI water for 60 min before the extracted samples were analyzed by IC to determine mass concentrations.
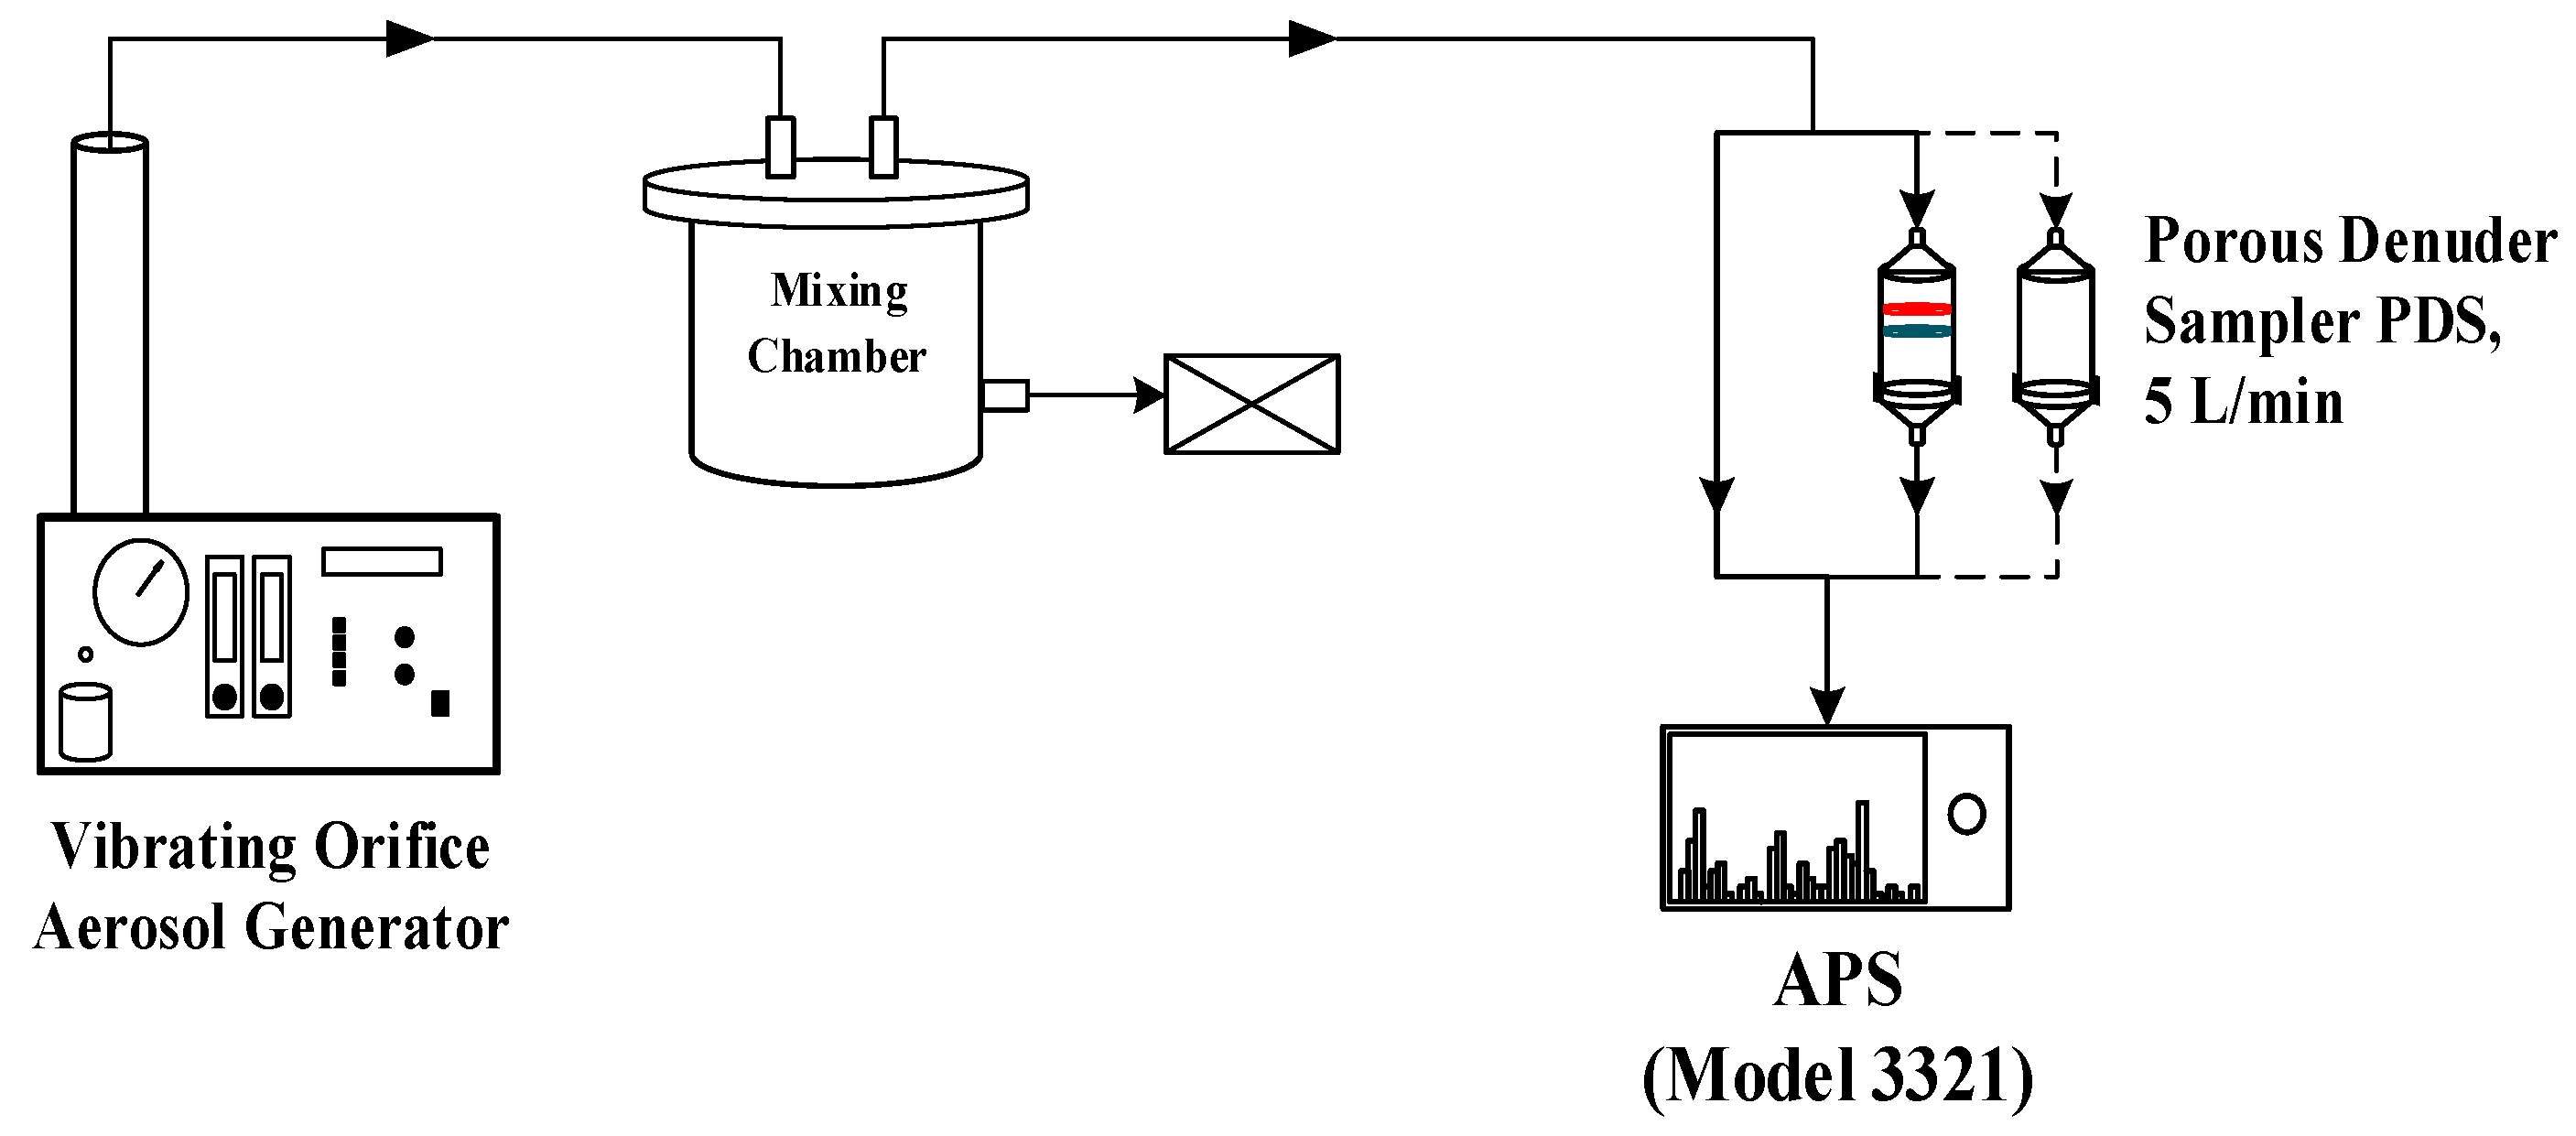
The PDS was tested for the particle penetration curve of the cyclone and the particle loss in the laboratory first, before the field test. Two porous metal discs and three filter holders were removed for testing the penetration curve of the cyclone, and then the cyclone and the three filter holders were removed for testing the particle loss of the porous metal discs. Figure 2 shows the experimental setup of the cyclone penetration curve and the PDS particle loss tests with the method shown in the previous studies [53,54]. A vibrating orifice aerosol generator (VOAG, TSI Model 3450, USA) was used to generate monodisperse NaCl particles ranging from 1.20 to 5.05 μm and an aerodynamic particle sizer (APS, model 3321, TSI Incorporated, St. Paul, MN, USA) was used to measure the upstream and downstream particle concentrations. The collection efficiency (%) and the particle loss (%) of each particle size are calculated as the difference of the upstream and downstream concentrations divided by the upstream concentration times 100%.
A spreadsheet was used to perform the numerical integration of the cyclone penetration curve and the particle loss curve with the three idealized ambient distributions to estimate the collected PM2.5 and particle loss mass concentrations [53]. The percentage of the total particle loss is the ratio of the estimated mass concentration of particle loss and collected PM2.5 times 100%.

2.2. Field Comparison Test

The field comparison test of the PPWD-PILS-IC system and the PDS was conducted at the 6th floor of the building of the Institute of Environmental Engineering, National Chiao Tung University (NCTU), Hsinchu City, Taiwan from 1 October 2018 to 15 April 2019. The sampling site is about 1 km away from a heavy-traffic road which is the major particle source at this site [55]. Thirty daily samples were collected by the PDS and 720 hourly monitoring data were obtained by the PPWD-PILS-IC system, respectively. The hourly data of the monitoring system was converted to the 24-h average data for comparison with the PDS data. The PPWD-PILS-IC monitoring system was presented in detail in Li et al. [31] and is described briefly below. A 16.7 L/min EPA PM10 inlet [54] and a PM2.5 VSCC inlet (very sharp cut cyclone) were used to remove particles larger than 2.5 μm in aerodynamic diameter. Sample air was drawn through the PPWD at 12.3 L/min to capture water-soluble precursor gases [36,37] first, before being introduced into the PILS to collected WSI ions [38]. The samples from the PPWD and the PILS were stored temporarily in syringes, and then injected in the IC in sequence for determining hourly mass concentrations of water-soluble gases and ions. The PDS sampling system was set up side-by-side with the PPWD-PILS-IC system, in which the flow rate was controlled at 5 L/min by a mass flow controller. The cyclone is covered by a rain cap and its inner wall is coated with silicone grease to eliminate the particle bounce effect.
To examine the ion balance measured by the monitoring system and the sampler, the anion and cation equivalents are calculated from the mass concentrations of WSI ions (i.e., [ion]) as:
Anion equivalent (A) = [F]/19 + [Cl]/35.5 + [NO3]/62 + [NO2]/46 + [SO42−]/48
Cation equivalent (C) = [Na+]/23 + [NH4+]/18 + [K+]/39.1 + [Mg2+]/12 + [Ca2+]/20
To evaluate the performance of the monitoring system as compared to the PDS, the normalized mean bias (NMB, %) and the normalized mean difference (NMD, µg/m3) for the PPWD-PILS-IC data are calculated as:
NMB ( % ) = i = 1 N C 1 C 2 C 2 N × 100 %
NMD ( μ g m 3 ) = i = 1 N C 1 C 2 N
where C1 (µg/m3) and C2 (µg/m3) are the mass concentrations of the PPWD-PILS-IC and the PDS for different WSI ions and gases, respectively. N is the total number of daily samples (N = 30).

2.3. ISORROPIA-II Thermodynamic Equilibrium Model

To predict the equilibrium partitioning of WSI gases and species in PM2.5, the ISORROPIA-II thermodynamic equilibrium model (NH4+–Na+–K+–Mg2+–Ca2+–Cl–NO3–SO42−–H2O system) was used [44]. The forward mode (or closed system) and stable state were applied, in which the total concentrations of nitrate (TN = [HNO3] + [NO3]), ammonium (TA = [NH3] + [NH4+]), other ion concentrations, temperature, and relative humidity were used as the input parameters. In this study, the TN input parameter was also revised as TN = [HNO3] + [NO3] + [HONO] + [NO2] to evaluate the effect of HONO on the nitrate (HNO3/NO3-) system and ammonium (NH3/NH4+) system. To evaluate the performance of the ISORROPIA-II thermodynamic equilibrium model, the NMB and the NMD are calculated using Equations (3) and (4), in which C1 and C2 are the mass concentrations of the ISORROPIA-II thermodynamic equilibrium model and the PPWD-PILS-IC for different WSI ions and gases, respectively with N = 720.

3. Results and Discussion

3.1. Laboratory Test Results of the 5 L/min PDS

Figure 3 shows the particle penetration curve of the cyclone (Figure 3a) and the particle loss curve of the PDS (Figure 3b). The cutpoint diameter (Dpa50) of the cyclone is 2.45 µm, which meets the U.S. EPA criteria for PM2.5 inlets (Dpa50 = 2.5 ± 0.2 µm) and is similar to that of the VSCC (Dpa50 = 2.52 ± 0.02 µm) [56]. The sharpness of the particle penetration curve is 1.27, which is less sharp than that of the VSCC (sharpness = 1.16) but still meets the requirements of 1.2 ± 0.1 regulated in China and European countries [57]. It indicates that the PDS cyclone is applicable as a PM2.5 classifier. In addition, the particle loss of the PDS casing is very small, which is less than 2% for particles smaller than 4.0 µm, whereas the particle loss of the two porous metal discs is from 1.9% to 67.5% with particles ranging from 1.2 to 5.0 µm, that is, the porous metal discs can cause a large particle loss for coarse particles while the loss for fine particles is smaller than 14%. Moreover, the total PM2.5 loss is 2.8, 2.2%, and 3.7% based on the three idealized fine, typical, and coarse ambient particle size distributions, respectively with the average particle loss of only 2.9 ± 0.8% [58]. It means that the PM2.5 loss of the porous metal disc is acceptable and would not affect the sampling accuracy of the PDS.

3.2. Field Comparison Test Results of PPWD-PILS-IC and PDS

Table 1 shows the average mass concentration and the mass percentage of each WSI species over the total mass concentration of the WSI species measured by the PDS. Among these WSI species, the mass concentrations of NH4+, NO3, and SO42− account for 25.52%, 20.41%, and 38.94%, respectively with the mass concentrations ranging from 0.61 to 5.87 μg/m3, from 0.95 to 6.64 μg/m3, and from 1.08 to 8.27 μg/m3, respectively. The other WSI species’ mass concentrations represent just less than 6.0% in PM2.5 with the average mass concentrations lower than 1.0 μg/m3. It implies that SO42− is the most dominant ion in PM2.5 followed by NH4+ and NO3, while Na+, K+, Ca2+, Mg2, and Cl are the minor contributors to PM2.5, at the NCTU site. The equivalent ratio of anions and cations (A/C ratio) of PM2.5 WSI species collected by the PDS is 0.92 ± 0.20, which falls within the range of acceptable ion balance of 0.85–1.15 [59] indicated that all the WSI ions in PM2.5 were measured accurately.
The field comparison results of the PPWD-PILS-IC with the PDS for some major WSI species (Na+, K+, NH4+, Cl, NO3, and SO42−) are shown in Figure 4. It is found that the linear regression slopes and coefficient (R2) of the determination range from 0.99 to 1.17 and from 0.88 to 0.98, respectively, which are better than those (slope 0.75–0.97 and R2 0.77–0.94) in Li et al. [31]. For K+, Na+, and NH4+, the improvement is even more obvious with higher R2 of 0.89, 0.92, and 0.93, respectively (R2 = 0.77, 0.77, and 0.89, respectively in the previous study) implying good stability of the monitoring system and the manual sampler. The slopes of all WSI species are close to 1.0 with the NMBs (NMDs) of the PPWD-PILS-IC less than ±10% (<±0.2 µg/m3) except for NH4+ (NMB = −13.95% and NMD = −0.36 µg/m3). This implies that the evaporation loss of NH4+ is similar to that found in previous studies [31,60].
The field comparison results of the PPWD-PILS-IC with the PDS for the precursor gases (NH3, SO2, HNO3, and HNO2) are shown in Figure 5. The average volume concentrations of NH3, SO2, HNO3, and HNO2 are 4.37 ± 2.40, 0.79 ± 0.38, 0.27 ± 0.18, and 0.73 ± 0.26 ppbv, respectively. The results show very good agreement between the PPWD-PILS-IC data and the PDS data with the slope and R2 varying from 0.87 to 0.95 and from 0.89 to 0.98, respectively and the NMBs (MNDs) less than ±10% (<0.1 ppbv). It is also found that the agreement between two methods for these precursor gases is improved as compared with that in the previous study. In this study, the PDS with a higher flow rate (5 L/min) and easy-to-clean discs are the key to the improvement. Now, the discs can be cleaned thoroughly with low blank values (<0.008 ppbv). In summary, the PPWD-PILS-IC system is validated with the current 5 L/min PDS for measuring hourly precursor gases and WSI species in PM2.5 with great confidence.

3.3. ISORROPIA-II Thermodynamic Equilibrium Model Predictions Versus PPWD-PILS-IC Observations

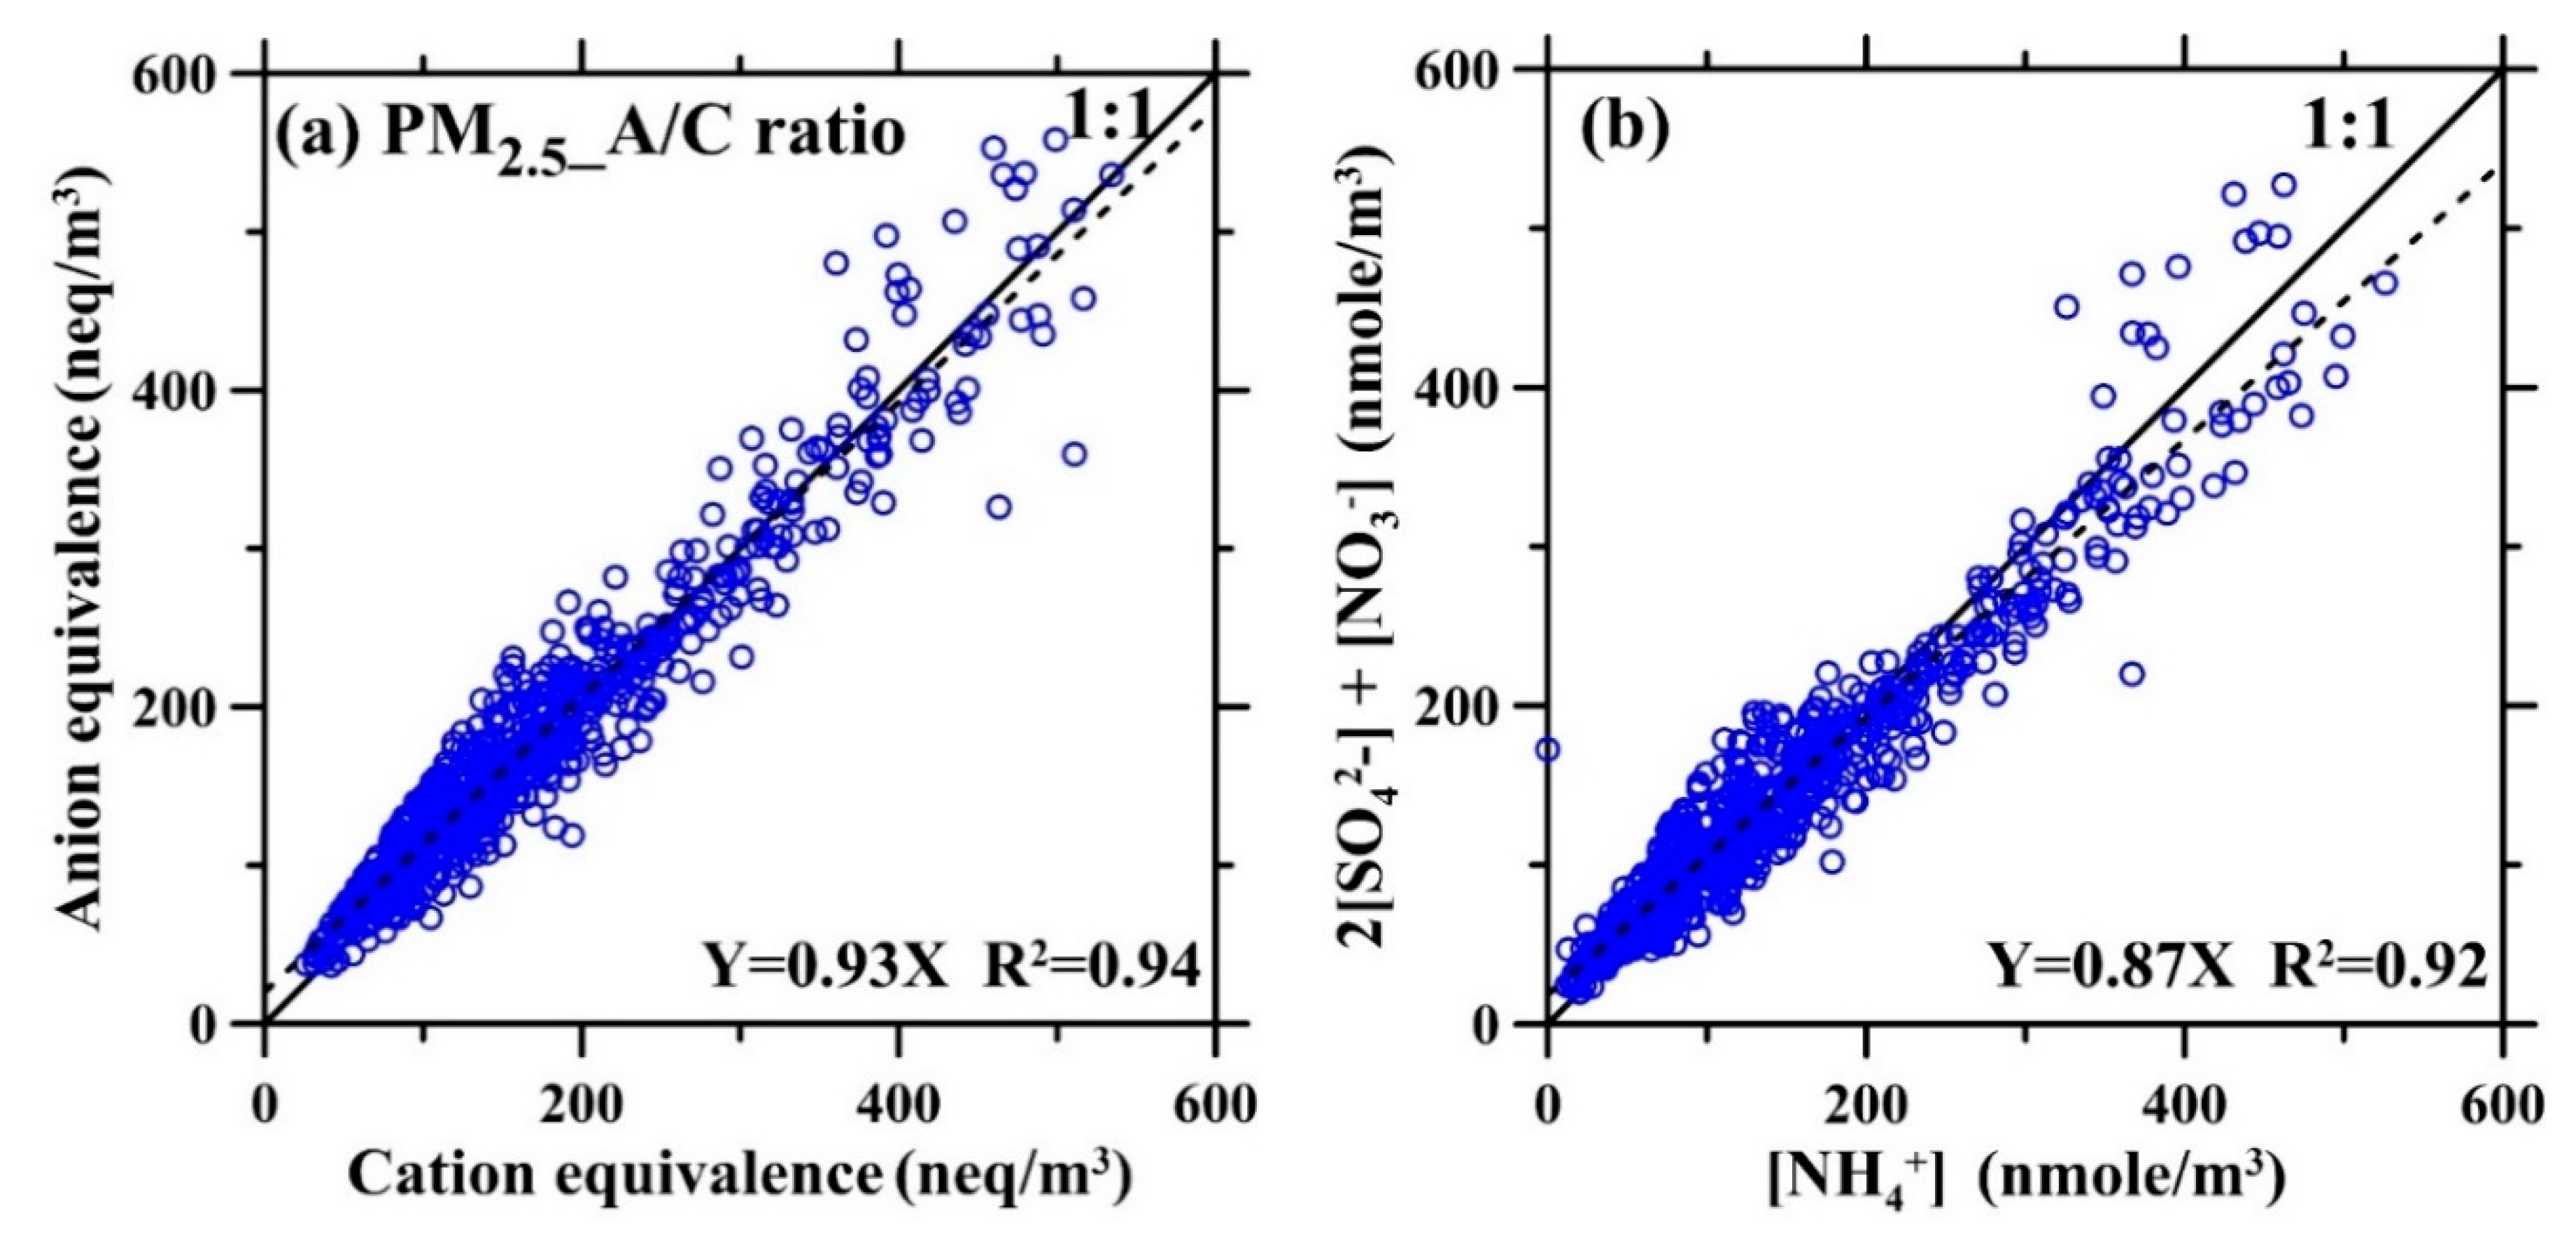
The hourly data of the PPWD-PILS-IC (N = 720) was used in the ISORROPIA-II thermodynamic equilibrium model to study the gas-particle partitioning in PM2.5. As shown in Figure 6, the observed hourly data have a good ion balance with an A/C ratio of 1.10 ± 0.18 and R2 of 0.94 and a strong relationship between 2[SO42−] + [NO3] and [NH4+] with the slope of 0.87 and R2 of 0.92. It indicates that the NH4NO3 and (NH4)2SO4 salts are dominant at this sampling site and the observed anion and cation data are balanced.
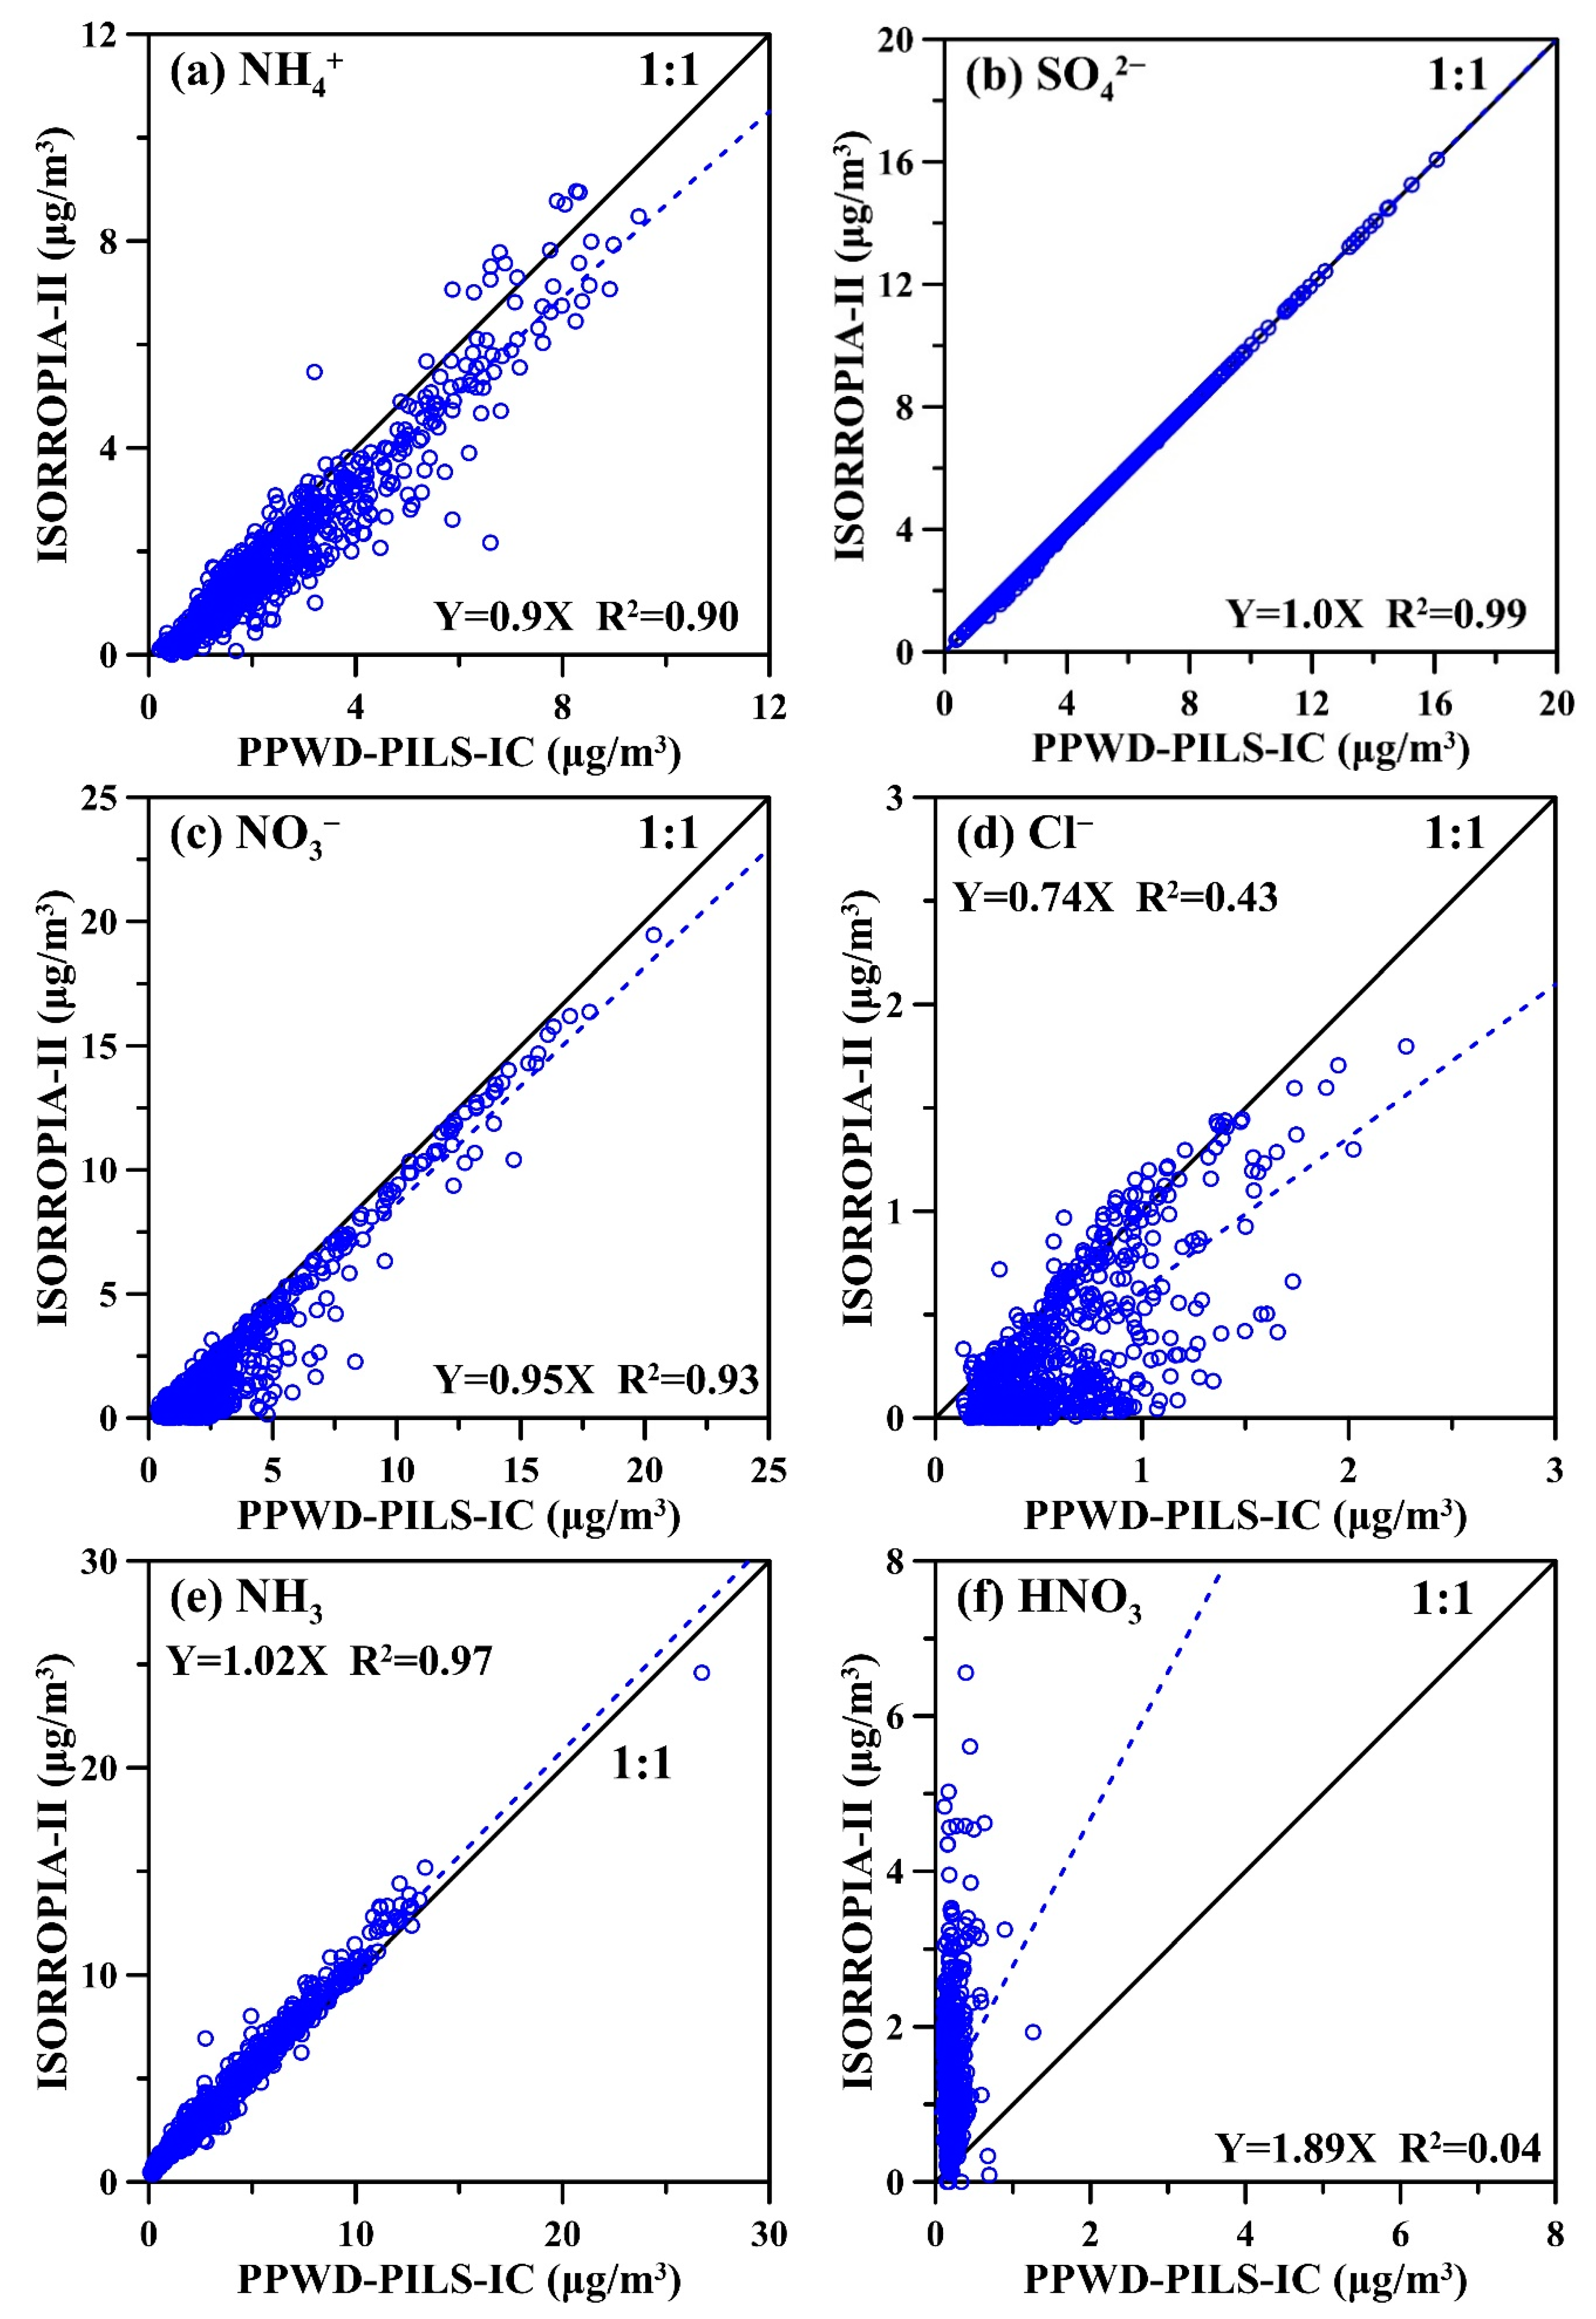
Figure 7 shows the linear correlation of the ISORROPIA-II results (i.e., predicted results) and the PPWD-PILS-IC data (i.e., observed data) for NH4+(p), SO42−(p), NO3(p), Cl(p), NH3(g), and HNO3(g) with the input parameters of T, RH, [SO42−](p), TN = [HNO3](g) + [NO3](p), TA = [NH3](g) + [NH4+](p), TC = [HCl](g) + [Cl](p), [Na+](p), [Mg2+](p), [K+](p), and [Ca2+](p). The results show that the predicted SO42− and NH3 correlate very well with the observed data with the slopes close to 1.0 and R2 higher than 0.97, whereas the predicted NH4+ and NO3 are also in good agreement with the observed data (R2 > 0.9). However, the ISORROPIA-II thermodynamic equilibrium model underestimates NH4+ and NO3 with the NMBs (NMDs) of −27.57% (−0.56 µg/m3) and −47.60% (−1.06 µg/m3), respectively. We observed that lower concentrations and more scattered data for NO3 resulted in a greater negative NMB value, which was also found in the previous study [61]. Assuming that 2[SO42−] fully balances with [NH4+] in the model, since NH3 is much preferred to react with H2SO4 to form SO42− salts and 2[SO42−] + [NO3] shows the good correlation with [NH4+], the slight under-prediction of NH4+ should be due to the under-prediction of NO3. In comparison, the predicted values of Cl are comparable with the observations (slope = 0.74) but data are scattered at low concentrations (648/720 data < 1 µg/m3) resulting in a moderate correlation with R2 of 0.49. The distributions of the WSI ions at this sampling site were tested for five days from July 2016 to January 2018 using the NCTU micro-orifice cascade impactor (NMCI) [62,63]. The results, shown in Figure S1 in SI, indicated that Cl was mainly formed in coarse particles (PM10–2.5) which were not measured in this study, resulting in the underestimation of the model for Cl and the overestimation for HCl (Figure S2 in SI). Since the sampling site is in the urban area and far from the coastal line (>12 km), Cl existing in coarse particles could be formed from the heterogeneous reactions of HCl with the magnesium- and calcium-containing coarse particles [64] from the road dust source, resulting in low observed HCl and over-predicted HCl concentrations.
The poorest correlation between the predictions and observations is of HNO3, as shown in Figure 7f, which is also found in many previous studies [50,51,61]. It is revealed that the predicted HNO3 is very sensitive to the error of NO3 prediction as predicted [HNO3] = TN − predicted [NO3] [44]. As compared with other species, the NO3 variability is found to be sensitive to the change of the T and RH, since the deliquescence RH of the NO3 salts varies with the T variation. Figure S3 shows that the NO3 concentration increases with the decreasing T and the increasing RH depending on the total concentration of the WSI species. In addition, unlike SO42− and NH4+ which are only dominant in fine particles (PM2.5) and fewer in coarse particles (Figure S2), NO3 is present in both coarse and fine particles, as shown in Figure S2, which contributes to the error prediction for NO3 and HNO3. A similar result was also found in the previous study [50]. This is because SO42− and NH4+ are mainly formed from the homogeneous reactions of precursor gases, whereas NO3 formation in fine particles is from the homogeneous reactions of HNO3, and NO3 formation in coarse particles is from the heterogeneous reactions of HNO3 with crustal coarse particles (i.e., Ca2+ and Mg2+) [12,61]. The coarse particle NO3 formation process results in low observed HNO3 and over-predicted HNO3 concentrations because the concentrations of Na+, Mg2+, Ca2+, and NO3 in the coarse mode are not included in the model. It can be seen that Mg2+, Ca2+, and Na+ are dominant in coarse particles since the source of coarse particles at this sampling site is road dust. However, the K+ distribution is complicated since it exists in both fine and coarse particles. The source of K+ in the fine and coarse modes could be associated with the burning activities from the nearby temple and the road dust from the heavy-traffic road, respectively [65].
As found in many previous studies, the main formation pathway of HONO is related closely to the formation of NO3 in fine particles [66], which is not included in the model resulting in the underestimation of the predicted NO3. In the humid and NH3-rich environment, HONO and HNO3 can be generated from the heterogeneous reaction on particle surfaces, and then HNO3 can be converted to NO3 in humid conditions (Equation (5)) [15,16] as:
2 NO 2 + H 2 O   s u r f a c e   HONO + NO 3   ( aq )   + H +
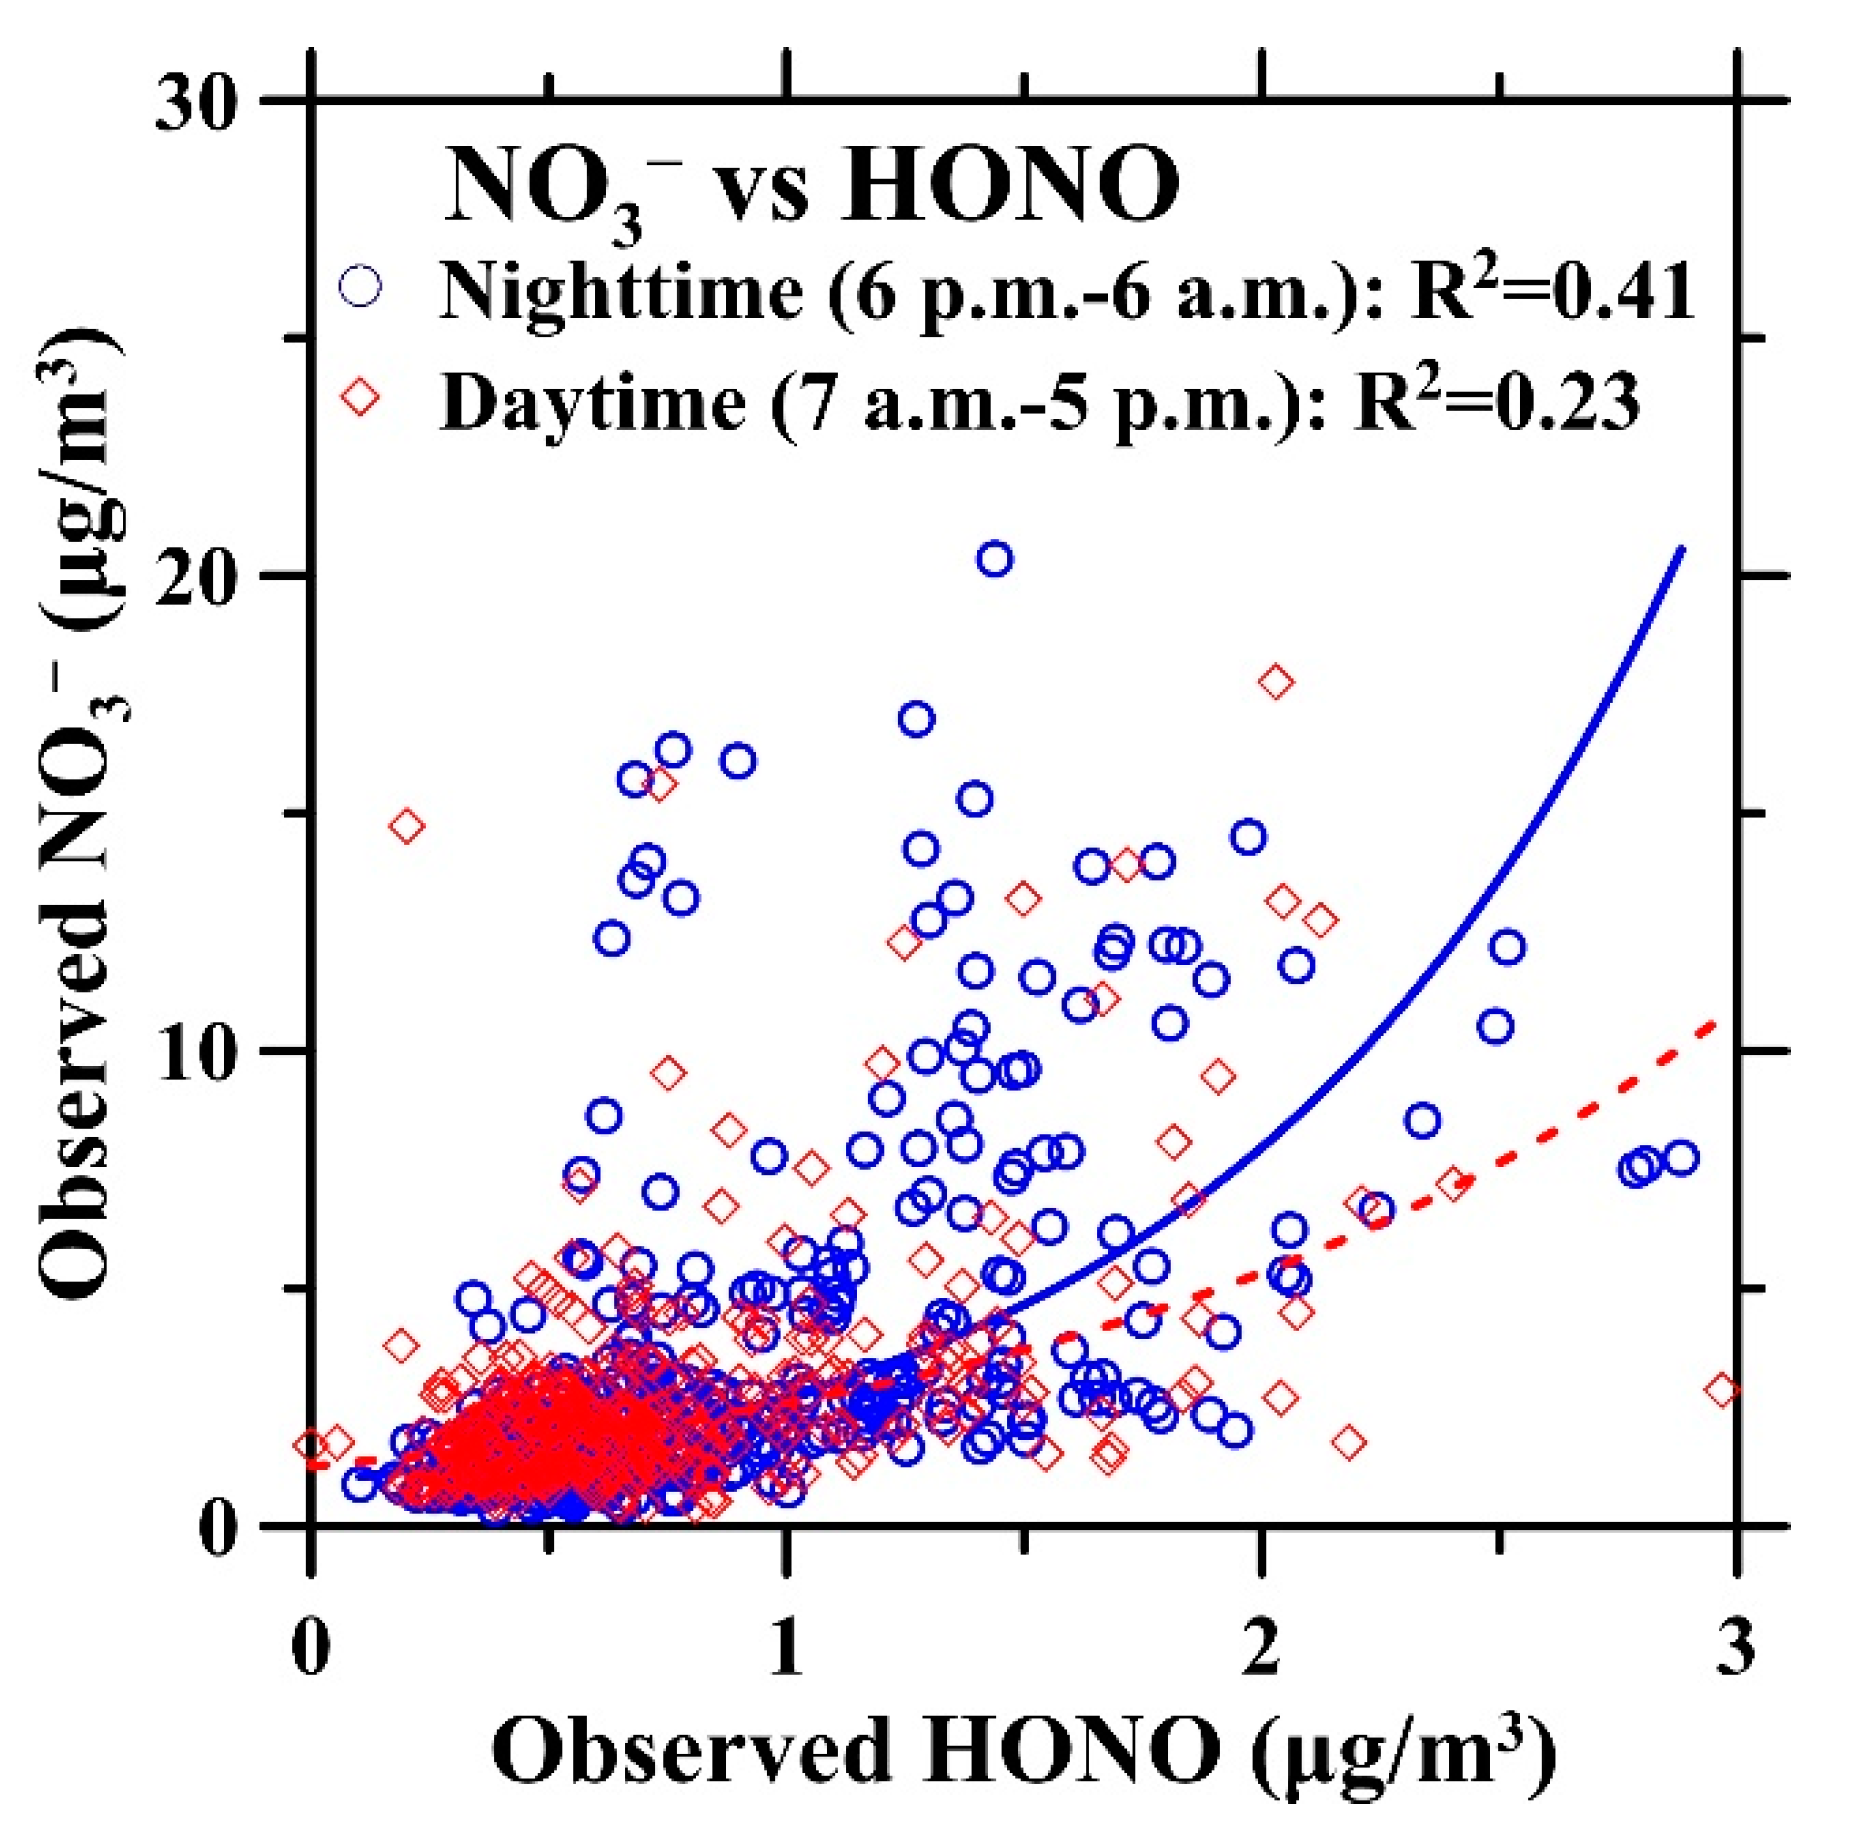
Therefore, the formation of NO3(p) is not only from the homogeneous reactions of HNO3 with NH3 and the uptake of HNO3 on the particle surfaces but also the formation of the HONO by reactions shown above. As shown in Figure 8, the observed NO3 shows a better correlation with the observed HONO during the nighttime (from 6 p.m. to 6 a.m.) with R2 of 0.41, while a poorer correlation is found during the daytime (from 7 a.m. to 5 p.m.) in the NH3-rich environment (3.90 ± 3.02 μg/m3). This result is because HONO is easily consumed in the daytime (up to 80% reduction) by photolysis (Equation (6)) [66,67] as:
HONO + hv→NO + OH
Additionally, the heterogeneous formation of HONO on the wet particle surfaces can also be associated with the formation of NH4+ with the presence of NH3 and SO2 as follows [68]:
SO2 + 2NO2 + 2NH3 + 2H2O→2NH4+(aq) + SO42−(aq) + 2HONO
The relationship of the predicted/observed HNO3, the observed HONO, the predicted/observed NO3, the T, and the RH, during 24 h, is shown in Figure 9 which presents the average data of each hour of HNO3, HONO, NO3, T, and RH obtained in this study and NO2, NO, and O3 obtained from the nearest Taiwan Environmental Protection Administration (TW EPA) station [69] during the sampling period. The predicted HNO3 is much higher than the observed HNO3, especially during the daytime when the RH is low and the T is high. In contrast, the predicted/observed NO3 is high during the nighttime and low during the daytime, which is similar to the HONO variation. It indicates that the predicted HNO3 determined in the model is just based on the thermodynamic equilibrium with NO3 at the given T and RH. It is observed that the HONO concentration is high during the nighttime due to the hydrolysis formation at high NO2 concentration and high RH and low during the daytime due to the photolysis reaction represented by the peak of O3. It is also seen that the concentration of HONO is quite close to that of the predicted HNO3 during the nighttime, suggesting that there could be the heterogeneous conversion of HNO3 on particle/ground surfaces under high NO concentrations as shown in Equation (8) below [66,70] as:
NO + HNO 3   s u r f a c e   HONO + NO 2
It is noted that HNO3 could also be converted to HONO during the daytime due to the photolysis of surface-adsorbed HNO3/NO3, as shown in Equation (9) below [18,19]. Therefore, the difference between the prediction and the observation for HNO3 could be due to these conversion mechanisms which are not included in the ISORROPIA-II thermodynamic equilibrium model.
HNO3 + hv→HONO + O(3P)
As shown in Figure 9, the diurnal trends of NO, NO3, and HONO are found to be related to the variation of the particle source. NO, NO3, and HONO show the peak concentrations at 6–8 a.m., the decrease in the early afternoon and the increase at 5–7 p.m., which is associated with the variation of the traffic flow rate (i.e., the total number of vehicle per hour) [55,71]. During the rush hours in the morning (6–9 a.m.), a high NO concentration is released from vehicles with a high flow rate leading to the formation of NO3 due to the homogeneous/heterogeneous reactions of HNO3 resulting in the peak of NO and NO3 at 6 a.m. and HONO is formed from the reactions shown in Equations (8) and (9) resulting in a peak concentration at 8 a.m. During the noontime with a low traffic flow rate and a low relative humidity condition, NO, NO3, and HONO are decreased. During the rush hours in the evening (5–8 p.m.) with a high traffic flow rate, NO is increased again leading to an increase in NO3 and HONO.
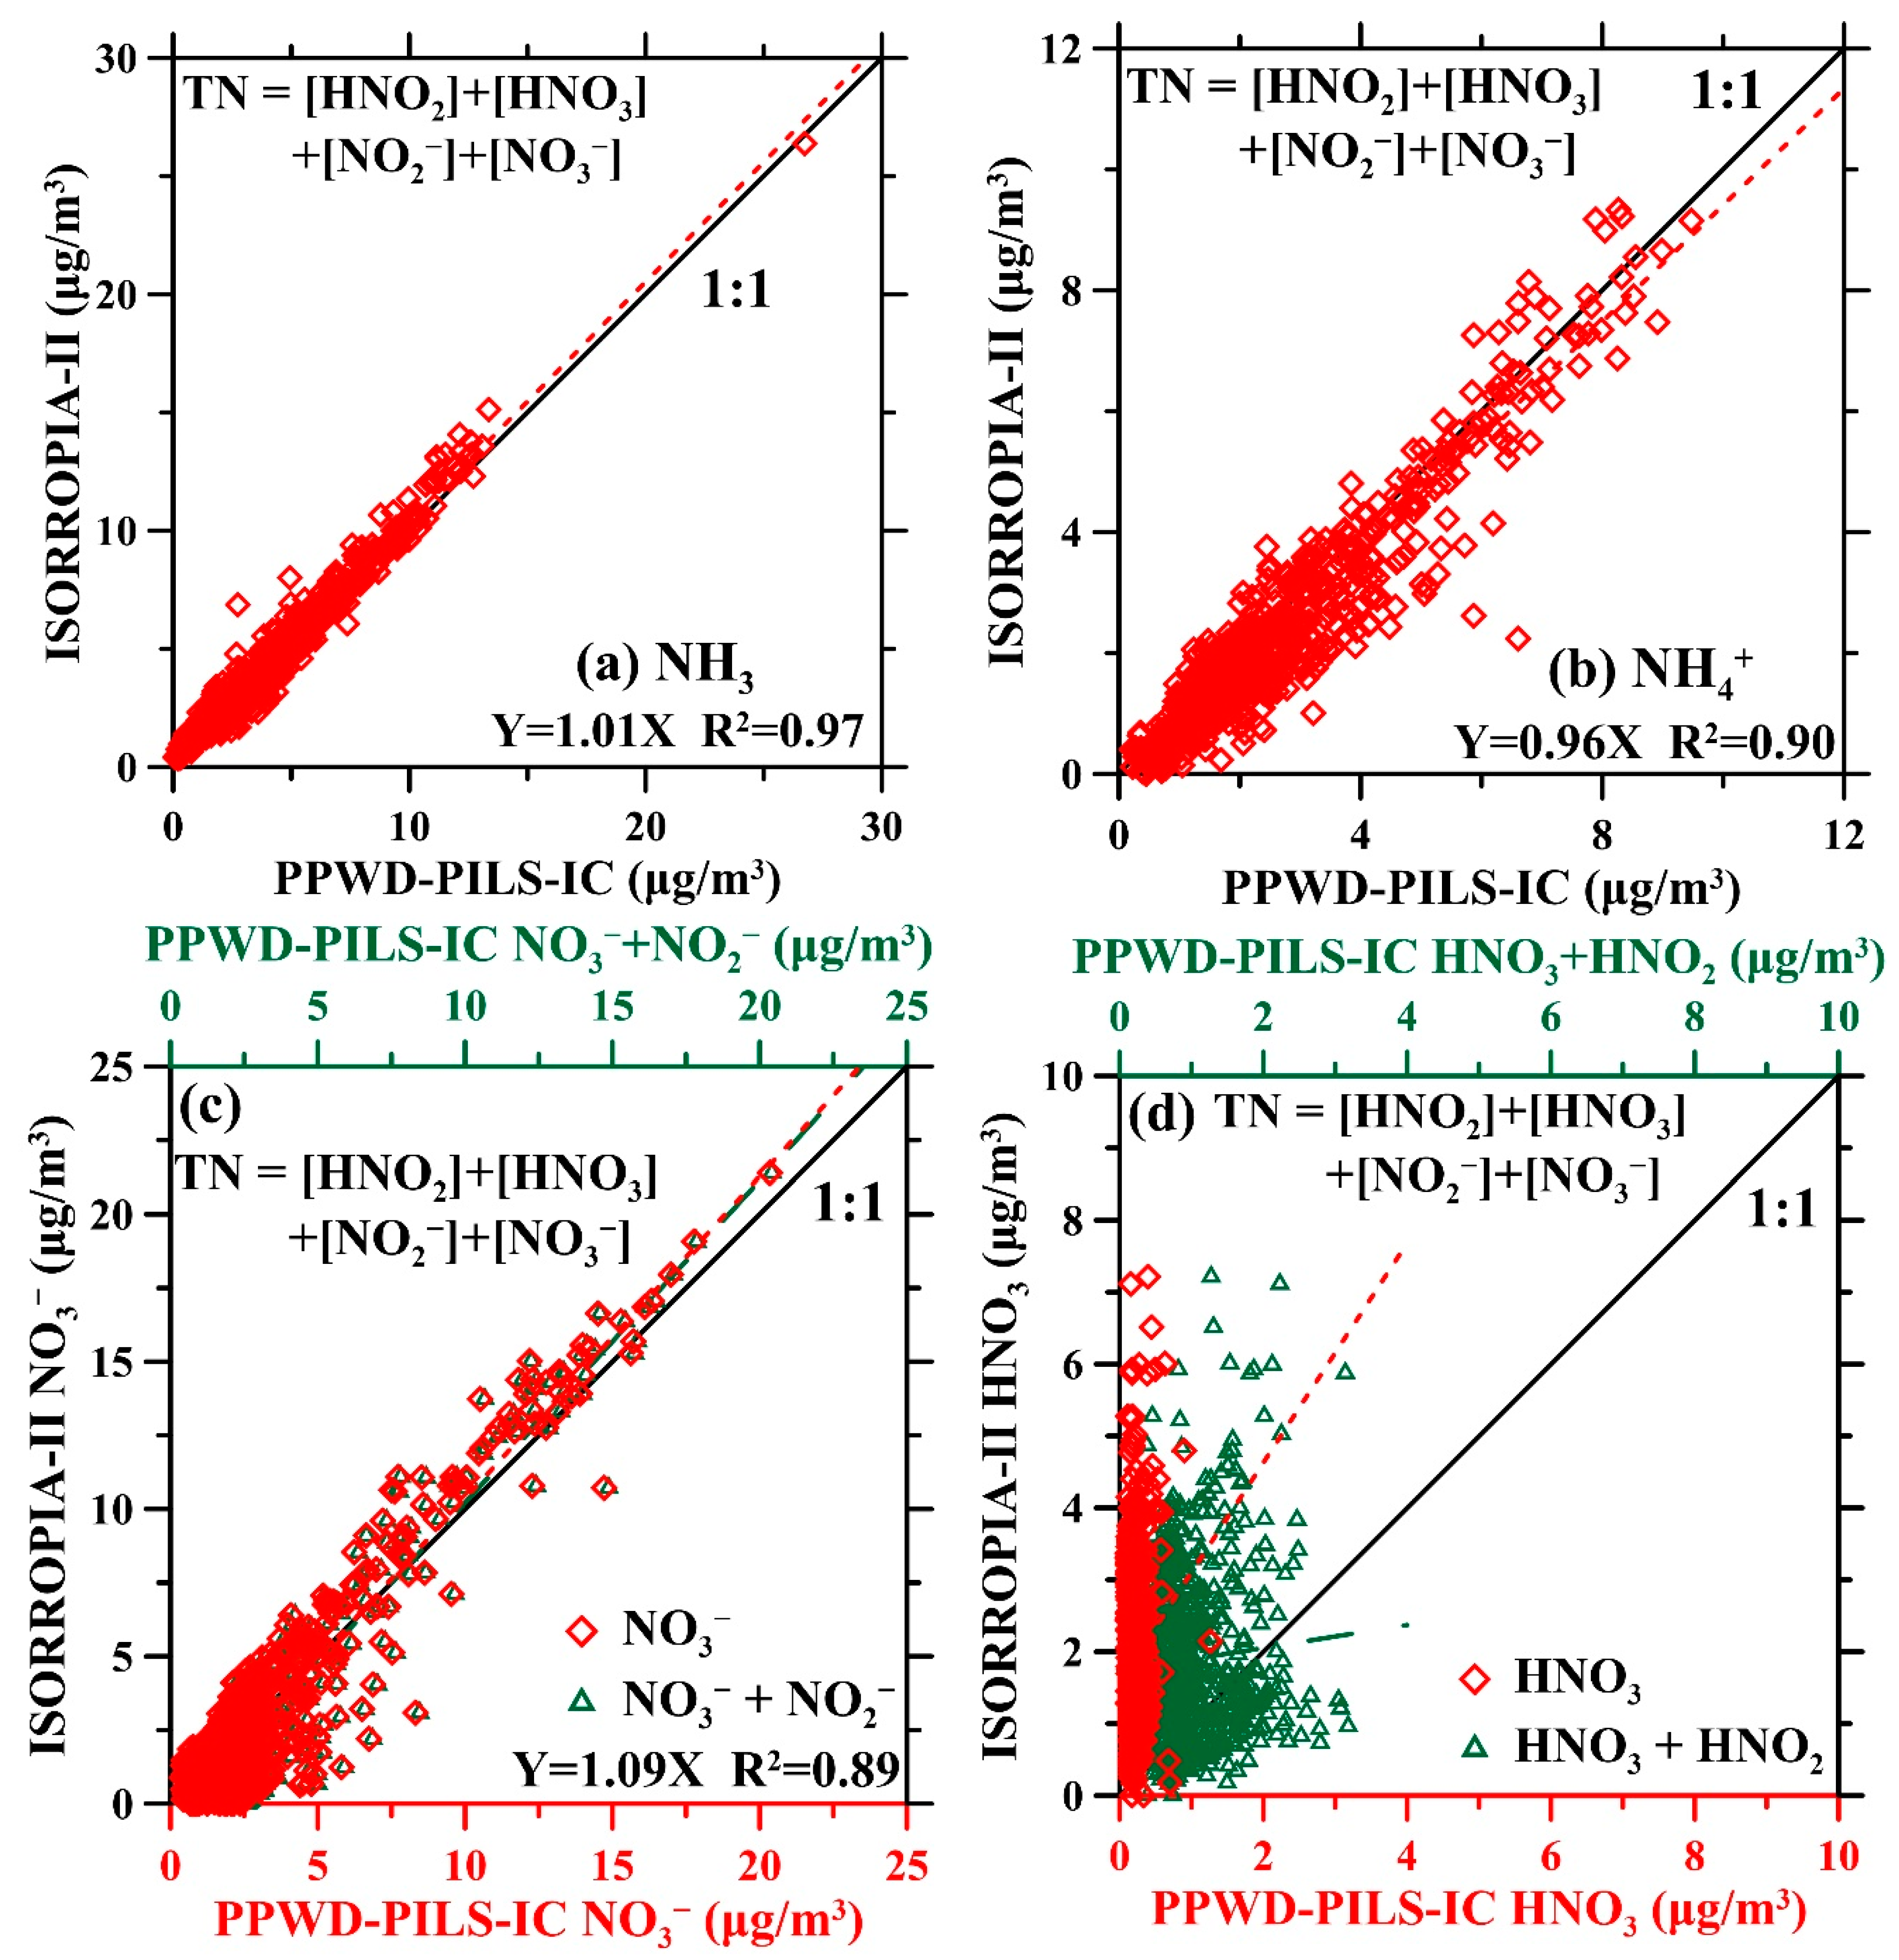
Figure 10 shows the comparison of the ISORROPIA-II predictions with the observation data for NH4+(p), NO3(p), NH3(g), and HNO3(g), when TN input parameter was changed to TN = [HNO2](g) + [HNO3](g) + [NO2](p) + [NO3](p). It is found that the predicted NH3 still correlates well with the observation, whereas correlation slopes for NH4+ and NO3 are increased to 0.96 and 1.09, respectively, indicating that the prediction by the ISORROPIA-II equilibrium model for NH4+ and NO3 is improved. In addition, the NMBs (NMDs) of the NH3, NH4+, and NO3 are decreased from 26.37% (+0.52 µg/m3) to 18.49% (+0.31 µg/m3), from −27.57% (−0.56 µg/m3) to −16.87% (−0.33 µg/m3), and from −47.60% (−1.06 µg/m3) to −14.94% (−0.27 µg/m3), respectively. It suggests that the hydrolysis formation of HONO contributes greatly to the formation of NH4NO3 salt and the equilibrium partitioning of the ammonium and nitrate aerosols. It can be seen that the sum of [NO3] and [NO2] is very close to [NO3] which implies that no salts are formed from NO2 ions. The underestimation and variabilities of the predicted NO3- at low concentrations (<5 µg/m3) were found, which led to the overestimation and variabilities of the predicted HNO3 (Figure 10d), similar to what was found in previous results (Figure 7f) with the NMB of +579% and the NMD of +1.09 µg/m3. The comparable correlations between the predicted [HNO3] and the sum of observed [HNO3] and [HONO] are found with the NMB and the NMD of +129% and +0.89 µg/m3, respectively. Since HNO3 is the terminal species in the ambient atmosphere, its measured concentrations could be very low (<1.0 μg/m3) because of the photolysis of surface-adsorbed HNO3/NO3 to form HONO [18,19] or heterogeneous conversion of HNO3 on particle/ground surfaces under high NO concentrations [66,70]. Therefore, the overestimation for the predicted HNO3 by the ISORROPIA-II thermodynamic equilibrium model as compared with the observed HNO3 and the better correlation between the predicted HNO3 with the sum of the observed HNO3 and HONO effectively explains the important conversion process of the HNO3 to HONO in the ambient atmosphere. In the future, a quantitative study of these dynamic processes is needed to improve the model prediction capabilities of the ISORROPIA-II thermodynamic equilibrium model.

4. Conclusions

This study conducted field comparison tests of the PPWD-PILS-IC monitoring system and the manual 5 L/min porous-metal denuder sampler for precursor gases (NH3, HNO3, HNO2, and SO2) and water-soluble inorganic ions (Mg2+, Ca2+, Na+, K+, NH4+, NO3, SO4, Cl, NO2, and F) in PM2.5 to evaluate the sampling performance of the PPWD-PILS-IC system. Among these WSI species, SO42−, NH4+, and NO3 are the major species accounting for 38.94%, 25.52%, and 20.41% of the total mass concentration of the WSI species, respectively. The 24-h average PPWD-PILS-IC data agreed well with the daily PDS data, with the slope and R2 ranging from 0.99 to 1.17 and from 0.88 to 0.98, respectively, and the NMBs were less than 10%, except for NH4+ (NMB = −13.95%), due to the evaporation loss effect of the PILS. Moreover, the correlation of the monitoring system data and the manual sampler data was improved, especially for precursor gases and K+, Na+, and NH4+ ions as compared with those in the previous study which used 2 L/min PDS as the reference. The 5 L/min PDS showed good performance with small particle loss in the porous metal discs and low background interferences. In addition, the ISORROPIA-II thermodynamic equilibrium model was used to study the partitioning of the WSI species in PM2.5 aerosols. The predicted results correlated well with the observed data of the PPWD-PILS-IC system for SO42− (slope = 1.0 and R2 = 0.99) and NH3 (slope = 1.02 and R2 = 0.97), when TN = [HNO3] + [NO3]. When TN was the sum of [HNO3], [NO3], [HONO], and [NO2], the correlation for NH4+ and NO3 was improved with less under-prediction (slope = 0.96 for NH4+ and 1.09 for NO3). This implied that the hydrolysis formation of HONO on particle surfaces contributed to the formation of NH4NO3 salt. The predicted HNO3 is comparable to the sum of the observed [HNO3] and [HONO] indicating that the HNO3 could be converted to HONO due to the heterogeneous conversion and the photolysis reaction.

Supplementary Materials

The following are available online at https://www.mdpi.com/2073-4433/11/8/820/s1, Figure S1: The size distribution of the water-soluble inorganic ions (NH4+, Na+, Ca2+, Mg2+, NO32−, SO42− and Cl) sampled by NCTU micro-orifice cascade impactor (NMCI) at National Chiao Tung University (NCTU) site from July 2016 to January 2018., Figure S2: Comparison of the prediction and the observation for HCl, Figure S3: Correlation of NO3 and water-soluble inorganic ions at different temperature (T) and relative humidity (RH) ranges.

Author Contributions

Conceptualization: D.Y.H.P.; Data curation: T.-C.L. and Y.-C.W.; Formal analysis: T.-C.L. and Y.-C.W.; Methodology: Y.-C.W. and C.-J.T.; Project administration: C.-J.T.; Resources: C.-J.T.; Supervision: C.-J.T.; Validation: C.-J.T.; Visualization: D.Y.H.P.; Writing—original draft: T.-C.L.; Writing—review and editing: T.-C.L. and C.-J.T. All authors have read and agreed to the published version of the manuscript.

Funding

The authors gratefully acknowledge financial support from the Taiwan Ministry of Science and Technology via the contracts MOST 109-2622-8-009-017-TE5 and 107-2221-E-009-004-MY3 and the Higher Education Sprout Project of the National Chiao Tung University and Ministry of Education (MOE), Taiwan.

Conflicts of Interest

The authors declare no conflict of interest.

References

  1. Miller, L.; Xu, X. Ambient PM2.5 human health effects—Findings in china and research directions. Atmosphere 2018, 9, 424. [Google Scholar] [CrossRef] [Green Version]
  2. Braggio, J.T.; Hall, E.S.; Weber, S.A.; Huff, A.K. Contribution of satellite-derived aerosol optical depth PM2.5 bayesian concentration surfaces to respiratory-cardiovascular chronic disease hospitalizations in Baltimore, Maryland. Atmosphere 2020, 11, 209. [Google Scholar] [CrossRef] [Green Version]
  3. Lin, H.; Tao, J.; Du, Y.; Liu, T.; Qian, Z.; Tian, L.; Di, Q.; Rutherford, S.; Guo, L.; Zeng, W.; et al. Particle size and chemical constituents of ambient particulate pollution associated with cardiovascular mortality in Guangzhou, China. Environ. Pollut. 2016, 208, 758–766. [Google Scholar] [CrossRef]
  4. Hwang, S.L.; Lin, Y.C.; Lin, C.M.; Hsiao, K.Y. Effects of fine particulate matter and its constituents on emergency room visits for asthma in southern Taiwan during 2008–2010: A population-based study. Environ. Sci. Pollut. Res. Int. 2017, 24, 15012–15021. [Google Scholar] [CrossRef]
  5. Guo, W.; Long, C.; Zhang, Z.; Zheng, N.; Xiao, H.; Xiao, H. Seasonal control of water-soluble inorganic ions in PM2.5 from nanning, a subtropical monsoon climate city in southwestern China. Atmosphere 2019, 11, 5. [Google Scholar] [CrossRef] [Green Version]
  6. Tsai, J.H.; Lin, J.H.; Yao, Y.C.; Chiang, H.L. Size distribution and water soluble ions of ambient particulate matter on episode and non-episode days in southern Taiwan. Aerosol. Air Qual. Res. 2012, 12, 263–274. [Google Scholar] [CrossRef] [Green Version]
  7. Cao, Z.; Zhou, X.; Ma, Y.; Wang, L.; Wu, R.; Chen, B.; Wang, W. The concentrations, formations, relationships and modeling of sulfate, nitrate and ammonium (SNA) aerosols over China. Aerosol. Air Qual. Res. 2017, 17, 84–97. [Google Scholar] [CrossRef]
  8. Ramli, N.A.; Md Yusof, N.F.F.; Shith, S.; Suroto, A. Chemical and biological compositions associated with ambient respirable particulate matter: A review. Water Air Soil Pollut. 2020, 231. [Google Scholar] [CrossRef]
  9. Chen, Y.; Xie, S.D.; Luo, B.; Zhai, C. Characteristics and sources of water-soluble ions in PM2.5 in the sichuan basin, China. Atmosphere 2019, 10, 78. [Google Scholar] [CrossRef] [Green Version]
  10. Ying, Q.; Kleeman, M.J. Source contributions to the regional distribution of secondary particulate matter in California. Atmos. Environ. 2006, 40, 736–752. [Google Scholar] [CrossRef]
  11. Seinfeld, J.H.; Pandis, S.N. Atmospheric Chemistry and Physics: From Air Pollution to Climate Change; John Wiley & Sons: Hoboken, NJ, USA, 2016. [Google Scholar]
  12. Tsai, J.H.; Tsai, S.M.; Wang, W.C.; Chiang, H.L. Water-soluble ionic species of coarse and fine particulate matter and gas precursor characteristics at urban and rural sites of central Taiwan. Environ. Sci. Pollut. Res. Int. 2016, 23, 16722–16737. [Google Scholar] [CrossRef] [PubMed]
  13. Lim, Y.; Seo, J.; Kim, J.Y.; Kim, Y.P.; Jin, H.C. Local formation of sulfates contributes to the urban haze with regional transport origin. Environ. Res. Lett. 2020. [Google Scholar] [CrossRef]
  14. Voutsa, D.; Samara, C.; Manoli, E.; Lazarou, D.; Tzoumaka, P. Ionic composition of PM2.5 at urban sites of northern Greece: Secondary inorganic aerosol formation. Environ. Sci. Pollut. Res. Int. 2014, 21, 4995–5006. [Google Scholar] [CrossRef] [PubMed]
  15. Cui, L.; Li, R.; Zhang, Y.; Meng, Y.; Fu, H.; Chen, J. An observational study of nitrous acid (HONO) in Shanghai, China: The aerosol impact on HONO formation during the haze episodes. Sci. Total Environ. 2018, 630, 1057–1070. [Google Scholar] [CrossRef]
  16. Xu, W.; Kuang, Y.; Zhao, C.; Tao, J.; Zhao, G.; Bian, Y.; Yang, W.; Yu, Y.; Shen, C.; Liang, L.; et al. NH3-promoted hydrolysis of NO2 induces explosive growth in HONO. Atmos. Chem. Phys. 2019, 19, 10557–10570. [Google Scholar] [CrossRef] [Green Version]
  17. Qu, Y.; Chen, Y.; Liu, X.; Zhang, J.; Guo, Y.; An, J. Seasonal effects of additional HONO sources and the heterogeneous reactions of N2O5 on nitrate in the North China Plain. Sci. Total Environ. 2019, 690, 97–107. [Google Scholar] [CrossRef]
  18. Ye, C.; Zhang, N.; Gao, H.; Zhou, X. Photolysis of particulate nitrate as a source of HONO and NOx. Environ. Sci. Technol. 2017, 51, 6849–6856. [Google Scholar] [CrossRef]
  19. Tsai, C.; Spolaor, M.; Colosimo, S.F.; Pikelnaya, O.; Cheung, R.; Williams, E.; Gilman, J.B.; Lerner, B.M.; Zamora, R.J.; Warneke, C.; et al. Nitrous acid formation in a snow-free wintertime polluted rural area. Atmos. Chem. Phys. 2018, 18, 1977–1996. [Google Scholar] [CrossRef] [Green Version]
  20. Wei, L.; Duan, J.; Tan, J.; Ma, Y.; He, K.; Wang, S.; Huang, X.; Zhang, Y. Gas-to-particle conversion of atmospheric ammonia and sampling artifacts of ammonium in spring of Beijing. Sci. China Earth Sci. 2014, 58, 345–355. [Google Scholar] [CrossRef]
  21. Le, T.C.; Shukla, K.K.; Chen, Y.T.; Chang, S.C.; Lin, T.Y.; Li, Z.; Pui, D.Y.H.; Tsai, C.J. On the concentration differences between PM2.5 FEM monitors and FRM samplers. Atmos. Environ. 2020, 222, 117138. [Google Scholar] [CrossRef]
  22. Liu, C.N.; Lin, S.F.; Tsai, C.J.; Wu, Y.C.; Chen, C.F. Theoretical model for the evaporation loss of PM2.5 during filter sampling. Atmos. Environ. 2015, 109, 79–86. [Google Scholar] [CrossRef]
  23. Liu, C.N.; Awasthi, A.; Hung, Y.H.; Gugamsetty, B.; Tsai, C.J.; Wu, Y.C.; Chen, C.F. Differences in 24-h average PM2.5 concentrations between the beta attenuation monitor (BAM) and the dichotomous sampler (Dichot). Atmos. Environ. 2013, 75, 341–347. [Google Scholar] [CrossRef]
  24. Liu, C.N.; Lin, S.F.; Awasthi, A.; Tsai, C.J.; Wu, Y.C.; Chen, C.F. Sampling and conditioning artifacts of PM2.5 in filter-based samplers. Atmos. Environ. 2014, 85, 48–53. [Google Scholar] [CrossRef]
  25. Tsai, C.J.; Huang, C.H.; Wang, S.H.; Shih, T.S. Design and testing of a personal porous-metal denuder. Aerosol. Sci. Technol. 2001, 35, 611–616. [Google Scholar] [CrossRef]
  26. Tsai, C.J.; Huang, C.H.; Lin, Y.C.; Shih, T.S.; Shih, B.H. Field test of a porous-metal denuder sampler. Aerosol. Sci. Technol. 2003, 37, 967–974. [Google Scholar] [CrossRef] [Green Version]
  27. Trebs, I.; Meixner, F.; Slanina, J.; Otjes, R.; Jongejan, P.; Andreae, M. Real-time measurements of ammonia, acidic trace gases and water-soluble inorganic aerosol species at a rural site in the Amazon Basin. Atmos. Chem. Phys. 2004, 4, 967–987. [Google Scholar] [CrossRef] [Green Version]
  28. ten Brink, H.; Otjes, R.; Jongejan, P.; Slanina, S. An instrument for semi-continuous monitoring of the size-distribution of nitrate, ammonium, sulphate and chloride in aerosol. Atmos. Environ. 2007, 41, 2768–2779. [Google Scholar] [CrossRef] [Green Version]
  29. Godri, K.; Evans, G.; Slowik, J.; Knox, A.; Abbatt, J.; Brook, J.; Dann, T.; Dabek-Zlotorzynska, E. Evaluation and application of a semi-continuous chemical characterization system for water soluble inorganic PM2.5 and associated precursor gases. Atmos. Meas. Tech. 2009, 2, 65–80. [Google Scholar] [CrossRef] [Green Version]
  30. Nie, W.; Wang, T.; Gao, X.; Pathak, R.K.; Wang, X.; Gao, R.; Zhang, Q.; Yang, L.; Wang, W. Comparison among filter-based, impactor-based and continuous techniques for measuring atmospheric fine sulfate and nitrate. Atmos. Environ. 2010, 44, 4396–4403. [Google Scholar] [CrossRef]
  31. Li, Z.; Liu, Y.; Lin, Y.; Gautam, S.; Kuo, H.C.; Tsai, C.J.; Yeh, H.; Huang, W.; Li, S.W.; Wu, G.J. Development of an automated system (PPWD/PILS) for studying PM2.5 water-soluble ions and precursor gases: Field measurements in two cities, Taiwan. Aerosol. Air Qual. Res. 2017, 17, 426–443. [Google Scholar] [CrossRef] [Green Version]
  32. Rumsey, I.; Cowen, K.; Walker, J.; Kelly, T.; Hanft, E.; Mishoe, K.; Rogers, C.; Proost, R.; Beachley, G.; Lear, G. An assessment of the performance of the monitor for AeRosols and GAses in ambient air (MARGA): A semi-continuous method for soluble compounds. Atmos. Chem. Phys. 2014, 14, 5639–5658. [Google Scholar] [CrossRef] [Green Version]
  33. Yao, X.; Shairsingh, K.; Lam, P.H.; Evans, G.J. Underestimation of sulfate concentration in PM 2.5 using a semi-continuous particle instrument based on ion chromatography. J. Environ. Monit. 2009, 11, 1292–1297. [Google Scholar] [CrossRef] [PubMed]
  34. Wu, W.S.; Wang, T. On the performance of a semi-continuous PM2.5 sulphate and nitrate instrument under high loadings of particulate and sulphur dioxide. Atmos. Environ. 2007, 41, 5442–5451. [Google Scholar] [CrossRef]
  35. Markovic, M.Z.; VandenBoer, T.C.; Murphy, J.G. Characterization and optimization of an online system for the simultaneous measurement of atmospheric water-soluble constituents in the gas and particle phases. J. Environ. Monit. 2012, 14, 1872–1884. [Google Scholar] [CrossRef]
  36. Ku, Y.P.; Yang, C.; Lin, G.Y.; Tsai, C.J. An online parallel-plate wet denuder system for monitoring acetic acid gas. Aerosol. Air Qual. Res. 2010, 10, 479–488. [Google Scholar] [CrossRef]
  37. Tsai, C.J.; Lin, G.Y.; Chen, S.C. A parallel plate wet denuder for acidic gas measurement. AIChE 2008, 54, 2198–2205. [Google Scholar] [CrossRef]
  38. Weber, R.J.; Orsini, D.; Daun, Y.; Lee, Y.N.; Klotz, P.J.; Brechtel, F. A particle-into-liquid collector for rapid measurement of aerosol bulk chemical composition. Aerosol. Sci. Technol. 2001, 35, 718–727. [Google Scholar] [CrossRef] [Green Version]
  39. Weber, R.; Orsini, D.; Duan, Y.; Baumann, K.; Kiang, C.; Chameides, W.; Lee, Y.; Brechtel, F.; Klotz, P.; Jongejan, P. Intercomparison of near real time monitors of PM2.5 nitrate and sulfate at the US environmental protection agency atlanta supersite. J. Geophys. Res. 2003, 108, 1984–2012. [Google Scholar] [CrossRef]
  40. Clegg, S.L.; Pitzer, K.S. Thermodynamics of multicomponent, miscible, ionic solutions: Generalized equations for symmetrical electrolytes. J. Phys. Chem. 1992, 96, 3513–3520. [Google Scholar] [CrossRef]
  41. Kim, Y.P.; Seinfeld, J.H.; Saxena, P. Atmospheric gas-aerosol equilibrium I. Thermodynamic model. Aerosol. Sci. Technol. 1993, 19, 157–181. [Google Scholar] [CrossRef]
  42. Jacobson, M.Z.; Tabazadeh, A.; Turco, R.P. Simulating equilibrium within aerosols and nonequilibrium between gases and aerosols. J. Geophys. Res. 1996, 101, 9079–9091. [Google Scholar] [CrossRef]
  43. Nenes, A.; Pandis, S.N.; Pilinis, C. ISORROPIA: A new thermodynamic equilibrium model for multiphase multicomponent inorganic aerosols. Aquat. Geochem. 1998, 4, 123–152. [Google Scholar] [CrossRef]
  44. Fountoukis, C.; Nenes, A. ISORROPIA II: A computationally efficient thermodynamic equilibrium model for K+-Ca2+-Mg2+-NH4+-Na+-SO42−-NO3-Cl-H2O aerosols. Atmos. Chem. Phys. 2007, 7, 4639–4659. [Google Scholar] [CrossRef] [Green Version]
  45. Ansari, A.S.; Pandis, S.N. An analysis of four models predicting the partitioning of semivolatile inorganic aerosol components. Aerosol. Sci. Technol. 1999, 31, 129–153. [Google Scholar] [CrossRef]
  46. Metzger, S.; Dentener, F.; Pandis, S.; Lelieveld, J. Gas/aerosol partitioning: 1. A computationally efficient model. J. Geophys. Res. 2002, 107, 1611–1624. [Google Scholar] [CrossRef] [Green Version]
  47. Makar, P.; Bouchet, V.; Nenes, A. Inorganic chemistry calculations using HETV—A vectorized solver for the SO42−–NO3–NH4+ system based on the ISORROPIA algorithms. Atmos. Environ. 2003, 37, 2279–2294. [Google Scholar] [CrossRef]
  48. Zaveri, R.A.; Easter, R.C.; Peters, L.K. A computationally efficient multicomponent equilibrium solver for aerosols (MESA). J. Geophys. Res. 2005, 110, D24203. [Google Scholar] [CrossRef]
  49. Amundson, N.; Caboussat, A.; He, J.; Martynenko, A.; Savarin, V.; Seinfeld, J.; Yoo, K. A new inorganic atmospheric aerosol phase equilibrium model (UHAERO). Atmos. Chem. Phys. 2006, 6, 975–992. [Google Scholar] [CrossRef] [Green Version]
  50. Sudheer, A.; Rengarajan, R. Time-resolved inorganic chemical composition of fine aerosol and associated precursor gases over an urban environment in western India: Gas-aerosol equilibrium characteristics. Atmos. Environ. 2015, 109, 217–227. [Google Scholar] [CrossRef]
  51. Fountoukis, C.; Nenes, A.; Sullivan, A.; Weber, R.; Reken, T.V.; Fischer, M.; Matias, E.; Moya, M.; Farmer, D.; Cohen, R.C. Thermodynamic characterization of Mexico city aerosol during MILAGRO 2006. Atmos. Chem. Phys. 2009, 9, 2141–2156. [Google Scholar] [CrossRef] [Green Version]
  52. Guo, H.; Liu, J.; Froyd, K.D.; Roberts, J.M.; Veres, P.R.; Hayes, P.L.; Jimenez, J.L.; Nenes, A.; Weber, R.J. Fine particle pH and gas–particle phase partitioning of inorganic species in Pasadena, California, during the 2010 CalNex campaign. Atmos. Chem. Phys. 2017, 17, 5703–5719. [Google Scholar] [CrossRef] [Green Version]
  53. Le, T.C.; Tsai, C.J. Novel non-bouncing PM2.5 impactor modified from well impactor ninety-six. Aerosol. Sci. Technol. 2017, 51, 1287–1295. [Google Scholar] [CrossRef] [Green Version]
  54. Le, T.C.; Shukla, K.K.; Sung, J.C.; Li, Z.; Yeh, H.; Huang, W.; Tsai, C.J. Sampling efficiency of low-volume PM10 inlets with different impaction substrates. Aerosol. Sci. Technol. 2019, 53, 295–308. [Google Scholar] [CrossRef]
  55. Chen, S.C.; Tsai, C.J.; Huang, C.Y.; Chen, H.D.; Chen, S.J.; Lin, C.C.; Tsai, J.H.; Chou, C.C.K.; Lung, S.C.C.; Huang, W.R. Chemical mass closure and chemical characteristics of ambient ultrafine particles and other PM fractions. Aerosol. Sci. Technol. 2010, 44, 713–723. [Google Scholar] [CrossRef]
  56. Le, T.C.; Fu, C.X.; Sung, C.J.; Li, Z.Y.; Pui, D.Y.H.; Tsai, C.J. The performance of the PM2.5 VSCC and oil-Wetted M-WINS in long-Term field sampling studies. Atmos. Environ. 2020. [Google Scholar] [CrossRef]
  57. Le, T.C.; Tsai, C.J. Inertial impaction technique for the classification of particulate matters and nanoparticles: A review. KONA Powder Part J. 2020. [Google Scholar] [CrossRef] [Green Version]
  58. U.S. EPA. Quality Assurance Guidance Document 2.12, Monitoring PM2.5 in Ambient Air Using Designated Reference or Class. I. Equivalent Methods; Environmental Protection Agency: Research Triangle Park (RTP), NC, USA, 1998.
  59. Sanusi, A.; Wortham, H.; Millet, M.; Mirabel, P. Chemical composition of rainwater in eastern France. Atmos. Environ. 1996, 30, 59–71. [Google Scholar] [CrossRef]
  60. Sorooshian, A.; Brechtel, F.J.; Ma, Y.; Weber, R.J.; Corless, A.; Flagan, R.C.; Seinfeld, J.H. Modeling and characterization of a particle-into-liquid sampler (PILS). Aerosol. Sci. Technol. 2006, 40, 396–409. [Google Scholar] [CrossRef] [Green Version]
  61. Huy, D.H.; Thanh, L.T.; Hien, T.T.; Takenaka, N. Comparative study on water-soluble inorganic ions in PM2.5 from two distinct climate regions and air quality. J. Environ. Sci. 2020, 88, 349–360. [Google Scholar] [CrossRef]
  62. Liu, C.N.; Awasthi, A.; Hung, Y.H.; Tsai, C.J. Collection efficiency and interstage loss of nanoparticles in micro-orifice-based cascade impactors. Atmos. Environ. 2013, 69, 325–333. [Google Scholar] [CrossRef]
  63. Chien, C.L.; Tien, C.Y.; Liu, C.N.; Ye, H.; Huang, W.; Tsai, C.J. Design and testing of the NCTU Micro-Orifice Cascade Impactor (NMCI) for the measurement of nanoparticle size distributions. Aerosol. Sci. Technol. 2015, 49, 1009–1018. [Google Scholar] [CrossRef] [Green Version]
  64. Tobo, Y.; Zhang, D.; Nakata, N.; Yamada, M.; Ogata, H.; Hara, K.; Iwasaka, Y. Hygroscopic mineral dust particles as influenced by chlorine chemistry in the marine atmosphere. Geophys. Res. Lett. 2009, 36. [Google Scholar] [CrossRef] [Green Version]
  65. Masri, S.; Kang, C.M.; Koutrakis, P. Composition and sources of fine and coarse particles collected during 2002–2010 in Boston, MA. J. Air Waste Manag. Assoc. 2015, 65, 287–297. [Google Scholar] [CrossRef] [PubMed] [Green Version]
  66. Gall, E.T.; Griffin, R.J.; Steiner, A.L.; Dibb, J.; Scheuer, E.; Gong, L.; Rutter, A.P.; Cevik, B.K.; Kim, S.; Lefer, B.; et al. Evaluation of nitrous acid sources and sinks in urban outflow. Atmos. Environ. 2016, 127, 272–282. [Google Scholar] [CrossRef] [Green Version]
  67. Gil, J.; Kim, J.; Lee, M.; Lee, G.; Lee, D.; Jung, J.; An, J.; Hong, J.; Cho, S.; Lee, J.; et al. The role of HONO in O3 formation and insight into its formation mechanism during the KORUS-AQ Campaign. Atmos. Chem. Phys. 2020. [Google Scholar] [CrossRef] [Green Version]
  68. Ge, S.; Wang, G.; Zhang, S.; Li, D.; Xie, Y.; Wu, C.; Yuan, Q.; Chen, J.; Zhang, H. Abundant NH3 in China enhances atmospheric HONO production by promoting the heterogeneous reaction of SO2 with NO2. Environ. Sci. Technol. 2019, 53, 14339–14347. [Google Scholar] [CrossRef]
  69. TWEPA. Taiwan Air Quality Index. Available online: https://airtw.epa.gov.tw/ENG/default.aspx (accessed on 30 June 2020).
  70. Kleffmann, J.; Wiesen, P. Heterogeneous conversion of NO2 and NO on HNO3 treated soot surfaces: Atmospheric implications. Atmos. Chem. Phys. 2005, 5, 77–83. [Google Scholar] [CrossRef] [Green Version]
  71. Chen, S.C.; Tsai, C.J.; Chou, C.C.K.; Roam, G.D.; Cheng, S.S.; Wang, Y.N. Ultrafine particles at three different sampling locations in Taiwan. Atmos. Environ. 2010, 44, 533–540. [Google Scholar] [CrossRef]
Figure 1. Schematic diagram of the 5 L/min porous-metal denuder sampler (PDS).
Atmosphere 11 00820 g001
Figure 2. Experimental setup of the penetration curve and particle loss test of the 5 L/min PDS.
Atmosphere 11 00820 g002
Figure 3. (a) Penetration curve and (b) particle loss of the 5 L/min PDS.
Atmosphere 11 00820 g003
Figure 4. Correlation plot of the parallel plate wet denuder and particle into liquid sampler coupled with ion chromatography (PPWD-PILS-IC) and the PDS for the water-soluble inorganic species in PM2.5. (a) Na+; (b) K+; (c) NH4+; (d) Cl; (e) NO3; and (f) SO42−.
Atmosphere 11 00820 g004
Figure 5. Correlation plot of the PPWD-PILS-IC and the PDS for the precursor gases. (a) NH3; (b) SO2; (c) HNO3; and (d) HONO.
Atmosphere 11 00820 g005
Figure 6. Plot of (a) anion equivalent versus anion equivalent and (b) 2[SO42−] + [NO3] versus [NH4+] measured by PPWD-PILS-IC (N = 720).
Atmosphere 11 00820 g006
Figure 7. Correlation plot of the predicted results of ISORROPIA-II thermodynamic equilibrium model and the observed data of the PPWD-PILS-IC for (a) NH4+; (b) SO42−; (c) NO3; (d) Cl; (e) NH3; and (f) HNO3 when TN = [HNO3] + [NO3].
Atmosphere 11 00820 g007
Figure 8. Correlation plot of HONO and NO3.
Atmosphere 11 00820 g008
Figure 9. Average data of each hour of the predicted/observed HNO3, the observed HONO, the predicted/observed NO3, the temperature, the relative humidity, NO2, NO, and O3.
Atmosphere 11 00820 g009
Figure 10. Correlation plot of the predicted results of the ISORROPIA-II thermodynamic equilibrium model and the observed data of the PPWD-PILS-IC for (a) NH3; (b) NH4+; (c) NO3 and NO3+NO2; and (d) HNO3 and HNO3+HONO2 when TN = [HNO3] + [NO3] + [HONO] + [NO2].
Atmosphere 11 00820 g010
Table 1. Mass concentration and percent mass of the particles smaller than 2.5 µm in diameter (PM2.5) water-soluble inorganic species measured by the PDS.
NCTUNa+NH4+K+Mg2+Ca2+FClNO2NO3SO42TotalA/C
Mass conc. (μg/m3)0.35 ± 0.193.22 ± 1.380.20 ± 0.070.07 ± 0.020.04 ± 0.020.31 ± 0.150.72 ± 0.330.22 ± 0.332.58 ± 1.604.02 ± 1.8712.63 ± 1.710.92 ± 0.2
Percentage (%)2.7425.521.570.580.322.475.711.7520.4138.94100