Article

Abnormal Strong Upwelling off the Coast of Southeast Vietnam in the Late Summer of 2016: A Comparison with the Case in 1998

1
School of Geography and Remote Sensing, Guangzhou University, Guangzhou 510006, China
2
Southern Marine Science and Engineering Guangdong Laboratory, Guangzhou 511458, China
*
Author to whom correspondence should be addressed.
Atmosphere 2020, 11(9), 940; https://doi.org/10.3390/atmos11090940
Submission received: 20 August 2020 / Revised: 31 August 2020 / Accepted: 2 September 2020 / Published: 3 September 2020
(This article belongs to the Special Issue Air-Sea Interaction)

Abstract

:
The traditional view holds that a weakened upwelling has often been observed off the coast of southeast Vietnam during the post-El Niño summer. This study investigated a strong upwelling and concurrent phytoplankton bloom off the coast of southeast Vietnam in August 2016 by comparing it with another case in 1998. Analyses of the upwelling structure and formation mechanisms indicated that the abnormal strong upwelling in August 2016 was attributable to strong wind-driven offshore Ekman transport and Ekman pumping, which were caused by the accompanying southwesterly anomalies south of the anomalous cyclone (AC) over the western North Pacific (WNP), and vice versa in August 1998. This anomalous southwesterly wind associated with the AC over the WNP could not be explained by La Niña, the negative Indian ocean dipole, or the positive Pacific meridional mode events. Further analyses showed that the Madden–Julian oscillation (MJO)-induced westerly winds could have contributed more than 75% of the original zonal winds. Nine tropical cyclones generated over the WNP were favorable for excessive precipitation. The opposite configurations of precipitation patterns over the WNP and the Maritime Continent could have further strengthened the AC via a Gill response.

1. Introduction

Upwelling, one of the most important ocean circulation patterns [1], is characterized by a relatively low sea surface temperature (SST) and relatively high chlorophyll-a (Chl-a) concentration [2]. The South China Sea (SCS), the largest semi-enclosed marginal sea in the western North Pacific (WNP), is dominated by the East Asian monsoon, with southwesterly and northeasterly monsoonal winds in summer and winter, respectively [3,4,5]. Seasonal reversal of the wind direction can drive different upwelling systems in the SCS, such as the upwelling along the eastern Guangdong coast and southern Fujian coast in summer [6], and the upwelling off the northwestern coast of Luzon Island (known as the Luzon cold eddy) in winter [7,8]. All of the upwellings in the SCS and their formation mechanisms are primarily caused by monsoonal wind forcing, but can be greatly affected by topography, stratification, tide, and tropical cyclone (TC) [9,10,11,12].
The summer monsoonal wind forcing is the strongest in the western SCS due to the orographic induced southwesterly wind jet, which could lead to a strong coastal and open ocean upwelling off the coast of southeast Vietnam [13,14,15]. The Vietnam upwelling is one of the most important features of the ocean circulation pattern of the SCS in summer, and has been widely studied with respect to its structure, formation mechanism, and variabilities on intra-seasonal to decadal timescales. Specifically, the upwelling off the coast of southeast Vietnam starts in June, reaches a peak in August, and disappears in October [13]. The major features of this upwelling are that an eastward jet (or cold filament) forms near 12° N between an anticyclonic eddy in the southwestern SCS and a cyclonic eddy off the central coast of Vietnam [16,17], with high Chl-a concentration along the cold SST zones. Compared with the complex mechanisms of the coastal upwelling in the northern SCS, the prevailing southwesterly winds are the most important factor in driving this upwelling through offshore Ekman transport due to alongshore wind [18,19] or Ekman pumping due to wind stress curl [15,19].
The upwelling off the coast of southeast Vietnam is modulated by different climate patterns, such as the El Niño–Southern Oscillation (ENSO) [15,20], the Indian Ocean dipole (IOD) [21,22], and the Madden–Julian oscillation (MJO) [23,24]. El Niño influences the SCS primarily through a direct influence on the summer monsoonal winds [25]. During the post-El Niño summer, the anomalous anticyclone over the WNP (WNPAC) weakened the southwesterly wind, and led to weak upwelling [15]. For example, during the summer of 1998, the SCS experienced the most extreme basin warming on record induced by the 1997/98 super El Niño [26,27,28], and the upwelling off the coast of southeast Vietnam completely disappeared. It seems that the WNPAC is the key factor in the El Niño-weak upwelling connection, and thus, we speculate whether there could be any special case breakdown of this connection? The El Niño events in 1997/98 and 2015/16, and their impacts on the SCS, were quite different [29,30]. In this study, we report an abnormal strong upwelling off the coast of southeast Vietnam during the post-2015 super El Niño summer (August 2016) by comparison with the 1997/98 case. Although the upwelling in the SCS has been widely studied because of its strong impact on the regional climate and ecosystems [15,31,32], the study of certain special cases could help us to understand the upwelling in response to climate change.
The remainder of this paper is organized as follows. Section 2 describes the data and methods. Section 3 discusses the contrasting structures and formation mechanisms of the August upwelling off the coast of southeast Vietnam in 1998 and 2016. Finally, Section 4 and Section 5 present the further discussions and conclusions, respectively.

2. Data and Methods

2.1. Data

This study used the observational SST data from the National Oceanic and Atmospheric Administration (NOAA) daily optimum interpolation SST data (version 2) [33]. The daily merged satellite Chl-a concentration data were obtained from the European Space Agency (ESA) Ocean Colour Climate Change Initiative (OC-CCI) [34]. The subsurface temperature, salinity, density, and three-dimensional current fields from the Simple Ocean Data Assimilation (SODA version 3.4.2) reanalysis data were used to explore the upwelling structure and associated mechanisms [35]. The three-dimensional winds and relative humidity fields at different pressure levels were sourced from the National Centers for Environmental Prediction (NCEP)–National Center for Atmospheric Research (NCAR) monthly reanalysis data [36]. Monthly mean precipitation datasets were taken from the NOAA Climate Prediction Center merged analysis of precipitation (CMAP) [37]. The daily outgoing longwave radiation (OLR) and zonal winds were obtained from the NOAA satellites [38]. The TC genesis locations over the WNP were taken from the Joint Typhoon Warning Center (JTWC) [39]. All datasets cover the period of 1982–2018.

2.2. Methods

In this study, we estimate the wind-driven upwelling following the method of Pickett and Paduan [40], including Ekman transport and Ekman pumping. The offshore Ekman transport (M) and Ekman pumping velocity (w) at each coastal grid are calculated by following the method of Smith [41],
M = τ · t ^ ρ f
where τ is the wind stress vector, t ^ is a unit vector tangent to the coastline, ρ is the reference density of seawater (1027 kg m–3), and f is a Coriolis parameter. The offshore Ekman transport are integrated along the given coastal grids.
w = k ^ · × τ ρ f
where k ^ is a unit vector in the local direction. The Ekman pumping velocities are integrated offshore from the given grids to obtain the Ekman pumping transport for comparison with the offshore Ekman transport in Equation (1).

3. Results

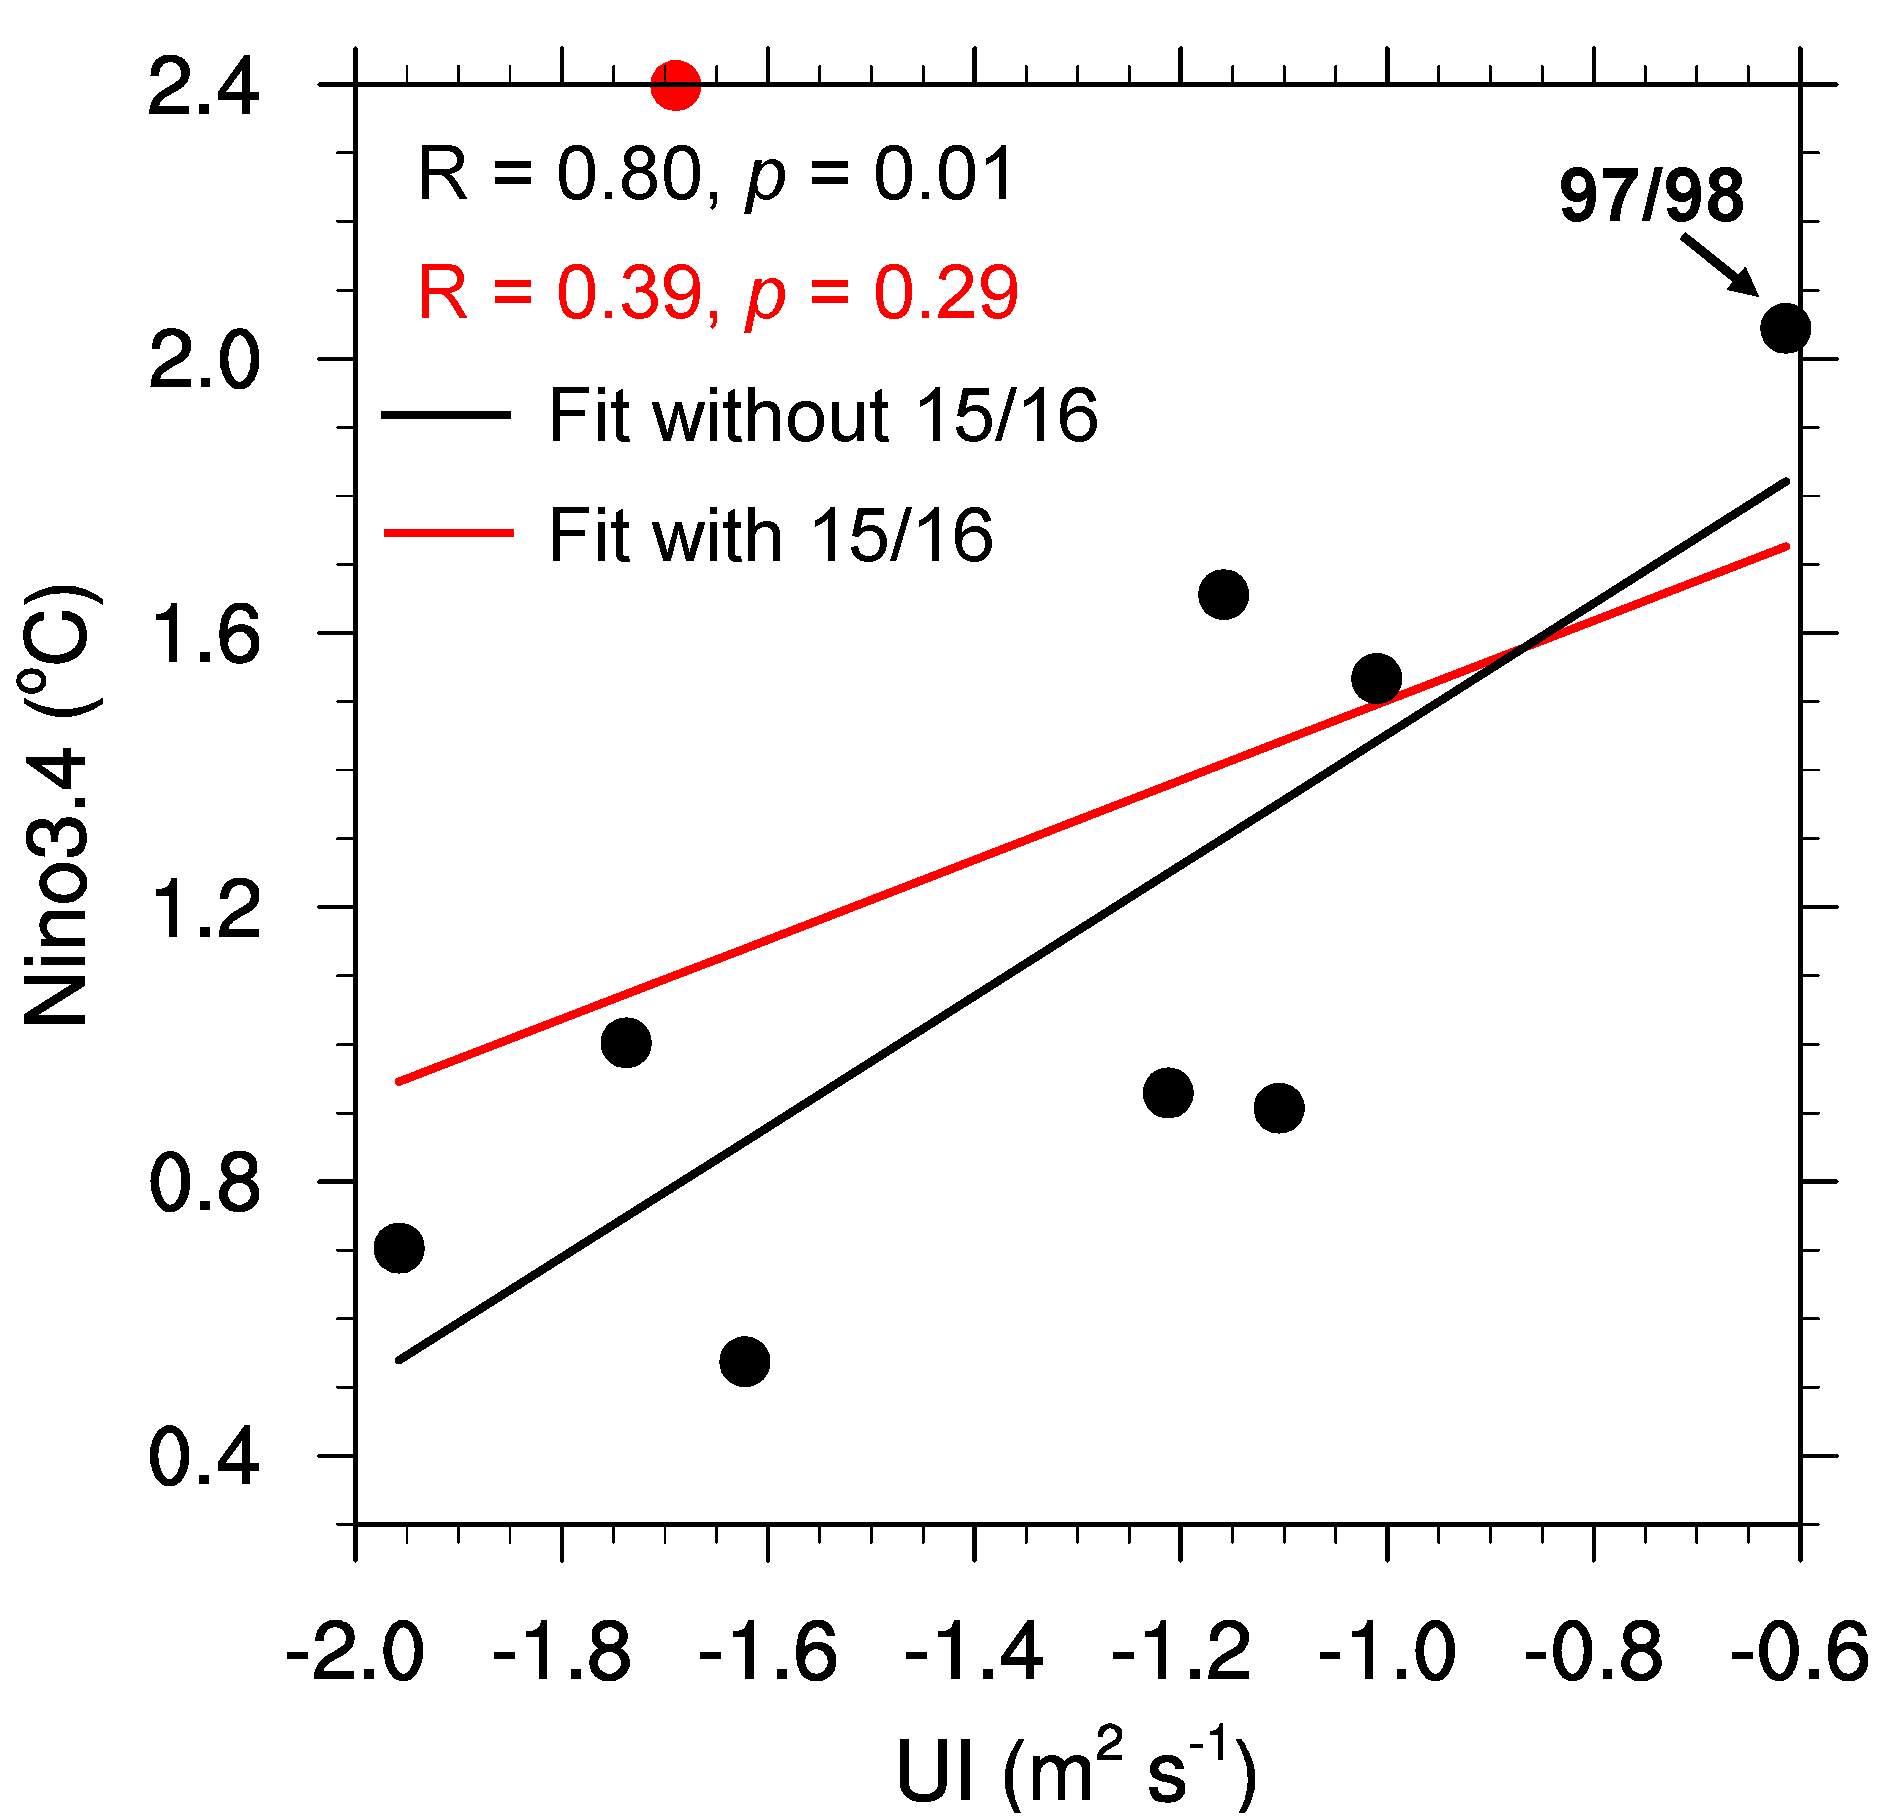
3.1. Breaking Down the El Niño-Weak Upwelling Connection off the Coast of Southeast Vietnam in August 2016

Figure 1 shows the time series of the Niño3.4 index [42] and the dipole mode index (DMI) [43] in 1982–2018. The La Niña events and negative IOD events occurred during 1998 and 2016 summers. Observations show that the early boreal summer (June–July) SST distributions in 1998 were consistent with those in 2016 (Figure 2a,b,d,e). A narrow cold filament (<2 °C) spread eastward in August in 2016 but did not occur in 1998 (Figure 2c,f). Satellite observations show that a high Chl-a concentration tongue greater than 0.2 mg/m3 was extended eastward near 113° E in August 2016, differently from the early summer of 2016, and the entire summer season in 1998. All of the SST and Chl-a observations reveal an abnormal strong upwelling off the coast of southeast Vietnam in August 2016.
The traditional view holds that weak upwelling often occurs following an El Niño event [15]. In this study, the strength of the coastal upwelling in the central position located at 11.5° N, 109.5° E (black star in Figure 2a) was calculated using an upwelling index (UI) [44] based on offshore Ekman transport (Equation (1)). We compared the UI in August and the Niño3.4 index in the former winter during all El Niño events (Figure 3). The correlation coefficient between UI and Niño3.4 index is only 0.39 but reaches 0.8 (exceeds the 99% confidence level) if the year 2015/16 is excluded. The UI was only −0.6 m2/s in response to the 1997/98 super El Niño event, which indicates the weakest upwelling intensity during El Niño decaying years. The question becomes, what happened in August 2016 to breakdown the El Niño-weak upwelling connection?

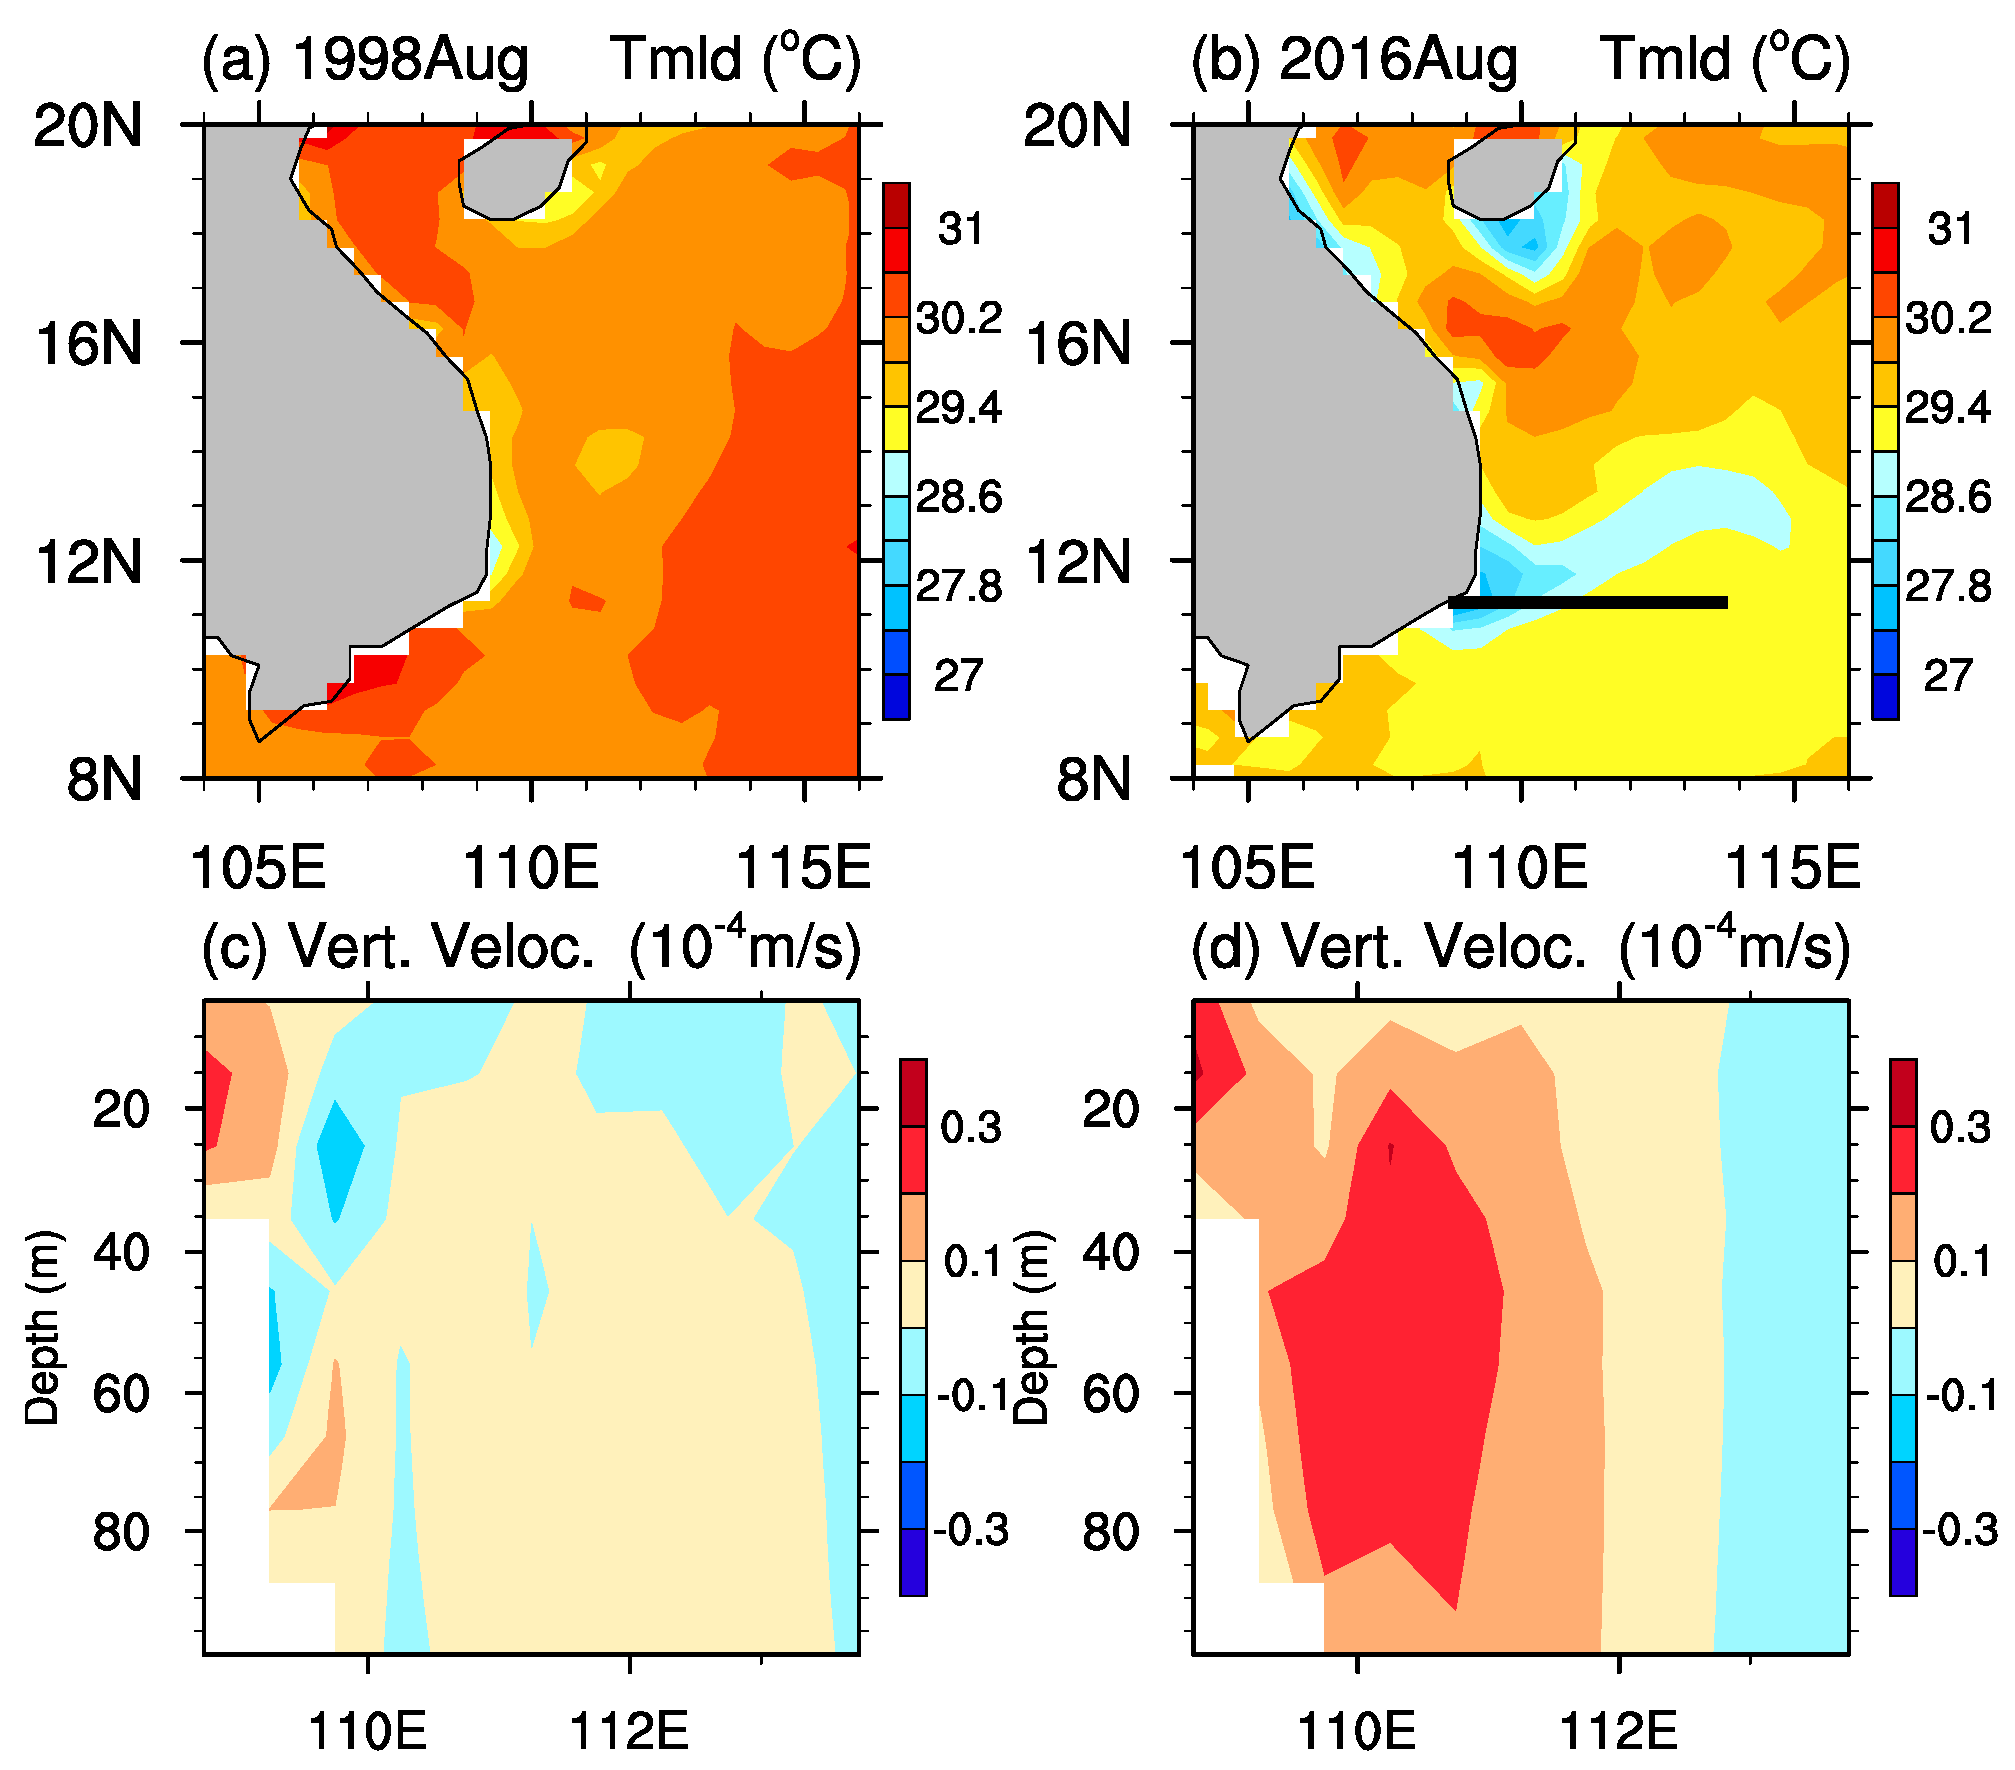
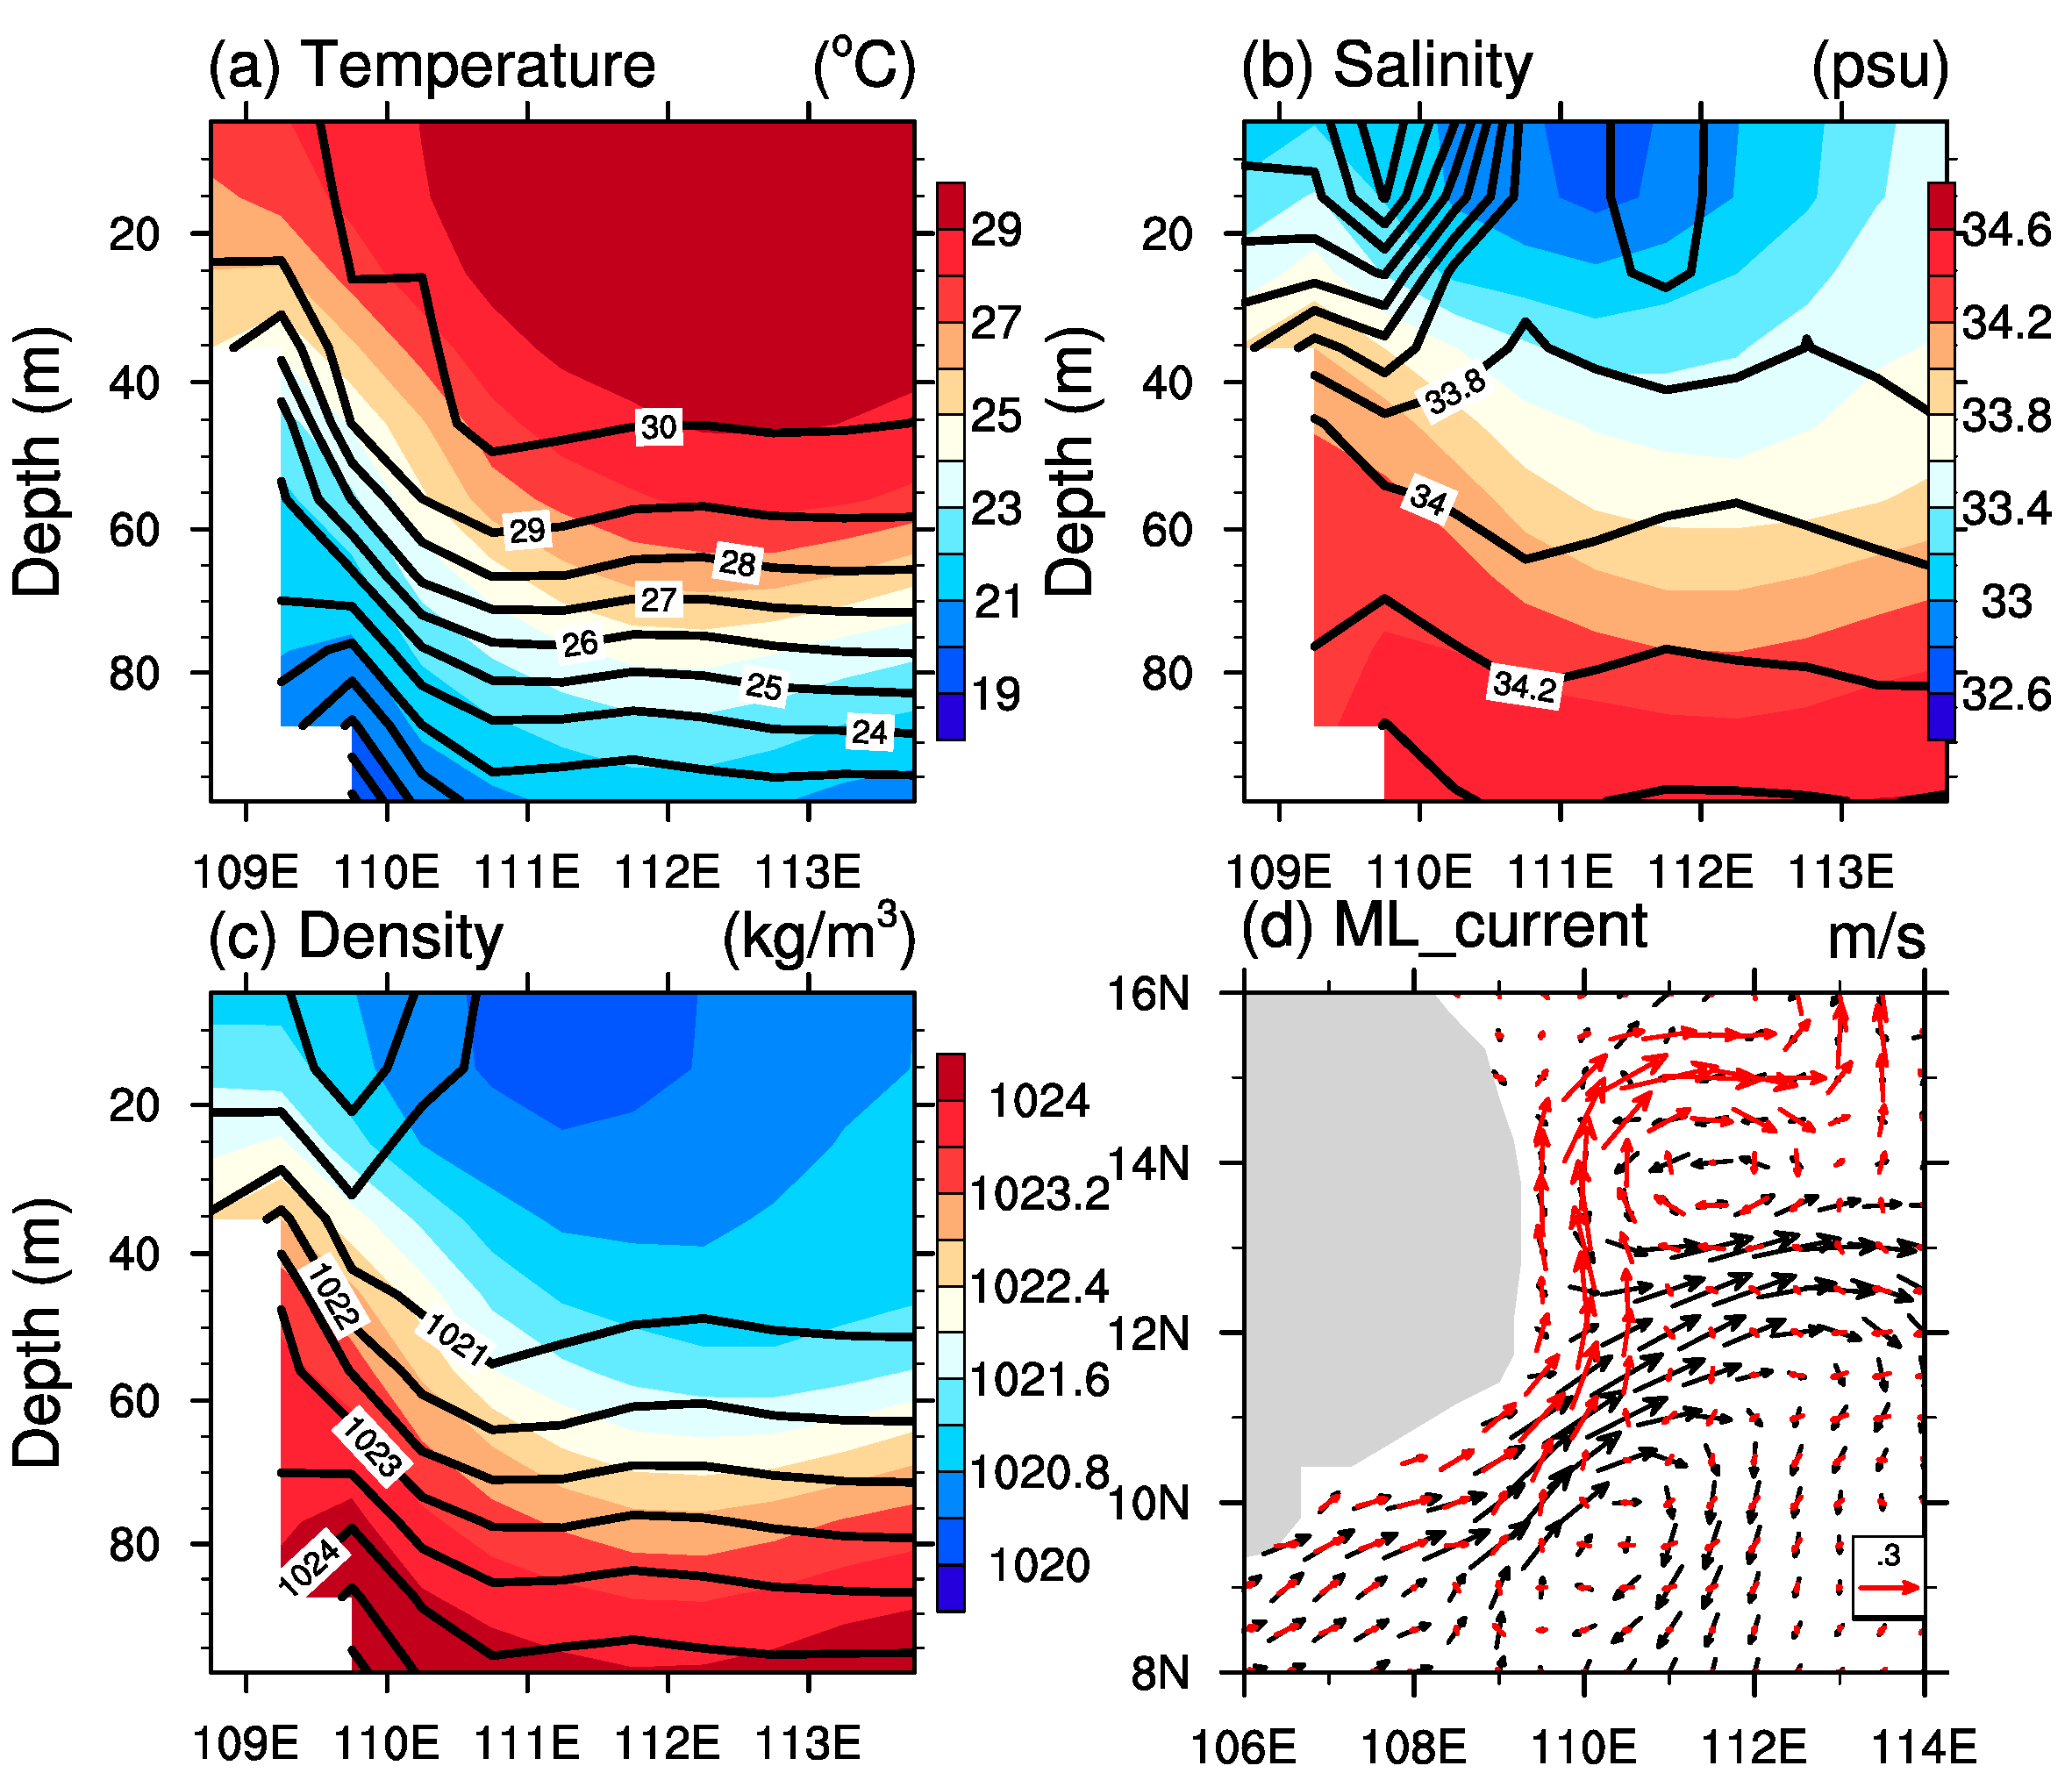
3.2. Contrasting Upwelling Structures

To answer the above question, different features of the upwelling structure and associated mechanisms in August between 1998 and 2016 should be clarified first. In this study, the SODA reanalysis dataset, which can reproduce the observed SST patterns in Augusts during 1998 and 2016 (Figure 4a,b), was selected to detect the upwelling structure among the multi-reanalysis datasets (ORAS5, EN4, COADS, and GODAS). Figure 4c,d display the depth-longitude transects of the vertical velocity along 11.25° N in the Augusts of 1998 and 2016. The results demonstrate that the positive vertical velocity (upward motion) in August 2016 was much higher than that in 1998, which suggests that the upwelling was stronger in August 2016. The maximum positive vertical velocity occurred at depths of 15 m near the coast and 50–60 m at 110° E, which is consistent with high Chl-a concentration centers near the coast and at 111° E in August 2016 (Figure 2l).
Figure 5a,b further present the vertical thermohaline structures along the transect in the Augusts of 1998 and 2016. The 29 °C isotherm was located at a depth of approximately 25 m near the coast and deepened eastward (approximately 60 m at 113° E) in August 1998, however, the 29 °C isotherm occurred at the surface (~110° E) and deepened eastward at a depth near 45 m (~112.5°E) in August 2016 (Figure 5a). Figure 5b shows that the 33.8 psu isohaline was located at a depth of approximately 36 m (~52 m), averaged from 110° E to 113° E in August 1998 (2016). Therefore, both the isotherms and isohalines along the transect were dramatically upraised in August 2016. These variations indicated that the colder and saltier water upwelled from the subsurface layer, consistent with the strong upward vertical velocity in Figure 4d. The strong upwelling could have delivered the nutrient-rich subsurface waters to the surface to increase the surface Chl-a concentration. However, the high surface Chl-a concentration might have been partially enhanced by the strong vertical mixing process. Ocean stratification could be represented by the static stability ( 1 ρ ρ z ), and was estimated from the density difference between the surface and subsurface layers [45,46]. Figure 5c shows the vertical density structures along the transect in the Augusts of 1998 and 2016. We found that the density in August 2016 was greater than in 1998. The colder surface near the coast resulted in the density difference between the surface and at a depth of 75 m was approximately −3 kg/m3 near 109° E in August 2016 but was approximately −3.5 kg/m3 in 1998 (Figure 5c). The weaker surface stratification near the coast could have enhanced the vertical mixing of nutrient-richness from subsurface waters in August 2016 [45]. However, the results are different in another high Chl-a concentration center (~111° E). The density difference between the surface and a depth of 100 m was approximately −3.9 kg/m3 (−3 kg/m3) near 111° E in August 2016 (1998), which indicates that vertical mixing could not have made a contribution to the increased Chl-a near 111° E. Furthermore, the upper layer circulation of the SCS in August is within the influence of the southwest summer monsoon, but the horizontal currents, averaged over the mixed-layer depth (ML currents), showed different features off the coast of southeast Vietnam between these two years (Figure 5d). The ML currents ran nearly alongshore off the coast of southeast Vietnam, and formed an anticyclonic gyre near 14° N in August 1998. However, a current jet ran offshore north of 12° N in August 2016 [16].
Wind-driven upwelling can be classified into two processes: Ekman transport and Ekman pumping [41,47]. Total upwelling is the sum of Ekman transport and Ekman pumping. In this study, the relative roles of Ekman transport and Ekman pumping, in driving the August upwelling off the coast of southeast Vietnam between 1998 and 2016, are analyzed using Equations (1) and (2). The wind stress and the Ekman pumping velocity off the coast of southeast Vietnam in 2016 were stronger than those in 1998 (Figure 6a,b). We chose five grid points to calculate the offshore Ekman transport and Ekman pumping transport integrated along the coast (Figure 6c) and noted that positive Ekman transport indicates offshore transport. Due to the impact of the 1997/98 super El Niño, the SCS experienced a basin-wide warming and weakened southwest summer monsoon [15,25,26,27]. Thus, the wind-driven offshore Ekman transport and Ekman pumping transport were 1.48 and 2.39 m3 s−1 m−1, respectively, integrated along the coast. Approximately 62% of the total wind-driven upwelling was due to Ekman pumping in August 1998. However, the Ekman pumping transport was close to that of offshore Ekman transport with values of 7.47 and 8.59 m3 s−1 m−1 integrated along the coast in August 2016. This result indicates a 53% contribution of Ekman pumping to the total wind-driven upwelling. The next question is, why was the total upwelling in August 2016 four times as large as that during the post-super El Niño of August 1998?

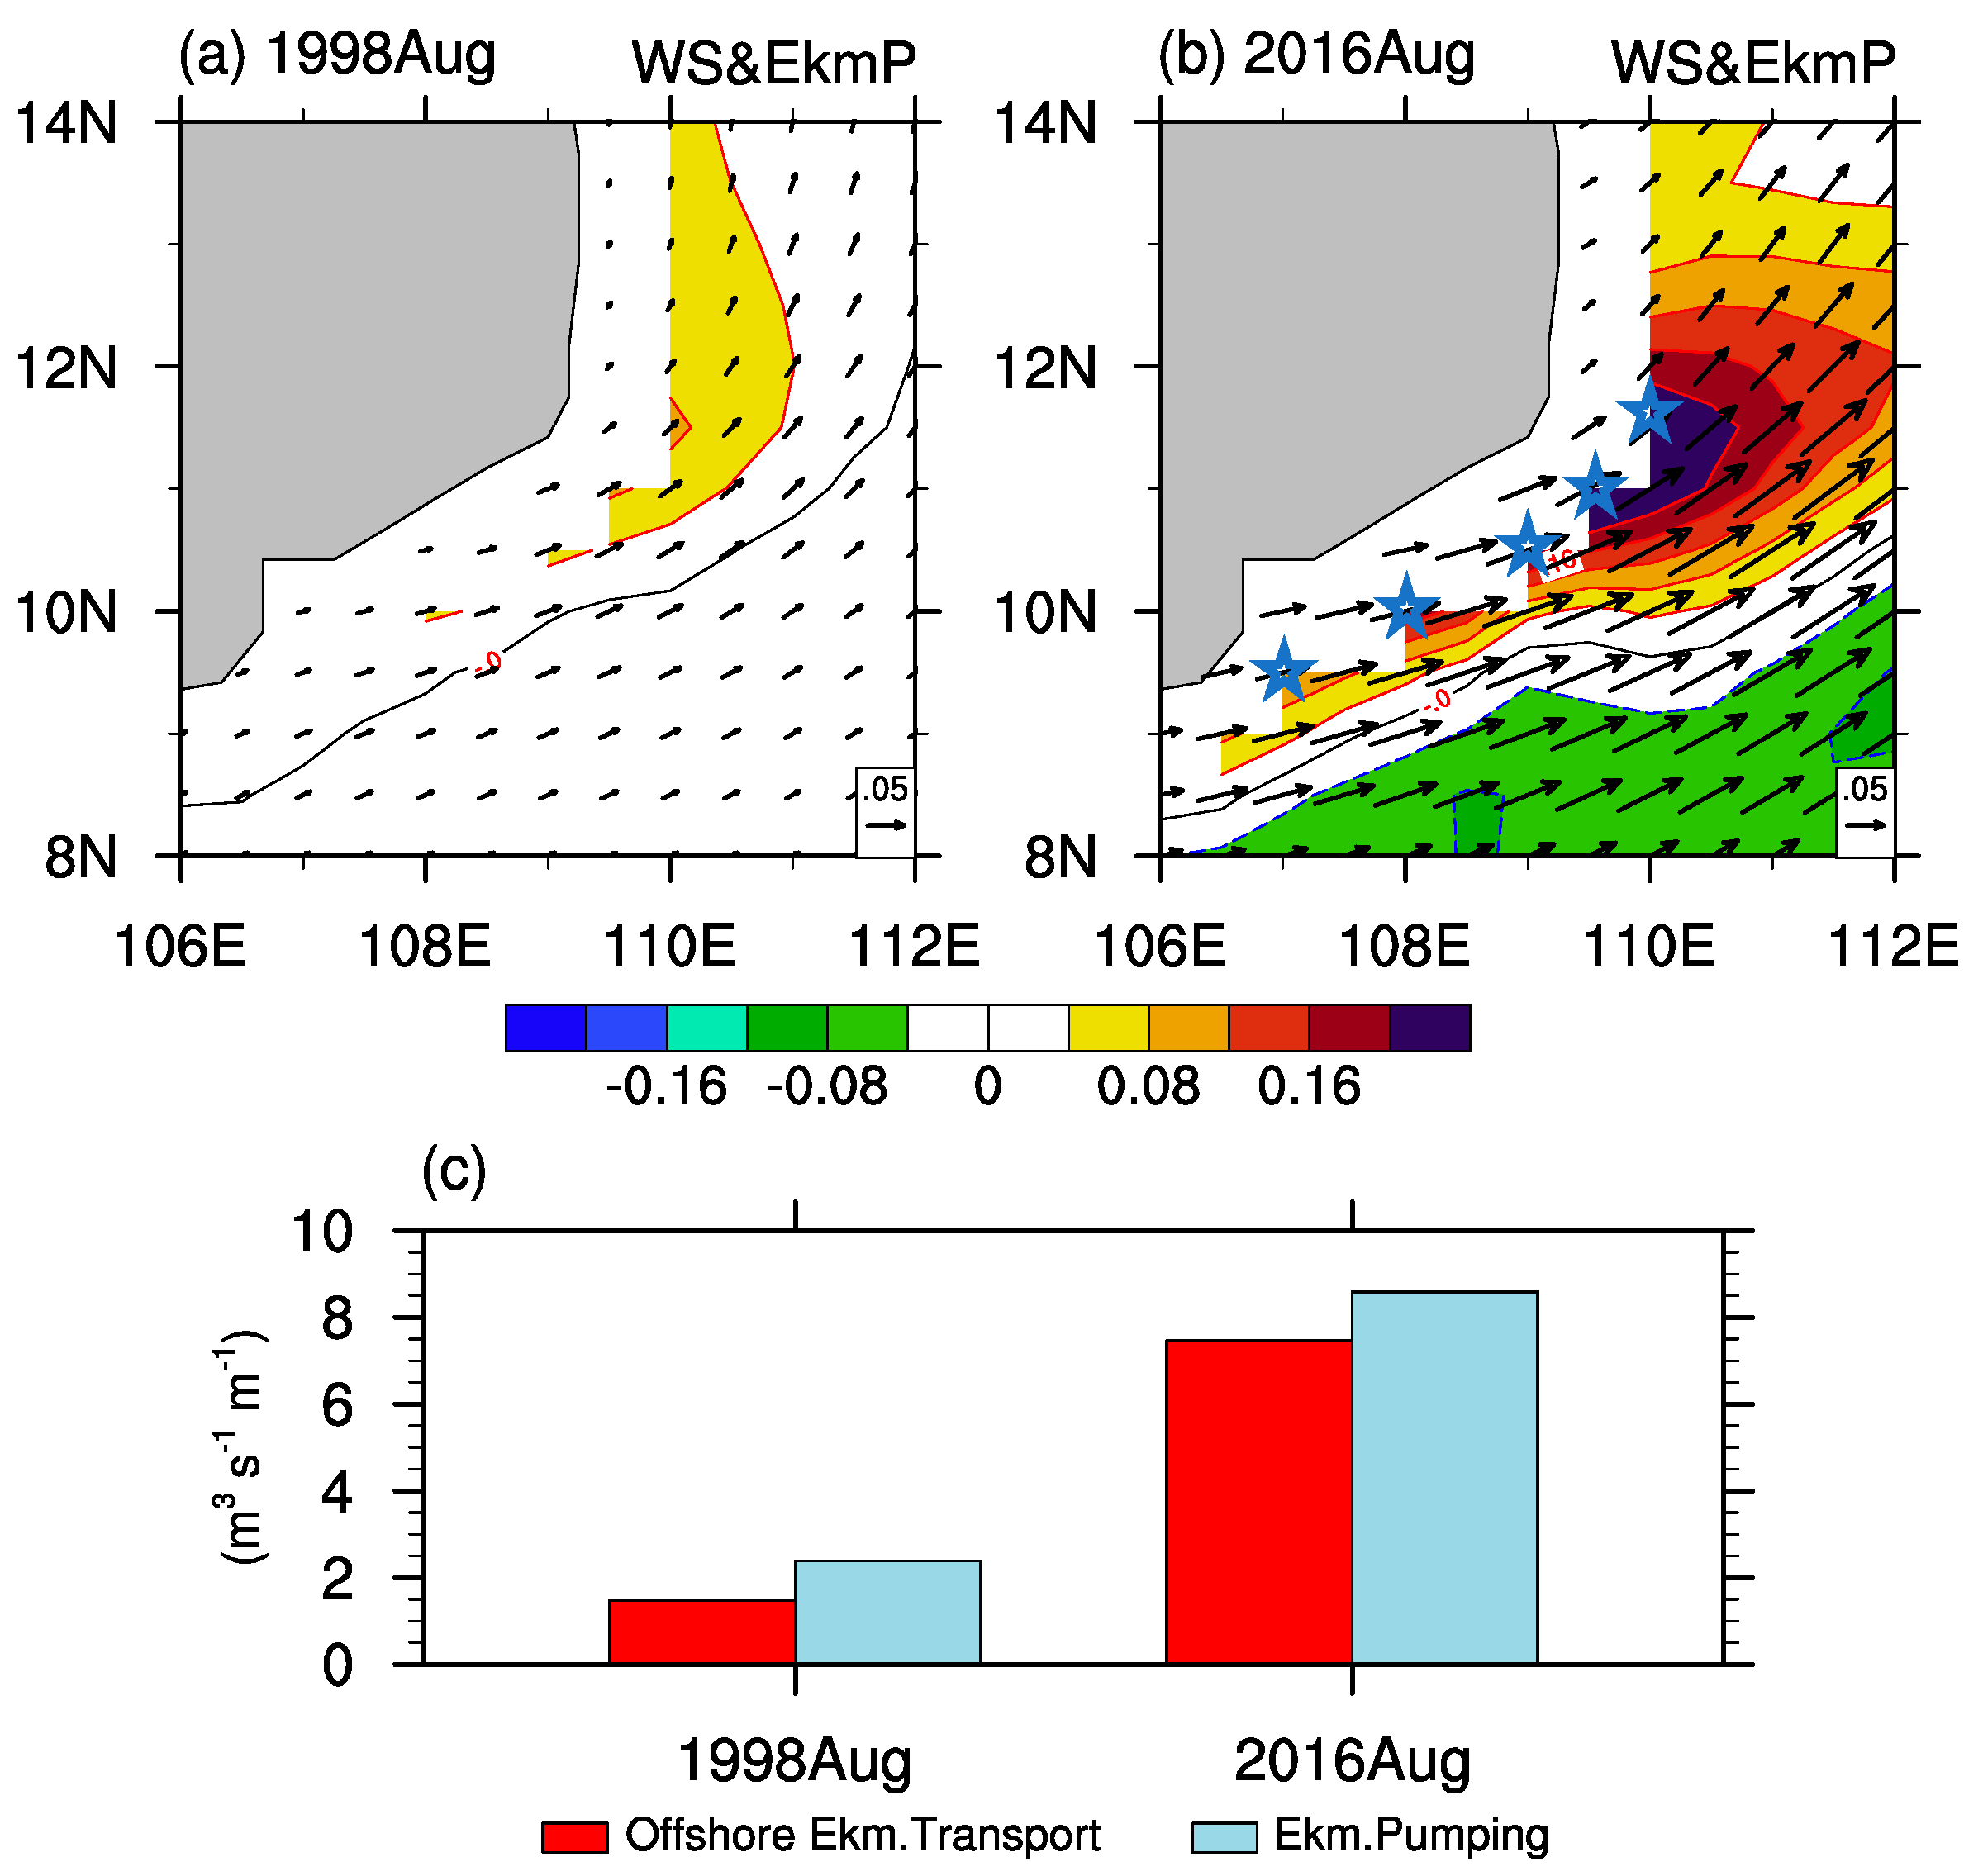
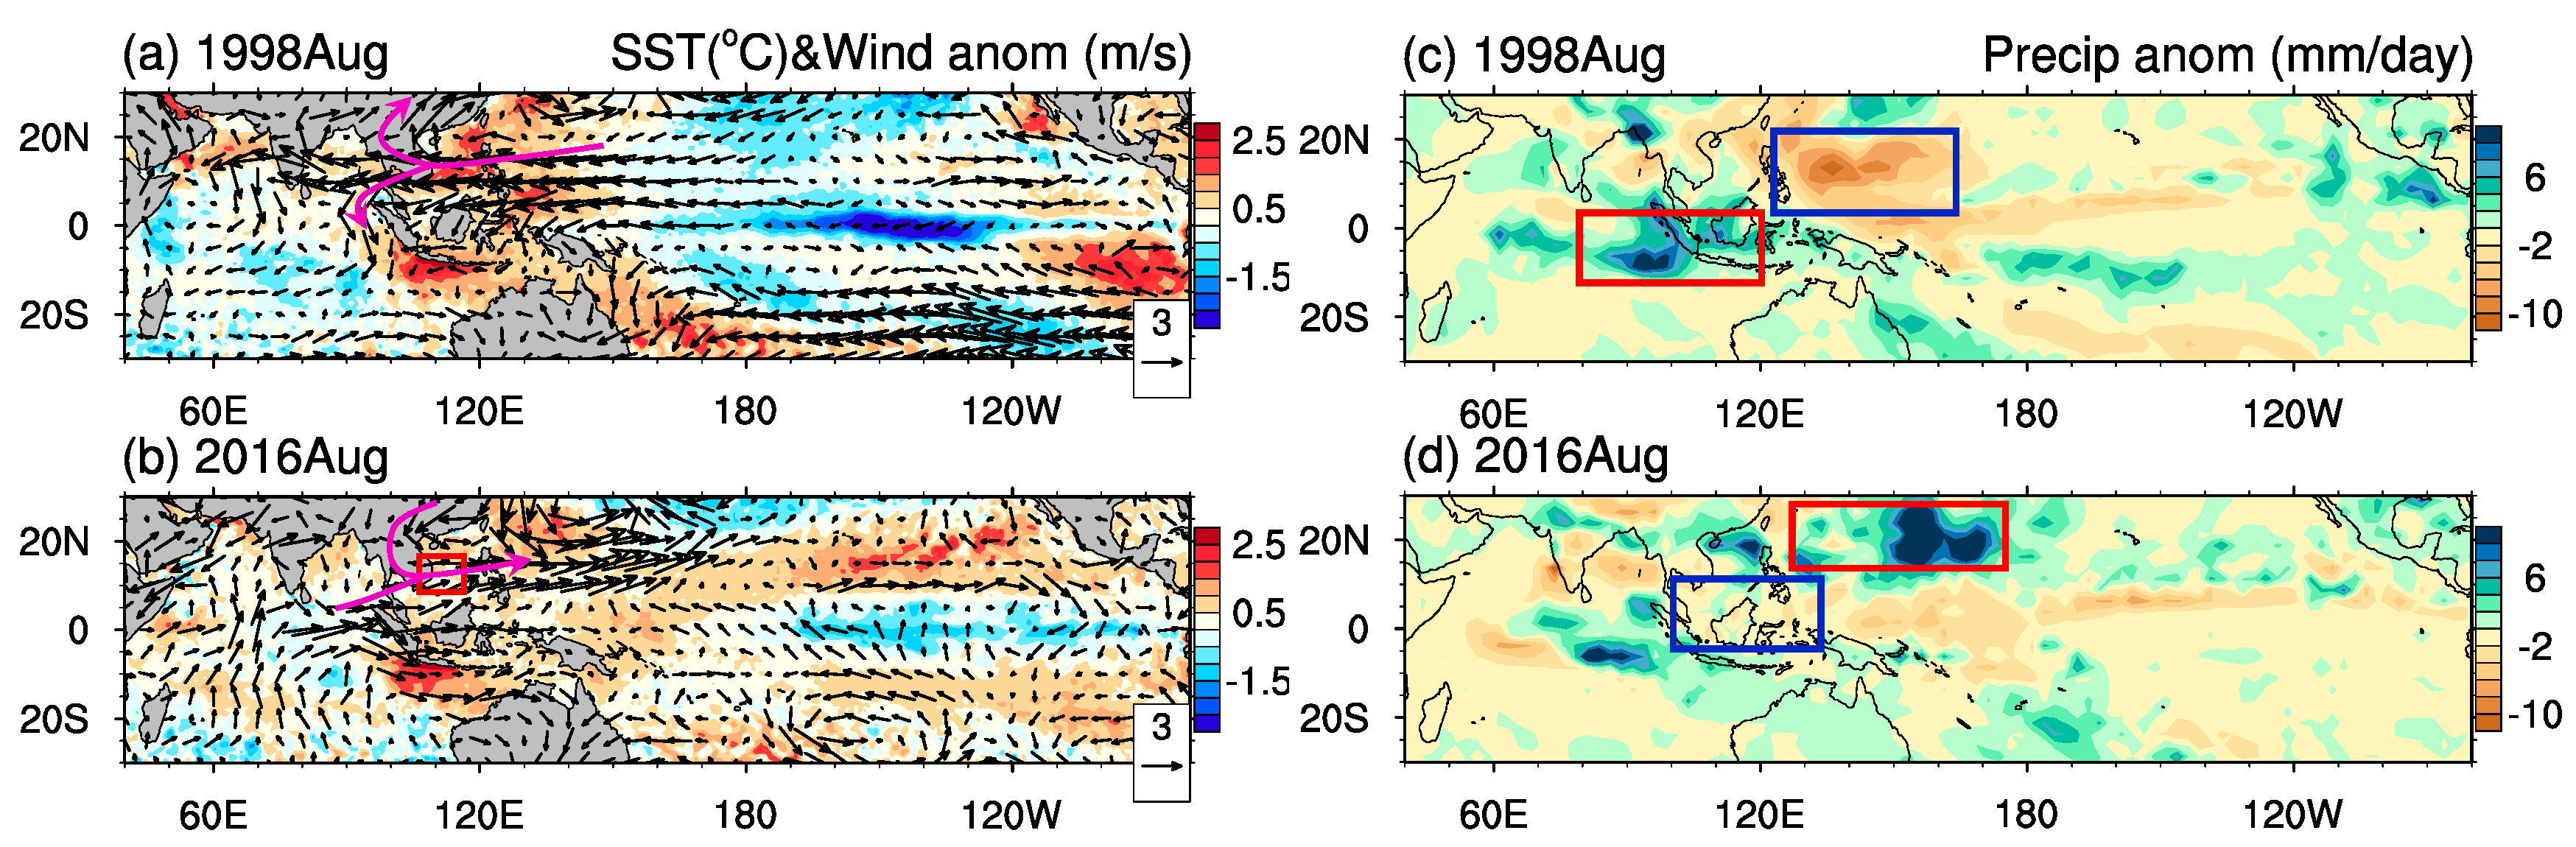
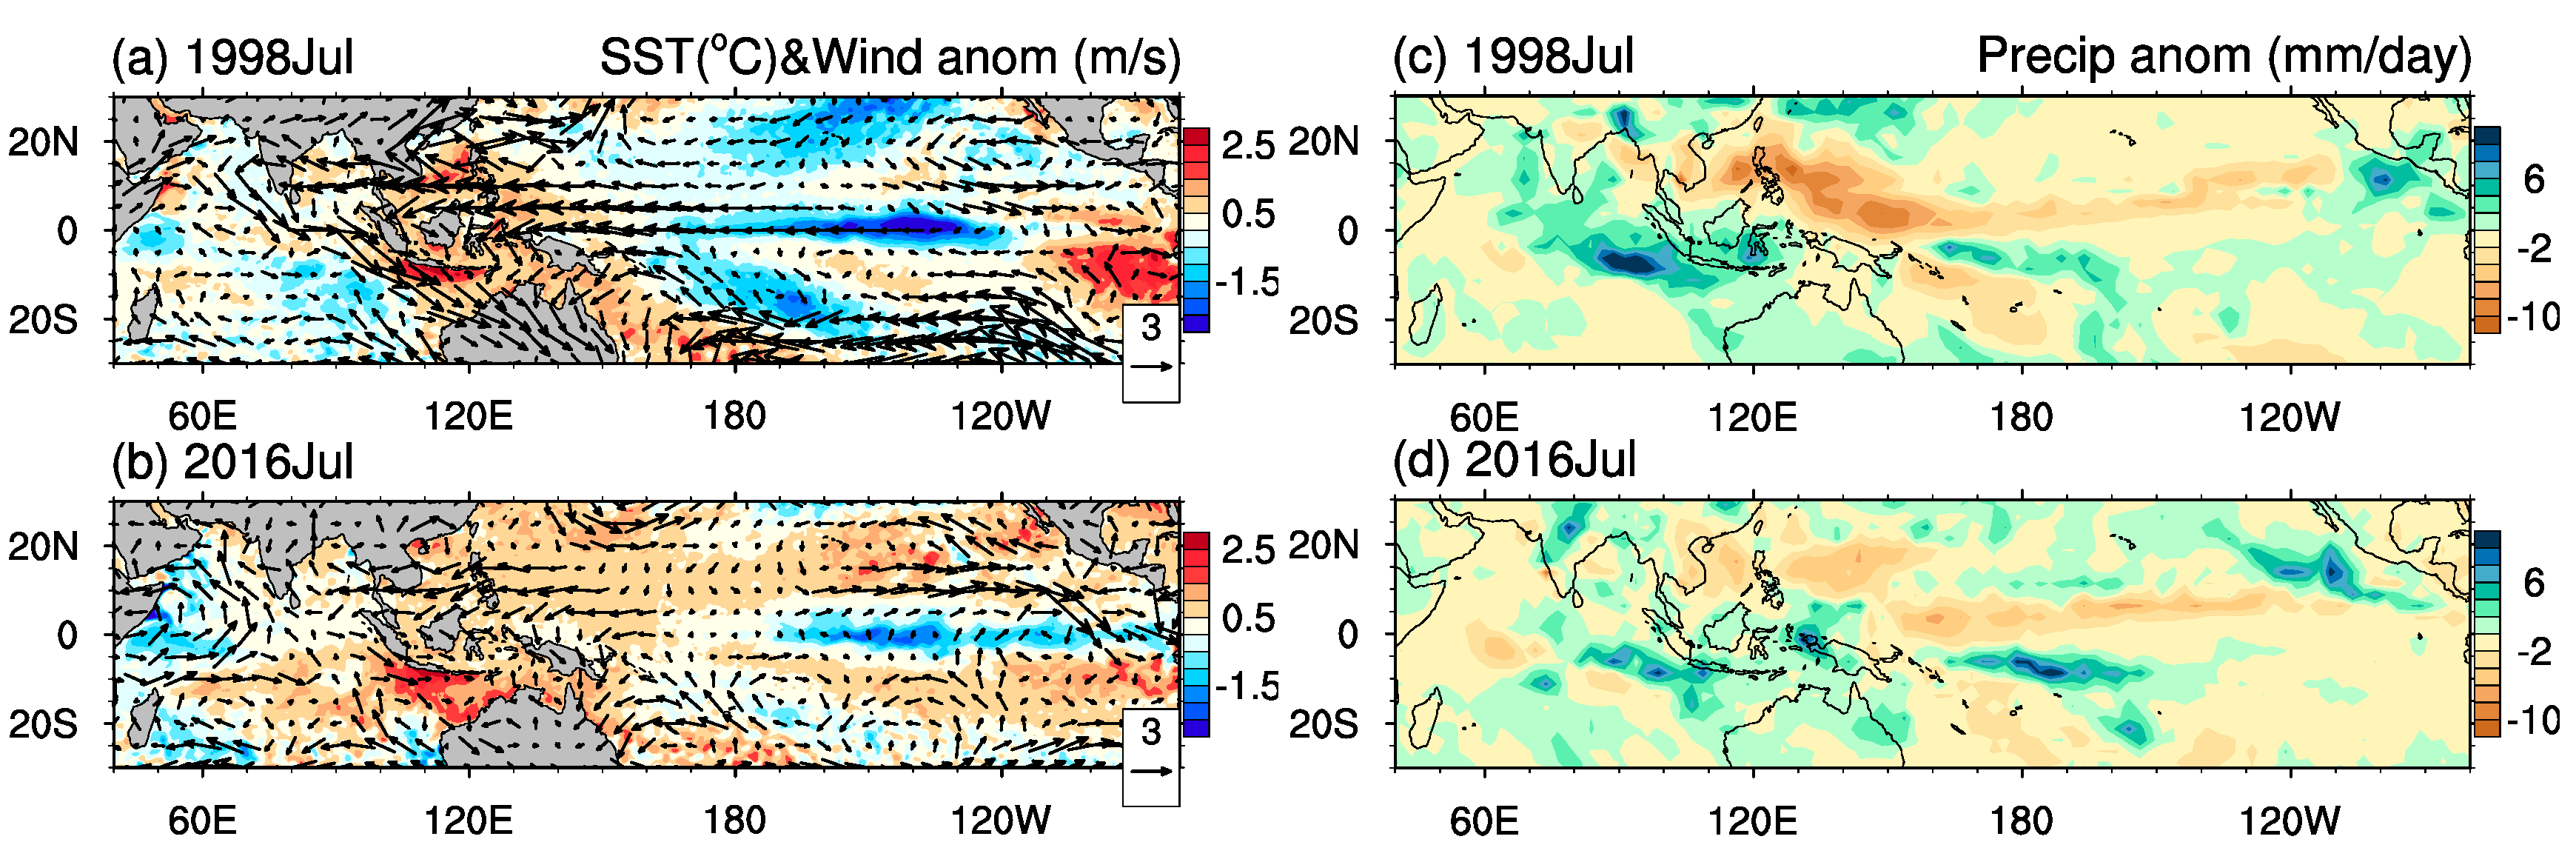
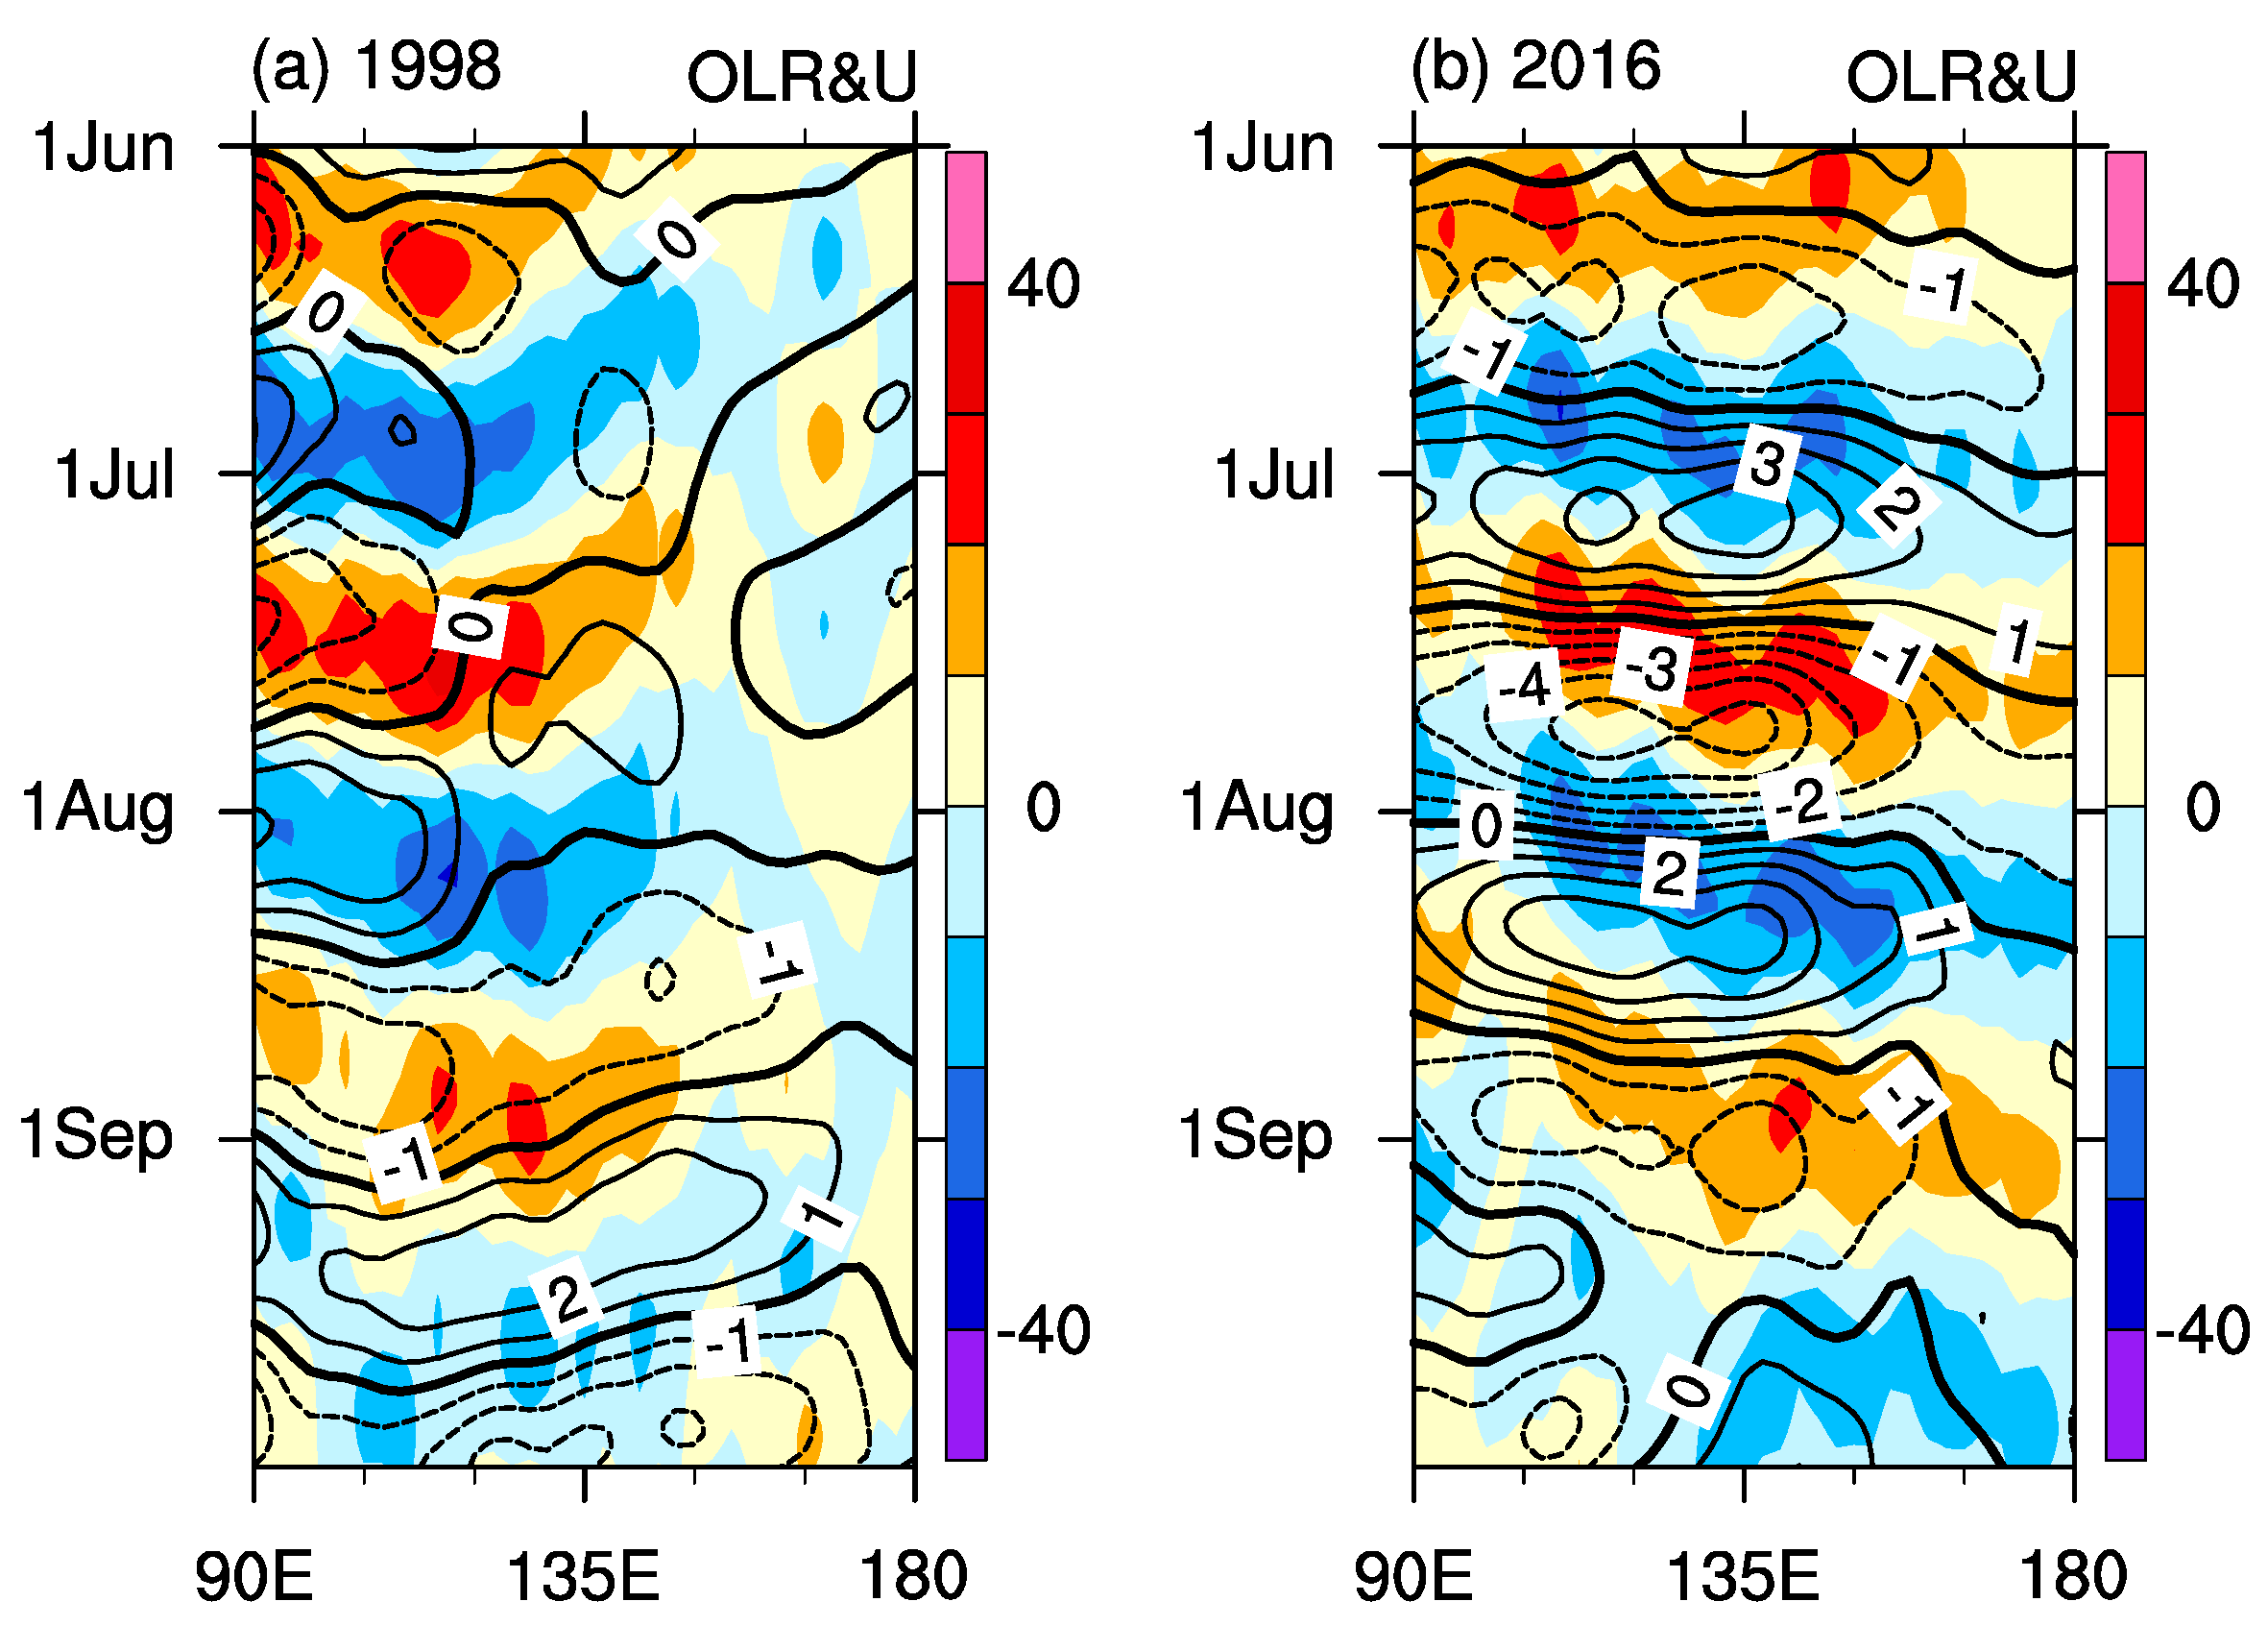
3.3. Linkage with Large-Scale Circulations

We compared the August SST anomalies (SSTa), 850 hPa wind, and precipitation anomalies in 1998 and 2016 (Figure 7). From the SSTa and the horizontal wind anomalies fields, we clearly found that the La Niña-like SST pattern and the associated anomalous easterly winds occurred in the central-western tropical Pacific during these two years. The positive SSTa off Sumatra and Java, associated with the anomalous northwesterly winds, were linked with the negative IOD development over the tropical Indian Ocean. The SSTa configurations are consistent with the Niño3.4 index and DMI, as shown in Figure 1. Although the SSTa patterns were highly similar to each other in the tropical oceans in 1998 and 2016, different SSTa patterns occurred in the subtropical Pacific. The positive SSTa in the northwestern portion, and negative SSTAs in the southeastern portion of the eastern Pacific, indicated a typical positive Pacific meridional mode (PMM) phase during August 2016 [48,49]. For the 850 hPa wind fields, an anomalous anticyclone (AAC) occurred over the SCS with strong easterly wind anomalies across the central-southern SCS (Figure 7a). The anomalous northeasterly wind weakened the southwest summer monsoon, which induced the weak wind-driven upwelling in August 1998 (Figure 6a,c). However, the situation was completely different in 2016. An anomalous cyclone (AC) over the SCS, with strong southwesterly wind anomalies across the central-southern SCS, was observed in Figure 7b, which contributed to the strong wind-driven upwelling in August 2016 (Figure 6b,c). Similar precipitation patterns over the tropical Pacific and Indian Ocean were observed in response to the La Niña and negative IOD events in these two years (Figure 7c,d). It is noted that the negative and positive precipitation anomalies were located over the WNP and Maritime Continent (MC), respectively, in August 1998. In contrast, the precipitation patterns in August 2016 were opposite to those in 1998, with excessive precipitation occurring over the WNP.
The spatial structures of the anomalous vertical circulation were compared between the Augusts of 1998 and 2016, as shown in Figure 8. In August 1998, the 200 hPa (upper level) velocity potential and corresponding divergent winds displayed anomalous divergence (convergence), and the 500 hPa (middle level) vertical p-velocity showed anomalous ascending (descending) motions over the tropical Indian Ocean (Pacific). These vertical motions induced an AAC with anomalous easterly winds over the SCS and the WNP (Figure 7a and Figure 8a,b), which could be explained by the Lindzen-Nigam mechanism associated with the La Niña and positive IOD developments [50]. In contrast, the vertical circulation patterns over the tropical Indian Ocean and WNP in 2016 were opposite of those in August 1998, which displayed an anomalous convergence and descending motion over the north Indian Ocean, in the upper and middle levels, and an anomalous divergence and ascending motion over the WNP, inducing an AC with anomalous westerly winds over the SCS and WNP (Figure 7b and Figure 8c,d).
Why did the opposite horizontal winds occur over the SCS and WNP under similar La Niña, and negative IOD backgrounds? Was it related to the positive PMM? We compare the July SSTa, 850 hPa wind, and precipitation anomalies during 1998 and 2016 (Figure 9). It is clear that the SSTa, 850 hPa wind, and precipitation anomaly patterns in July 1998 were similar to those in August 1998. In July 2016, the SSTa patterns were similar to those in August 2016, which showed La Niña and a negative IOD in the tropical oceans and a positive PMM in the north Pacific. However, the 850 hPa wind and precipitation anomalies showed patterns similar to those in July 1998, which were opposite of those of August 2016. These comparisons indicated that the AC over the SCS and WNP, with anomalous westerly winds in August 2016, could not be explained by the positive PMM but could be attributed to intraseasonal variability, such as the MJO. Figure 10 depicts the 30–60 day filtered OLR and zonal wind anomalies averaged over 5°–15° N. A deep and suppressed convection moved eastward and dissipated approximately 135°E, with the zonal easterly wind anomalies dominating over the SCS and WNP in August 1998 (Figure 10a). Similarly, a deep and suppressed convection could also be found in August 2016, but the amplitudes were stronger than those in 1998 (Figure 10b). The MJO-related convections and zonal winds could move eastward across the date line. The maximum MJO-band filtered zonal wind in August was greater than 4.5 m/s, which could explain more than 75% of the original zonal wind anomalies over the SCS and WNP in Figure 7b. The active MJO westerly phase and associated strong westerly wind in August 2016 might have contributed to the abnormal strong upwelling off the coast of southeast Vietnam. It is also notable that the westerly wind anomalies lagged behind the deep convection by one quarter period in August 2016, which is indicated by the response of the zonal wind anomaly to the precipitation (convective heating release) anomaly. Therefore, we used a simple Gill model to explain the related physical mechanisms [51,52].
Excessive and suppressed precipitation could be viewed as anomalous heating and cooling sources (by the release of excessive (less) latent heat into the troposphere), respectively. We produced a similar scenario to illustrate the influence of anomalous heating over the SCS and WNP on the zonal winds using a simple Gill model (Figure 11a,b). In Figure 11a, we placed one heating and one cooling source over the MC and WNP, respectively, to simulate the precipitation (convective heating release) patterns during August 1998 (Figure 7c). According to the asymmetric Gill theory [52,53,54], an AAC formed over the WNP in response to the anomalous cooling source, and an AC formed over the MC in response to the anomalous heating source. The anomalous easterly winds occurred over the SCS between the heating dipoles, which was consistent with the observations (Figure 7c and Figure 11c). In Figure 11b, the distributions of the anomalous heating sources are opposite those of Figure 11a. The AC was located over the WNP in response to the anomalous convective heating, with the anomalous westerly winds over the SCS and WNP (Figure 11d). It is noted that the suppressed precipitation over the MC had a weaker value than the excessive precipitation over the WNP, which indicates that the heating source over the WNP was the major factor in deciding the anomalous westerly winds over the SCS in August 2016.
As mentioned above, the simple modeling results reveal that the different configurations of precipitation patterns contributed to the anomalous easterly and westerly winds over the SCS via a Gill response in the Augusts of 1998 and 2016, respectively. What caused the suppressed and excessive precipitation over the WNP in Augusts 1998 and 2016? The TC is the most active synoptic system over the WNP in August. To further examine the joint effects of the thermodynamic and dynamic factors controlling the TC geneses in the Augusts of 1998 and 2016, we calculated the modified genesis potential index (GPI) following the work of Murakami et al. [55],
G P I = | 10 5 η | 3 2 ( R H 50 ) 3 ( V p o t 70 ) 3 ( 1 + 0.1 V s ) 2 ( ω + 0.1 0.1 )
where η is the 850 hPa absolute vorticity, R H is the relative humidity at 700 hPa, V p o t is the potential intensity defined by Emanuel [56], V s is the magnitude of the vertical wind shear between 200 and 850 hPa, and ω is the 500 hPa vertical p-velocity.
Figure 12 displays the spatial distributions of the GPI and the TC genesis positions in the Augusts of 1998 and 2016, respectively. It is clear that the GPI values over most of the WNP were smaller than 4 in August 1998, and only three TCs formed over the region east of the Philippines near 130° E during early and late August (1st, 5th, and 22th of August), consistent with the position where MJO activity dissipated (Figure 10a and Figure 12a). No TC activity was observed for more than 20 days under the control of descending motion over the WNP, to suppress the precipitation in August 1998 (Figure 7c and Figure 8a,b). This result is consistent with the previous studies because the TCs are generally less active than normal over the WNP in the decaying years of El Niño events [49]. In contrast, the GPI values over most of the WNP were greater than 4 in August 2016. Nine TCs (above the climatology) were generated over the SCS and WNP throughout August. The mean longitude of the TC geneses in 2016 shifted further eastward compared with that in 1998 (seven of nine TCs were generated east of 135° E), which was favorable for the longer lifetime and excessive precipitation of the TCs over the WNP. The TC-induced excessive precipitation over the WNP could have further strengthened the AC via a Gill response.

4. Discussion

In this study, we presented the weak summer upwelling in the El Niño decaying phase (El Niño-upwelling connection), which could have been broken down by the strong intraseasonal variability and the TC activities over the WNP. Although it appears that the subtropical variability (the positive PMM) cannot explain the anomalous cyclone over the SCS and WNP in August 2016, the extension farther eastward of the warm SSTa over the subtropical Pacific could have contributed to offsetting the La Niña-induced WNPAC [57] and additional TCs geneses. It is clearly observed that the WNPAC in July 2016 was weaker than that in July 1998 (Figure 9a,b), which could be attributed to the positive PMM. Thus, in August 2016, the MJO-induced westerly winds over the SCS might have been amplified by the positive PMM. Note that we only compared the impact of the SSTa in the tropical Indian Ocean and Pacific on the zonal winds over the SCS to induce different intensities of upwelling off the coast of southeast Vietnam. We ignored the impact of the atmospheric wave train and the Atlantic Ocean on the abrupt transition of the zonal winds or increased TC geneses over the WNP [58,59], a topic which requires further study in the future.

5. Conclusions

In this study, satellite observation and reanalysis datasets were used to reveal the abnormal strong upwelling off the coast of southeast Vietnam in August 2016, by a comparison with the results in August 1998. The vertical thermohaline structures along the transect of the upwelling system showed that stronger vertical upward motion associated with offshore currents, and enhanced coastal vertical mixing associated with weaker surface stratification, occurred in the upper 100 m layer off the coast of southeast Vietnam in August 2016, compared with those in 1998. Further analyses showed that strong (weak) wind-driven offshore Ekman transport and Ekman pumping associated with the strong (weak) southwesterly winds contributed to the abnormal strong (weak) upwelling off the coast of southeast Vietnam during August 2016 (1998).
We also compared the large-scale background circulations to explain the regional wind difference over the SCS during these two years. For the SSTa patterns, La Niña and negative IOD events were developing in the tropical oceans during the summers of 1998 and 2016 following super El Niño events. The only significant difference was that a typical positive PMM phase occurred in the central-eastern Pacific during August 2016. For the wind anomaly patterns, an AC (anomalous ascending motion) appeared over the WNP, with strong westerly wind anomalies across the central-southern SCS, which contributed to the strong wind-driven upwelling in August 2016, and vice versa in August 1998. For the precipitation fields, the negative and positive precipitation anomalies were located over the WNP and the MC, respectively, in August 1998. In contrast, the precipitation patterns in August 2016 were opposite of those in 1998, with excessive precipitation over the WNP. We also documented the air–sea variables in the Julys of 1998 and 2016, for comparison with August results. The SSTa patterns in July were similar to those of August, but the AC did not appear over the WNP in August 2016, which indicates that the positive PMM phase could not have been the key factor. Further analyses showed that the MJO-induced westerly winds could have contributed more than 75% of the original zonal winds. Deep convection, related to the MJO, formed in late July and moved eastward across the date line during August 2016. The westerly wind anomalies lagged behind the deep convection by one quarter period, which indicates the response of the zonal wind anomaly to the convective heating anomaly. A simple Gill model revealed that the opposite configurations of precipitation patterns over the WNP and the MC contributed to the opposite zonal winds over the SCS via a Gill response. We also found that nine TCs were generated in a more eastward direction, which is favorable for longer lifetime, greater intensity, and excessive precipitation over the WNP. The TC-induced excessive precipitation over the WNP could have further strengthened the AC via a Gill response. Our results indicate that the joint effects of the active MJO and greater TC activity could have broken down the impact of the El Niño on the SCS and should be considered to improve ENSO-induced SCS ecological environmental prediction.

Author Contributions

Conceptualization, F.X.; Methodology, F.X.; Formal analysis, F.X.; Software, F.X.; Writing—Original draft preparation, F.X.; writing—Review and editing, F.X., Z.W., Y.L., and Y.Z. All authors have read and agreed to the published version of the manuscript.

Funding

This work was supported by the National Natural Science Foundation of China under contract No. 41806027 (F.X.) and the Key Special Project for Introduced Talents Team of Southern Marine Science and Engineering Guangdong Laboratory (Guangzhou) under contract GML2019ZD0301.

Acknowledgments

We thank the two anonymous reviewers for their reviews and useful suggestions which improved the earlier version of the manuscript. We acknowledge Dongxiao Wang of Sun Yat-Sen University (China) for his supporting for the preliminary work.

Conflicts of Interest

The authors declare no conflict of interest.

References

  1. Bakun, A.; Agostini, V.N. Seasonal patterns of wind-induced upwelling/downwelling in the Mediterranean sea. Sci. Mar. 2001, 65, 243–257. [Google Scholar] [CrossRef]
  2. Hu, J.; Wang, X. Progress on upwelling studies in the China seas. Rev. Geophys. 2016, 54, 653–673. [Google Scholar] [CrossRef]
  3. Wyrtki, K. Physical Oceanography of the Southeast Asian Waters; University of California, Scripps Institution of Oceanography: La Jolla, CA, USA, 1961; p. 155. [Google Scholar]
  4. Zhang, Y.; Sperber, K.R.; Boyle, J.S. Climatology and interannual variation of the East Asian winter monsoon: Results from the 1979–95 NCEP/NCAR reanalysis. Mon. Wea. Rev. 1997, 125, 2605–2619. [Google Scholar] [CrossRef]
  5. Gan, J.; Li, H.; Curchitser, E.N.; Haidvogel, D.B. Modeling South China Sea circulation: Response to seasonal forcing regimes. J. Geophys. Res. 2006, 111, C06034. [Google Scholar] [CrossRef]
  6. Wu, R.S.; Li, L. Summarization of study on upwelling system in the South China Sea. J. Oceanogr. Taiwan Strait. 2003, 22, 269–276. (In Chinese) [Google Scholar]
  7. Qu, T. Upper-layer circulation in the South China Sea. J. Phys. Oceanogr. 2000, 30, 1450–1460. [Google Scholar] [CrossRef]
  8. Udarbe-Walker, M.J.B.; Villanoy, C.L. Structure of potential upwelling areas in the Philippines. Deep Sea Res. Part I 2001, 48, 1499–1518. [Google Scholar] [CrossRef]
  9. Chang, Y.L.; Oey, L.Y.; Wu, C.R.; Lu, H.F. Why are there upwellings on the northern shelf of Taiwan under northeasterly winds? J. Phys. Oceanogr. 2010, 40, 1405–1417. [Google Scholar] [CrossRef] [Green Version]
  10. Hong, H.; Chen, C.T.A.; Jiang, Y.; Lou, J.; Chen, Z.; Zhu, J. Source water of two-pronged northward flow in the southern Taiwan Strait in summer. J. Oceanogr. 2001, 67, 385–393. [Google Scholar] [CrossRef]
  11. Wang, D.; Shu, Y.; Xue, H.; Hu, J.; Chen, J.; Zhuang, W.; Zu, T.; Xu, J. Relative contributions of local wind and topography to the coastal upwelling intensity in the northern South China Sea. J. Geophys. Res. Oceans. 2014, 119, 2550–2567. [Google Scholar] [CrossRef]
  12. Roxy, M.K.; Modi, A.; Murtugudde, R.; Valsala, V.; Panickal, S.; Prasanna Kumar, S.; Ravichandran, M.; Vichi, M.; Lévy, M. A reduction in marine primary productivity driven by rapid warming over the tropical Indian Ocean. Geophy. Res. Lett. 2016, 43, 826–833. [Google Scholar] [CrossRef] [Green Version]
  13. Kuo, N.J.; Zheng, Q.; Ho, C.R. Satellite observation of upwelling along the western coast of the South China Sea. Remote Sens. Environ. 2000, 74, 463–470. [Google Scholar] [CrossRef]
  14. Ho, C.R.; Kuo, N.J.; Zheng, Q.; Soong, Y.S. Dynamically active areas in the South China Sea detected from TOPEX/POSEIDON satellite altimeter data. Remote Sens. Environ. 2000, 71, 320–328. [Google Scholar] [CrossRef]
  15. Xie, S.P.; Xie, Q.; Wang, D.; Liu, W.T. Summer upwelling in the South China Sea and its role in regional climate variations. J. Geophys. Res. Ocean. 2003, 108. [Google Scholar] [CrossRef] [Green Version]
  16. Gan, J.; Qu, T. Coastal jet separation and associated flow variability in the southwest South China Sea. Deep Sea Res. Part I 2008, 55, 1–19. [Google Scholar] [CrossRef]
  17. Zu, T.; Wang, D.; Wang, Q.; Li, M.; Wei, J.; Geng, B.; He, Y.; Chen, J. A revisit of the interannual variation of the South China Sea upper layer circulation in summer: Correlation between the eastward jet and northward branch. Clim. Dynam. 2020, 54, 457–471. [Google Scholar] [CrossRef]
  18. Dippner, J.J.W.; Nguyen, K.K.V.; Hein, H.; Ohde, T.; Loick, N. Monsoon-induced upwelling off the Vietnamese coast. Ocean. Dynam. 2007, 57, 46–62. [Google Scholar] [CrossRef]
  19. Wang, D.; Wang, H.; Li, M.; Liu, G.; Wu, X. Role of Ekman transport versus Ekman pumping in driving summer upwelling in the South China Sea. J. Ocean. Univ. China 2013, 12, 355–365. [Google Scholar] [CrossRef]
  20. Hein, H.; Hein, B.; Pohlmann, T.; Long, B.H. Inter-annual variability of upwelling off the South-Vietnamese coast and its relation to nutrient dynamics. Global Planet. Change 2013, 110, 170–182. [Google Scholar] [CrossRef]
  21. Liu, X.; Wang, J.; Cheng, X.; Du, Y. Abnormal upwelling and chlorophyll-a concentration off South Vietnam in summer 2007. J. Geophys. Res. Ocean. 2012, 117. [Google Scholar] [CrossRef] [Green Version]
  22. Xie, S.P.; Hu, K.; Hafner, J.; Tokinaga, H.; Du, Y.; Huang, G.; Sampe, T. Indian Ocean capacitor effect on Indo–western Pacific climate during the summer following El Niño. J. Clim. 2009, 22, 730–747. [Google Scholar] [CrossRef]
  23. Isoguchi, O.; Kawamura, H. MJO-related summer cooling and phytoplankton blooms in the South China Sea in recent years. Geophy. Res. Lett. 2006, 33. [Google Scholar] [CrossRef]
  24. Xie, S.P.; Chang, C.H.; Xie, Q.; Wang, D. Intraseasonal variability in the summer South China Sea: Wind jet, cold filament, and recirculations. J. Geophys. Res. Ocean. 2007, 112. [Google Scholar] [CrossRef]
  25. Xiao, F.; Zeng, L.; Liu, Q.Y.; Zhou, W.; Wang, D. Extreme subsurface warm events in the South China Sea during 1998/99 and 2006/07: Observations and mechanisms. Clim. Dynam. 2018, 50, 115–128. [Google Scholar] [CrossRef]
  26. Wang, D.; Xie, Q.; Du, Y.; Wang, W.; Chen, J. The 1997–1998 warm event in the South China Sea. Chin. Sci. Bull. 2002, 47, 1221–1227. [Google Scholar]
  27. Xiao, F.; Wang, D.; Zeng, L.; Liu, Q.Y.; Zhou, W. Contrasting changes in the sea surface temperature and upper ocean heat content in the South China Sea during recent decades. Clim. Dynam. 2019, 53, 1597–1612. [Google Scholar] [CrossRef]
  28. Xiao, F.; Wang, D.; Yang, L. Can tropical Pacific winds enhance the footprint of the Interdecadal Pacific Oscillation on the upper-ocean heat content in the South China Sea? J. Clim. 2020, 33, 4419–4437. [Google Scholar] [CrossRef] [Green Version]
  29. Paek, H.; Yu, J.Y.; Qian, C. Why were the 2015/2016 and 1997/1998 extreme El Niños different? Geophy. Res. Lett. 2017, 44, 1848–1856. [Google Scholar] [CrossRef]
  30. Xiao, F.; Wang, D.; Leung, Y.T. Early and extreme warming in the South China Sea during 2015/16: Role of an unusual Indian Ocean dipole event. Geophy. Res. Lett. 2020. [Google Scholar] [CrossRef]
  31. Tang, D.; Kawamura, H.; Shi, P.; Takahashi, W.; Guan, L.; Shimada, T.; Sakaida, F.; Isoguchi, O. Seasonal phytoplankton blooms associated with monsoonal influences and coastal environments in the sea areas either side of the Indochina Peninsula. J. Geophys. Res. Biogeosci. 2006, 111. [Google Scholar] [CrossRef]
  32. Lu, W.; Oey, L.Y.; Liao, E.; Zhuang, W.; Yan, X.; Jiang, Y. Physical modulation to the biological productivity in the summer Vietnam upwelling system. Ocean. Sci. 2018, 14, 1303–1320. [Google Scholar] [CrossRef] [Green Version]
  33. Reynolds, R.W.; Smith, T.M.; Liu, C.; Chelton, D.B.; Casey, K.S.; Schlax, M.G. Daily high-resolution-blended analyses for sea surface temperature. J. Clim. 2007, 20, 5473–5496. [Google Scholar] [CrossRef]
  34. Sathyendranath, S.; Grant, M.; Brewin, R.J.W.; Brockmann, C.; Brotas, V.; Chuprin, A.; Doerffer, R.; Dowell, M.; Farman, A.; Groom, S.; et al. ESA Ocean Colour Climate Change Initiative (Ocean_Colour_cci): Version 3.1 Data; Technical Report; Centre for Environmental Data Analysis: Harwell, UK, 2018. [Google Scholar]
  35. Carton, J.A.; Chepurin, G.A.; Chen, L. SODA3: A new ocean climate reanalysis. J. Clim. 2018, 31, 6967–6983. [Google Scholar] [CrossRef]
  36. Kalnay, E.; Kanamitsu, M.; Kistler, R.; Collins, W.; Deaven, D.; Gandin, L.; Iredell, M.; Saha, S.; White, G.; Woollen, J.; et al. The NCEP/NCAR 40-Year Reanalysis Project. Bull. Am. Meteorol. Soc. 1996, 77, 437–472. [Google Scholar] [CrossRef] [Green Version]
  37. Xie, P.; Arkin, P.A. Global precipitation: A 17-year monthly analysis based on gauge observations, satellite estimates, and numerical model outputs. Bull. Am. Meteorol. Soc. 1997, 78, 2539–2558. [Google Scholar] [CrossRef]
  38. Liebmann, B.; Smith, C.A. Description of a complete (interpolated) outgoing longwave radiation dataset. Bull. Am. Meteorol. Soc. 1996, 77, 1275–1277. [Google Scholar]
  39. Chu, J.H.; Sampson, C.R.; Levine, A.S.; Fukada, E. The Joint Typhoon Warning Center tropical cyclone best tracks 1945–2000. In Joint Typhoon Warning Center Rep., Ref. NRL/MR/7540-02-16; Naval Research Laboratory: Washington, DC, USA, 2002. [Google Scholar]
  40. Pickett, M.H.; Paduan, J.D. Ekman transport and pumping in the California Current based on the US Navy’s high—Resolution atmospheric model (COAMPS). J. Geophys. Res. Ocean. 2003, 108, 3327. [Google Scholar] [CrossRef]
  41. Smith, R.L. Upwelling. Oceanogr. Mar. Biol. An. Annu. Rev. 1968, 6, 11–46. [Google Scholar]
  42. Larkin, N.K.; Harrison, D.E. On the definition of El Niño and associated seasonal average US weather anomalies. Geophy. Res. Lett. 2005, 32. [Google Scholar] [CrossRef]
  43. Saji, N.H.; Goswami, B.N.; Vinayachandran, P.N.; Yamagata, T. A dipole mode in the tropical Indian Ocean. Nature 1999, 401, 360–363. [Google Scholar] [CrossRef]
  44. Bakun, A. Coastal Upwelling Indices, West Coast of North America, 1946–1971. In US Dept. Commerce NOAA Tech. Rep. National Marine Fishery Service (NMFS)–Special Scientific Report; Fisheries (SSRF): Seattle, WA, USA, 1973; pp. 1–103. [Google Scholar]
  45. Behrenfeld, M.J.; O’Malley, R.T.; Siegel, D.A.; McClain, C.R.; Sarmiento, J.L.; Feldman, G.C.; Milligan, A.J.; Falkowski, P.G.; Letelier, R.M.; Boss, E.S. Climate-driven trends in contemporary ocean productivity. Nature 2006, 444, 752–755. [Google Scholar] [CrossRef]
  46. Dave, A.C.; Lozier, M.S. Examining the global record of interannual variability in stratification and marine productivity in the low-latitude and mid-latitude ocean. J. Geophys. Res. Ocean. 2013, 118, 3114–3127. [Google Scholar] [CrossRef]
  47. Yoshida, K. Coastal upwelling off the California coast. Rec. Oceanogr. Work Jpn. 1955, 2, 8–20. [Google Scholar]
  48. Chiang, J.C.H.; Vimont, D.J. Analogous Pacific and Atlantic meridional modes of tropical atmosphere–ocean variability. J. Clim. 2004, 17, 4143–4158. [Google Scholar] [CrossRef]
  49. Zhan, R.; Wang, Y.; Liu, Q. Salient differences in tropical cyclone activity over the western North Pacific between 1998 and 2016. J. Clim. 2017, 30, 9979–9997. [Google Scholar] [CrossRef]
  50. Lindzen, R.S.; Nigam, S. On the role of sea surface temperature gradients in forcing low-level winds and convergence in the tropics. J. Atmos. Sci. 1987, 44, 2418–2436. [Google Scholar] [CrossRef] [Green Version]
  51. Matsuno, T. Quasi-geostrophic motions in the equatorial area. J. Meteorol. Soc. Jpn. Ser. II 1966, 44, 25–43. [Google Scholar] [CrossRef] [Green Version]
  52. Gill, A. Some simple solutions for heat-induced tropical circulation. Q. J. Roy. Meteorol. Soc. 1980, 106, 447–462. [Google Scholar] [CrossRef]
  53. Xing, N.; Li, J.; Li, Y.K. A theoretical explanation of anomalous atmospheric circulation associated with ENSO Modoki during boreal winter. Atmos. Ocean. Sci. Lett. 2014, 7, 352–357. [Google Scholar]
  54. Zhang, Y.; Li, J.; Xue, J.; Feng, J.; Wang, Q.; Xu, Y.; Wang, Y.; Zheng, F. Impact of the South China Sea summer monsoon on the Indian Ocean dipole. J. Clim. 2018, 31, 6557–6573. [Google Scholar] [CrossRef]
  55. Murakami, H.; Wang, B.; Kitoh, A. Future change of western North Pacific typhoons: Projections by a 20-km-mesh global atmospheric model. J. Clim. 2011, 24, 1154–1169. [Google Scholar] [CrossRef] [Green Version]
  56. Emanuel, K. A statistical analysis of tropical cyclone intensity. Mon. Wea. Rev. 2000, 128, 1139–1152. [Google Scholar] [CrossRef]
  57. Zhang, W.; Vecchi, G.A.; Murakami, H.H.; Villarini, G.G.; Jia, L. The Pacific meridional mode and the occurrence of tropical cyclones in the western North Pacific. J. Clim. 2016, 29, 381–398. [Google Scholar] [CrossRef]
  58. Chen, G.; Wang, K. Why is the tropical cyclone activity over the western North Pacific so distinct in 2016 and 1998 following super El Niño events? J. Meteorol. Soc. Jpn. Ser. II 2018. [Google Scholar] [CrossRef] [Green Version]
  59. Yu, J.; Li, T.; Tan, Z.; Zhu, Z. Effects of tropical North Atlantic SST on tropical cyclone genesis in the western North Pacific. Clim. Dynam. 2016, 46, 865–877. [Google Scholar] [CrossRef]
Figure 1. Time series of monthly Niño3.4 index (black solid line) and dipole mode index (shading) during 1982–2018. Red lines indicate August 1998 and August 2016.
Atmosphere 11 00940 g001
Figure 2. Spatial distribution of monthly sea surface temperature (SST) (units: °C) in 1998. (a)–(c) Correspond to June to August. (d)–(f) Same as in (a)–(d) but for the results in 2016. (g)–(i) Same as in (a)–(c) but for the results of the spatial distribution of monthly Chl-a concentration (units: mg/m3). (j)–(l)Same as in (g)–(i) but for the results in 2016.
Atmosphere 11 00940 g002
Figure 3. Relationship of August upwelling index (negative means offshore Ekman transport) and D(0)JF(+1) Niño3.4 index. Red line and black line indicate the linear fitting with, and without, 2015/16, respectively.
Atmosphere 11 00940 g003
Figure 4. Spatial distribution of mixed-layer temperature (shading, units: °C) during August in (a) 1998 and (b) 2016. Black line in (b) indicates the transect 107.75°–113.75° [email protected]° N. Vertical velocity (shading, units: 10−4 m/s) along the transect during August in (c) 1998 and (d) 2016.
Atmosphere 11 00940 g004
Figure 5. Temperature along the transect during August in 1998 (contour, units: °C) and 2016 (shading, units: °C). (b) Same as in (a) but for the results of salinity (units: psu). (c) Same as in (a) but for the results of density (units: kg/m3). (d) Spatial distribution of the mixed-layer horizontal currents during August in 1998 (red vector, units: m/s) and 2016 (black vector, units: m/s).
Atmosphere 11 00940 g005
Figure 6. Spatial distribution of wind stress (vector, units: N/m2) and wind-driven Ekman pumping velocity (shading, units: 10−4 m/s) during August in 1998. (b) Same as in (a) but for the results in 2016. Blue stars indicate the coastal points at which we calculate the Ekman transport and Ekman pumping. (c) Comparison of the August offshore Ekman transport and Ekman pumping integrated along the coastal grid in 1998 and 2016.
Atmosphere 11 00940 g006
Figure 7. August SST anomalies (SSTa) (shading, units: °C) and surface wind (vector, units: m/s) anomalies in (a) 1998 and (b) 2016. (c)–(d) Same as in (a)–(b) but for the results of the rainfall anomalies (shading, units: mm/day). Red and blue rectangles in (c)–(d) indicate the excessive and suppressed precipitation, respectively.
Atmosphere 11 00940 g007
Figure 8. (a) The 200-hPa velocity potential anomalies (shading, units: 10−6 m2/s) and divergent wind anomalies (vectors, units: m/s) in August 1998. (b) The 500-hPa vertical pressure velocity anomalies in August 1998 (shading, units: Pa/s). (c)–(d) Same as in (a)–(b) but for the results in August 2016.
Atmosphere 11 00940 g008
Figure 9. Same as in Figure 7 but for the results in July.
Atmosphere 11 00940 g009
Figure 10. Hovmöller diagram of 30–60 day filtered outgoing longwave radiation (OLR) (shading, units: W/m2) and 850 hPa zonal wind (contour, units: m/s) averaged from 5° N to 15° N in (a) 1998 and (b) 2016.
Atmosphere 11 00940 g010
Figure 11. Heating patterns associated with convective latent heating over the western North Pacific (WNP) and Maritime Continent (MC) during August in (a) 1998 and (b) 2016. (c)–(d) Same as in (a)–(b) but for the results of the horizontal winds from the Gill model in response to the heating pattern in (a) and (b).
Atmosphere 11 00940 g011
Figure 12. Spatial distribution of the genesis potential index (GPI) (shading) and the tropical cyclone (TC) geneses positions during August in (a) 1998 and (b) 2016.
Atmosphere 11 00940 g012

