Article

Behaviors of Chromium in Coal-Fired Power Plants and Associated Atmospheric Emissions in Guizhou, Southwest China

1
College of Resources and Environment, Zunyi Normal University, Zunyi 563006, China
2
State Key Laboratory of Environmental Geochemistry, Institute of Geochemistry, Chinese Academy of Sciences, Guiyang 550081, China
3
University of Chinese Academy of Sciences, Beijing 100049, China
*
Author to whom correspondence should be addressed.
Atmosphere 2020, 11(9), 951; https://doi.org/10.3390/atmos11090951
Submission received: 30 June 2020 / Revised: 29 August 2020 / Accepted: 3 September 2020 / Published: 6 September 2020
(This article belongs to the Special Issue Air Pollution Estimation)

Abstract

:
Coal burning is a main concern for a range of atmospheric pollutants, including the environmentally sensitive element chromium (Cr). Cr migrates to the environment through stack emissions and can leach out from solid coal-burning byproducts, thereby causing adverse effects on the ecosystem. In this study, atmospheric emissions of Cr from six coal-fired power plants (CFPPs), as well as the distribution of Cr inside these CFPPs in Guizhou Province, Southwest China, were investigated. Among the six CFPPs, one was a circulating fluidized bed boiler and the others were pulverized coal boilers. The results showed that Cr in the feed fuel of these CFPPs ranged from 39.5 to 101.5 mg·kg−1 (average: 68.0 ± 24.8 mg·kg−1) and was approximately four times higher than the national and global average. Cr in the feed fuel correlated significantly with the ash yield, demonstrating that Cr in coal is closely associated with ash-forming minerals. After the coal combustion and the treatment by different air pollution control devices, most Cr (>92%) in the installation was retained in the captured fly ash and bottom ash, with less as gypsum (0.69–7.94%); eventually, only 0.01–0.03% of Cr was emitted into the atmosphere with a concentration of 1.4–2.2 μg·Nm−3. The atmospheric emission factors of Cr for these utility boilers were as low as 14.86 ± 3.62 mg Cr·t−1 coal, 7.72 ± 2.53 μg Cr (kW·h)−1, and 0.70 ± 0.19 g Cr·TJ−1, respectively. About 981 kg·y−1 of Cr was discharged into the atmosphere from Guizhuo’s CFPPs in 2017, much lower than previous reported values. Most of the Cr in the CFPPs ended up in solid combustion products, identifying the need for the careful disposal of high-Cr-containing ashes (up to 500 mg·kg−1) to prevent possible mobilization into the environment.

1. Introduction

Coal-fired power plants (CFPPs) are the largest coal consumers and the main energy source in China [1,2], which released huge masses of pollutants into the atmosphere each year, including hazardous trace metals and metalloids [3,4]. Hazardous trace metals that exist in coal, such as chromium (Cr), can migrate via and enrich coal combustion products (CCPs) during the coal combustion process, causing adverse effects on human health and the environment when released [5]. Inhalation cancer and non-cancer risks associated with chromium emissions from coal-burning are large compared with other elements [6], with it being identified as a hazardous pollutant in the USA 1990 Clean Air Act Amendments [7], in the Canadian Environmental Protection Act 1995 [6], and a hazardous atmospheric pollutant by the Chinese Ministry of Ecology and Environment [8]. Chromium (Cr), arsenic (As), and mercury (Hg) are the three elements recommended by the USA Electric Power Research Institute to be monitored in emissions, concerning carcinogenic and non-carcinogenic health risks [6]. However, compared to studies on Hg and As [9,10,11,12,13], studies regarding Cr emissions from CFPPs and the associated environmental impacts are limited, especially in China, which is the top coal consumer in the world [1].
Cr exists at trace levels in coal, with a typical range of 0.5–60 mg·kg−1 [14]. Cr in coal is likely to be associated with clays (mainly illite) [15] or silicate matter [16], but is also present as Cr-oxy-hydroxides in organic matter [15] or as sulphides [15,17]; it is also associated with spinel group minerals (Fe(Cr,Al)2O4)) such as chromite (FeCr2O4) and chromian magnetite [15]. The volatility of Cr varies with the mode of occurrence of Cr in coals, with organic/sulphide-bound Cr partially evaporating as gaseous CrO3 (g) during coal combustion, which is then stabilized with calcium oxide or other alkaline elemental oxides to form CaCrO4 or (Mg, K, Na, Fe)CrO4 (s) on the ash surface [17]. Huang et al. [18] found that Cr adsorption on fly ash is mainly chemisorption and the main Cr species is Cr2O3 at low temperatures (227 °C), which may react with CaO in fly ash to form CaO·Cr2O3. Chlorine facilitates this evaporation process, with the volatilization of Cr previously observed at >700 °C [19]. Although Cr in coal is trivalent (Cr(III)), which is relatively benign, the combustion process can convert some of Cr(III) to its more toxic form, the carcinogenic hexavalent (Cr(VI)) [20]. Furthermore, Cr exists in its organic form, with pulverized coal (PC) boiler combustion transforming more Cr(III) to Cr(VI) than the mineral-bound Cr and other boilers (circulating fluidized bed (CFB) boiler and stoker-fired boiler) [20,21]. In China, the contamination of surface water (e.g., upstream Zhujiang River) by leaching of Cr(VI) from industrial solid waste occurred in Yunnan province in 2011, which attracted wide attention.
In China, 47% of the total coal consumption (3.84 billion tons) in 2016 was by the direct combustion in power plants [2]. Although Cr concentration in coal is at trace levels, the large quantities of coal combustion result in enormous emission of Cr into the environment; 505 tons of Cr emissions from Chinese CFPPs were estimated in 2010 based on the emission factor method [22]. However, no onsite research was carried out regarding this topic in China until recently [23,24,25], with all of them conducted in North China. Guizhou Province is the fifth largest coal-bearing province and the largest in terms of production in South China [1]. Coal in Guizhou is mainly formed in Late Permian, with higher ash yields and sulfur contents than other parts of China [11,26]. In 2017, the output of coal was 163 million tons, with 66 million tons consumed by CFPPs in this province [27]. Although Cr contents in coal in this province were studied by several researchers [28,29], little is known about the behaviors of this element inside CFPPs in Guizhou and its atmospheric emissions.
To fill this research gap, we investigated six CFPPs with pulverized coal-fired boilers (PC) or circulating fluidized bed (CFB) boilers in Guizhou, with feed fuel, bottom ash, fly ash, limestone, gypsum, and stack flue gas collected simultaneously. The main purposes of this study were to (1) reveal the distribution behavior of Cr in these CFPPs, (2) to obtain the atmospheric emission factors of Cr, (3) and to estimate the total amount of Cr emitted from CFPPs in Guizhou. This study aims to provide a database for the assessment of the impact of Cr pollution, which would be conducive to environmental management and policy formulation.

2. Methodology

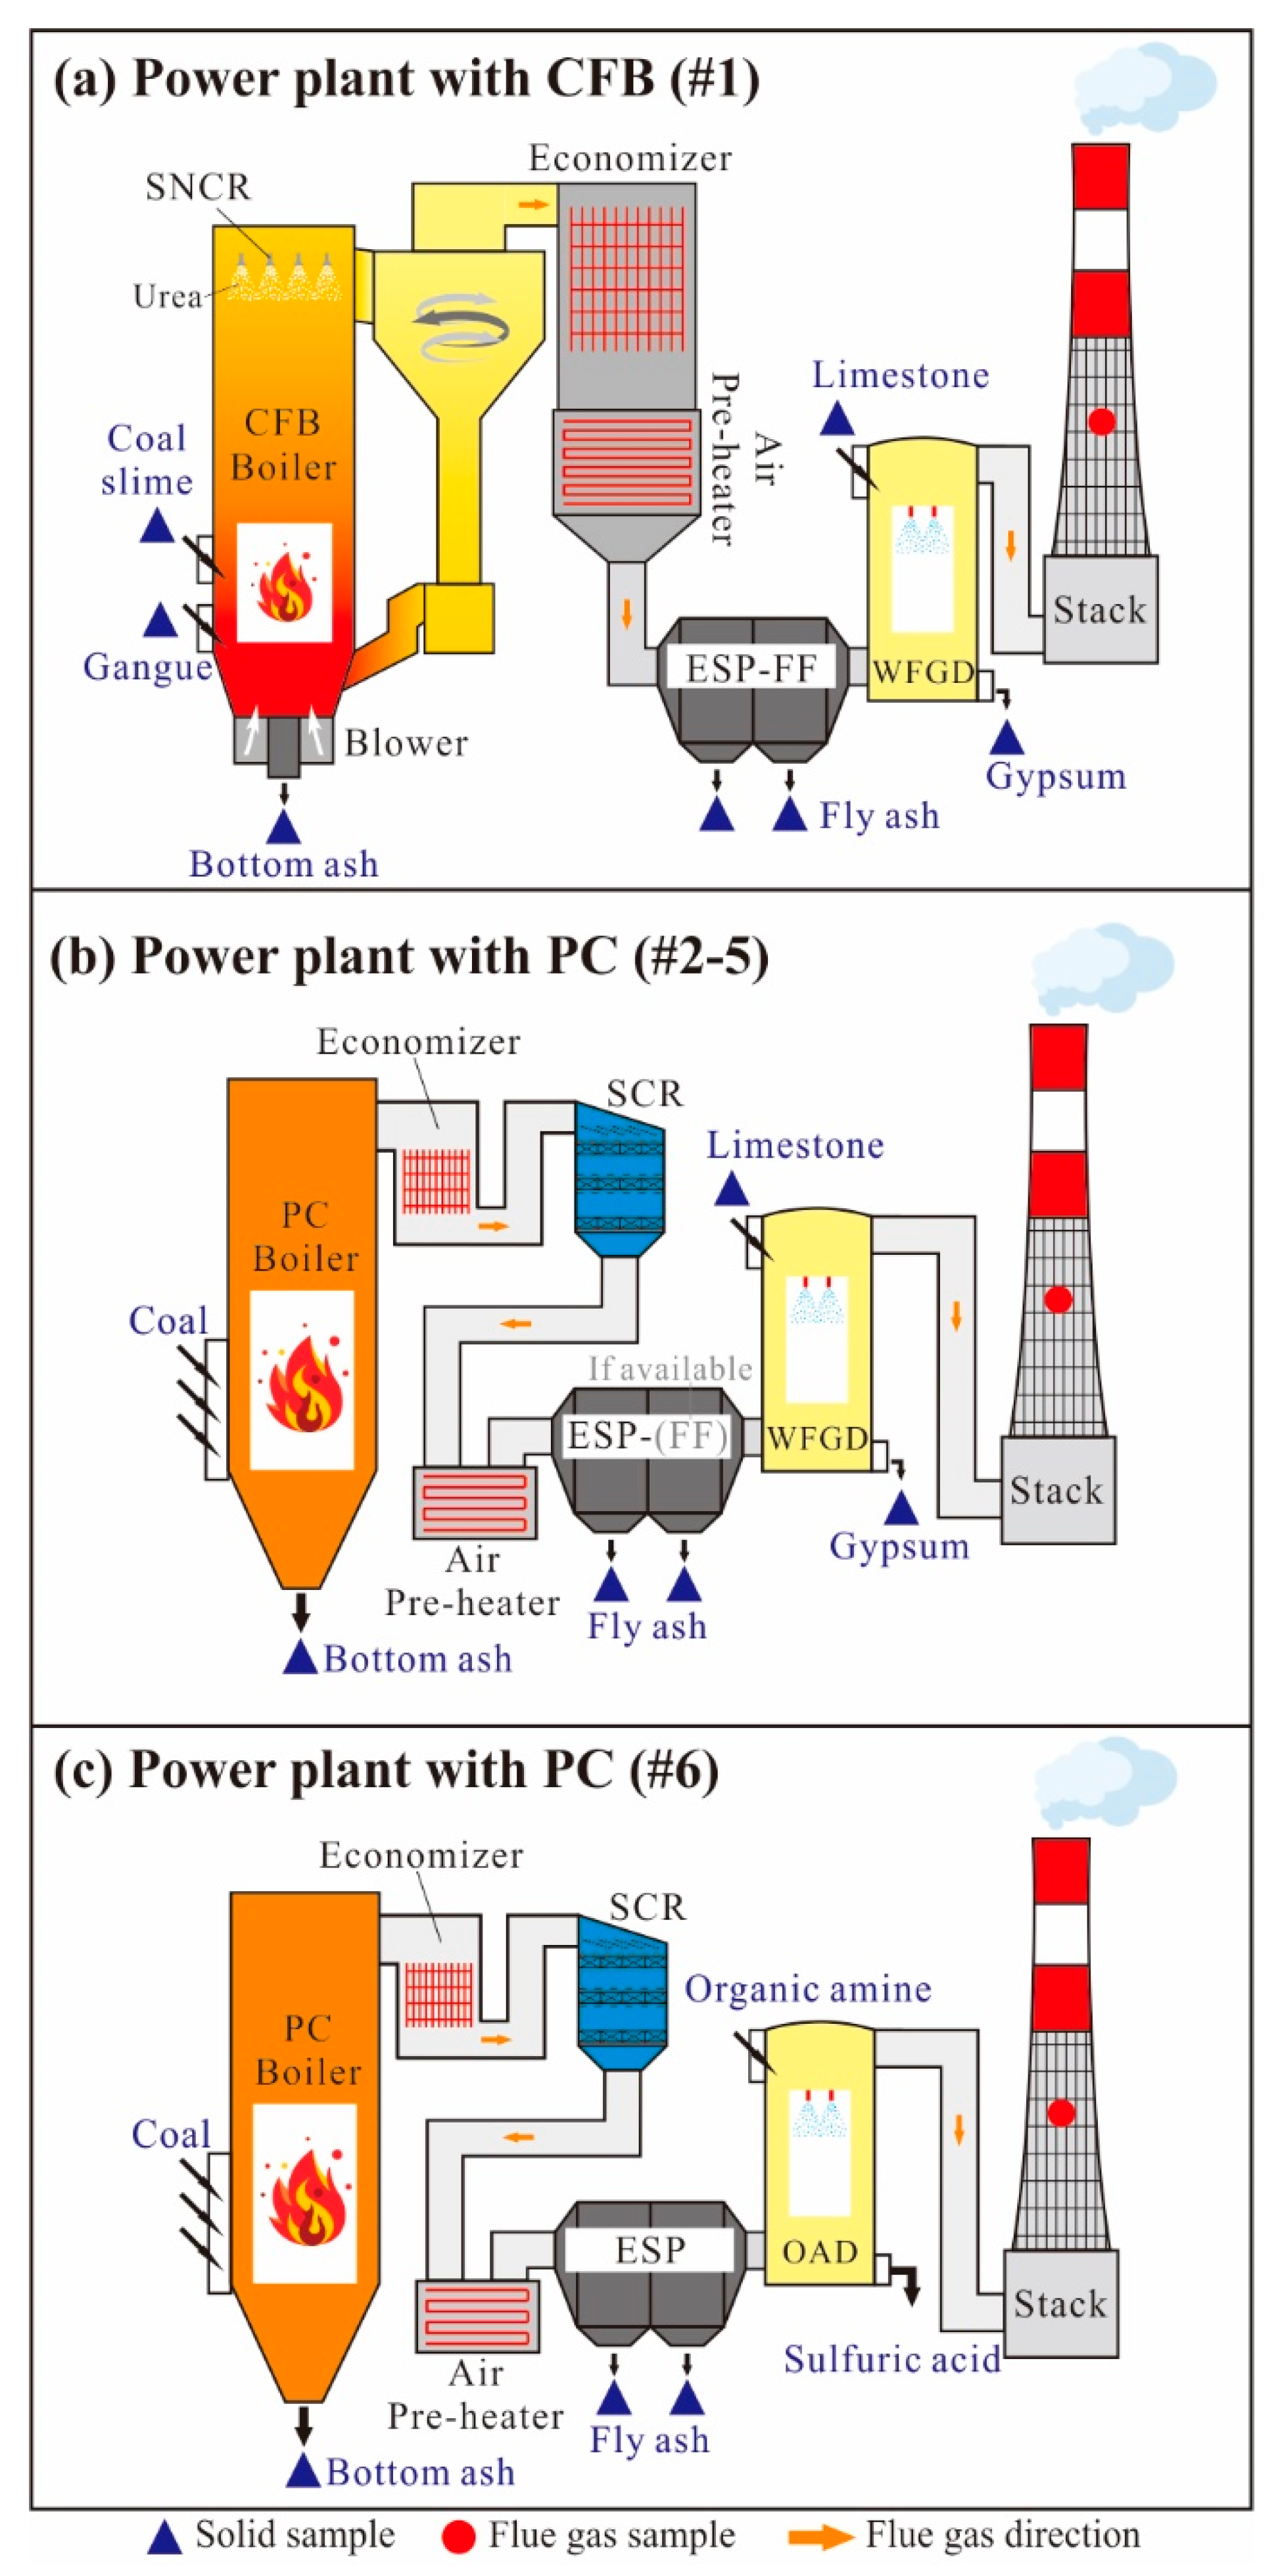
2.1. Power Plants and Sample Collection

Guizhou is the largest coal-bearing province in South China (Figure 1). Twenty coal-fired power plants in total were operating in this province in 2016 with an installation of 30.1 GW, of which two were CFB CFPPs and 18 were PC CFPPs. Most CFPPs were located in the central to western province where the coal mines are located (Figure 1). Six CFPPs, with 28% of the provincial installed capacity, were selected for investigation in this research; their locations are shown in Figure 1. Among them, four (#1–#4) are located in Western Guizhou, one is in Northwestern Guizhou (#5), and one is in Central Guizhou (#6). All of the CFPPs use local unwashed coal, except CFPP#1, which uses gangue and coal slime from the local coal preparation plant. The boiler type is either CFB (#1) or PC (#2–6), with a capacity from 200 MW to 600 MW. All CFPPs are equipped with air pollution control devices for NOx, SO2, and particulate matter (PM) (Table 1). In particular, NOx is controlled by selective catalytic reduction (SCR) for #2–#6, and selective non-catalytic reduction (SNCR) for #1. Cold-side electrostatic precipitators (ESP) or ESP–fabric filter (FF) are used for dust removal, and limestone–gypsum wet flue gas desulfurization (WFGD) is used for SO2 treatment for all CFPPs except #6, which uses organic amino desulfurization to convert SO2 into H2SO4.
In each CFPP, only one unit was sampled since the feed coal, boiler type and air pollution control devices (APCDs) are the same for all units. Solid samples, including the feed coal, bottom ash, ESP/ESP–FF fly ash, limestone, and gypsum, were collected simultaneously alongside the stack flue gas; the sampling points are shown in Figure 2. All samples were collected at least three times over a period of 2–3 days, with each solid sample weighing about 1 kg. The wastewater of WFGD was not collected since its contribution to the total output of Cr is negligible [25,31]. In addition, organic amine and sulfuric acid in CFPP#6 were not obtained for inaccessibility reasons. The vapor phase of Cr is thought not to exist at low temperatures (40–50 °C) of stack gas, so the gaseous phase Cr was not collected; the particulate-bound Cr in the stack gas was collected instead. PM in stack gas was withdrawn isokinetically by using the USA EPA Method 5 [32] as shown in Figure S1 in the Supplementary Materials and collected using a Teflon filter (Whatman®, 0.45 μm pore size) for Cr analysis. Each flue gas sample was collected for ~3 h. This method collected most of the PM in the flue gas since the PM size is generally greater than 1 μm [33]. During the flue gas sampling, the sampling tubing was maintained at 120 ± 10 °C to prevent water condensation [32].
In addition, the operating parameters of each boiler were gathered, comprising information about the daily consumption/production of different solid materials (t·d−1), the daily discharge of flue gas (Nm3·d−1, cubic meter at normal conditions (0 °C and 1.01 MPa) per day), the concentration of PM in the stack flue gas (mg·Nm−3), and the load of the boiler (megawatt, MW), which was monitored by the online monitoring system.

2.2. Analysis Methods

In the laboratory, all solid materials were air-dried and ground to <150 μm. For the feed fuel samples, proximate analysis was accomplished after the implementation of the Chinese National Standard Method (GB/T 212-2008) [34] and ultimate analysis of carbon (C), hydrogen (H), and nitrogen (N) were conducted using an elemental analyzer (Vario MACRO Cube, Elementar, Germany), while the total sulfur (S) was measured following the Eschka method of GB/T 214-2007 [35]. The calorific value (Q) was quantified by GB/T 213-2008 [36]. The Cr concentration of different solid samples was determined by inductively coupled plasma mass spectrometry (ICP–MS, Analytik Jena, Germany) after digestion with a mixture of hydrofluoric acid (HF) and nitric acid (HNO3) at 190 °C in an oven for 24 h [37].

2.3. Quality Assurance and Quality Control

The glassware, Teflon tubing and vessels used for sampling and sample digestion were soaked in 20% nitric acid overnight and rinsed with deionized water. The reagents used were trace metal grade, and HF and HNO3 were double-distillated to remove impurities. During the digestion and analysis process, system blanks, duplicate samples, and certified reference materials (CRMs) were used to ensure quality assurance and quality control. CRMs for coal gangue (GSB 06-2182-2008-1), anthracite (GSB 06-2105-2007) and bituminous coal (GSB 06-2114-2007) were used during the proximate and ultimate analysis, and a recovery of 95–105% for different parameters was obtained. The CRMs of Coal (NIST SRM 1632d), fly ash (NIST SRM 1633c), and limestone (JDO-1) were digested and analyzed along with the solid samples, and the recovery of Cr in different CRMs was determined to be in the range of 91.7–113.8% (Table S1). The difference between the duplicate samples was less than 10%, and the analytical process blank was negligible (<0.1 mg/kg).

2.4. Relative Enrichment Index and Atmospheric Emission Factor of Chromium

2.4.1. Relative Enrichment Index

The relative enrichment index (REI) was calculated according to Wang et al. [5] to reveal the enrichment Cr between the bottom ash and fly ash during the combustion process, where a higher REI indicated the stronger enrichment capacity of Cr in the ash. The REI was calculated according to Equation (1):
R E I   =   C a s h C r × A a d C c o a l C r × 100
where C a s h C r is the Cr concentration in the bottom ash or fly ash (mg·kg−1), A a d is the ash yield (%) of the feed coal, and C C o a l C r is the Cr concentration in the feed coal (mg·kg−1). If the REI is close to 1, the element has almost no volatilization in the process of coal combustion and basically remains in the coal combustion products [5]. The closer the REI is to zero, the more volatilization of the element, and the less is retained in the solid coal combustion products. According to REI, elements were classified into three groups [38], i.e., Group I, non-volatile; Group II, partially volatile; and Group III, volatile (Table S2). Since the PM in the flue gas after WFGD (e.g., stack gas) can mix with other impurities, such as gypsum and limestone [38], which constitute up to 55% of the total mass [39], the REI of PM in the stack gas was not calculated in this study.

2.4.2. Atmospheric Emission Factors

Emission factors (EMFs) of Cr were calculated based on three benchmarks [40,41], namely, the amount of coal consumption (EMF1), the generated power (EMF2), and the heat value of feed fuel (EMF3), using Equations (2)–(4):
E M F 1   =   M Cr M coal
E M F 2   =   M Cr P × t
E M F 3   =   M C r M c o a l × Q n e t , a d
where MCr is the quantity of Cr emitted into the atmosphere per day (g·d−1), Mcoal is the consumption of the feed coal (t·d−1), P is the load of tested boiler (MW), t is the running time of a utility boiler (24 h·d−1), and Qnet,ad is the heat value of the feed coal (MJ·kg−1).

3. Results and Discussion

3.1. Proximate and Ultimate Analysis of the Feed Coal

The proximate and ultimate analysis results of the feed fuels of the six CFPPs are summarized in Table 2. Fuel used in the CFB boiler (CFPP#1) was characterized by a higher moisture content (2.89–9.06%), higher ash yield (43.94–45.15%), lower fixed carbon (29.47–33.19%), and lower calorific value (17.03–19.29 MJ·kg−1) compared to CFPPs #2–#6 with PC. In general, the coal quality used in PC boilers (moisture content: 0.66–1.43%; ash yield: 30.68–45.73%; fixed carbon: 37.09–51.73%; calorific values: 19.19–24.47 MJ·kg−1) was better than that of the CFB boiler. Moreover, the total sulfur in the feed coal of CFPPs #2, #3, #5, and #6 were as high as 1.37–3.82% (average: 2.78%), which are grouped into medium-to-high sulfur content (2.01–3.00%) according to GB/T 15224.2-2010 [42]; these values were much higher than those of CFPPs #1 and #4 (0.29–0.64%). The calorific value of the feed coals of the six CFPPs ranged from 17.03 to 24.47 MJ·kg−1 with an average of 20.98 MJ·kg−1, which were classified into low-to-middle calorific coal (16.7–21.3 MJ·kg−1) according to GB/T 15224.3-2010 [43]. In addition, the coal used in the six CFPPs belonged to medium-to-high ash coal (average: 39.34%) according to GB/T 15224.1-2018 (30.01–40.00%) [44]. The range of chlorine in the feed fuels was 169–499 mg·kg−1 with an average of 256 ± 104 mg·kg−1, which was close to the national average (255 mg·kg−1, [45]) and belonged to ultra-low (<500 mg·kg−1) chlorine coal according to GB/T 20475.2-2006 [46]. Overall, the feed fuels featured high ash yield, low–medium calorific value, and with high sulfur contents for some, with generally poor coal quality.
Cr concentrations in the feed fuel of the six CFPPs ranged from 39.5 to 101.5 mg·kg−1, with higher values for CFPP #1 and #3 (85.6–101.5 mg·kg−1) than other CFPPs (39.5–68.6 mg·kg−1). The average Cr concentration in the feed fuel of the six CFPPs was 68.0 ± 24.8 mg·kg−1, about four times higher than the global average of 16 mg·kg−1 [47] and Chinese coal (15.4 mg·kg−1, [45]) and twice that of Western Guizhou coal (32 mg·kg−1, [29]) (Figure 3), but similar to the arithmetic average of Guizhou’s coal (59.7 ± 61.0 mg·kg−1, No. = 107, internal unpublished data) (Figure 1). To disclose the enrichment of Cr in the feed coals of these CFPPs, a ratio of Cr concentration in the feed coal to the national average (15.4 mg·kg−1, EF1) or the provincial average (59.7 mg·kg−1, EF2) was calculated [5]. If the EF was less than 0.5, the concentration level was considered to be low, whereas if 0.5 < EF < 2, it was considered to be at a normal level, and EF > 2 indicated a high concentration level [5]. Cr in the feed coal of all investigated CFPPs demonstrated high EF1 values of 2.6–6.6, indicating the obvious enrichment of Cr compared to the national average. The EF2 values were normal (FE2 = 0.7–1.7) regarding Guizhou’s average, meaning the feed coals of these CFPPs were highly representative of Guizhou’s coal. Cr in coal is closely associated with ash-forming minerals, such as clay [48], as demonstrated by the significantly positive correlations between Cr concentration and the ash yield of feed fuel (Figure 4a). Hence, due to a greater ash yield in the feed fuel in the present study (39.34 ± 5.64%) compared to the national average (16.85%) [26], much higher Cr contents were found in the feed fuels versus the national average.
In addition, Cr in feed fuels was found to be closely related (p < 0.01) to vanadium and nickel (Figure 4b,c), indicating these elements have similar geochemical constraints during the coal-forming process. In contrast, sulfur showed an opposite trend with Cr in feed coal (Figure 4d), suggesting that sulfide compounds are not primary constituents of Cr in feed fuel. Other research also indicated similar close relationships between Cr and ash yield, iron, and vanadium in coals obtained from nine provinces in China [16].

3.2. Cr in Bottom Ash, ESP/ESP–FF Fly Ash, Limestone, and Gypsum

Cr concentrations in different solid samples (bottom/fly ash, limestone, and FGD gypsum) collected from the post-combustion process are illustrated in Table 3. A range of Cr concentrations were found for bottom ash (142–550 mg·kg−1) and ESP/ESP–FF fly ash (106–213 mg·kg−1). Comparatively, the Cr concentration was identical for the paired ESP/ESP–FF fly and bottom ash for most CFPPs (#1–#3, #5–#6), and a slight fluctuation in the Cr concentration was observed between bottom ash and fly ash, possibly caused by the fact that fly ash is finer compared with bottom ash, providing more surface area for the condensation of Cr [5], therefore, Cr existing in organic/sulfide-bound form may partially volatilize and coagulate on the surface of fly ash, resulting in higher concentrations in fly ash than in bottom ash. In addition, a possibility is that bottom ash is enriched with iron oxide (e.g., chromite (FeCr2O4), magnetite (Fe3O4), and trevorite (NiFe2O4)) with varying amounts of Cr2O3 and a higher density (4.3–5.2 g·cm−3) than that of fly ash (1.9–2.9 g·cm−3) [5,15,49], thereby resulting in Cr being preferentially retained in the bottom ash. High Cr in coal ash might also stem from the grinding media or as a result of stainless steel erosion of power plant installation, which would result in high Fe-, Cr-, and Ni-containing particles [50]. Since the Fe content was not determined in this study, we checked the concentrations of Cr, V, Co, and Ni in the feed fuels, bottom ash, and captured fly ash in the investigated six and other eight CFPPs in Guizhou (internal unpublished data), as well as the ratios of Cr/Co, Cr/V, and Cr/Ni in these samples. Cr was found to only increase abnormally in the bottom ash (Table S3), with no such Cr increase in fly ash or enrichment of V, Ni, or Co in the bottom/fly ash, therefore allowing the exclusion of the boiler erosion or introduction from grinding media theories. The most probable reason for abnormal high Cr in bottom ash is the occurrence of Cr compounds (e.g., FeCr2O4) in the feed fuel, which are highly dense and are preferentially detained in the bottom ash during coal combustion. In summary, the partitioning of Cr during coal combustion is largely dependent on the occurrence of Cr in the feed coal [18]. The Cr concentration is either higher in the bottom ash than in the fly ash (e.g., CFPP #2, #4, #5, #6), or higher in fly ash than in bottom ash (CFPP#1, #3), and these two situations were both found in other CFPPs worldwide (Table S4). This phenomenon is different to other semi-volatile elements (such as Pb and Cd), which demonstrate consistently higher concentrations (up to seven times higher) in fly ash than bottom ash [51,52]. The astonishingly high Cr contents in bottom ash (550 mg·kg−1) compared to fly ash (106 mg·kg−1) in CFPP#4 may have been caused by the existence of Cr in spinel [49]; similar phenomena were observed in a Canadian CFPP and an American CFPP, where Cr was observed in the feed coal (52 mg·kg−1), bottom ash (344 mg·kg−1), and FF ash (192 mg·kg−1) for the former case [53] and in the feed coal (195 mg·kg−1), bottom ash (374 mg·kg−1), and fly ash (131 mg·kg−1) for the latter case [54]. Hence, coal properties, especially with regard to the occurrence of Cr, are important influencing factors for Cr redistribution between bottom ash and fly ash [6,18]. Although the boiler temperature of the present study (800–1500 °C) caused less impact on the enrichment of Cr in the bottom or fly ash, it significantly affected the enrichment/depletion of semi-volatile elements (e.g., Cd and Pb) in the fly/bottom ash [11,51,52]. In addition, such high Cr in bottom ash has not been reported in China before, suggesting the unique coal properties in Guizhou.
Both Cr concentrations in ESP/ESP–FF fly ash and bottom ash were positively correlated with the Cr in feed coal in most cases (Figure 5), suggesting that Cr in bottom ash and fly ash are dominantly inherited from the feed coal. The average Cr content in the bottom and fly ash in the present study was 197 ± 111 mg·kg−1, much higher than the world average (100 mg·kg−1) [47].
There was considerable overlap between the groups for Cr in a previous study [3], showing that it either belonged to Group II (partial volatile) or Group I (non-volatile). Based on Equation (1), the REI values of Cr in the bottom ash and fly ash were all close to 1 (Table 4), indicating that it belonged to the non-volatile element (namely Group I) according to the classification by Meij [38] (Table S2). The anomalous high REI (4.19) of the bottom ash of CFPP #4 demonstrated the extra enrichment of this element. In addition, the low volatilization of Cr in this study was thought to be due to the presence of high mineral phases in coal, such as aluminosilicates, thereby depressing the volatility of Cr by chemical immobilization and competition with Cl [55], with the latter observed to be low in this study.
Compared with the Cr concentration in feed fuels, fly ash, and bottom ash, the Cr contents in limestone and FGD gypsum were relatively low, with ranges of 2.3–26.9 mg·kg−1 and 24.0–42.0 mg·kg−1, respectively. Generally, the Cr concentration in gypsum was higher than in paired limestone by 10–30 mg·kg−1 (Table 3), indicating that some of the Cr found in the gypsum was introduced by flue gas downstream of the dust collectors.

3.3. Atmospheric Emissions and Mass Balance of Cr

Particulate-bound Cr in the stack gas of the six CFPPs was in the range of 1.4–2.2 μg·Nm−3, with a mean of 1.8 ± 0.3 μg·Nm−3 (Table 5). There were no significant differences in the emitted Cr concentrations between CFB and PC CFPPs. Emission standards for Cr from CFPPs do not exist in China, however, the Integrated Emission Standard of Air Pollutants (GB 16297-1996) [56] enacted by the National Environmental Protection Agency of China in 1996 specified the limit of Cr as 0.08 mg·m−3. Compared to this regulation, Cr emission concentrations from these six CFPPs were far less than the limit. The concentration of Cr in the stack gas observed in this study was in the range determined by previous research (0.44–5.5μg·m−3, [24,25,31,41,57,58,59,60,61] as seen in Table S4), but was much lower than the 55–156 μg·m−3 observed at two CFPPs in the USA which used ESP or venture wet scrubbers (Table S4) [62]. Additionally, particulate matter discharged from the stack flue gas of CFPPs #1-6 was in the range of 10.0–14.8 mg·Nm−3 (average: 12.0 mg·Nm−3), which was slightly higher than a CFPP equipped with an ultra-low emission device of wet ESP (0.48–4.02 mg·Nm−3) [63] and comparable to a CFPP installed with a low–low temperature electrostatic precipitator (<15 mg·Nm−3, [64]). Overall, the PM emitted from these CFPPs was lower than the national emission standard for CFPPs (30 mg·m−3, GB 13223-2011) [65].
Based on the input and output material flow information (Table S5) and Cr concentrations in the various samples discussed above (Table 2, Table 3 and Table 5), the Cr flow in six CFPPs was calculated (Table S6). Basically, the inputs and outputs of Cr were balanced, with an output/input ratio of 95.6–129.7% (Figure 6 and Table S6), well within the acceptable range of 70–130% [59]. The output Cr prevailing over input might be caused by the inhomogeneity of the chemical composition of the combusted fuel and the small sample size in a relative short time period (2–3 days). Feed fuel was shown to be the majority Cr input (>93.62%) (Figure 6 and Table S7) compared to limestone (0.17–6.38%) due to a relatively high Cr concentration and a large feed fuel consumption volume (Table 3 and Table S5). For the Cr output, the average proportion of Cr in the ESP/ESP–FF fly ash (78.4%) of PC boilers (CFPPs #2-6) was higher than the CFB boiler (67.0%, CFPP#1) due to the greater amount of fly ash produced by PC boilers; an opposite trend was observed for bottom ash, with 17.5% of PC boilers and 32.3% of the CFB boiler (Table S7). For CFPP #4, the share of Cr in the bottom ash (45.10%) was obviously higher than other PC boilers (7.11–15.45%) due to the high Cr concentration in the bottom ash, as discussed above (Figure 6 and Table 3). A similar partitioning share of 39% for bottom ash was observed in a PC utility boiler in the USA [54]. Cr in WFGD gypsum contributed 0.69–7.94% of the total Cr output in these CFPPs (Figure 6 and Table S7). Only 0.01–0.03% of Cr was finally emitted into the ambient atmosphere through the stack, with an atmospheric emission rate of 30–86 g Cr·d−1 for the six utility boilers (Table S6). The atmospheric emission ratios of the present study were lower than CFPPs in the Ningxia Hui Autonomous Region (6.41%, [23]), North China (0.14–1.5%, [25,66]), Japan (0.421%, [31]), and Canada (0.17–1.00%, [6,58]), while comparable to CFPPs observed by Zhao et al. (<0.1%, [41]; <0.05%, [24]).
The emissions of trace elements from stationary combustion sources are affected by the occurrence of elements in fuels, transformation into vapor and particles in furnaces, and the ability of these vapors and particles to penetrate APCDs [67]. The low emission of Cr in this study can be ascribed to the non-volatility of Cr during combustion and the high removal efficiency (over 99.9%) of ESP/ESP–FF combined with the additional removal (30–56%) by downstream WFGD for PM [68,69,70]. Therefore, most Cr (mean: 99.7%; range: 99.95–99.99%) in the flue gas was captured by these devices in this study. The removal of PM was much higher in the present study than that observed using the ESP (97%) or venture wet scrubber (99.2%) several decades ago reported by another study [62]. Therefore, the atmospheric emission factors of Cr for these utility boilers were as low as 10.77–20.85 (mean: 14.86 ± 3.62) mg Cr·t−1 coal, 4.28–10.80 (mean: 7.72 ± 2.53) μg Cr·(kW·h)−1, and 0.44–0.95 (mean: 0.70 ± 0.19) g Cr·TJ−1 (Table 5). Compared with other onsite investigations (Table S4), the emission factors of Cr (14.86 ± 3.62 mg·t−1 coal; 7.72 ± 2.53 μg·(kW·h)−1; 0.70 ± 0.19 g·TJ−1) of this study were comparable or slightly higher than a CFPP in the Netherlands with EMFs of 3.4 μg·(kW·h)−1 and 0.38 g·TJ−1 [40] and a CFPP in Japan (1.68 μg/(kW·h), [31]), and other Chinese CFPPs (3.81–10.71 mg ·t−1 coal; 0.25–0.52 g·TJ−1 [24,41,59,61], Table S4), which were all observed in field studies.
Coupled with the atmospheric emission factor and the activity level in Guizhou, such as coal consumption by CFPPs [27], the atmospheric emission of Cr from this source in Guizhou was estimated to be 981 kg·y−1 (P10-P90: 773–1250 kg·y−1) in 2017. However, this figure is around one-tenth of that estimated by other researchers for Guizhou’s CFPPs in 2010 (9.51 tons/yr) [22], and this may be due to the lower dust removal for ESP (98.54%) and FF (95.13%) adopted by them [22] and a further reduction of 81% in PM emissions from Chinese CFPPs in recent years [70].
Apart from the atmospheric emissions, about 3950 tons of Cr was estimated to be present in the different solid by-products of CFPPs in Guizhou in 2017, including 747 tons of Cr in bottom ash, 3045 tons of Cr in ESP/FF fly ash, and 159 tons of Cr in gypsum. During coal combustion, up to 43% of Cr(III) is transformed into Cr (VI) [20], therefore, Cr in solid coal combustion products should be paid more attention since Cr in the leachate of coal ash is “nearly 100 percent hexavalent Cr(VI)”, as observed in the USA [71]. In North China, 20–30% of total Cr in fly ash and FGD gypsum is exchangeable [5,72], and Cr in some coal ash leachate (up to 77 ng·mL−1) exceeds Chinese underground water limits (50 ng·mL−1) [23]. The situation may be even worse in Guizhou, both due to the higher Cr concentration in the bottom/fly ash and the lower pH in the precipitation (range: 4.6–6.9; mean: 5.4) [73] in Guizhou than that of North China (e.g., mean pH 6.73 in rural Beijing) [74].

4. Conclusions

Based on the onsite investigation, the behaviors and atmospheric emissions of Cr from six utility boilers in Guizhou Province was investigated. The results showed that, due to the high ash yield (31–46%) and the affinity of Cr with ash-forming minerals, the Cr in feed fuels of this study (mean: 68 mg·kg−1) were approximately four times the national average (15.4 mg·kg−1). Cr concentrations in bottom ash and ESP/ESP–FF fly ash were roughly the same, with the exception of much higher (550 mg·kg−1) Cr in bottom ash than fly ash (106 mg·kg−1) found for one CFPP (#4); probably due to the occurrence of Cr in chromite (FeCr2O4) in feed fuels. Cr in limestone was relatively low (2.3–26.9 mg·kg−1) but was slightly higher in the flue gas desulfurization gypsum (24.0–42.0 mg·kg−1). Cr in the stack gas was in the range of 1.4–2.2 μg·Nm−3. Feed fuels contribute the majority (>93.62%) of Cr input, while, ESP/ESP–FF fly ash (49.00–89.50%) represents the main discharge pathway, followed by bottom ash (7.11–45.10%), gypsum (0.69–7.94%), and stack emissions (0.01–0.03%). The atmospheric emission factors of Cr were 10.77–20.85 mg Cr·t−1 coal, 4.28–10.80 μg Cr·(kW·h)−1, and 0.44–0.95 g Cr·TJ−1. The atmospheric emission of Cr from CFPPs in Guizhou was estimated to be 981 kg·y−1 in 2017. Around 4000 tons of Cr enter different coal combustion products each year. Due to the high Cr concentration in some ashes (e.g., >500 mg·kg−1) and the possible conversion of trivalent Cr(III) into hexavalent Cr(VI) during coal combustion, extreme caution should be exerted regarding the treatment of such materials to prevent the possible leakage of Cr into surrounding waters and soils. In the future, the speciation of Cr in the combustion ashes/gypsum and the leachability of Cr in these coal combustion products should be studied to assess the possible environmental impacts of these materials.

Supplementary Materials

The following are available online at https://www.mdpi.com/2073-4433/11/9/951/s1, Figure S1: The USA EPA Test Method 5 for particulate matter sampling in the stack flue gas, Table S1: The recovery of Cr in different certified reference materials (CRMs), Table S2: Classification of elements based on their behavior during combustion in the boiler and ducts with their REI factor, Table S3: Concentrations of Cr, V, Ni, and Co in feed coal, bottom ash, and captured fly ash in CFPPs in Guizhou, and the concentration ratios of Cr to V, Ni, and Co in different samples, Table S4: Comparison of Cr concentrations in solid materials and Cr emission data from different CFPPs, Table S5: Material consumption, production rate, and PM content in the stack flue gas of the six utility boiler systems, Table S6: Cr flow and mass balance of the six tested utility boilers, Table S7: Cr contributions (%) from the different input and output materials in the six tested utility boilers.

Author Contributions

Conceptualization, Z.L.; data curation, Z.L.; formal analysis, Z.L.; funding acquisition, Z.L., Q.W. and D.W.; investigation, Z.L., Q.W. and J.D.; methodology, L.F., D.W. and X.L.; project administration, Z.L.; resources, Z.X. and J.C.; visualization, X.L.; writing—original draft, Z.L.; writing—review and editing, Z.L. and Q.W. All authors have read and agreed to the published version of the manuscript.

Funding

This research was funded by the National Natural Science Foundation of China (No. 21707141, U1612442), the Project of Guizhou Provincial Department of Education (No. Qian-Jiao-He KY Zi [2019] 057), Project of Department of Science and Technology of Guizhou Province (No. Qian-Ke-He-LH-Zi [2017] 7088), and the Doctoral Foundation Project of Zunyi Normal University (No. Zun-Shi BS [2018] 15).

Acknowledgments

The authors would thank Ji Chen, Li Tang and Shan Li for their kindly help for the sample preparation.

Conflicts of Interest

The authors declare no conflict of interest.

References

  1. Bai, X.; Ding, H.; Lian, J.; Ma, D.; Yang, X.; Sun, N.; Xue, W.; Chang, Y. Coal production in China: Past, present, and future projections. Intern. Geol. Rev. 2018, 60, 535–547. [Google Scholar] [CrossRef]
  2. National Bureau of Statistic of China 2018. China Statistical Yearbook; China Statistics Press: Beijing, China, 2018. (In Chinese)
  3. Clarke, L.B. The fate of trace elements during coal combustion and gasification: An overview. Fuel 1993, 72, 731–736. [Google Scholar] [CrossRef]
  4. Gratz, L.E.; Eckley, C.S.; Schwantes, S.J.; Mattson, E. Ambient mercury observations near a coal-fired power plant in a Western, U.S. urban area. Atmosphere 2019, 10, 176. [Google Scholar] [CrossRef] [Green Version]
  5. Wang, J.; Yang, Z.; Qin, S.; Panchal, B.; Sun, Y.; Niu, H. Distribution characteristics and migration patterns of hazardous trace elements in coal combustion products of power plants. Fuel 2019, 258, 116062. [Google Scholar] [CrossRef]
  6. Goodarzi, F. Assessment of elemental content of milled coal, combustion residues, and stack emitted materials: Possible environmental effects for a Canadian pulverized coal-fired power plant. Intern. J. Coal Geol. 2006, 65, 17–25. [Google Scholar] [CrossRef]
  7. USEPA (U.S. Environmental Protection Agency). Clean Air Act Amendments of 1990; 1st Congress (1989–1990); USEPA: Washington, DC, USA, 1990.
  8. MEE (Ministry of Ecology and Environment of the People’s Republic of China). List of Toxic and Hazardous Air Pollutants (Year of 2018). Available online: http://www.mee.gov.cn/xxgk2018/xxgk/xxgk01/201901/t20190131_691779.html (accessed on 25 January 2019).
  9. Talovskaya, A.V.; Yazikov, E.G.; Osipova, N.A.; Lyapina, E.E.; Litay, V.V.; Metreveli, G.; Kim, J. Mercury pollution in snow cover around thermal power plants in cities (Omsk, Kemerovo, Tomsk Regions, Russia). Geogr. Environ. Sustain. 2019, 12, 132–147. [Google Scholar] [CrossRef] [Green Version]
  10. Tang, S.; Feng, X.; Qiu, J.; Yin, G.; Yang, Z. Mercury speciation and emissions from coal combustion in Guiyang, southwest China. Environ. Res. 2007, 105, 175–182. [Google Scholar] [CrossRef]
  11. Li, X.; Li, Z.; Fu, C.; Tang, L.; Chen, J.; Wu, T.; Lin, C.J.; Feng, X.; Fu, X. Fate of mercury in two CFB utility boilers with different fueled coals and air pollution control devices. Fuel 2019, 251, 651–659. [Google Scholar] [CrossRef]
  12. Guo, X.; Zheng, C.G.; Xu, M.H. Characterization of arsenic emissions from a coal-fired power plant. Energy Fuels 2004, 18, 1822–1826. [Google Scholar] [CrossRef]
  13. Chen, J.; Liu, G.; Kang, Y.; Wu, B.; Sun, R.; Zhou, C.; Wu, D. Atmospheric emissions of F, As, Se, Hg, and Sb from coal-fired power and heat generation in China. Chemosphere 2013, 90, 1925–1932. [Google Scholar] [CrossRef]
  14. Swaine, D.J. Trace Elements in Coal; Butterworth-Heinemann Ltd.: Oxford, UK, 1990. [Google Scholar]
  15. Huggins, F.E.; Shah, N.; Huffman, G.P.; Kolker, A.; Crowley, S.; Palmer, C.A.; Finkelman, R.B. Mode of occurrence of chromium in four US coals. Fuel Process. Technol. 2000, 63, 79–92. [Google Scholar] [CrossRef]
  16. Liu, Y.; Liu, G.; Qi, C.; Cheng, S.; Sun, R. Chemical speciation and combustion behavior of chromium (Cr) and vanadium (V) in coals. Fuel 2016, 184, 42–49. [Google Scholar] [CrossRef]
  17. Fu, B.; Liu, G.; Sun, M.; Hower, J.C.; Mian, M.M.; Wu, D.; Wang, R.; Hu, G. Emission and transformation behavior of minerals and hazardous trace elements (HTEs) during coal combustion in a circulating fluidized bed boiler. Environ. Pollut. 2018, 242, 1950–1960. [Google Scholar] [CrossRef] [PubMed]
  18. Huang, Y.; Jin, B.; Zhong, Z.; Xiao, R.; Tang, Z.; Ren, H. Trace elements (Mn, Cr, Pb, Se, Zn, Cd and Hg) in emissions from a pulverized coal boiler. Fuel Process. Technol. 2004, 86, 23–32. [Google Scholar] [CrossRef]
  19. Udayanga, W.D.C.; Veksha, A.; Giannis, A.; Lisak, G.; Chang, V.W.C.; Lim, T.T. Fate and distribution of heavy metals during thermal processing of sewage sludge. Fuel 2018, 226, 721–744. [Google Scholar] [CrossRef]
  20. Galbreath, K.C.; Zygarlicke, C.J. Formation and chemical speciation of arsenic-, chromium-, and nickel-bearing coal combustion PM2.5. Fuel Process. Technol. 2004, 85, 701–726. [Google Scholar] [CrossRef]
  21. Świetlik, R.; Trojanowska, M.; Łożyńska, M.; Molik, A. Impact of solid fuel combustion technology on valence speciation of chromium in fly ash. Fuel 2014, 137, 306–312. [Google Scholar] [CrossRef]
  22. Tian, H.; Liu, K.; Zhou, J.; Lu, L.; Hao, J.; Qiu, P.; Gao, J.; Zhu, C.; Wang, K.; Hua, S. Atmospheric emission inventory of hazardous trace elements from China’s coal-fired power plants--temporal trends and spatial variation characteristics. Environ. Sci. Technol. 2014, 48, 3575–3582. [Google Scholar] [CrossRef]
  23. Song, D.Y.; Ma, Y.J.; Qin, Y.; Wang, W.F.; Zheng, C.G. Volatility and mobility of some trace elements in coal from Shizuishan Power Plant. J. Fuel Chem. Technol. 2011, 39, 328–332. [Google Scholar] [CrossRef]
  24. Zhao, S.; Duan, Y.; Li, Y.; Liu, M.; Lu, J.; Ding, Y.; Gu, X.; Tao, J.; Du, M. Emission characteristic and transformation mechanism of hazardous trace elements in a coal-fired power plant. Fuel 2018, 214, 597–606. [Google Scholar] [CrossRef]
  25. Wang, J.; Zhang, Y.; Liu, Z.; Gu, Y.; Norris, P.; Xu, H.; Pan, W.P. Coeffect of air pollution control devices on trace element emissions in an ultralow emission coal-fired power plant. Energy Fuels 2019, 33, 248–256. [Google Scholar] [CrossRef]
  26. Li, W.; Zhai, J. Both ash and sulfur content and calorific value in Chinese steam coals. Coal Convers. (Meitanzhuanhua) 1994, 17, 12–25, (In Chinese with English Abstract). [Google Scholar]
  27. Bureau of statistics of Guizhou Province. Guizhou Statistical Yearbook 2018; China Statistics Press: Beijing, China, 2018. (In Chinese)
  28. Feng, X.; Hong, Y.; Hong, B.; Ni, J. Mobility of some potentially toxic trace elements in the coal of Guizhou, China. Environ. Geol. 2000, 39, 372–377. [Google Scholar] [CrossRef]
  29. Dai, S.; Ren, D.; Tang, Y.; Yue, M.; Hao, L. Concentration and distribution of elements in Late Permian coals from western Guizhou Province, China. Intern. J. Coal Geol. 2005, 61, 119–137. [Google Scholar] [CrossRef]
  30. Dai, S.; Finkelman, R.B. Coal geology in China: An overview. Intern. Geol. Rev. 2018, 60, 531–534. [Google Scholar] [CrossRef] [Green Version]
  31. Ito, S.; Yokoyama, T.; Asakura, K. Emissions of mercury and other trace elements from coal-fired power plants in Japan. Sci. Total Environ. 2006, 368, 397–402. [Google Scholar] [CrossRef]
  32. USEPA (U.S. Environmental Protection Agency). Test Method 5. Determination of Particulate Matter Emissions from Stationary Sources; USEPA: Washington, DC, USA, 1996.
  33. Chen, D.; Liu, X.; Han, J.; Jiang, M.; Xu, Y.; Xu, M. Measurements of particulate matter concentration by the light scattering method: Optimization of the detection angle. Fuel Process. Technol. 2018, 179, 124–134. [Google Scholar] [CrossRef]
  34. GB/T 212-2008. Proximate Analysis of Coal; Issued by the Chinese General Administration of Quality Supervision, Inspection and Quarantine and the Standardization Administration of China: Beijing, China, 2008. (In Chinese)
  35. GB/T 214-2007. Determination of Total Sulfur in Coal; Issued by the Chinese General Administration of Quality Supervision, Inspection and Quarantine and the Standardization Administration of China: Beijing, China, 2007. (In Chinese)
  36. GB/T 213-2008. Determination of Calorific Value of Coal; Issued by the Chinese General Administration of Quality Supervision, Inspection and Quarantine and the Standardization Administration of China: Beijing, China, 2008. (In Chinese)
  37. Qi, L.; Grégoire, D.C. Determination of trace elements in twenty-six Chinese geochemistry reference materials by inductively coupled plasma-mass spectrometry. Geostand. Geoanal. Res. 2000, 24, 51–63. [Google Scholar]
  38. Meij, R. Trace elements behavior in coal-fired power plants. Fuel Process. Technol. 1994, 39, 199–217. [Google Scholar] [CrossRef]
  39. Wang, H.; Song, Q.; Yao, Q.; Chen, C.H. Experimental study on removal effect of wet flue gas desulfurization system on fine particles from a coal-fired power plant. Proc. CSEE 2008, 28, 1–7, (In Chinese with English Abstract). [Google Scholar]
  40. Meij, R.; te Winkel, H. The emissions and environmental impact of PM10 and trace elements from a modern coal-fired power plant equipped with ESP and wet FGD. Fuel Process. Technol. 2004, 85, 641–656. [Google Scholar] [CrossRef]
  41. Zhao, S.; Duan, Y.; Tan, H.; Liu, M.; Wang, X.; Wu, L.; Wang, C.; Lv, J.; Yao, T.; She, M.; et al. Migration and emission characteristics of trace elements in a 660 mw coal-fired power plant of China. Energy Fuels 2016, 30, 5937–5944. [Google Scholar] [CrossRef]
  42. GB/T 15224.2-2010. Classification for Quality of Coal-Part 2: Sulfur Content; Issued by the Chinese General Administration of Quality Supervision, Inspection and Quarantine and the Standardization Administration of China: Beijing, China, 2010. (In Chinese)
  43. GB/T 15224.3-2010. Classification for Quality of Coal-Part 3: Calorific Value; Issued by the Chinese General Administration of Quality Supervision, Inspection and Quarantine and the Standardization Administration of China: Beijing, China, 2010. (In Chinese)
  44. GB/T 15224.1-2010. Classification for Quality of Coal-Part 1: Ash; Issued by the Chinese General Administration of Quality Supervision, Inspection and Quarantine and the Standardization Administration of China: Beijing, China, 2010. (In Chinese)
  45. Dai, S.; Ren, D.; Chou, C.L.; Finkelman, R.B.; Seredin, V.V.; Zhou, Y. Geochemistry of trace elements in Chinese coals: A review of abundances, genetic types, impacts on human health, and industrial utilization. Intern. J. Coal Geol. 2012, 94, 3–21. [Google Scholar] [CrossRef]
  46. GB/T 20475.2-2006. Classification for Content of Harmful Elements in Coal-Part 2: Chlorine; Issued by the Chinese General Administration of Quality Supervision, Inspection and Quarantine and the Standardization Administration of China: Beijing, China, 2006. (In Chinese)
  47. Ketris, M.P.; Yudovich, Y.E. Estimations of Clarkes for Carbonaceous biolithes: World averages for trace element contents in black shales and coals. Intern. J. Coal Geol. 2009, 78, 135–148. [Google Scholar] [CrossRef]
  48. Luttrell, G.; Kohmuench, J.N.; Yoon, R.H. An evaluation of coal preparation technologies for controlling trace element emissions. Fuel Process. Technol. 2000, 65–66, 407–422. [Google Scholar] [CrossRef]
  49. Brownfield, M.E.; Affolter, R.H.; Stricker, G.D.; Hildebrand, R.T. High chromium contents in Tertiary coal deposits of northwestern Washington—A key to their depositional history. Intern. J. Coal Geol. 1995, 27, 153–169. [Google Scholar] [CrossRef]
  50. Wilczyńska-Michalik, W.; Dańko, J.; Michalik, M. Characteristics of particulate matter emitted from a coal-fired power plant. Pol. J. Environ. Stud. 2020, 29, 1411–1420. [Google Scholar] [CrossRef]
  51. Li, X.; Bi, X.; Li, Z.; Zhang, L.; Li, S.; Chen, J.; Feng, X.; Fu, X. Atmospheric lead emissions from coal-fired power plants with different boilers and APCDs in Guizhou, Southwest China. Energy Fuels 2019, 33, 10561–10569. [Google Scholar] [CrossRef]
  52. Zhou, X.; Bi, X.; Li, X.; Li, S.; Chen, J.; He, T.; Li, Z. Fate of cadmium in coal-fired power plants in Guizhou, Southwest China: With emphasis on updated atmospheric emissions. Atmos. Pollut. Res. 2020, 11, 920–927. [Google Scholar] [CrossRef]
  53. Goodarzi, F.; Huggins, F.E.; Sanei, H. Assessment of elements, speciation of As, Cr, Ni and emitted Hg for a Canadian power plant burning bituminous coal. Intern. J. Coal Geol. 2008, 74, 1–12. [Google Scholar] [CrossRef]
  54. Swanson, S.M.; Engle, M.A.; Ruppert, L.F.; Affolter, R.H.; Jones, K.B. Partitioning of selected trace elements in coal combustion products from two coal-burning power plants in the United States. Intern. J. Coal Geol. 2013, 113, 116–126. [Google Scholar] [CrossRef]
  55. Zhang, Y.; Nakano, J.; Liu, L.; Wang, X.; Zhang, Z. Trace element partitioning behavior of coal gangue-fired CFB plant: Experimental and equilibrium calculation. Environ. Sci. Pollut. Res. 2015, 22, 15469–15478. [Google Scholar] [CrossRef]
  56. GB 16297-1996. Integrated Emission Standard of Air Pollutants; Issued by the Environmental Protection Agency of China: Beijing, China, 1996. (In Chinese)
  57. Zhou, C.; Liu, G.; Fang, T.; Wu, D.; Lam, P.K.S. Partitioning and transformation behavior of toxic elements during circulated fluidized bed combustion of coal gangue. Fuel 2014, 135, 1–8. [Google Scholar] [CrossRef]
  58. Huggins, F.; Goodarzi, F. Environmental assessment of elements and polyaromatic hydrocarbons emitted from a Canadian coal-fired power plant. Intern. J. Coal Geol. 2009, 77, 282–288. [Google Scholar] [CrossRef]
  59. Zhao, S.; Duan, Y.; Wang, C.; Liu, M.; Lu, J.; Tan, H.; Wang, X.; Wu, L. Migration behavior of trace elements at a coal-fired power plant with different boiler loads. Energy Fuels 2017, 31, 747–754. [Google Scholar] [CrossRef]
  60. Zhao, S.; Duan, Y.; Li, C.; Li, Y.; Chen, C.; Liu, M.; Lu, J. Partitioning and emission of hazardous trace elements in a 100 MW coal-fired power plant equipped with selective catalytic reduction, electrostatic precipitator, and wet flue gas desulfurization. Energy Fuels 2017, 31, 12383–12389. [Google Scholar] [CrossRef]
  61. Zhao, S.; Duan, Y.; Chen, L.; Li, Y.; Yao, T.; Liu, S.; Liu, M.; Lu, J. Study on emission of hazardous trace elements in a 350 MW coal-fired power plant. Part 2. arsenic, chromium, barium, manganese, lead. Environ. Pollut. 2017, 226, 404–411. [Google Scholar] [CrossRef]
  62. Ondov, J.M.; Choquette, C.E.; Zoller, W.H.; Gordon, G.E.; Biermann, A.H.; Heft, R.E. Atmospheric behavior of trace elements on particles emitted from a coal-fired power plant. Atmos. Environ. 1989, 23, 2193–2204. [Google Scholar] [CrossRef]
  63. Wu, B.; Bai, X.; Liu, W.; Zhu, C.; Hao, Y.; Lin, S.; Tian, H. Variation characteristics of final size-segregated PM emissions from ultralow emission coal-fired power plants in China. Environ. Pollut. 2020, 259, 113886. [Google Scholar] [CrossRef]
  64. Li, X.; Zhou, C.; Li, J.; Lu, S.; Yan, J. Distribution and emission characteristics of filterable and condensable particulate matter before and after a low-low temperature electrostatic precipitator. Environ. Sci. Pollut. Res. 2019, 26, 12798–12806. [Google Scholar] [CrossRef]
  65. GB 13223-2011. Emission Standard of Air Pollutants for the Thermal Power Plants; Issued by the Ministry of Environmental Protection Agency of China and the Chinese General Administration of Quality Supervision, Inspection and Quarantine: Beijing, China, 2011. (In Chinese)
  66. Wang, C.; Zhang, Y.; Shi, Y.; Liu, H.; Zou, C.; Wu, H.; Kang, X. Research on collaborative control of Hg, As, Pb and Cr by electrostatic fabric-integrated precipitator and wet flue gas desulphurization in coal-fired power plants. Fuel 2017, 210, 527–534. [Google Scholar] [CrossRef]
  67. Senior, C.L.; Helble, J.J.; Sarofim, A.F. Emissions of mercury, trace elements, and fine particles from stationary combustion sources. Fuel Process. Technol. 2000, 65–66, 263–288. [Google Scholar] [CrossRef]
  68. Yao, S.; Cheng, S.; Li, J.; Zhang, H.; Jia, J.; Sun, X. Effect of wet flue gas desulfurization (WFGD) on fine particle (PM2.5) emission from coal-fired boilers. J. Environ. Sci. 2019, 77, 32–42. [Google Scholar] [CrossRef] [PubMed]
  69. Liu, S.; Zhang, Z.; Wang, Y.; Hu, Y.; Liu, W.; Chen, C.; Mei, Y.; Sun, H. PM2.5 emission characteristics of coal-fired power plants in Beijing-Tianjin-Hebei region, China. Atmos. Pollut. Res. 2019, 10, 954–959. [Google Scholar] [CrossRef]
  70. Dai, H.; Ma, D.; Zhu, R.; Sun, B.; He, J. Impact of control measures on nitrogen oxides, sulfur dioxide and particulate matter emissions from coal-fired power plants in Anhui Province, China. Atmosphere 2019, 10, 35. [Google Scholar] [CrossRef] [Green Version]
  71. EPRI (Electric Power Research Institute). Characterization of Field Leachates at Coal Combustion Product Management Sites; ERPI Report 1012578; EPRI (Electric Power Research Institute): Charlotte, NC, USA, 2006. [Google Scholar]
  72. Hao, Y.; Li, Q.; Pan, Y.; Liu, Z.; Wu, S.; Xu, Y.; Qian, G. Heavy metals distribution characteristics of FGD gypsum samples from Shanxi province 12 coal-fired power plants and its potential environmental impacts. Fuel 2017, 209, 238–245. [Google Scholar] [CrossRef]
  73. Lu, P.; Han, G.; Wu, Q. Chemical characteristics of rainwater in karst rural areas, Guizhou Province, Southwest China. Acta Geochim. 2017, 36, 572–576. [Google Scholar] [CrossRef]
  74. Xu, W.; Wen, Z.; Shang, B.; Dore, A.J.; Tang, A.; Xia, X.; Zheng, A.; Han, M.; Zhang, L.; Zhao, Y.; et al. Precipitation chemistry and atmospheric nitrogen deposition at a rural site in Beijing, China. Atmos. Environ. 2020, 233, 117253. [Google Scholar] [CrossRef]
Figure 1. (a) Distribution and formation ages of coal in China (modified from Dai and Finkelman [30]), and (b) the locations of six coal-fired power plants (CFPPs) in this study and Cr concentration in Guizhou’s coal (internal unpublished data).
Atmosphere 11 00951 g001
Figure 2. Sampling sites in the six CFPPs with (a) CFB and (b,c) PC.
Atmosphere 11 00951 g002
Figure 3. Cr concentration in the feed fuels and bottom/fly ashes of different CFPPs. * From Ketris and Yudovich [47]; ** From Dai et al. [29]; *** From Dai et al. [45].
Atmosphere 11 00951 g003
Figure 4. Correlations between the Cr and (a) ash yield, (b) V, (c) Ni, and (d) sulfur contents in whole-coal samples of six studied CFPPs (air-dried basis).
Atmosphere 11 00951 g004
Figure 5. Pearson correlations between the Cr concentration in the feed fuel and bottom ash or the fly ash of the six CFPPs.
Atmosphere 11 00951 g005
Figure 6. Proportion of Cr in the input and output materials of the six CFPPs (the output ratio is based on the total input of Cr).
Atmosphere 11 00951 g006
Table 1. Information regarding the six CFPPs surveyed in the present study.
Power PlantsBoiler TypeInstalled CapacityAPCDs
#1CFB2 × 300 MWSNCR + C-ESP–FF + WFGD
#2PC4 × 600 MWSCR + C-ESP + WFGD
#3PC3 × 200 MWSCR + C-ESP–FF + WFGD
#4PC4 × 600 MWSCR + C-ESP + WFGD
#5PC4 × 300 MWSCR + C-ESP–FF + WFGD
#6PC2 × 600 MWSCR + C-ESP + OAD
Note: CFB, circulating fluidized bed boiler; PC, pulverized coal-fired boiler; SNCR, selective non-catalytic reduction; SCR, selective catalytic reduction; C-ESP–FF, cold side electrostatic precipitator and fabric filter; WFGD, limestone–gypsum wet flue gas desulfurization; OAD: organic amino desulfurization.
Table 2. Proximate and ultimate analyses of feed coal (air-dried basis).
Power PlantsFuel TypeProximate Analysis (%)Ultimate Analysis (%)Calorific Value (MJ·kg-1)
MoistureVolatile MatterAsh YieldFixed CarbonCarbonHydrogenNitrogenTotal SulphurChlorine aChromium a
#1 (No. = 4)Gangue2.89 ± 0.4218.77 ± 0.2745.15 ± 2.8333.19 ± 2.8747.24 ± 3.433.21 ± 0.130.85 ± 0.050.45 ± 0.07183 ± 4185.6 ± 12.219.29 ± 1.28
#1 (No. = 4)Coal slime9.06 ± 3.1817.53 ± 0.6343.94 ± 4.1829.47 ± 1.6941.86 ± 1.962.96 ± 0.150.82 ± 0.030.29 ± 0.04254 ± 47101.5 ± 9.617.03 ± 0.79
#2 (No. = 4)Bituminous0.66 ± 0.1415.05 ± 0.7239.56 ± 2.2244.72 ± 1.7651.21 ± 1.723.04 ± 0.070.85 ± 0.042.50 ± 0.27261 ± 2568.6 ± 5.420.74 ± 0.53
#3 (No. = 4)Bituminous1.22 ± 0.1115.96 ± 1.1445.73 ± 1.9437.09 ± 1.1847.04 ± 3.343.04 ± 0.200.79 ± 0.061.37 ± 0.17227 ± 6195.6 ± 2.519.19 ± 1.32
#4 (No. = 4)Bituminous1.08 ± 0.1318.07 ± 1.7030.68 ± 2.8550.17 ± 4.5062.38 ± 2.863.19 ± 0.321.07 ± 0.080.64 ± 0.06198 ± 2740.3 ± 7.024.47 ± 1.19
#5 (No. = 3)Anthracite1.43 ± 0.208.77 ± 1.2138.08 ± 8.0051.73 ± 9.0152.56 ± 12.813.64 ± 0.701.18 ± 0.283.41 ± 0.86169 ± 5639.5 ± 3.721.89 ± 4.96
#6 (No. = 6)Bituminous1.26 ± 0.1322.44 ± 0.9032.27 ± 1.9644.03 ± 1.5157.73 ± 1.654.18 ± 1.071.19 ± 0.443.82 ± 0.52499 ± 1044.9 ± 2.524.25 ± 1.29
Min–Max 0.66–9.068.77–22.4430.68–45.7329.47–51.7341.86–62.382.96–4.180.79–1.190.29–3.82169–49939.5–101.517.03–24.47
Mean ± SD 2.51 ± 2.7516.66 ± 3.8939.34 ± 5.6441.49 ± 7.8451.43 ± 6.433.32 ± 0.410.96 ± 0.161.78 ± 1.35256 ± 10468.0 ± 24.820.98 ± 2.55
Note: a unit for chlorine and chromium is in mg·kg-1.
Table 3. Cr concentration in bottom ash, ESP/ESP–FF fly ash, limestone, and gypsum.
CFPPs#1 (No. = 4)#2 (No. = 3)#3 (No. = 3)#4 (No. = 3)#5 (No. = 3)#6 (No. = 3)
Bottom ash (mg·kg−1)187.1 ± 11.2192.4 ± 8.0198.6 ± 4.6550.1 ± 99.3141.7 ± 7.2157.3 ± 6.2
ESP/ESP–FF fly ash (mg·kg−1)195.1 ± 5.2155.1 ± 3.0213.5 ± 2.1106.0 ± 5.2130.1 ± 7.9136.4 ± 5.1
Limestone (mg·kg−1)15.5 ± 0.52.3 ± 0.220.2 ± 1.426.9 ± 4.110.9 ± 1.1n.d.
Gypsum (mg·kg−1)38.9 ± 13.236.6 ± 0.731.2 ± 3.042.0 ± 1.024.0 ± 4.4n.d.
n.d, no data.
Table 4. Relative enrichment index (REI) values of Cr in ESP/ESP–FF fly ash and bottom ash of the six CFPPs.
Coal Combustion Products#1#2#3#4#5#6
Bottom ash0.861.110.954.191.371.13
ESP/ESP–FF Fly ash0.900.891.020.821.250.98
Table 5. Particulate-bound chromium in the stack gas of the six CFPPs and atmospheric emission factors (EMF).
CFPPs#1#2#3#4#5#6Mean + SD
Cr in stack gas (μg·Nm−3)2.0 ± 0.32.2 ± 0.12.1 ± 0.91.4 ± 0.01.9 ± 0.01.4 ± 0.01.8 ± 0.3
EMF1 (mg·t−1 coal)12.6417.0414.7713.0720.8510.7714.86 ± 3.62
EMF2 (μg·(kW·h)−1)9.818.028.165.2510.804.287.72 ± 2.53
EMF3 (g·TJ−1)0.710.820.770.530.950.440.70 ± 0.19

