1. Introduction
Currently, more than half of the world’s population lives in urban areas. In Europe, this percentage is one of the highest in the world at 77%. It is expected to increase to 85% by 2100 [
1]. Such a rapid rate of change in the number of inhabitants of urbanized areas results in strong environmental transformations related to the density of the city’s development structures and technical infrastructure. These include, for example, an increase in the impermeable surface caused by the construction of new buildings, as well as a decrease in the share of green areas. The consequence is a strong modification of microclimatic conditions, and thus the widespread occurrence of urban heat island (UHI), the impact of which is most strongly perceived in the city centers. This phenomenon, being the difference in prevailing thermal conditions between inner-city and suburban areas [
2,
3], is currently observable in settlement units with more than 5000 inhabitants [
4]. Due to its scale of impact, UHI has become one of the commonly undertaken topics in the scientific sphere. Research on UHI is carried out on a large scale in Europe [
5,
6,
7,
8,
9], Asia [
10,
11,
12,
13], North America [
14,
15,
16], South America [
17,
18], and also Africa [
19,
20,
21,
22]. According to Hart and Sailor [
23], the intensity of the UHI phenomenon depends on local conditions related to urban planning, type of building materials, amount of greenery, as well as microclimatic conditions in the areas of individual settlement units. The temperature difference between inner-city and suburban areas can be from 1 to 2 °C during the day and from 3 to 6 °C during the night [
15]. According to Akbari et al. [
24], the UHI can vary from 6 to 10 °C. In extreme cases, it may reach 12 °C (Poland, Czech Republic, India) [
25,
26,
27]. Climate warming along with the UHI phenomenon causes deterioration in the living conditions of city inhabitants. It results from an increase in average air temperature, an increase in the number of hot days, and an increase in air pollution. Taking into account the fact that the intensity of the UHI phenomenon depends on local conditions, it becomes necessary to conduct in-depth analyses aimed at determining the specific characteristics of cities. Only then will it be possible to define actions aimed at mitigating the UHI effect in urbanized areas.
The introduction of green infrastructure into urban spaces, i.e., green roofs, green walls, as well as tall greenery in the form of trees is one of the most commonly used passive methods to counteract the urban heat island effect [
28]. Greenery reduces the solar radiation reaching the earth’s surface, thus reducing the air temperature. It prevents the substrate from heating up depending on the type of greenery used and influences microclimatic conditions through shading and evapotranspiration [
29]. The use of green technologies is one of the least invasive forms of transformation of urban spaces, thus not violating the status quo of existing buildings, in particular historic buildings in the centers of cities.
The impact of green technologies is diverse, due to the local conditions of settlement units. In the present study, the inner-city area of Lodz located in the central part of Poland has been selected as the study area. In the city, one of the most intensive UHI (12 °C) has been observed. The research covered the so-called typical quarter, which is the basic urban form found in the inner-city. Its parameters were determined on the basis of in-depth analyses carried out with reference to data available from the units involved in the city’s spatial planning. The next stage concerned the impact of selected green solutions, i.e., green roofs, living facades, and high greenery on microclimatic conditions. Finally, their influence on the thermal comfort of inhabitants was determined. The scenarios considered the zone of direct microclimatic impact on humans, as well as the sphere of effect on the users of building interiors.
The research was carried out using the ENVI-met tool, which is one of the most commonly used in the field of urban climatology. The general overview was thoroughly described in [
30,
31]. Its validation was carried out by [
32,
33,
34,
35]. The aforementioned research was the basis of the assumption that the program provides reliable simulation results. The authors confirmed that the tool can appropriately anticipate microclimatic conditions. They conducted preliminary studies in public spaces in Lodz [
36,
37]. The application enabled micro-meteorological modeling with high accuracy. Here, it was used as one of the most credible instruments, which can be applied in urban climatology. The purpose was to give a general overview of the influence of green strategies, which might be implemented in city centers, on microclimates and thermal comfort.
2. Experiments
2.1. The Historic Urban Core as a Case Study
Lodz is located in the central part of the country (19°28′ E longitude, 51°45′ N latitude). It is considered to be the third-largest city in terms of population and fourth in terms of area. The city developed intensively in the 19th century, and it was then that the buildings in the central part of the city were formed. The compact systems of buildings of equal height formed during this period have survived to this day in an almost unchanged state. According to research conducted by Kłysik [
38], it is the compact development of the city center that mainly contributes to the creation of the heat island in Lodz.
The long-term planning activities of urban planners were focused on the area considered as a priority—the historic urban core (
Figure 1). This site is inhabited by over 1/5 of the population. At the same time, it has been considered the most degraded space in the city. Pursuant to the provisions of the Municipal Revitalization Program for the City of Lodz 2026+, the undertaken planning activities are aimed at contributing to the “revitalization of the residential area”. They are connected with the transformation of residential facilities with their functionally related surroundings. The current scenarios of urban structure changes concern the possibility of introducing green solutions. This results from the choice of this city as the international organizer of EXPO Horticultural 2024.
2.2. Climatic Conditions in the City
The analysis of microclimatic conditions was carried out on the basis of information obtained from databases of the meteorological station located in the suburban area of the city. It included hourly measurement and actinometrical observation (available for the period 1991 to 2017), as well as meteorological data (available for the period 1960 to 2018). In order to maintain the consistency and comparability of the data, the study was conducted for the period 2004 to 2015. The prevailing microclimatic conditions were estimated for the warm period (May to September) and the hottest day of the year (29 July 2013). The former is taken into account as the microclimate background existing in the city (as the climatological scenario). The latter presents the most uncomfortable conditions. Basic parameters such as total radiation, temperature, relative air humidity, as well as wind speed at an altitude of 10 m above ground level were taken into account. The analysis results are presented in
Figure 2.
In the warm period, the average daily air temperature was 16.85 °C. The dominant values were those between 15 and 20 °C. The maximum value of the total radiation reached 933.33 W/m
2. During this period, the relative air humidity ranged from 60% to 70%. The wind speed, which was measured at the altitude of 10 m above the ground level in the suburban area, was 3.20 m/s. In the center, a slowdown in airflow was observed of 1.63 m/s (taking into account the correction described in
Section 2.3).
During the hottest day of the year, temperatures from 20.9 to 36.1 °C were recorded. Relative humidity ranged from 29% to 86%. The maximum total radiation value was 680.56 W/m2. It is worth noting that this was not the highest value that can be observed during the period of conditions described as warm. It could have been connected with a cloud cover. There was observed cloudiness (cirrus and cirrostratus), especially in the morning. The air flow velocity ranged from 1 to 5 m/s. It corresponded to the value of the parameter from 0.62 to 1.86 m/s occurring in the downtown area. The meteorological conditions rapidly changed in the evening. The wind speeds were high at 8 m/s (suburban zone) and 2.79 m/s (city center). This foreshadowed a rainstorm over the next few days.
The estimated microclimatic conditions were implemented in the form of hourly parameter values as input data for simulation of atmospheric processes in ENVI-met application.
2.3. Adjustment of Meteorological Parameters as Input Data in Application
Hourly average values of temperature and relative air humidity were directly used at a later stage of the study—computer simulations. In the case of total radiation, it was necessary to calculate the adjustment factor. This resulted from the overestimation of parameter values by software (automatic settings). In this case the adjustment factor was 0.51. The value of wind speed was also corrected. This was due to the fact that the meteorological data came from a station located in the suburbs, while the research area was in the city center. In order to correct the value of airflow velocity a modified version of the logarithmic formula was used [
39].
where:
—average wind speed at 10 m (m/s);
—friction velocity (m/s);
—von Kármán constant (0.4);
z—altitude above terrain level (m);
—effective altitude (m);
—displacement length (m);
—aerodynamic roughness length (m).
Initially, the friction velocity was calculated for the suburban zone. Then the parameter for the inner-city was estimated using the relation proposed by Simiu [
40]. This allowed for combining wind speed profiles in the suburban area and in the historic urban core. According to the modified Davenport classification [
41], it was assumed that the roughness length of the suburban site is zo ≈ 0.03 m, and of the inner-city area z
0 ≈ 1.00 m.
where:
—friction velocity of the suburban area (m/s);
—friction velocity of the Lodz inner-city area (m/s);
—roughness length of suburban area (m);
—roughness length of the Lodz inner-city area (m).
Finally, the value of airflow velocity in the inner-city area was obtained. In the case of averaged conditions in the warm period, this parameter was 1.62 m/s at an altitude of 10 m. The calculated meteorological parameters were used as input data for simulating atmospheric processes.
The second scenario concerned the hottest day of the year, i.e., 29 July 2013. In this case, an analogous method of developing meteorological input data was used. Hourly temperature and humidity values were directly implemented in the application. Corrections were required for the radiation parameter. The adjustment factor was 0.70. The airflow velocity was calculated for the inner-city area based on Equation (2). The value of the parameter was 1.86 m/s.
2.4. Form of a Typical Metropolitan Quarter
In order to determine the layout of a typical quarter development of the historic urban core, information obtained from the databases of state institutions, i.e., The Geodesy Centre, the Municipal and the Voivodeship Monument Conservator was used. The information referred to 13,315 buildings, as well as 10,050 registered plots. To determine the form of a typical metropolitan quarter, the following data were used: the number of above-ground stories, dimensions of buildings, length and width of land parcels, as well as the width of traffic routes.
Parameters of the typical metropolitan quarter were estimated on the basis of calculations made for vector files creating the map of the historic urban core. The dimensions of the cadastral parcels were calculated using the GIS software. Generating information about the position of the plot vertexes made it possible to calculate their basic parameters. The average quarter width was 162 m, which meant the presence of six cadastral plots. The average length was determined to be 165 m. Then, the geometry of the frontal buildings on the reference areas was generated. For this purpose, information about the location of the object vertexes was used. Also, the area footprint was determined as 40%. Therefore, the basic assumption was that there are two symmetrical tenement outhouses (except for the frontal buildings). The height of the buildings was calculated on the basis of descriptive information in the attribute table. Parameters of the typical metropolitan quarter are presented in
Figure 3.
The next step was to determine the surface materials occurring in the historic urban core. Construction materials were defined based on descriptive files enclosed in the thematic map layers obtained from the Geodesy Centre. Both for building quarters and traffic routes, surface types were defined. The dominant type of surface was impermeable material. In the first case, its share was 61.67% (of which 40% were buildings). In the second case, the impermeable material constituted 98.10%. It is worth pointing out that the share of asphalt pavement was over 51% in street canyons.
Information from the Municipal/Voivodeship Monument Conservator was used to define the structure of buildings. This information was derived from the so-called register cards of real estate monuments occurring in the historic urban core. The analysis included 551 frontal tenements (residential buildings). Information was used to determine the dimensions and materials of building partitions, pitch, and roofing. In addition, it was necessary to verify the data concerning the roofing. For this purpose, the data contained in the Internet Land Information System (InterSIT), as well as oblique images for the city, were used. The basic information on the objects is presented in
Table 1.
2.5. Model of a Typical Metropolitan Quarter
The development structure of a typical metropolitan quarter was assessed based on the analysis results of information obtained from the aforementioned public institutions. Initially, it was necessary to add to the Envi-met application database (Database Manager) building materials that were recognized as characteristic for the historic urban core. Brick (64 cm thick inner layer) and plaster (2 cm thick outer layers) were selected as a building envelope. For the materials, such parameters as thickness, absorption, transmission, reflection, emissivity, specific heat, thermal conductivity, and density were specified. The building partition of a typical object located in the historic urban core is shown in
Supplementary Materials S1. Also, for the roofing material, parameters of the material—roofing felt were determined (
Supplementary Materials S2). They have been implemented in the ENVI-met application material database. An impermeable surface was selected as the base material—asphalt (streets) and concrete (courtyards of the quarter, footpaths). The materials were directly implemented from the application database to the model.
The model was created in the SPACES module of ENVI-met application. The dimensions of the three-dimensional model were 104 × 107 × 30 cells with 2 m × 2 m× 2 m resolution. The building layout was estimated on the basis of information from The Geodesy Centre. It was provided as vector thematic map layers. Building dimensions (length and width) were calculated in the QGIS software. The layout of the typical historical structure was directly implemented in the ENVI-met application. On one hand, it contributed to a structural adjustment of buildings to the application domain. On the other hand, the assumed rectangular grid forced a simplification of modeled dimensions.
On the basis of the literature review, as well as the results of object height analyses, it was established that the vertical dimension of buildings is 14 m. In order to create a model, a vertical structure with identical cell heights was used, which was an equidistant grid. Moreover, the frontages of buildings on opposite sides of the traffic routes were modeled. The distance between objects, which is also the width of traffic routes, was 16 m.
2.6. Scenarios for Introducing Green Technologies into the Urban Environment
The simulations were conducted for average WS (warm season as a climatological scenario) and HD (the hottest day scenarios) conditions in the city area. The three types of green technologies were analyzed—green roofs (R1 and R2—roof cases), green walls (W1 and W2—wall cases), as well as high greenery in the form of deciduous trees in street canyons (T1 and T2—tree cases). Due to the historical character of objects, the modifications did not include the geometry of buildings. Passive green scenarios were presented in
Figure 4. Their details are presented below.
2.6.1. Base Case (BC)
The basic scenario was created on the grounds of a three-dimensional terrain model, which took into account the geometry of typical buildings, as well as the dominant base materials for the historic urban core. The model was used both to simulate the distribution of meteorological parameters during the warm period and during the hottest day of the year. The results of obtained analyses were a point of reference for changes occurring in the case of introducing green solutions to the urban environment.
2.6.2. Roof Cases (R1 and R2)
The scenarios were related to the introduction of green technologies in the form of green roofs on buildings. The first one—R1 concerned the introduction of green roofs on selected buildings. Their area was 59% of the existing roofing. In relation to the model, it constituted 23.36% of the area. The second scenario—R2 assumed the presence of a green roof on each of the created buildings—100% of the objects covered with a green roof. They constituted 39.22% of the total model area.
It is worth mentioning that the latter, 100% roof coverage, is impossible from an applicational point of view. Nevertheless, it was taken into account as a comparative scenario. The visual results can give potential readers (municipal officials, city planners as well as dwellers) a general idea of what impact an absolute green coverage on city conditions might have.
2.6.3. Wall Cases (W1 and W2)
The scenarios concerned the introduction of green walls in the model. In accordance with the assumptions, they were introduced on half of the buildings (scenario W1). Their area was 23.408 m2. It constituted 54.71% of the existing facade area. In the W2 scenario, the walls were completely covered with ivy (42.784 m2).
As it was previously mentioned, 100% wall green coverage was taken into account as the comparative scenario. In the case of detailed modeling, complex building structures should be taken into consideration (window openings and doors). Here, the general idea is presented.
2.6.4. Tree Cases (T1 and T2)
The last case included the introduction of high greenery in street canyons. In the T1 scenario, four lines of trees in canyons with north–south orientation were included (24 deciduous trees, the direct impact of which was 864 m
2 of land), as well as four lines of trees in canyons with east–west orientation (12 deciduous trees covering 432 m
2) (
Figure 5). The location was selected in terms of the real possibility of planting trees in the inner-city area, i.e., at the border with an adjacent plot. In this way, the collision issue of introduced green solutions with areas serving as access roads to buildings was eliminated (usually the gateways are located in the middle of frontal buildings). Additionally, the greenery was introduced at a distance of 2 m from the front elevation ensuring the possibility for pedestrians to move around the buildings (pavements), as well as the proper functioning of the main communication routes in the area of street canyons.
In the T2 scenario, the amount of greenery in the study area was intensified (
Figure 6). In canyons with north–south orientation, 32 trees were introduced, covering an area of 1152 m
2, while in canyons with east–west orientation, 20 trees cover 720 m
2. According to the assumptions, they were located at the borders with adjacent plots of land at a distance of 2 m from the front elevation of buildings.
3. Results
3.1. Results of Meteorological Parameters Simulation
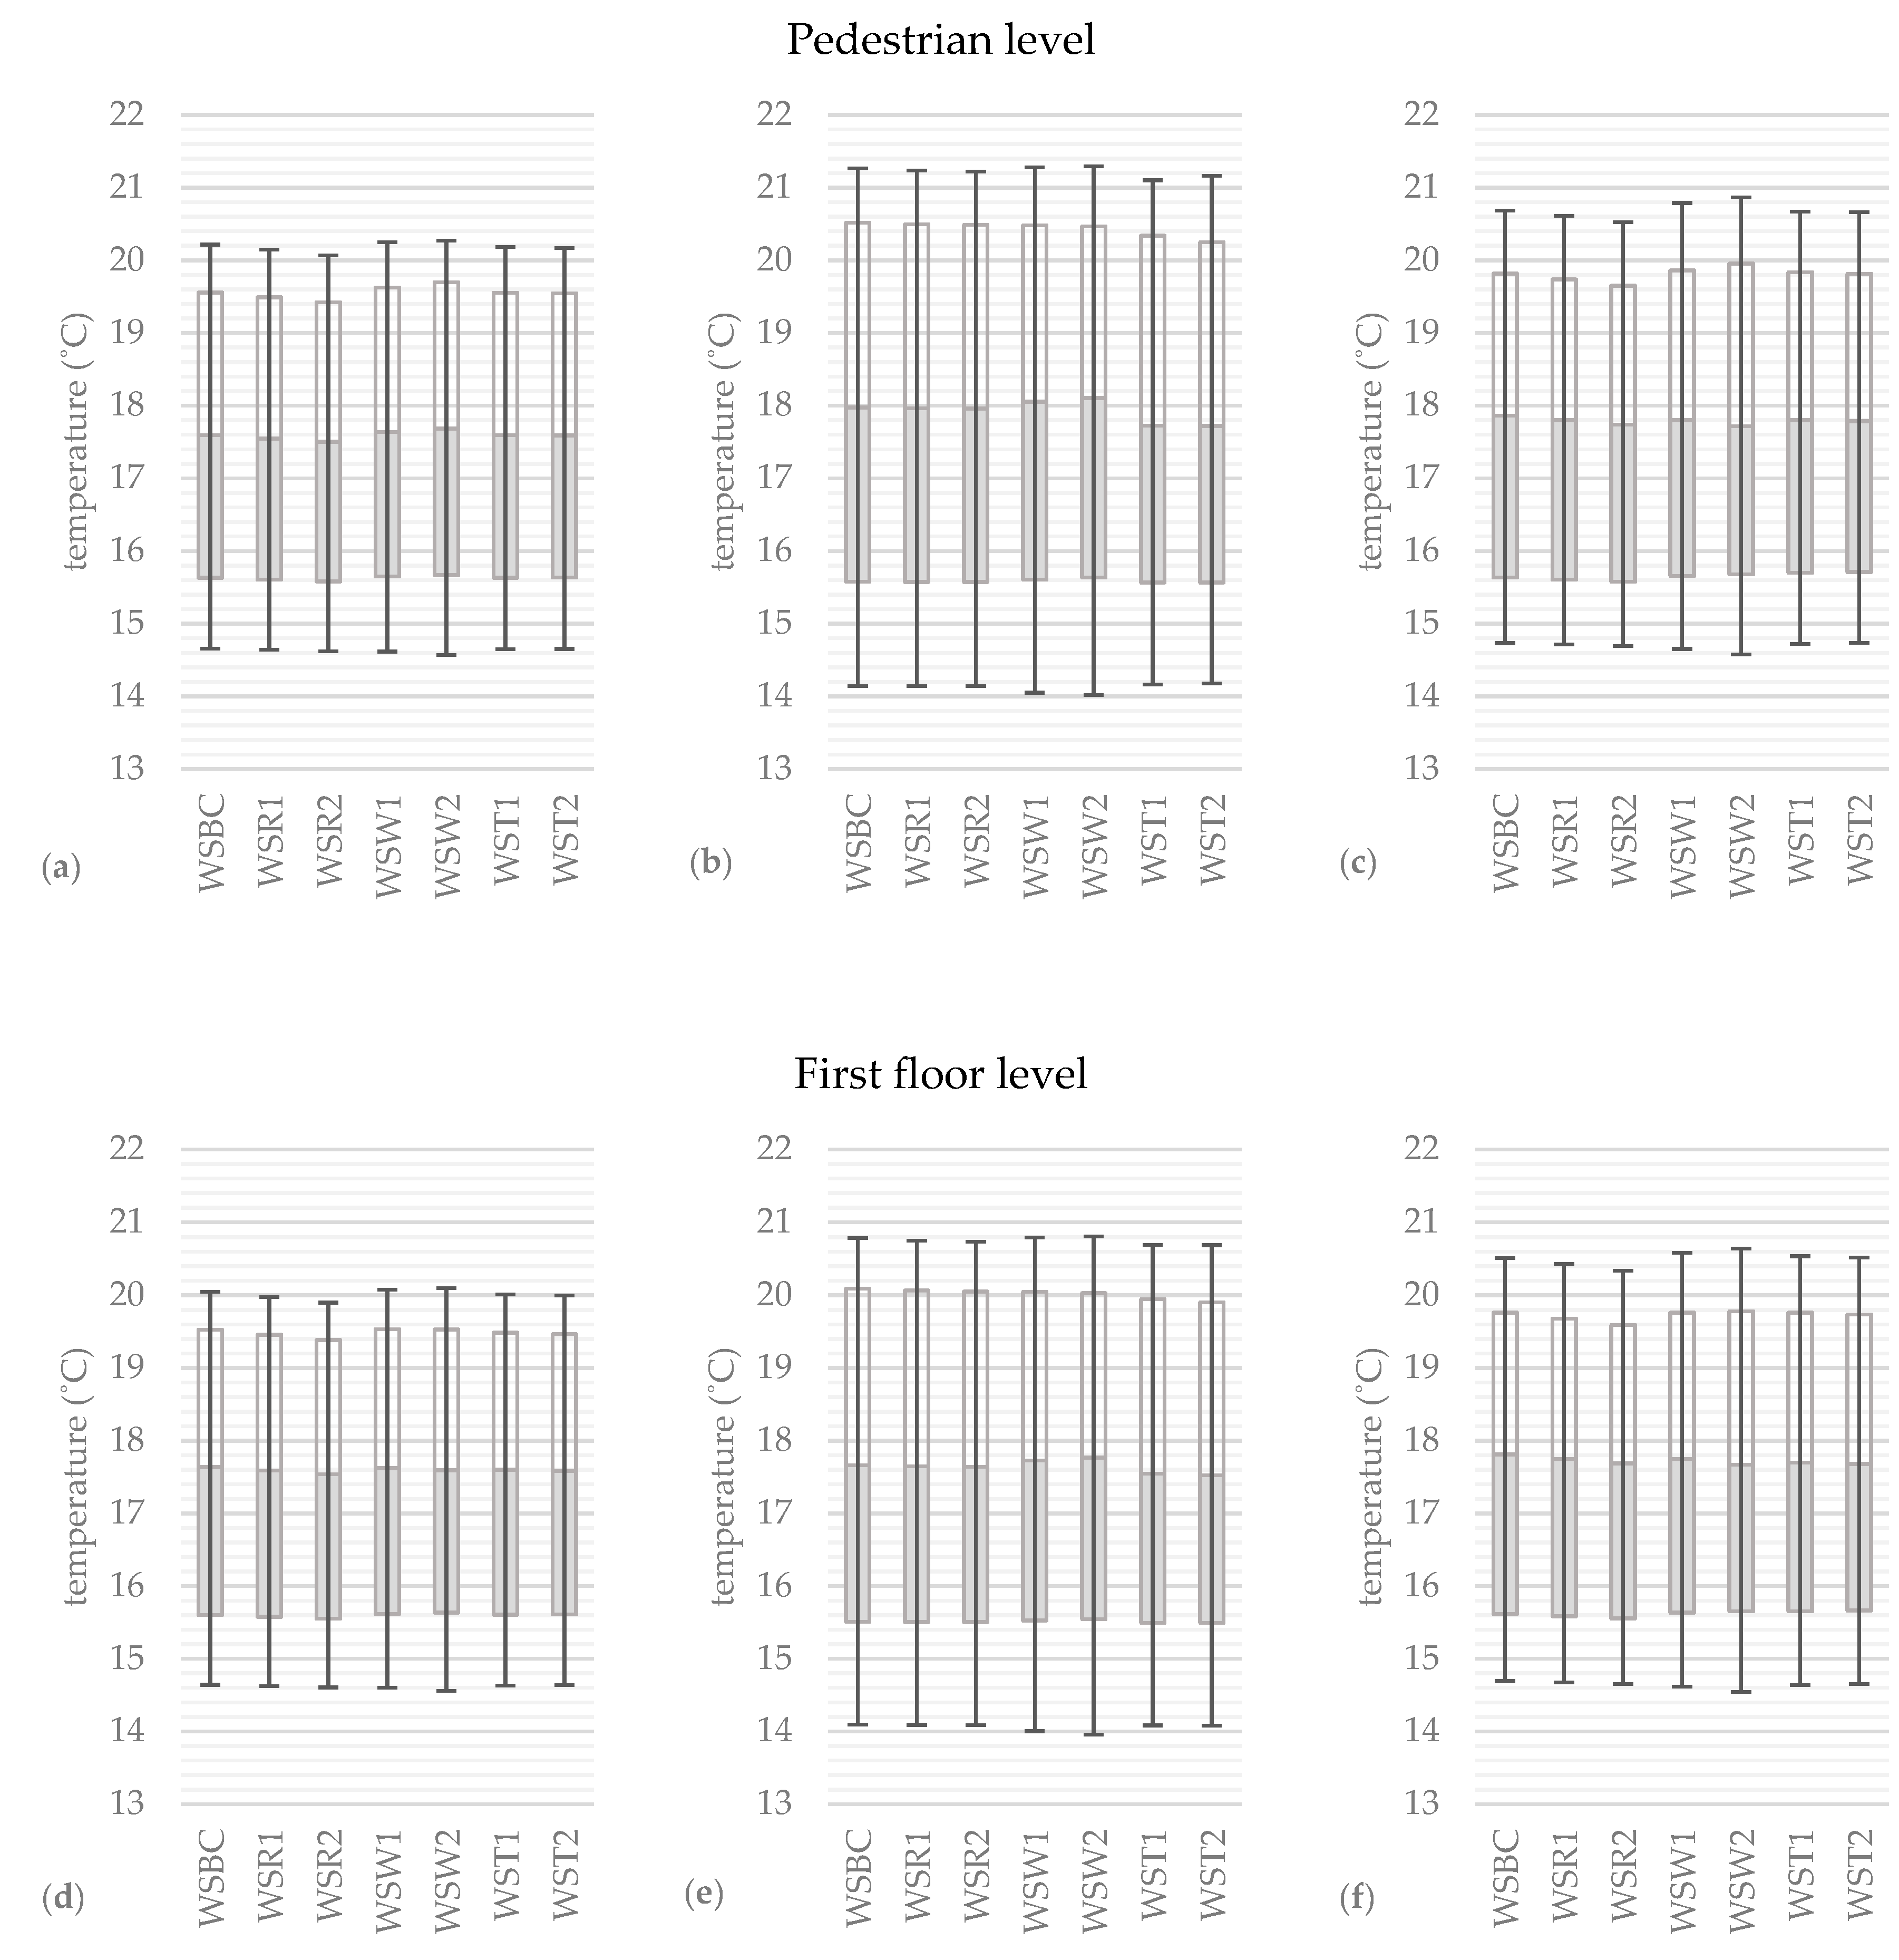
The scenarios concerned the microclimatic changes taking place in the area of a typical development quarter in the inner city of Lodz. The analyses covered the basic microclimatic parameter, which is air temperature. The value was obtained in the zone of direct microclimatic impact on humans (1.4 m above street level, i.e., the level of pedestrian traffic in public spaces), and also at the level of microclimatic impact on building interior users (5 m above street level, i.e., the height of window openings at the level of the second-story of building). It is worth noting that the analyses included microclimatic changes occurring directly in the area of the quarter, as well as in street canyons (with the axes parallel and perpendicular to the wind direction). The simulation results related to the introduction of green infrastructure in a strongly urbanized area were compared with the basic scenario (
Figure 7 and
Figure 8). The spatial distribution of the parameters is presented in
Supplementary Materials S3–S6 (the left column—at 8 a.m., the middle column—2 p.m., the right column—8 p.m.).
3.1.1. Warm Season Conditions—Base Case
Simulations were carried out for a typical inner-city development structure in the warm period. It can be observed that for the baseline scenario the air temperature oscillated between 14.66 and 20.22 °C (at 1.4 m), 14.64 and 20.05 °C (at 5 m) in the quarter area; 14.14 and 21.26 °C (at 1.4 m), 14.09 and 20.79 °C (at 5 m) in a canyon with the axis parallel to the direction of airflow; 14.73 and 20.69 °C (at 1.4 m), 14.69 and 20.51 °C (at 5 m) in a canyon with the axis perpendicular to the wind direction. The maximum values were observed from 2 to 3 p.m. (quarter), 3 p.m. (canyon axis||wind), and 1 to 2 p.m. (canyon axis ⊥wind). The highest value of a parameter was recorded in the canyon with the north–south axis (⊥wind), which is an area with strong sunshine during the day, with a weakened airflow due to the structure of buildings. The minimum values were recorded in the canyon with the east–west axis (|| wind). Moreover, there is a visible decrease in temperature values along with an increase in the measurement height.
3.1.2. Warm Season Conditions—Roof Cases
In the case of green roofs, a similar effect was observed for WSR1 (50% of building cover) and WSR2 (100% of building cover). Their introduction resulted in a decrease in air temperature by 0.05 and 0.10 °C on average (respectively, WSR1 and WSR2, at 1.4 and 5 m) in the area of the quarter; 0.01 and 0.02 °C (WSR1, WSR2, at 1.4 and 5 m) in a canyon with an east–west axis (|| wind); 0.06 and 0.11 °C (WSR1 and WSR2 at 1.4 and 5 m) in a canyon with a north–south axis (⊥wind). The greatest changes of parameters were observed in the canyon with north–south axis (⊥wind) in the afternoon hours (2 to 6 p.m.). They were 0.08 to 0.09 °C, 0.17 to 0.19 °C (respectively, WSR1 and WSR2). Their impact was also visible within the quarter, i.e., 0.05 and 0.10 °C (WSR1 and WSR2 at 1.4 and 5 m).
3.1.3. Warm Season Conditions—Wall Cases
In both the WSW1 and WSW2 scenarios the use of living facades turned out to be ineffective. They did not significantly affect the parameter value in the study area. The maximum temperature change was 0.04 and 0.06 °C (WSW1 and WSW2 at 1.4 and 5 m).
3.1.4. Warm Season Conditions—Tree Cases
The amount of greenery used in both the WST1 and WST2 scenarios had a similar effect on temperature changes. The introduction of high greenery characteristic for the city (Acer platanoides) resulted in a noticeable decrease in air temperature only in the case of canyon with east–west orientation (|| wind). The maximum was 0.09 °C and 0.18 °C (WST1 and WST2 at 1.4 and 5 m).
3.1.5. The Hottest Conditions—Base Case
The next case concerned the influence of selected types of green infrastructure on microclimatic conditions during the hottest day of the year (
Figure 8). For a base scenario, the analysis results showed that air temperature ranged from 23.78 to 34.00 °C (at 1.4 m), 23.94 to 33.70 °C (at 5 m) within the quarter; 23.71 to 23.06 °C (at 1.4 m), 23.76 to 33.95 °C (at 5 m) in an east–west axis canyon (⊥wind); 22.60 to 34.96 °C (at 1.4 m), 22.81 to 34.45 °C (at 5 m) in a north–south (||wind) orientation canyon. Maximal values (between 1 and 2 p.m.), as well as the highest parameter value dispersion, was observed in the canyon with north–south orientation (|| wind).
3.1.6. The Hottest Conditions—Roof Cases
The analysis results showed that the higher the air temperature, the more important the use of green technologies is. The implementation of green roofs in the study area resulted in a similar effect for both HDR1 (50% roofing) and HDR2 (100% roofing) scenarios. Moreover, their impact was comparable to each of the measurement levels (at 1.4 and 5 m). The maximum air temperature reduction was 0.61 to 0.70 °C (quarter), 0.67 to 0.73 °C (canyon with east–west orientation), 0.60 to 1.05 °C (canyon with north–south orientation).
3.1.7. The Hottest Conditions—Wall Cases
Living facades were the least effective of selected solutions. The maximum air temperature reduction was 0.50 to 0.55 °C (quarter), 0.55 to 0.58 °C (east–west canyon), 0.59 to 0.73 °C (north–south canyon). For both HDW1 and HDW2, the greatest effect was observed in the north–south oriented street canyon. A similar relationship was evident in simulations conducted for the warm period. In canyons with axes parallel to the direction of airflow, the introduction of living facades allowed the greatest reduction in air temperature.
3.1.8. The Hottest Conditions—Tree Cases
The most effective solution turned out to be the use of high greenery in the study area. The introduced changes—scenarios HDT1 and HDT2 contributed significantly to lowering the air temperature. The parameter was reduced on average by 0.48 °C (HDT1) and 0.51 °C (HDT2) over the quarter; 0.58 to 0.72 °C (HDT1), 0.58 to 0.84 °C (HDT2) in the east–west canyon, 0.69 to 0.80 °C (HDT1), 0.77 to 0.92 °C (HDT2) in the north–south canyon. The maximum change was 0.60 °C (HDT1) and 0.65 °C (HDT2) in the quarter, 0.88 °C (HDT1) and 1.11 °C (HDT2) in the east–west canyon, 1.11 °C (HDT1) and 1.31 °C (HDT2) in the north–south canyon. Also, in this case, the greatest temperature reduction was observed in the area where the air flow was most intense. Moreover, the effects of introducing high greenery, i.e., HDT1 and HDT2 resulted in a similar temperature reduction.
3.2. Outdoor Thermal Comfort
The last stage of this study consisted of assessing the thermal comfort of a human living in a strongly urbanized area. For this purpose, rational indices—physiologically equivalent temperature (PET)—were used. It is defined as “air temperature at which, in a typical indoor setting (without wind and solar radiation), the heat budget of the human body is balanced with the same core and skin temperature as under the complex outdoor conditions to be assessed” [
42]. According to the literature review by de Frietas and Gregorieva [
43], it is the most widely used indicator in the field of urban climatology for estimating human heat sensations in the outdoor environment.
This study estimates the thermal comfort in the pedestrian zone (1.4 m), as well as at the residential level (5 m). Three areas of influence were distinguished, i.e., the interior of inner-city quarter, east–west oriented canyon, and north–south oriented canyon. The spatial distribution of PET values is presented in
Supplementary Materials S7–S10 (the left column—at 8 a.m., the middle column—2 p.m., the right column—8 p.m.).
The results analysis showed that the level of thermal comfort was described as “slightly cool” to "slightly warm” in the warm period. The daily index value ranged from 15.93 to 18.44 °C in the quarter area. In this case, the introduction of green solutions did not significantly contribute to changes in thermal sensations. Moreover, for extreme temperature conditions, such as the warmest day, the changes were minimal. At that time, the conditions were described as “slightly cool” to “very hot”. The average daily value was 29.75 to 31.71 °C. There is a visible decrease in the index level for HDR2 (4 h), HDT1, and HDT2 (5 h) at the pedestrian level; for HDT1 and HDT2 (3 h) at the residential level. The minimum changes are due to the fact that green solutions were introduced for buildings located along traffic routes. The control point in the interior of the quarter was located at a considerable distance from the buildings, i.e., 39 to 68 m. Therefore, the applied technologies contributed in a slight way to the reduction of perceived thermal impressions.
In the canyon area with an east–west orientation, there are visible changes in both the warm and hottest days of the year. In the first case, the average value of the index oscillated between 14.69 and 17.83 °C (conditions described as “slightly cool” to “slightly warm”). The decrease in PET index was visible for WST1 (5 h) and WST2 (6 h) at the pedestrian level; HDT1 and HDT2 (12 h) at the residential level. In the latter case, the daily average PET value was 28.75 to 35.56 °C (conditions ranging from “slightly cool” to “very hot”). The reduction was achieved for HDT1 (5 h) and HDT2 (8 h) at the pedestrian level, and for HDT1 (11 h) and HDT2 (12 h) at the residential level.
A significant impact was also visible in the area of the canyon with north–south orientation. The average daily value of the parameter was 15.42 to 21.23 °C in the warm period. The occurring conditions can be described as from “cold” to “hot” during the day. The index decreased for HDT1 (3 h) and HDT2 (4 h) on the pedestrian level; for HDT1 and HDT2 (16 h) on the interior user level. During the warmest day of the year, the index reached value from 26.50 to 29.92 °C. These conditions were described as “slightly cool” to “very hot”. The greatest change in the perceived conditions was visible in HDT1 and HDT2 scenarios (3 h at 1.4 m, 8 h at 5 m).
4. Discussion
Many researchers point out that the efficacy of green solutions depends on local conditions. Various mitigating effects of living roofs were observed under different climates and urban densities. In a hot-dry climate, the temperature reduction was 1.4 °C (Cairo), the temperate climate was 0.3 °C in Paris [
44], 0.5 °C in Rome [
45], and 1.5 °C in Germany [
46]. In this study, in the Dfb zone, the warm humid continental climate maximum air temperature reduction was 0.08 to 0.09 °C and 0.17 to 0.19 °C (respectively, WSR1 and WSR2 during the warm period); 0.60 to 1.05 °C and 0.60 to 0.73 °C (respectively, HDR1 and HDR2 during the hottest day of the year).
The use of living facades is described by Herath et al. [
47]. They have proven that the introduction of 50% living facades into a highly urbanized environment reduces air temperature by 1.86 °C. The analysis results for the area of the most intensively urbanized city showed that the use of living facades did not contribute to a significant temperature reduction during the warm period. The change was noticeable in extreme temperature conditions such as the hottest day of the year. At that time, the parameter was lowered by 0.50 to 0.73 °C. Studies by Srivanit et al. (Japan) [
48] confirm that microclimatic conditions undergo changes. The air temperature can be decreased by up to 2.27 °C. Furthermore, the use of green walls affects the surface temperature, which is reduced by 6 to 10 °C (Singapore) [
49]. However, the impact of changes can be observed as the temperature increases. The warmer the climate, the greater the importance of introducing green technologies in urban areas.
The introduction of high greenery into the urban environment is considered to be one of the most effective solutions. An increase in greenery coverage by 10% resulted in a decrease in the ambient temperature of 0.12 °C (China) [
50] and 0.43 °C (Japan) [
51]. An increase in greenery coverage from 10% to 25% may result in an average daytime cooling benefit of up to 2 °C [
52]. According to Ouyang et al. [
53], a vegetated fraction of 20% to 30% is the optimal solution. In this case, the location of high greenery was chosen with a view to the real possibility of planting trees in the inner-city area. The amount of introduced greenery was 3% (T1) and 4% (T2) of the areas. In the first case—T1, the maximum temperature reduction was reached at 0.09 °C (during the warm season), and 1.11 °C (during the hottest day of the year); in the second case—T2, the parameter value was reduced by 0.19 °C (during the warm season), and 1.31 °C (during the hottest day of the year).
Undoubtedly, the implementation of green technologies has an impact on the level of thermal sensations experienced by users of urban spaces. According to Peng and Jim [
54], green roofs result in a 0.1 to 0.2 °C decrease in PET index. Also, the research conducted by Scharf and Kraus [
55] confirms these conclusions. The maximum daily average reduction of the index was 0.09 °C (for the warm period), and 0.66 °C (for the hottest day of the year). However, the greatest effect is attributed to the use of high greenery in urban areas. According to Aboleata [
22], PET index reduction is 1 to 3 °C. However, according to Cheung and Jim [
56], the reduction can reach 4 °C. In our investigation, the maximum change was 1.51 °C (for the warm period) and 5.41 °C (during the hottest day of the year). It is worth mentioning that the introduction of green roofs and walls have a considerably weaker effect on the microclimate than high greenery. According to Resler et al. (2020) [
57], the alleviating impact of the green infrastructure on human thermal discomfort is limited. There are factors that determine the introduced solution poignancy (root distribution, Leaf Area Index, and water content). In reality, the implementation of green roofs and walls might be connected with high maintenance costs, if these techniques are efficient.
5. Conclusions
Spatial planning of cities in the warm humid continental climate (Dfb), such as Lodz, where local conditions are linked to the historical urban planning system, should focus on measures to preserve cultural heritage. Planning records should include mitigation methods that will not significantly interfere with the settlement structure. The above-mentioned green infrastructure solutions are possible to introduce into the urban layout in the city of Lodz. There are 13.315 buildings in the historic urban core. Under conservatory protection is less than 9% of objects. So, there is significant room for improvement. When it comes to the most valuable buildings, the final decision of reconstruction is dependent on the conservation officer and spatial planners. Nevertheless, the taken actions are oriented toward the revitalization program. The decisions are connected with the inner structure refilling. The effect will be to preserve the unique character of urban space as well as implement green solutions.
In this paper, an attempt was made to find a method of estimating the impact of selected mitigation strategies on the microclimate, as well as thermal comfort of humans in the area of the historical city center. During this research, the fact that there are limitations on the possibility of computer simulations was essential to be taken into account. In the ENVI-met Science version, the terrain dimension may be above 50 × 50 × 40 cells. Its resolution may vary from 0.5 to 10 m (single-cell dimensions). Nevertheless, the simulation capabilities of desktop computers are limited. The analysis of large areas requires the adjustment of computer components to conduct the research, which is extremely costly. The larger the model size, the longer the simulation time. Therefore, in this study, the authors have decided to create a model of 104 × 107 × 30 cells with a resolution of 2 × 2 × 2 m. Thanks to this it was possible to shorten the time of computer simulations related to the introduction of green technologies into the modeled urban environment. Obtaining detailed data on the urban fabric (vector thematic map layers) allowed for the creation of the model of the typical inner-city development quarter. The parameters, building materials of objects, as well as the dominant types of existing surfaces were taken into account. It guaranteed that the specificity of the structure will be analyzed. Numerous authors emphasize that microclimatic conditions, and thus thermal comfort, depend on local conditions. Taking this fact into account, this study can be regarded as an effective way of mapping the characteristic features of the historical structure. It should be underlined that this is an arduous process.
An outdoor reality is a complex structure. There are any possibilities of considering a vast array of physical processes emerging in an environment. The application is designed for microscale processes simulations. Therefore, further constraints have to be mentioned. A complex synoptic situation is impossible to be taken into consideration. The limited domains have an influence on phenomena that cannot be implemented during the simulation process. For example, the changeable level of cloudiness, which has an impact on the radiation balance, cannot be considered. There is only the fixed adjustment factor for cloudiness. Large convective eddies are not implemented. The result is that there are discrepancies between real and simulated data, especially at night. Nevertheless, the used version of the application provides high accuracy outcomes, which were described in numerous aforementioned publications. It is worth mentioning that further research will be carried out by the use of the newest release of the ENVI-met. The mesoscale meteorological conditions will be taken into consideration because of the Forcing Manager module.
According to conducted research, one of the ways for non-invasive interference with the historical structure is the application of mitigation solutions related to the introduction of green infrastructure, i.e., green roofs, walls, as well as high greenery. Depending on the scenario under consideration, microclimatic parameters may be modified. The air temperature may decrease (maximum 1.05 °C for a green roof; 0.73 °C for living facade; 1.31 °C for high greenery). According to Konopacki and Akbari [
58], reducing the parameter by 1.1 °C/2 °F leads to savings of
$82 million. This corresponds to a reduction in peak power of 730 MW. Greenery reduces solar insolation. Therefore, a reduction in surface temperature is ensured. This is an alternative, non-invasive way to modify microclimatic conditions. Thanks to this, there is no need to interfere with the geometric structure of buildings or change the albedo materials used [
47]. Apart from the climatic aspect, it should be noted that the introduction of green solutions contributes significantly to reducing the level of pollution in cities. Their concentration may even be 30% lower in areas with high greenery [
32].


