Review

How Is Indoor Air Quality during Sleep? A Review of Field Studies

1
Centro de Ciências e Tecnologias Nucleares, Instituto Superior Técnico, Universidade de Lisboa, Estrada Nacional 10, Km 139.7, 2695-066 Bobadela LRS, Portugal
2
Centre for Environmental and Marine Studies (CESAM), Department of Environment and Planning, University of Aveiro, 3810-193 Aveiro, Portugal
3
Lisbon School of Health Technology, Polytechnic Institute of Lisbon (ESTeSL-IPL), 1990-096 Lisboa, Portugal
*
Author to whom correspondence should be addressed.
Atmosphere 2021, 12(1), 110; https://doi.org/10.3390/atmos12010110
Submission received: 22 November 2020 / Revised: 8 January 2021 / Accepted: 10 January 2021 / Published: 14 January 2021
(This article belongs to the Special Issue Indoor Air Quality—What Is Known and What Needs to Be Done)

Abstract

:
This review aimed to provide an overview of the characterisation of indoor air quality (IAQ) during the sleeping period, based only on real life conditions’ studies where, at least, one air pollutant was considered. Despite the consensual complexity of indoor air, when focusing on sleeping environments, the available scientific literature is still scarce and falls to provide a multipollutants’ characterisation of the air breathed during sleep. This review, following PRISMA’s approach, identified a total of 22 studies that provided insights of how IAQ is during the sleeping period in real life conditions. Most of studies focused on carbon dioxide (77%), followed by particles (PM2.5, PM10 and ultrafines) and only 18% of the studies focused on pollutants such as carbon monoxide, volatile organic compounds and formaldehyde. Despite the high heterogeneity between studies (regarding the geographical area, type of surrounding environments, season of the year, type of dwelling, bedrooms’ ventilation, number of occupants), several air pollutants showed exceedances of the limit values established by guidelines or legislation, indicating that an effort should be made in order to minimise human exposure to air pollutants. For instance, when considering the air quality guideline of World Health Organisation of 10 µg·m−3 for PM2.5, 86% of studies that focused this pollutant registered levels above this threshold. Considering that people spend one third of their day sleeping, exposure during this period may have a significant impact on the daily integrated human exposure, due to the higher amount of exposure time, even if this environment is characterised by lower pollutants’ levels. Improving the current knowledge of air pollutants levels during sleep in different settings, as well as in different countries, will allow to improve the accuracy of exposure assessments and will also allow to understand their main drivers and how to tackle them.

1. Introduction

Sleep has an essential role in human life by promoting human welfare, daily performance and health [1]. Since people spend around one third of their life sleeping, the quality of air that people breathe during this period has started to gain worldwide attention as a research topic in recent years aiming to understand, ultimately, how exposure to indoor pollutants may influence sleep quality [2,3].
Sleeping environments usually have specific characteristics, such as low ventilation rates [4] and a breathing area closer to potential sources of pollutants [2], that may promote acute or chronic exposure to specific air pollutants and, therefore, may significantly contribute to the daily exposure of individuals.
In the last decades, the importance of indoor air quality (IAQ) on human health has been confirmed throughout numerous studies conducted worldwide in different micro-environments (from offices to schools and dwellings) [5]. A wide range of adverse health effects [5,6] associated to indoor air pollutants, from pulmonary to cardiovascular diseases, has been reported, along with human mortality due to indoor air pollution [7].
Sleep is known to be a neurologically dynamic behaviour that is regulated by circadian and homeostatic processes [8]. In mammals, sleep is organised in cycles composed of two different states: rapid eye movement (REM) and non-REM sleep (NREM), with NREM being divided in two different stages (namely, deep and light) [8]. These different stages of the sleeping process have different neurological and physical manifestations [8], including reductions on the responsiveness to external stimuli, electromyographic activity, body movement, breathing rates, along with closed eyes, altered body position and brain wave architecture [9]. Sleep is influenced by several factors, from physical and mental conditions [10,11] to environmental factors, such as temperature [12,13], light [14] and noise levels [15], and carbon dioxide (CO2) levels [1]. However, taking into account the IAQ complexity by which it can be characterised, until now very few studies have focused on understanding if any other IAQ parameter may have an impact on sleep quality and to what extent. This valuable information would be useful to propose mitigation measures to improve the IAQ conditions of sleeping environments and, ultimately, the sleep quality of the individuals.
Moreover, a comprehensive characterisation of IAQ during sleep is still scarce in the literature [16], with most studies focusing only on comfort parameters [17] or single pollutants, such as CO2 [1]. In addition, although very few studies have provided an overview of IAQ during sleep in real life conditions until now, one of their main outcomes is that some pollutants presented levels above the established guidelines, such as particulate matter (PM), volatile organic compounds (VOCs), formaldehyde (CH2O) and CO2 [18].
Even if exposure levels to indoor air pollutants during sleep may be low it is important to highlight that, taking into account the daily time spent in this essential activity to human life and welfare (hopefully 8 h per day and, ultimately, one third of human life), it may have an important impact on the daily integrated human exposure and it potentially may have an impact on the sleep quality. Therefore, understanding the exposure levels during sleep in the bedroom microenvironment is crucial to improve daily integrated exposure assessments and to provide information for further research of how IAQ may influence sleep quality.
Therefore, this study aims to perform a review of field studies of IAQ during sleep, mainly focusing on air pollutants and comfort parameters (when available simultaneously), and also by evaluating their compliance with IAQ guidelines. Overall, the main goal is to supply to the scientific community a worldwide overview of the studies about this topic in order to understand how the exposure during sleep can be characterised.

2. Methods

The procedure to perform this review followed the guidelines defined by PRISMA (Preferred Reporting Items for Systematic Reviews and Meta-Analyses) statement [19].

2.1. Search Strategy

Literature search was done during August 2020 using Web of Science and Scopus to identify research articles within our defined scope. This database was searched using simultaneously (using “AND”) both terms “indoor air quality” and “sleep” together in the “Topic” field, which includes search in the title of the article, its abstract and keywords. A total of 127 articles were identified as potential articles to include in the review.

2.2. Inclusion Criteria

Considering the aim of this review, only studies conducted in real life conditions (dwellings, students dorms, elderly care centres) were considered, focusing only on the exposure to indoor air pollutants (considering comfort parameters only when associated) during the sleeping period (individuals had to be sleeping during the IAQ assessment). Therefore, only studies with, at least, the assessment of one air pollutant during the sleeping period were considered. Studies based on experimental environments and review articles were excluded from our analysis. Additional articles from other sources that met the inclusion criteria were included in the review analysis.
The set of articles identified through the search phase was retrieved and their full text was evaluated regarding the inclusion criteria. References were also evaluated for additional articles suitable for inclusion.

2.3. Data Extraction

Data from suitable publications was extracted including year of publication, location and type of environment, characteristics of participants and their bedrooms, air pollutants (assessed levels and methodology), and comfort parameters and ventilation conditions (when available). Whenever possible, statistical data such as mean, standard deviation, median, minimum and maximum for each setting and pollutant was extracted.

3. Results

A total of 22 articles from 2003 to 2020 were found to be suitable to be included in this review. The search and selection process is summarised in Figure 1.

3.1. Studies’ Settings

The selected studies were conducted in a total of 12 different countries distributed over four continents: Australia [20,21], Asia (Bhutan [22], China [23,24,25,26,27], Singapore [28,29] and South Korea [30]), Europe (Belgium [31], Denmark [1], Italy [32], Poland [33], Portugal [18,34,35,36,37] and the Netherlands [38]) and North America (USA [39]). Table 1 provides an overview of the characteristics of the selected studies, being that the urban environment stands out as the more common environment where the studies were done (64%), followed by mixed types of environment (urban/suburban and urban/rural) in 27% of the cases and only 9% of the studies were done in suburban or rural environments.
From the set of select studies, 77% were done in dwellings, focusing only on apartments (41%) or only on detached houses (9%) or a mix of both (27%). The remaining studies were conducted in scholar residences (14%) and in elderly care centres (9%). Regarding the type of ventilation, 54% of the studies were related to bedrooms with natural ventilation, 32% focused on bedrooms with both natural and mechanical ventilation conditions, and 14% of the studies did not report any information regarding the type of ventilation conditions for the studied bedrooms. Another parameter that varied within the selected studies was the number of occupants of the bedrooms, a factor that will condition IAQ during sleep since human presence is a potential source of some IAQ parameters, such as CO2, due to human respiration. Overall, 46% of the selected studies were performed in single-occupied bedrooms, while 23% with two occupants, 4% with a mixture between one or two occupants, 4% with four or six occupants and 23% of the studies did not supply any information regarding the type of occupancy. The age of occupants also varied, ranging from 8 (children) to 104 (elderly).
It is also noteworthy to highlight that the studies were done in different seasons and periods of the year and the average sleeping period of the occupants, when available, was also highly variable, ranging from 4 h 30 min [36] to 10 h [33].
A summary table (Table S1) with all the relevant details and results of the selected studies is available in Supplementary Materials.

3.2. Evaluation of Environmental Parameters

World Health Organisation (WHO) highlighted the importance of IAQ through its set of statements entitled “The right to healthy indoor air” [40] and developed a set of IAQ guidelines [41] aiming to minimise human exposure to indoor air pollutants taking into account IAQ as a main determinant for human health. Regionally, different international bodies and national legislations have implemented IAQ guidelines and limit values [42,43]. Therefore, IAQ parameters analysed in this review were evaluated regarding WHO’s guidelines, such as carbon monoxide (CO), CH2O, PM2.5 and PM10, and, when necessary, specific national legislation [44] (specifically for CO2 and VOCs since WHO’s guidelines did not provide information regarding these pollutants). In these cases, Portugal’s IAQ legislation was applied since, for the WHO’s target pollutants, it applies limit values similar to the WHO guidelines for short exposures and it is based on European Directives [45]. For the remaining parameters, the international guideline ISO 7730:2005 [46] was used for temperature (T) and relative humidity (RH), and the international guideline EN 16798-1:2019 [47] for air changes per hour. Table 2 provides an overview of the limit and guideline values for each parameter. For PM levels, the air quality guideline (AQG) values recommended by WHO consider only outdoor levels (no indoor AQG is available yet) and were considered for 24 h but also for the lower AQG of one year exposure, namely 10 µg·m−3 for PM2.5 and 20 µg·m−3 for PM10 (regarding annual mean) [48], taking into account the awareness of their impact on human health [49].

3.2.1. Temperature

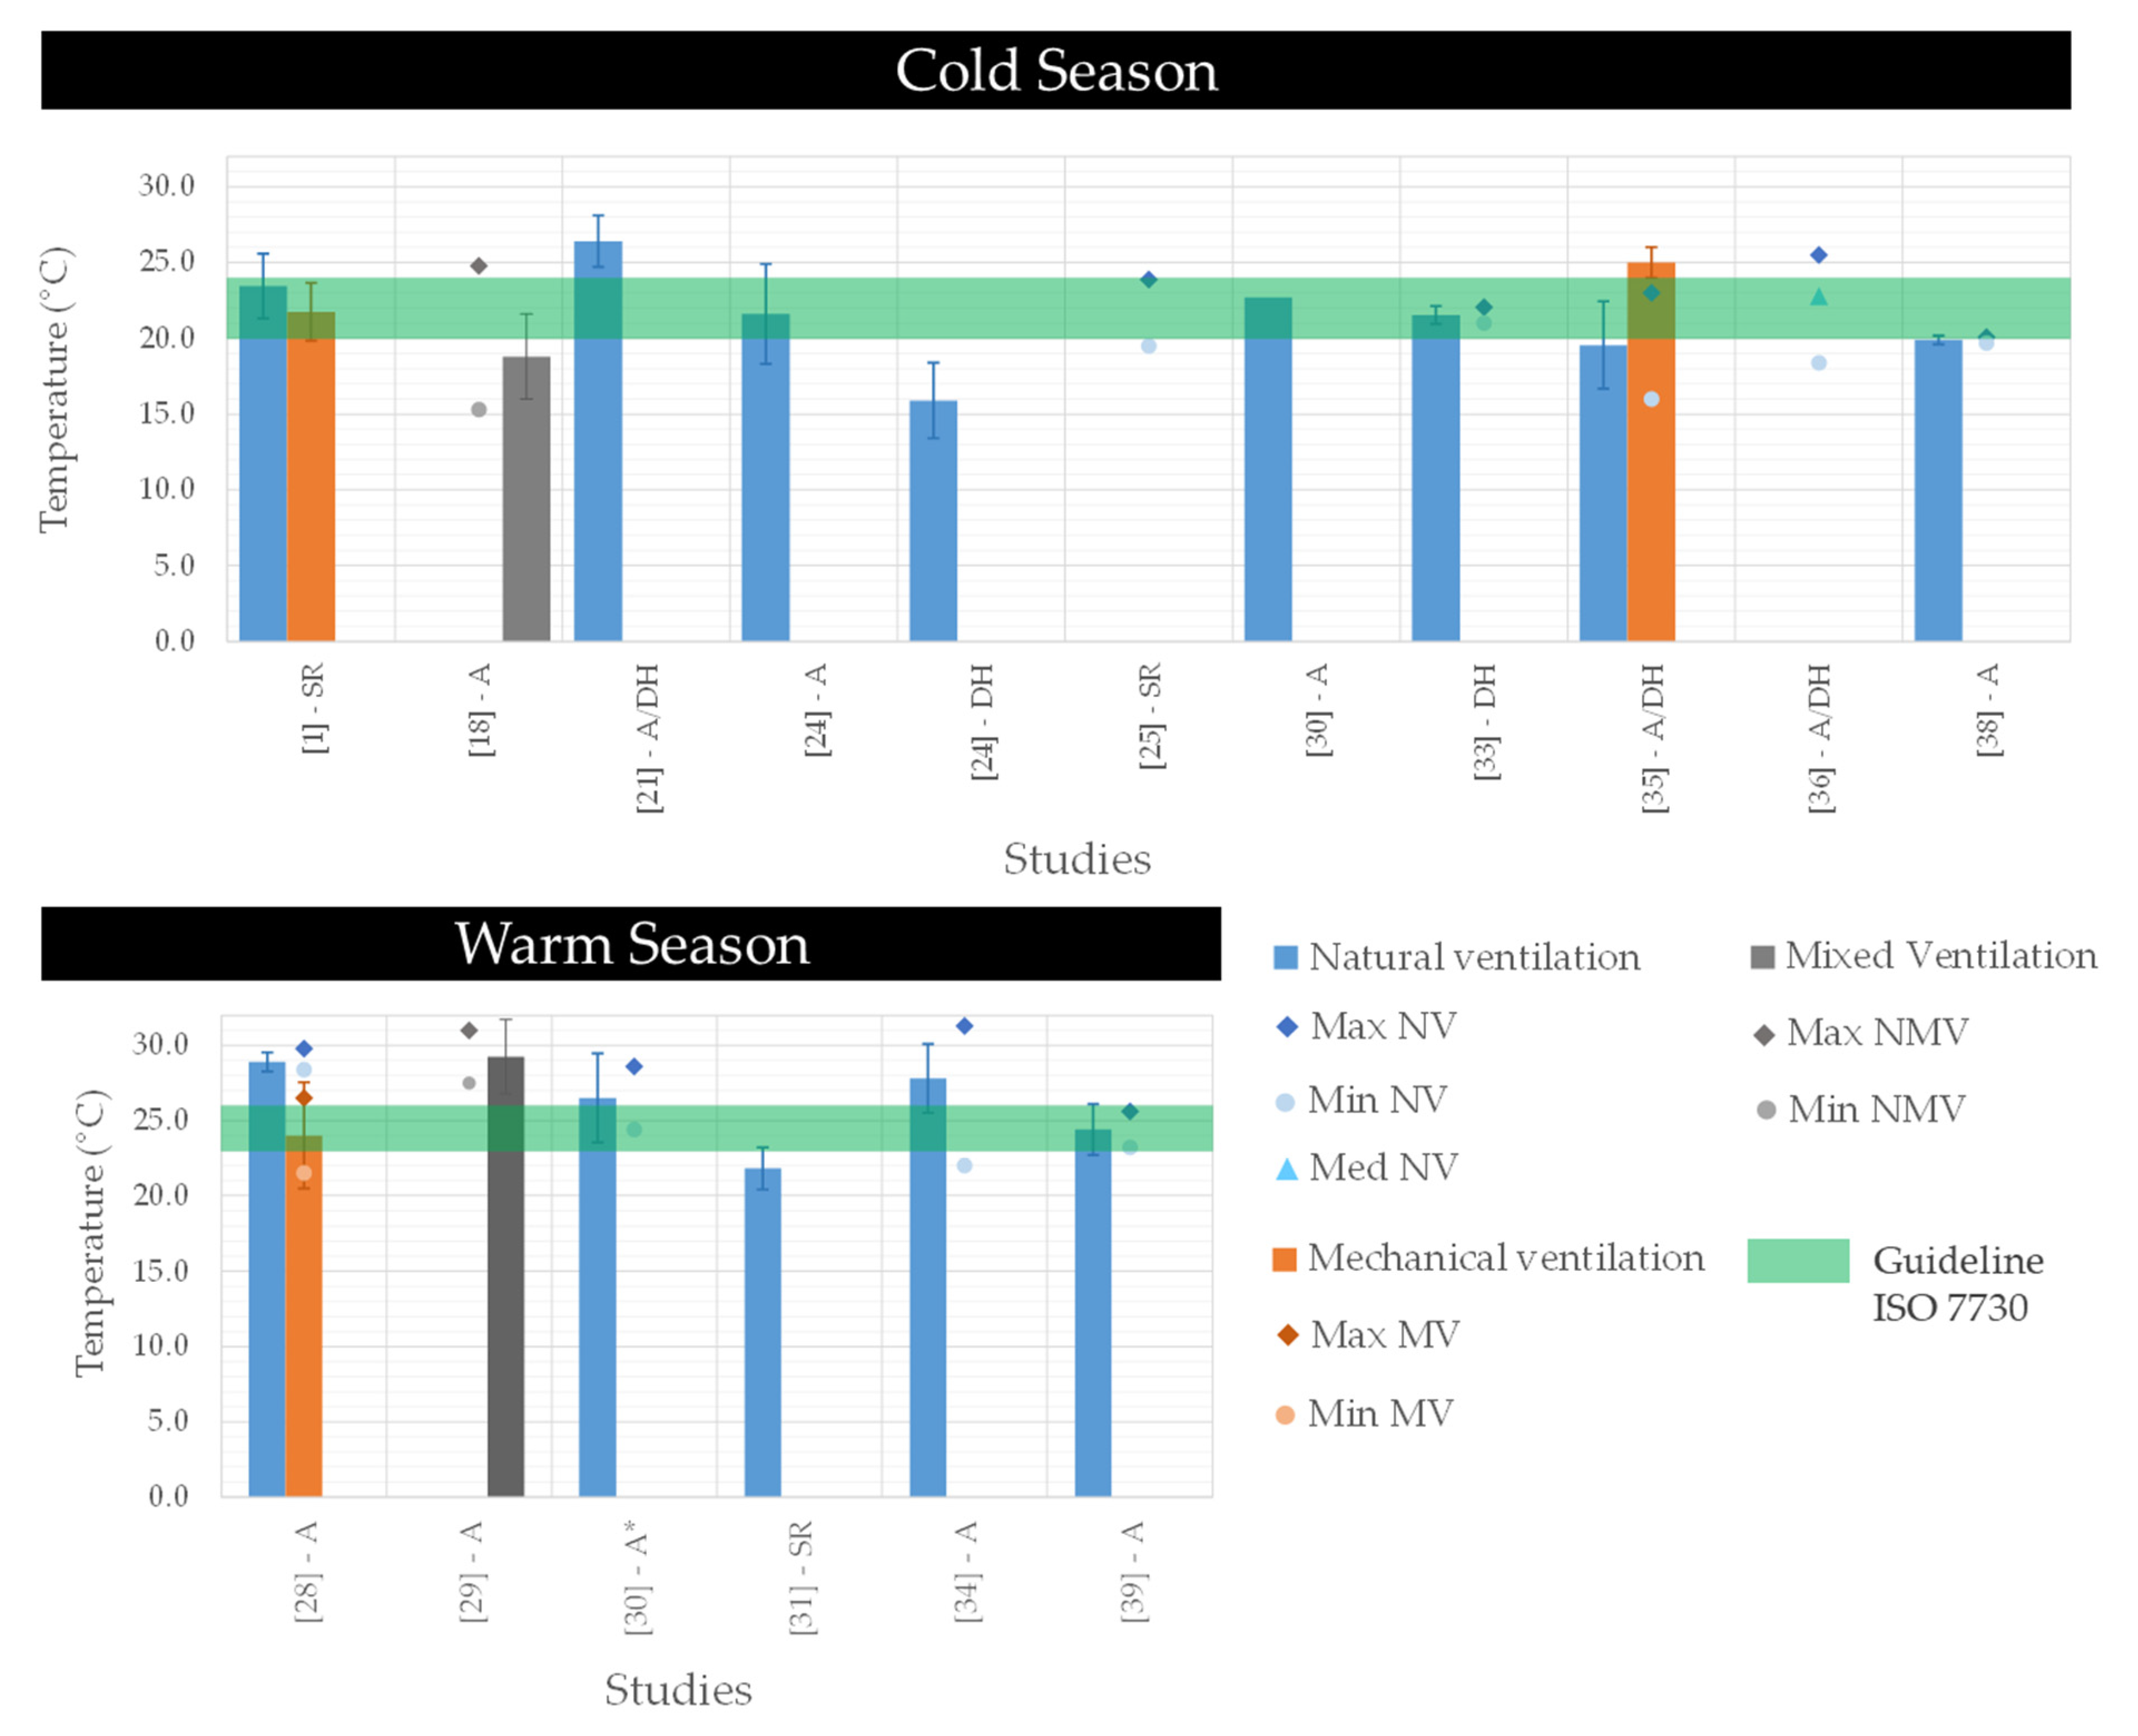
Figure 2 provides an overview of the temperature values registered in the studies that provide such information, along with discrimination regarding the type of ventilation used in the monitored bedrooms. During the cold season, the mean air temperature registered during sleep was 21.5 ± 2.9 °C, ranging from 15.9 [24] to 26.4 °C [21]. During the warm season, the mean air temperature monitored in the bedroom during sleep was 26.1 ± 2.8 °C, ranging from 21.8 [31] to 29.3 °C [29].
Considering the international guideline ISO 7730 [46] that establishes temperature ranges for the occupants’ comfort in cold and warm seasons, only 42% (8 of 19) of the cases were within the acceptable range. Natural ventilation (NV) was the common ventilation setting of the monitored bedrooms with an incidence of 74% (14 of 19) but only providing acceptable temperature levels in 43% of the cases (6 of 14). Mechanical ventilation (MV) was available in three studies (16% of the cases) and assured temperature levels within the acceptable ranges only in two cases. Two studies (11% of the cases) specified the ventilation setting as a mix between natural and mechanical (NMV) and none of them managed to assure an acceptable level of temperature during the sleeping period.

3.2.2. Relative Humidity

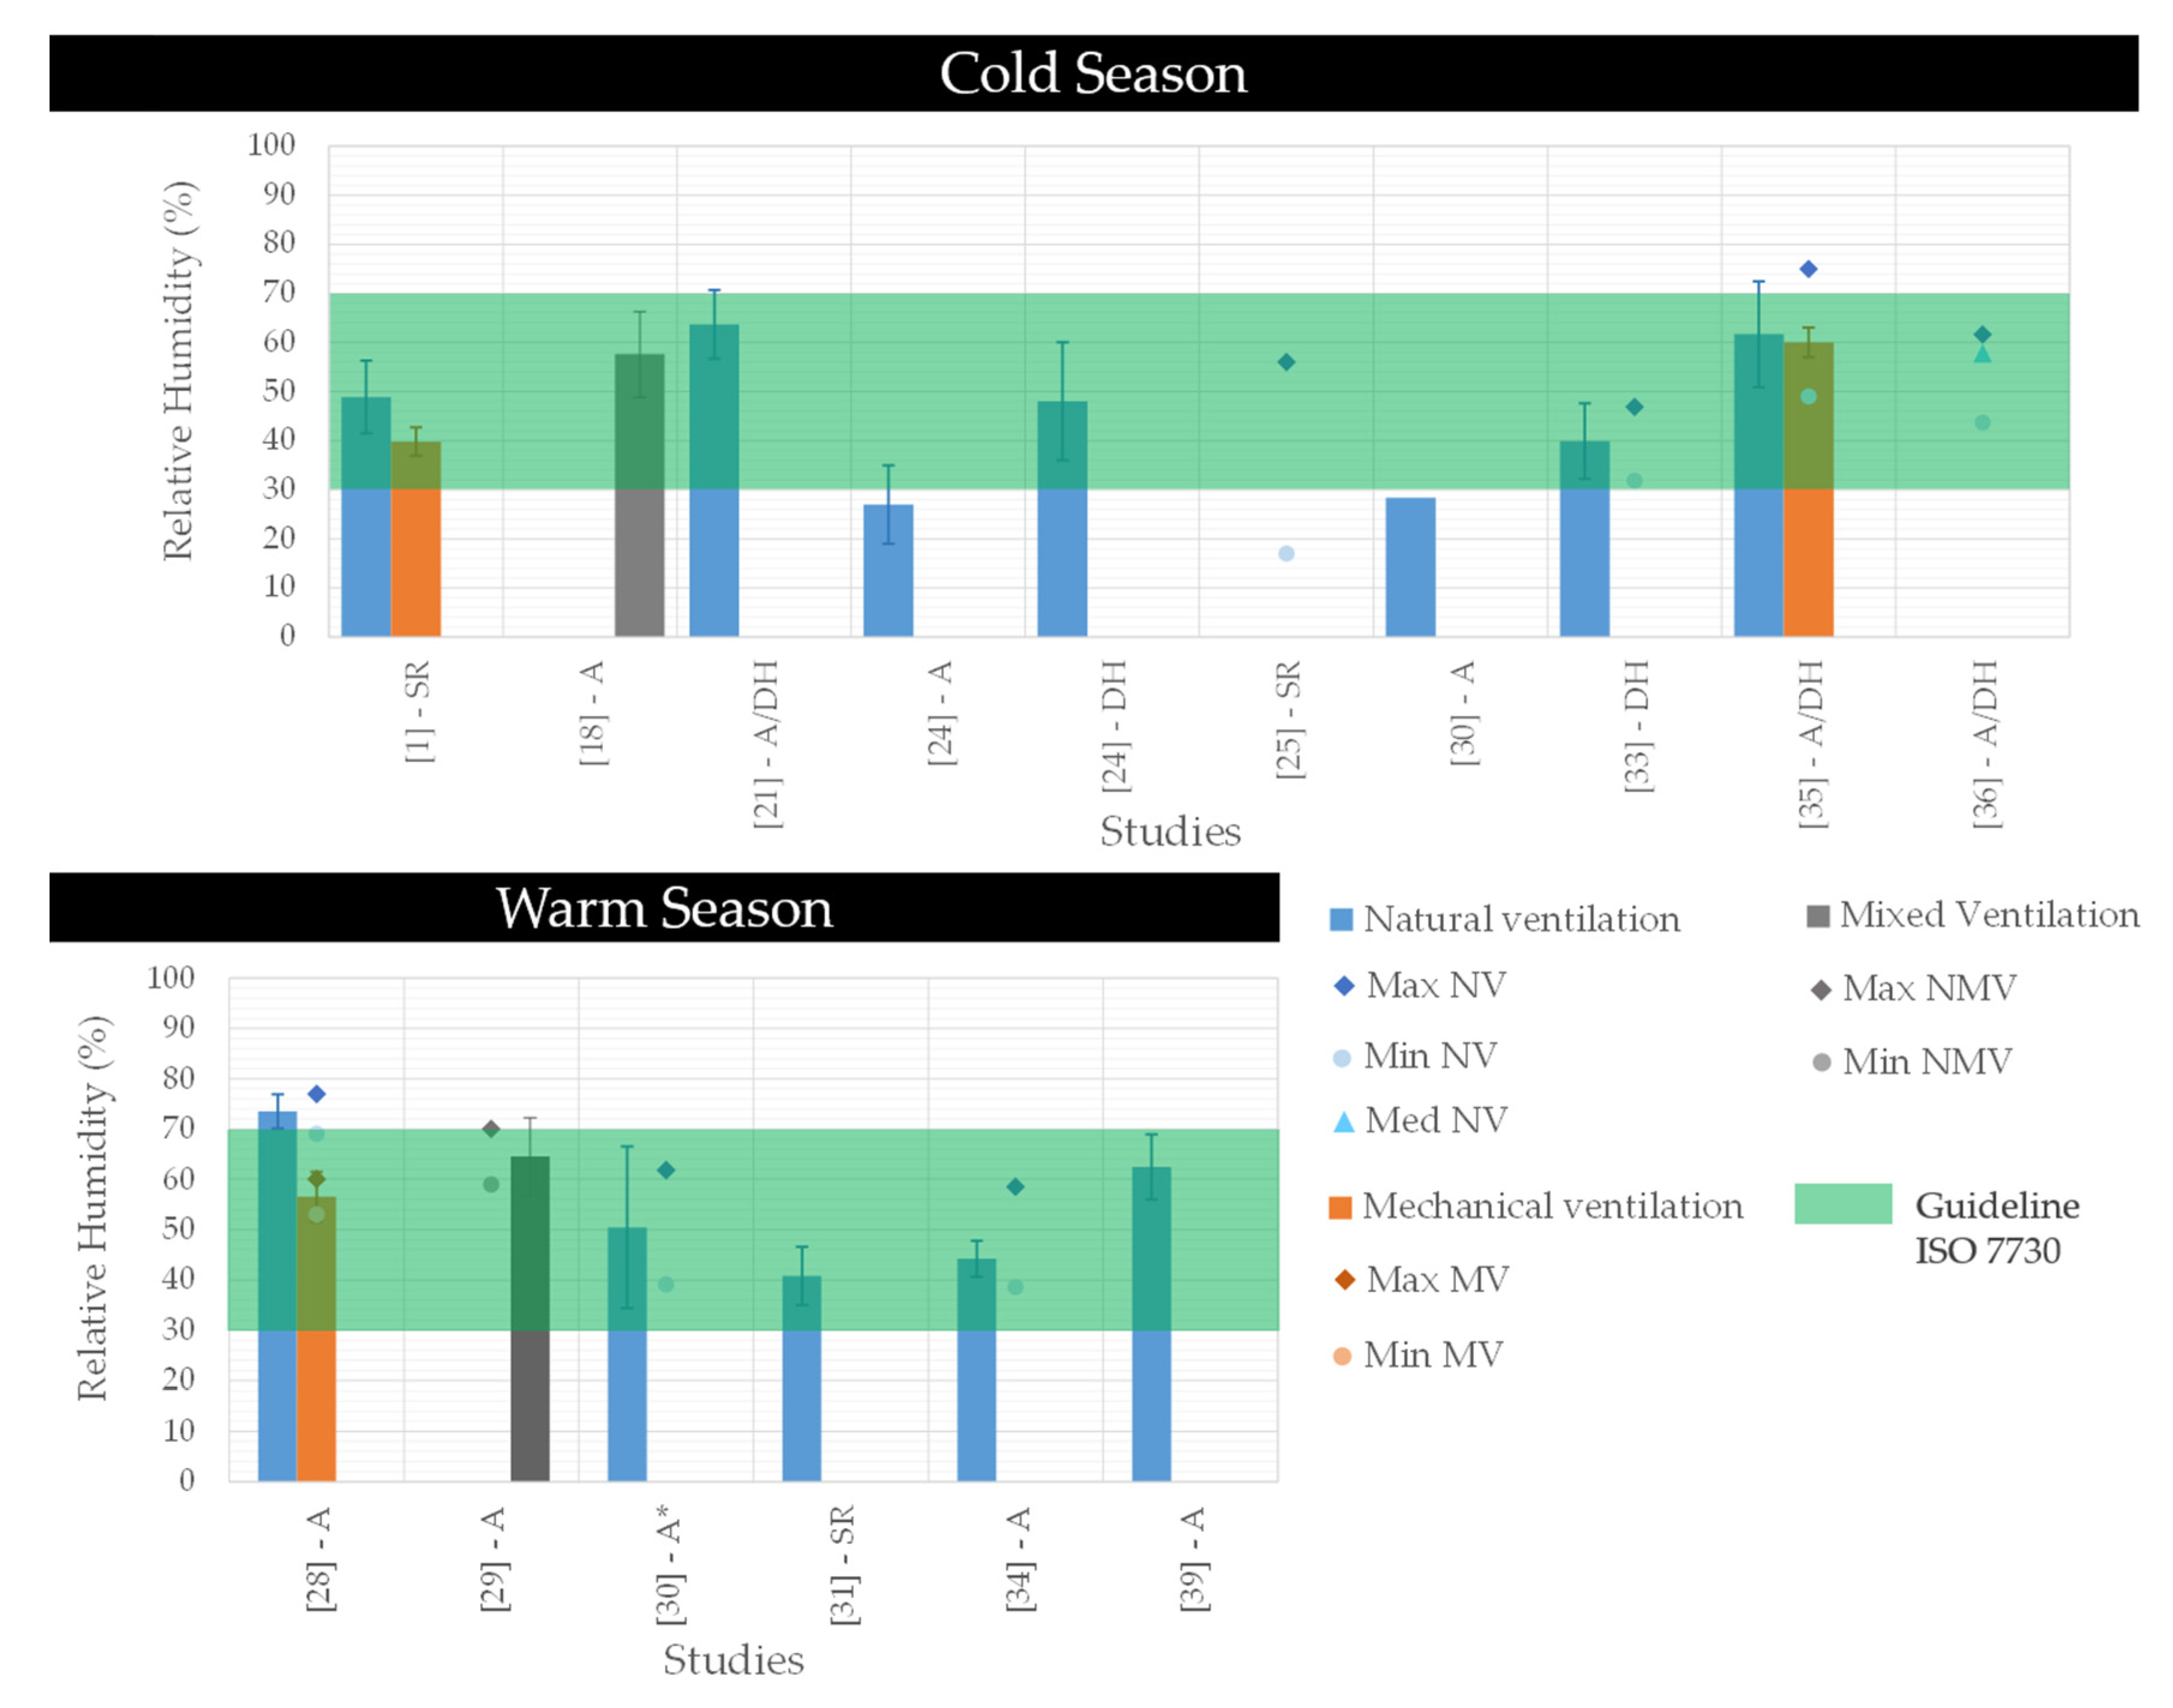
The summary of relative humidity levels registered in 17 cases provided by the selected studies are shown in Figure 3. During the cold season, the mean relative humidity registered in bedrooms during sleep was 47.5 ± 13.4%, ranging from 27.0% [24] to 63.7% [21]. During the warm season, the mean relative humidity registered in bedrooms during sleep was 56.1 ± 11.7%, ranging from 40.8% [31] to 73.5% [28].
Considering the acceptable range between 30% and 70% for the comfort of occupants established by international guideline ISO 7730 [46], mechanical (MV) and mixed (NMV) ventilation settings provided relative humidity levels within this range for all their cases (3 and 2, respectively). Natural ventilation settings only managed to provide acceptable levels of relative humidity for 77% of the cases (10 of 13), with two cases during the cold period (with relative humidity levels below the lower limit of 30% of the acceptable range) and one during the warm period (with levels above the upper limit of 70%).

3.2.3. Carbon Dioxide

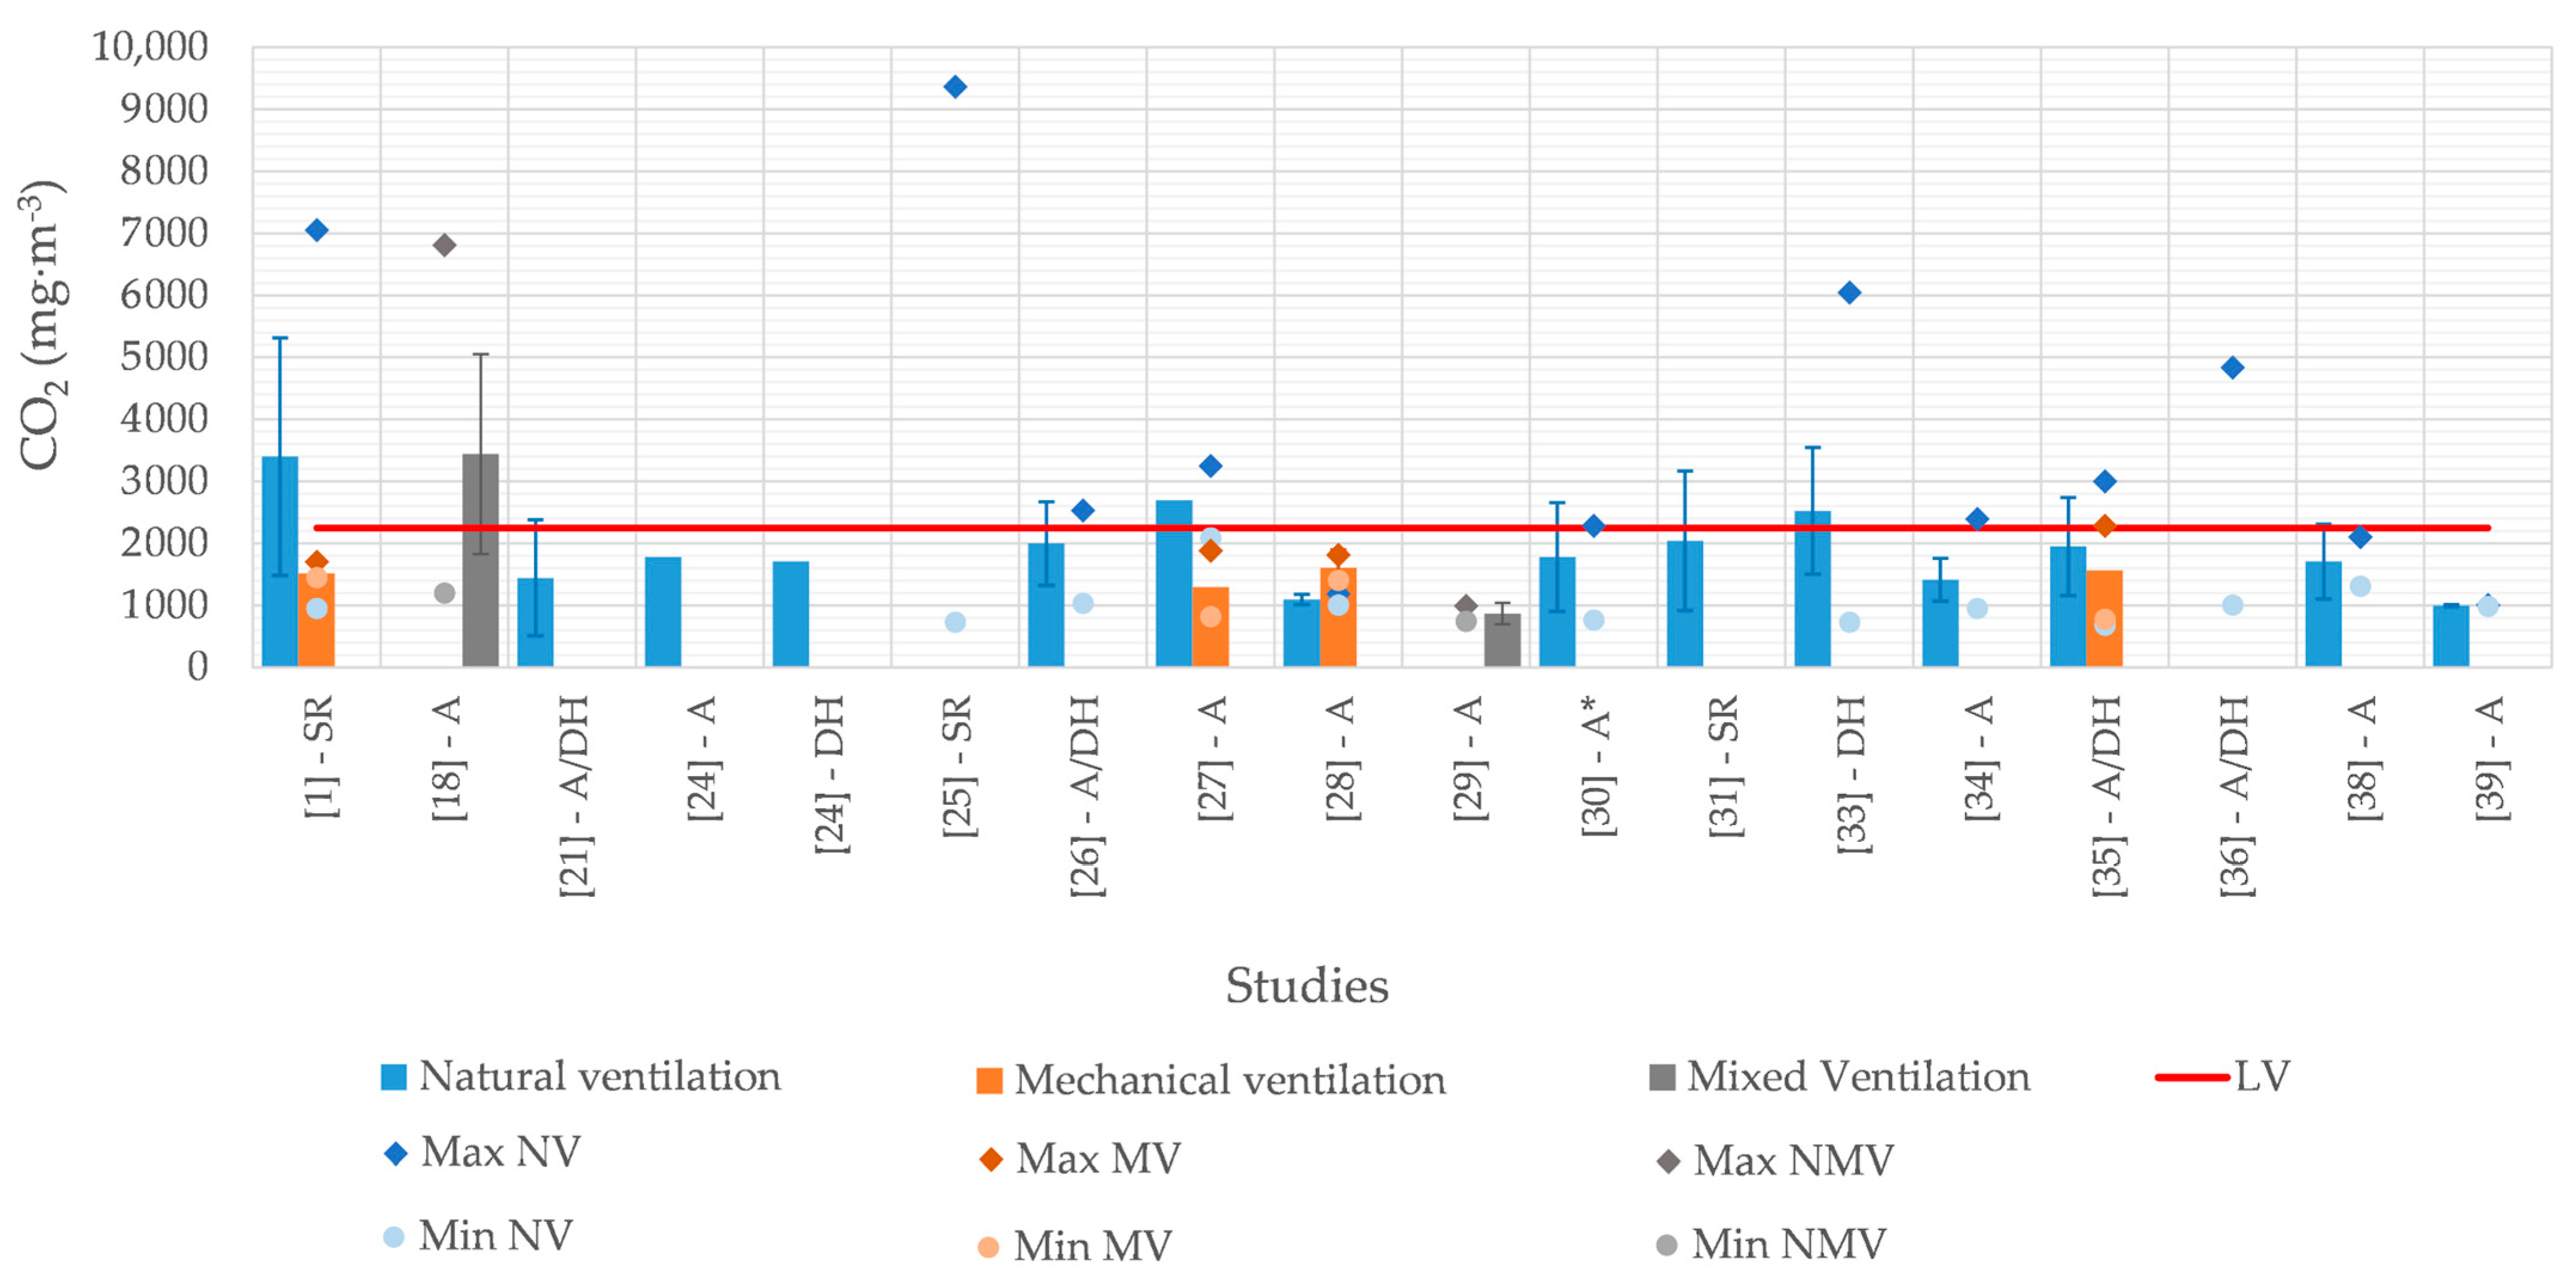
Figure 4 provides the CO2 levels in the selected 17 studies. These were made in scholar residences (18%), in apartments (47%), in detached houses (6%) and simultaneously in apartments and detached houses (29%).
Considering the ventilation types, measurements were made mainly in bedrooms with natural ventilation (65%), but also in rooms with mechanical ventilation (20%), with both natural and mechanical ventilation (10%) and in a room where the type of ventilation used was not specified (5%). Overall, CO2 levels during sleep registered a mean value of 1840 ± 700 mg·m−3, ranging from 870 [29] to 3440 mg·m−3 [18]. Exceedances in CO2 average concentrations regarding the limit value of 2250 mg·m−3 (1250 ppm) established by the Portuguese legislation [44] were registered in four studies, in which natural (three studies) and mixed (one study) ventilations were used. There were no exceedances of the limit value in any of the four cases where only mechanical ventilation was used.
In the bedroom, CO2 is generated exclusively by the occupants through the breathing process and its individual generation rate depends on different factors (age, gender or physiological parameters such as body mass) [50]. For instance, a couple (one female and one male) has a CO2 generation rate of 0.0036 L·s−1 [50]. Therefore, CO2 levels may indicate if the bedroom’s ventilation is good or not, since high CO2 levels are usually associated with low ventilation rates [51].

3.2.4. Carbon Monoxide

Figure 5 provides CO levels during the sleeping period in bedrooms, where mean levels of 1.30 ± 0.94 mg·m−3 were found, ranging from 0.55 [35] to 2.92 mg·m−3 [34].
It is important to highlight that only four studies provided such information and all of them were performed in Portugal using real time monitors (namely, Graywolf (IQ-610 probe, GrayWolf Sensing Solutions, LCC, Shelton, USA)). Taking into account that the source of this pollutant is incomplete combustion processes from, for example, in indoor environments [52], namely cooking appliances, water heating systems or fireplaces [53], which are not located in the bedroom, it would be plausible to speculate that CO levels in bedrooms would be very low. However, although all studies showed values below the WHO’s AQG of 10 mg·m−3 [41], the values are not negligible, which may indicate infiltration from other rooms of the dwellings (such as kitchen or living room where potential sources exist such as gas appliances) or from the outdoor (considering sources such as traffic exhaust emissions [54]). In fact, in the study where the highest levels of CO were registered, the authors highlight that the studied apartment was located above a restaurant where, besides the existence of exhaust of the restaurant’s cooking appliances, clients smoked outdoors which may have promoted the CO infiltration through the window and potential exposure to second hand smoke [34].
Low levels of CO can also be released due to normal human metabolism where it is a product of degradation of haemoglobin via heme oxygenase enzyme (85%) and of the degradation of myoglobin, guanylyl cyclase and cytochromes (15%) [55], where the production rate of CO in the human body has been estimated to be around 16.4 µmol CO per hour [56].

3.2.5. Volatile Organic Compounds

Only four studies provided data for VOCs levels during the sleeping period using real time monitors (namely, Graywolf (IQ-610 probe, GrayWolf Sensing Solutions, LCC, Shelton, USA)) and are displayed in Figure 6. Mean VOCs levels of 1.33 ± 0.76 mg·m−3 were registered in bedrooms’ indoor, ranging from 0.55 [34] to 2.40 mg·m−3 [36]. Considering the limit value of 0.6 mg·m−3 established by the Portuguese legislation [44], only one study managed to provide a mean VOCs level below that threshold. It is important to highlight that the monitoring season of that study was summer [34], which is characterised by improved natural ventilation (due to the atmospheric conditions typical of south European countries) and may explain this compliance. The remaining studies were all conducted during the winter period, which is associated with a deficit of natural ventilation of dwellings due to atmospheric conditions [57], and, therefore, it may explain the registered exceedances.
Indoor levels of VOCs can be emitted by common household products (such as carpets [58]) and building materials (such as varnishes and paints [59]), as well as by consumer and cleaning products [60,61,62]. From the exceedances found in the selected studies, one study was performed in an elderly care centre [35] and, based on the temporal analysis of VOCs and the associated time activity diary of the individuals, the use of cleaning products during the elders uprising was associated to the morning VOCs’ peaks. Regarding the remaining studies [18,36] that showed VOCs levels above the considered threshold, the authors indicated the indoor sources specified previously, along with the potential contribution of infiltration of smoking emissions [63,64] or due to the contribution of thirdhand smoke (THS), which is the reemission of the persistent residue generate from aged secondhand smoke (SHS) that adheres to surfaces, clothing, hair and skin [65].
It is relevant to highlight that humans are also considered as sources of VOCs in relatively crowded environments, where VOCs emissions occur via exhalation [66,67] or dermal emission (for example, the increase of odour intensity in unappropriated ventilated environments can be originated from human bioeffluents [68]).

3.2.6. Formaldehyde

Only four studies supplied information about CH2O levels monitored during the sleeping period, and all of them were from the same country, Portugal. Other studies can be found in the literature with monitored levels of CH2O in bedrooms but the monitoring procedure has a different timeframe than the sleeping period (e.g., during six consecutive days in the bedrooms, including sleeping and no sleeping periods [52], or without specifying the monitoring period [69]) and, therefore, were excluded from this analysis.
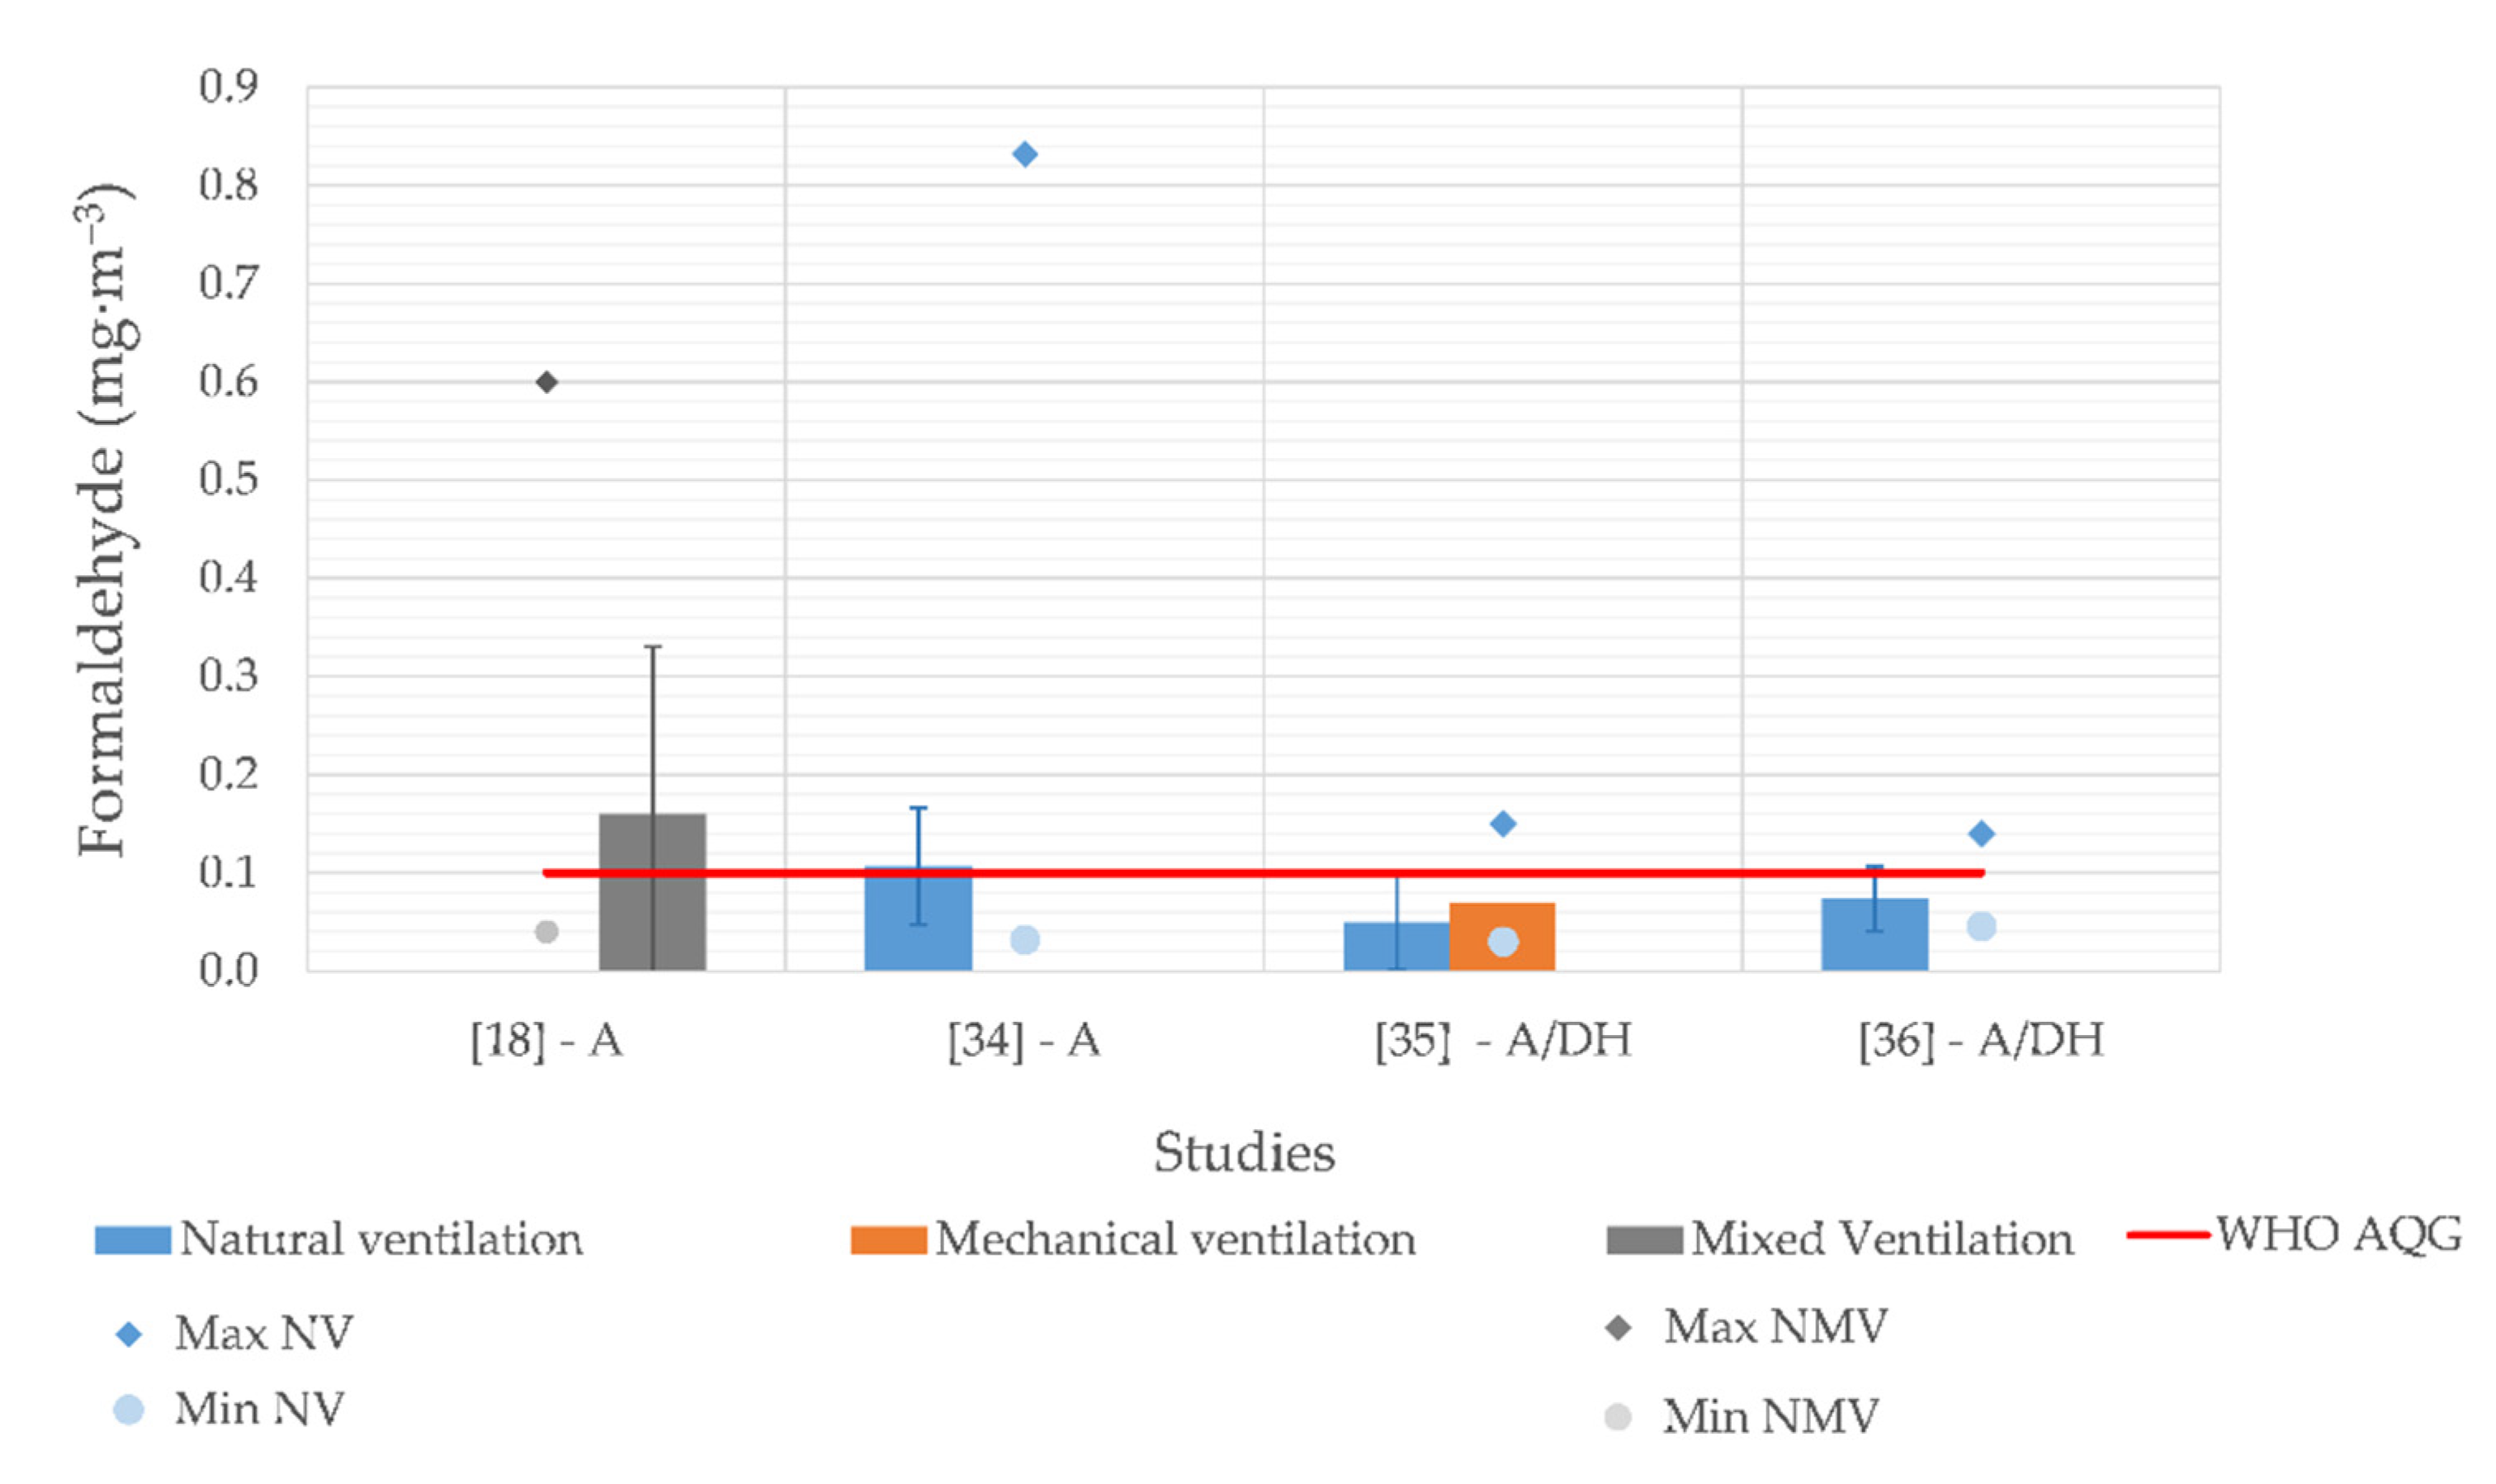
Overall, mean CH2O levels of 0.092 ± 0.043 mg·m−3 were found, ranging from 0.050 [35] to 0.160 mg·m−3 [18]. By analysing the selected studies and considering the air quality guideline of 0.1 mg·m−3 established by WHO [41], only two studies (one conducted in naturally ventilated bedrooms and the other one in mixed ventilated bedrooms) provided mean values of CH2O above this guideline value, while the others cases were all below this threshold, as shown by Figure 7. It is important to highlight that in those two studies with mean values above the guideline value, maximum levels of 6 [18] and around 8 [34] times that threshold were found in bedrooms during the sleeping period. In all these studies, a real-time monitor (namely, Formaldemeter htV-M, PPM Technology Ltd, Caernarfon, Wales, UK) was employed instead of passive samplers required by the national legislation [44], which may present some limitations already highlighted (such as lower specificity for lower concentrations which may result in an overestimation of CH2O levels [34]). However, this monitoring strategy allows to identify concentrations specifically during the sleeping period.
This pollutant is common in indoor environments due to its widespread use in the production of binders and resins (typically used in wood products as furniture and plywood), paints and coatings, plastics, building and flooring materials, and consumer products [70]. Combustion processes developed in dwellings, such as smoking, candle burning and heating, are also indoor sources of formaldehyde [71]. It is also important to highlight that indoor emission rates of formaldehyde may be promoted by the increase of temperature and relative humidity [72,73].

3.2.7. Particles

Despite the importance of assessing PM levels due to its potential health hazard to humans [49], very few studies focusing on sleeping environments still evaluate these parameters. Only 23% (5 out of 22) of the studies provided levels for both PM2.5 and PM10 during the sleeping period in bedrooms. Some available studies in the literature were excluded from this review because the monitored period was not exclusive to the sleeping period. It is also important to highlight that the used monitoring/sampling methods differed between studies, from using laser photometer based on light scattering technology (such as the DustTrak DRX monitor from TSI, Shoreview, Minnesota, USA) [18,34,35,36], gravimetric method (using a TCR-Tecora sampler) [37] to a commercially available low cost sensor (Awair—only for PM2.5, with an accuracy of 15% and a measuring range from 0 to 500 µg·m−3) [31]. From the select studies, a great majority was done in Portugal (around 83% of the cases) [18,34,35,36,37], while the remaining one was conducted in Belgium [31], which highlights the need to conduct such assessments in other countries to understand the human exposure to these pollutants during sleep.
One of the main constraints of PM sampling using reference methods (such as gravimetric ones) is the noise of sampling equipment that may interfere in the sleep quality of the occupants (an optimal sleep environment is characterised by a noise level below 35 dB [74]) and, moreover, the impossibility of obtaining real time data during the sleeping period. Therefore, real time monitors, such as the ones based on light scattering, are a viable and interesting option to use, despite still having a potential noise interference (due to internal pumps) and, more importantly, the need of calibration with reference gravimetric methods to assure the reliability of the monitoring (in addition to a factory calibration of the devices) [75,76]. The same procedures of intercalibration with reference methods should also be applied to low cost sensors to assure the reliability of the results [77,78].
Figure 8 presents PM2.5 and PM10 levels monitored during sleep in the selected studies, where PM2.5 mean levels of 19.0 ± 10.9 µg·m−3 (ranging from 5.0 [35] to 35.1 µg·m−3 [36]) and PM10 mean levels of 20.4 ± 10.0 µg·m−3 (ranging from 10.0 [37] to 39.2 µg·m−3 [36]) were found. Regarding PM2.5, only the study in naturally ventilated bedrooms of apartments and detached houses [36] surpassed the AQG for 24 h of 25 µg·m−3 recommended by WHO [41], with levels of 35.1 ± 32.4 µg·m−3. These high PM2.5 levels along with a high standard deviation may be attributable to the fact that 6 of 12 studied bedrooms were of smokers (despite no smoking in bedrooms). Considering the WHO’s AQG for 1 year of 10 µg·m−3, only the bedroom with mechanical ventilation provided levels below this level [35] (17% of the studied cases). Regarding PM10 levels, all studies monitored mean PM10 levels below the AQG for 24 h of 50 µg·m−3 recommended by WHO [41], with only 43% of the cases (three out of seven) with values below the AQG for 1 year of 20 µg·m−3, obtained in bedrooms with natural [37] or mechanical ventilation settings [35,37].
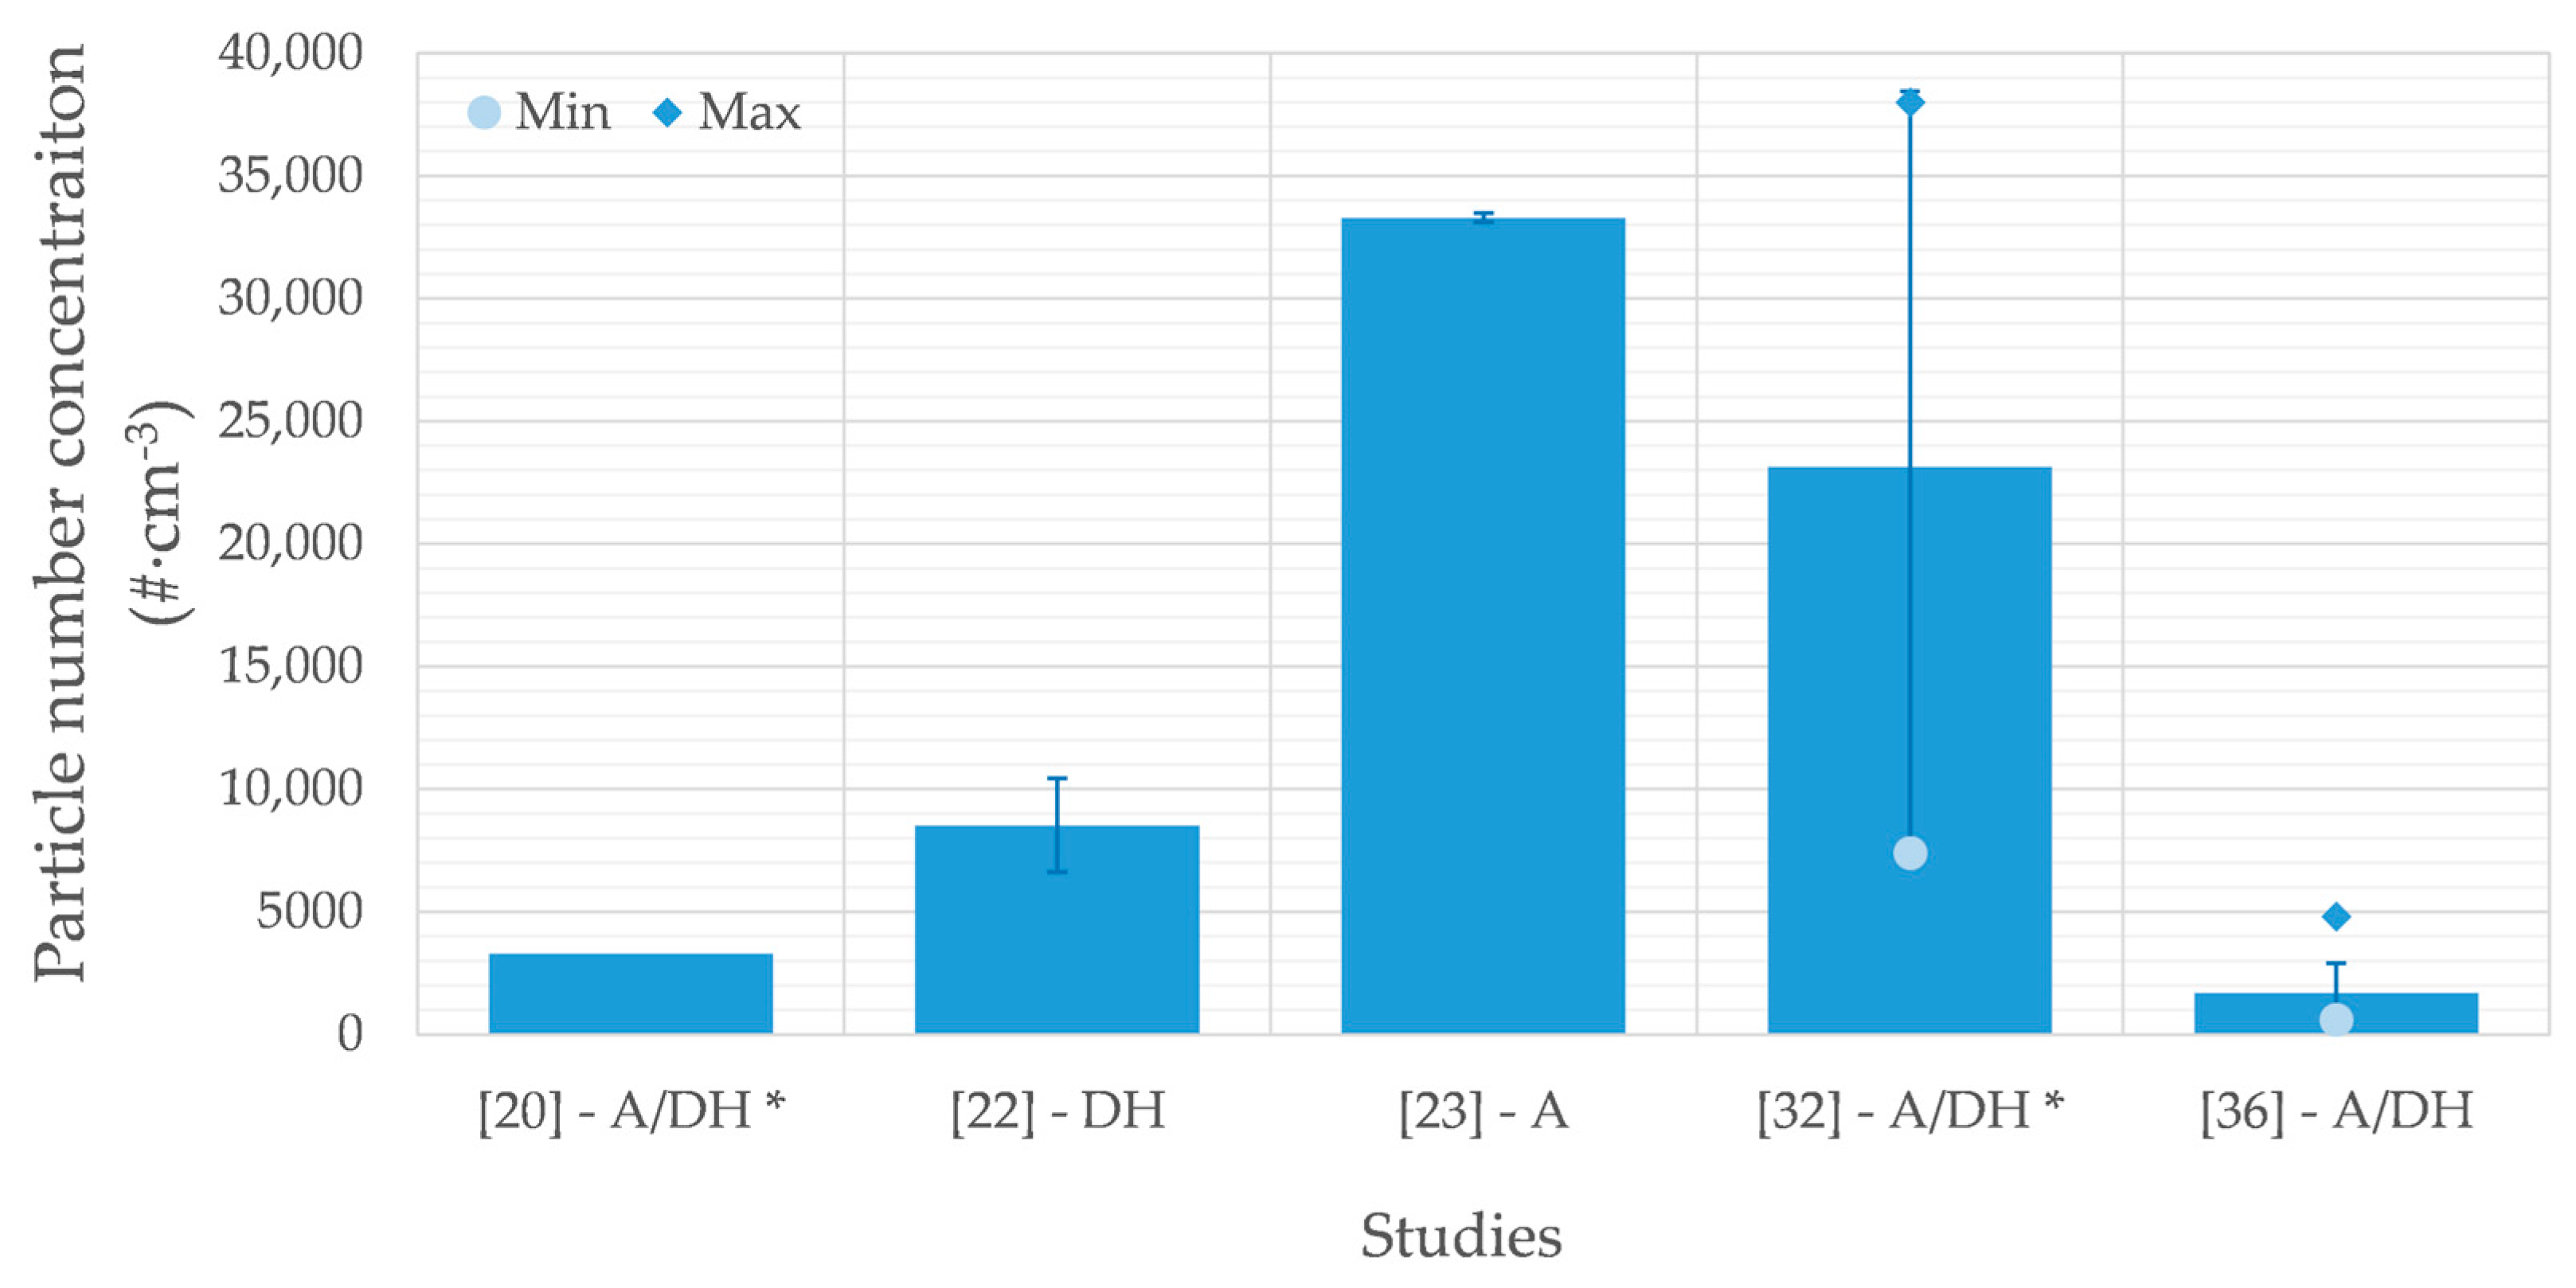
Ultrafine particles (UFP), usually measured by their particle number concentration (PNC, number of particles of diameter above 10 nm in one cm3 of air), are not yet legislated, despite the growing concern of their potential health hazard to humans [79,80]. Figure 9 provides mean UFP levels found in the selected studies, ranging from 1.7 × 10³ [36] to 33.3 × 10³ particles·cm−3 [23] (with an overall mean of (14.0 ± 13.7) × 103 particles·cm−3), which shows a great variability between studies. In 80% of the studies (four of five), the same monitoring device was used, namely a Philips Aerasense NanoTracer, while in one of the studies a different device was used (Pegasor AQTM Indoor Air Quality form Coorstek Amazing Solutions).
Indoor levels of ultrafine particles in dwellings are influenced by outdoor levels (due to infiltration to indoors) [81], building characteristics [82], along with indoor sources (such as candle burning, cooking, environmental tobacco smoke and heating devices [83,84]) and human-related activity [85].

3.2.8. Air Changes per Hour

Six studies selected from the present review provided simultaneously levels of some air pollutants along with information regarding air changes per hour (ACHs) during the sleeping period. Figure 10 provides mean ACHs for the selected studies (with an overall mean of 1.31 ± 0.81 h−1, ranging from 0.29 [26] to 2.84 h−1 [34]), where it is possible that only one study did not manage to provide the minimum value of 0.7 h−1 established by the guideline EN 16798-1:2019 [47]. In this specific case, a total of 164 bedrooms were evaluated in Chinese dwellings with natural ventilation (namely, bedrooms of children with closed doors and windows) during the different seasons, ranging from median values of 0.25 h−1 in spring and summer to 0.37 h−1 in winter. In natural ventilation settings, the users’ behaviour regarding opening or closing doors and/or windows is crucial to improve ACHs and, therefore, the bedrooms’ ventilation [34]. For instance, in the same study, 198 bedrooms with natural ventilation but with the opening of a door (and with or without the opening of windows) during sleep provided median values ranging from 0.66 h−1 in spring and 2.46 h−1 in summer. A detailed review of 46 studies focusing on bedroom ventilation [86] highlighted that ACHs ranged from 0.2 to 4.9 h−1, with lower levels during heating seasons, especially for naturally ventilated bedrooms.
Ventilation is essential to provide the dilution conditions for air pollutants concentrations in the bedrooms [34], being one of the best solutions to attain an acceptable IAQ in terms of cost-effectiveness [87]. However, even if the ACHs are above the considered minimum value of 0.7 h−1, compliance of indoor air pollutants levels during sleep with the legislation may not be warranted, as concluded in a study performed in Portugal [18].

4. Discussion

4.1. Correlation between Air Pollutants during Sleep—Understanding Their Sources

Some of the studies evaluated potential associations between air parameters during sleep in order to understand their common sources. A study conducted in Lisbon during the sleeping period of 10 couples [18] found out that relative humidity was positively correlated with CO2 levels (Spearman’s correlation coefficient of 0.71, p-value < 0.050) and bacterial loads (Spearman’s correlation coefficient of 0.70, p-value < 0.050) assessed in the bedrooms. The latter two parameters are intrinsically associated with the human presence, namely CO2 [88], which is released during the breathing process by the occupants and bacteria that are directly shed from human skin [89]. Higher ACHs were also associated with lower levels of CO2 (Spearman’s correlation coefficient of −0.78, p-value < 0.050) during the sleeping period since higher ventilation promotes higher dilution of CO2. Other positive associations were also found between CO2 and CH2O (Spearman’s correlation coefficient of 0.66 with p-value < 0.050), highlighting that CH2O is emitted by indoor sources present at the bedroom, such as building materials and consumer products; and between CO and VOCs (Spearman’s correlation coefficient of 0.67 with p-value < 0.050), confirming their common source, such as outdoor infiltration from traffic sources [18]. This study also evaluated fungi levels before and after the sleeping period finding a positive association between them (Spearman’s correlation coefficient of 0.83, p-value < 0.050), which highlighted the nonexistence of local indoor sources of fungi during sleep.

4.2. Impact of Air Pollutants on Sleep Quality

Some studies in the literature aimed to understand what is the impact of high levels of air pollutants during the sleeping period on the sleep quality of individuals. Usually, the target air pollutant is exclusively CO2 and sleep quality assessment is done by standardised questionnaires [90], actigraphy (or similar devices that provide some information, such as Fitbit) or polynomsonography [91,92]. In Australia, a study in dwellings with 48 individuals using wrist-worn sensors concluded that the percentage of deep sleep was negatively related with the CO2 levels during the sleeping period, with a decrease of 4.3% for every increase of 180 mg·m−3 in the overnight mean of CO2 levels [21].
In Denmark, a study performed in 20 single bedrooms of university dorms showed that CO2 levels could be reduced from 4311 to 1503 mg·m−3 by changing the ventilation conditions (from no mechanical ventilation conditions to using a fan in the air intake vent), which lead to a significant improvement of sleep quality (measured by means of actigraphy), along with the perceived freshness of the bedroom air. Lower levels of CO2 were also associated to a lower next-day reported sleepiness, a higher ability to concentrate and also an improvement of the performance of individuals in logical thinking tests [1]. Another study in 17 single bedrooms in the Netherlands also showed the impact of reducing CO2 levels, by means of controlling the bedroom ventilation, on the sleep quality (assessed by questionnaires and actigraphy) [38]. Open conditions (open window or door) provided mean CO2 levels of 1310 ± 360 mg·m−3 during sleep, while closed conditions (closed window and door) registered mean levels of 2100 ± 850 mg·m−3. Lower CO2 levels promoted better sleep depth (subjectively assessed by questionnaires), lower number of awakenings and better sleep efficiency (being the latter two parameters obtained by actigraphy) [38].
A study conducted in China, using experimental chambers decorated as bedrooms with three different experimental conditions regarding CO2 levels (namely, 1440, 3420 and 5400 mg·m−3) [93], evaluated the sleep quality of 12 young adults (six males and six females) by questionnaires and polysomnography. Sleep quality was found to be significantly lower with the increase of CO2 levels, with a positive linear correlation between sleep onset latency and CO2 levels and a negative linear correlation between slow-wave sleep and CO2 levels. A significant difference in sleep quality at lower CO2 levels was also found between genders.
In Belgium, a study at Ghent University dorms with a total of 27 individuals assessed several IAQ parameters (T, RH, CO2, TVOCs and PM2.5) and sleep quality by actigraphy, polysomnography and standardised questionnaires [31]. One of the main outputs from this study was that higher PM2.5 levels were associated with a higher percentage of time awake and lower sleep efficiency [31].
A study in Peru aimed to understand the impact of the reduction of PM2.5 indoor levels due to indoor fuel pollution in the sleep symptoms (using questionnaires) of 38 children, by changing the used stoves to less-polluting cooking stoves [94]. The new stoves have shown a reduction of 74% of the PM2.5 emitted levels and children reported less problems during sleep, more willingness to go to bed and ease of falling asleep, along with greater ease to wake up and less morning headache.
A review focusing on the impact of air pollution exposure into adverse sleep health selected 22 studies [3], with 21 reporting generally positive associations between exposure and poor sleep quality in children, adolescents and adults. However, from these, only five considered indoor exposure [94,95,96,97,98], with three focusing specifically on the effect of IAQ on sleep quality: two intervention studies in Peru for reducing PM exposure due to household exposure to biomass pollution, as described above [94,98], and a study focusing on the exposure to cooking oil fume (COF), which was positively associated with poor sleep quality [95].

4.3. Considerations and Future Perspectives

Several remarks need to be considered when comparing results from field studies since several factors differ between them, such as, occupancy (studies considered between one or two occupants during their sleeping period) and the occupant characteristics (age, gender, among others), type of surrounding outdoor environment, and ventilation settings.
The age of individuals has also been shown to be an important factor when considering the impact of air pollution on sleep outcomes [99,100] since it varies with the development stage due to higher vulnerability of children [101] and elderly [102] to adverse environmental exposure and, consequently, to their health effects [103]. In the present review, six studies focused specifically on assessing the exposure of children [20,23,26,32,33], while three studies targeted the elderly population [24,35,37]. Another relevant issue affecting sleep quality is the gender of subjects, which has been shown to have an impact on sleep quality [104,105], with women usually reporting worse sleep quality than men [106]. This difference may be attributable to morphologic differences between genders, along with social patterns of behaviour and stress responses that affect sleep mechanisms [107].
Therefore, to assess IAQ during sleep and its impact on the sleep quality of individuals it is crucial to provide a comprehensive characterisation of the individuals, regarding their personal, social and demographic details, in order to exclude potential cofounders that may influence sleep quality assessments. In this way, or focusing on similar study populations, it will allow to understand with reliability the impact of environmental factors on sleep quality.
Regarding ventilation, the studied bedrooms differed in type (from natural, mechanical and mixed settings), along with differences in the user behaviour, namely towards the opening of doors and windows during the sleeping period. Either way, these studies always reflected real life conditions, allowing to understand how the IAQ is during sleep and to identify which mitigation measures can be applied to improve it and to minimise the pollution sources [87].
When performing the present review of the literature, one issue that was highlighted and responsible for the exclusion of several studies was that the monitoring period was not exclusively the sleeping period. As an example, a study in social housing with elderly occupants in Spain monitored comfort parameters and CO2 in bedrooms but during a minimum period of 48 continuous hours [108]. In order to perform a correct assessment of IAQ during sleep, it is important to only monitor IAQ parameters during this period, rather than monitoring the bedroom without occupancy, since this will promote an under evaluation of the pollutants levels due to the dilution of pollutants during the nonoccupancy period [6]. Therefore, standardised protocols (from monitoring and experimental set-ups to the gathering of relevant information) need to be employed in order to obtain comparable studies that provide accurate information about IAQ during sleep.
The assessment of PM levels during the sleeping period using the gravimetric method (through filter sampling) [109] is essential to allow a detailed chemical characterisation of particles [110] and, therefore, to identify their sources and respective contributions to the overall levels [111]. However, filter sampling is a critical issue due to the interference with the sleep of occupants taking into account the noise of pumps required in such equipment. The information of particles’ sources is crucial to understand their health impact and to identify specific mitigation measures to decrease the exposure to this pollutant. Sources affecting PM levels can be from the indoors, namely from the bedroom or from infiltration from other rooms of the dwelling due to a variety of human activities (such as cooking [53], vacuum cleaning [112], cleaning [113], burning candles [114], smoking [36,63], walking due to PM resuspension [115]) or even from textiles and human skin desquamation (mainly regarding PM10) [116]. Outdoor infiltration may also be a source of indoor PM levels if an active source is found outside the dwelling (such as traffic for PM2.5 [117]). Therefore, special efforts should be promoted by researchers to fulfil this gap of knowledge in the future.
One strategy to understand the potential source of the air pollutants during sleep could also be the assessment of indoor-to-outdoor (I/O) ratios since it is a very useful tool. At present, no information regarding these ratios can be found in the literature for bedrooms’ environments.
From the 22 studies selected in the present review, most of them provided levels for CO2 (17 out of 22, 77%), followed by PM10, PM2.5 and ultrafine particles (with 5 out of 22, 23%) and, finally, CO, VOCs and CH2O (with 4 out of 22, 18%). The indoor air pollutants monitored only in 18% of the studies, were all conducted in Portugal, showing a lack of information of how the levels of these pollutants may vary during the sleeping period in other countries and regions of the world [118,119,120]. Overall, sleeping environments still have very scarce information in the literature regarding the exposure levels of air pollutants commonly associated to indoor environments. Future studies should be undertaken in order to provide a more comprehensive characterisation of these environments to assess accurately the human exposure during sleep, which would potentiate the understanding of the overall IAQ impact on sleep quality, for instance.

5. Conclusions

Monitoring air pollutants while sleeping can be very challenging due to the fact that the traditional instruments that monitor air quality can produce, for instance, some noise that affects sleeping quality. This fact may be one the reasons why the quantity of studies that access IAQ while sleeping is so scarce. This review only identified 22 studies that assessed exposure to the main indoor air pollutants during the sleeping period, which provided indications of potential sources of indoor air pollutants and how different types of ventilation, along with other characteristics, may influence IAQ.
Exceedances of the AQG and limit values were consistently verified for every pollutant, except for CO, in the majority of the 22 studies analysed (CO2: 870–3440 mg·m−3; VOCs: 0.55–2.40 mg·m−3; CH2O: 0.050–0.160 mg·m−3; PM2.5: 5.0–35.1 µg·m−3; PM10: 10.0–39.2 µg·m−3). Although air changes per hour were generally higher than the minimum value required, the presence of high air pollutants levels may indicate the presence of pollution sources and the necessity of a higher ventilation rate than what is verified in each bedroom to promote a better dilution of pollutants.
Until now, very few studies have managed to provide an overall characterisation of sleeping environments (focusing simultaneously on comfort parameters and indoor air pollutants: CO2, CO, VOCs, CH2O and particles). Moreover, the existent studies varied in great range of factors: the country and type of dwellings/environments, to the number of individuals present in the bedrooms, seasons and types of ventilation. Therefore, it would be essential to focus future research on obtaining a more complete characterisation of a wider range of settings (including in different countries), always providing essential information about the study design in order to allow the comparability between studies. This valuable information would allow to improve the accuracy of exposure assessments and to understand the main drivers of IAQ’s degradation and how to tackle them. Simultaneously to IAQ characterisation during sleep, it is also essential to focus on sleep quality assessments, which may allow to understand the potential impact of IAQ on the sleep quality of individuals. Taking into account the vital role that sleep plays in the human life and welfare, this knowledge would allow to improve sleep quality by means of changing the quality of air that we breathe during sleep.

Supplementary Materials

The following are available online at https://www.mdpi.com/2073-4433/12/1/110/s1, Table S1: A summary table with all the relevant details and results of the selected studies.

Author Contributions

Conceptualisation—C.C. and N.C.; methodology—C.C. and N.C.; article reviews, C.T., M.F. and N.C.; data curation and analysis—C.T., M.F. and N.C.; writing— C.T., M.F., C.C. and N.C.; writing—review and editing, C.C. and N.C.; supervision—N.C. All authors have read and agreed to the published version of the manuscript.

Funding

This research was funded by the Portuguese Foundation for Science and Technology (FCT, Portugal) (Postdoc Grant SFRH/BPD/102944/2014, contract IST-ID/098/2018, and strategic projects UIDB/04349/2020+UIDP/04349/2020 and UIDB/50017/2020+UIDP/50017/2020) and Instituto Politécnico de Lisboa (project E2Sleep—711030-IPL/2017/E2SLEEP/ESTeSL).

Data Availability Statement

Data is contained within the article or supplementary material.

Acknowledgments

N.C. acknowledges the support of the Portuguese Foundation for Science and Technology (FCT, Portugal) through the Postdoc Grant SFRH/BPD/102944/2014, the contract IST-ID/098/2018, and the strategic projects of C2TN (UIDB/04349/2020+UIDP/04349/2020) and CESAM (UIDB/50017/2020+UIDP/50017/2020). All authors also acknowledge the support of Instituto Politécnico de Lisboa (Lisbon, Portugal) through the financial support of IDI&CA Project “E2Sleep19—Sleep quality and environmental factors: is there any link?”. This work was also supported by LIFE Index-Air project (LIFE15 ENV/PT/000674). This work reflects only the authors’ views and EASME is not responsible for any use that may be made of the information it contains.

Conflicts of Interest

The authors declare no conflict of interest.

References

  1. Strøm-Tejsen, P.; Zukowska, D.; Wargocki, P.; Wyon, D.P. The effects of bedroom air quality on sleep and next-day performance. Indoor Air 2016, 26, 679–686. [Google Scholar] [CrossRef] [PubMed] [Green Version]
  2. Boor, B.E.; Spilak, M.P.; Laverge, J.; Novoselac, A.; Xu, Y. Human exposure to indoor air pollutants in sleep microenvironments: A literature review. Build. Environ. 2017, 125, 528–555. [Google Scholar] [CrossRef]
  3. Liu, J.; Wu, T.; Liu, Q.; Wu, S.; Chen, J.-C. Air pollution exposure and adverse sleep health across the life course: A systematic review. Environ. Pollut. 2020, 262, 114263. [Google Scholar] [CrossRef] [PubMed]
  4. Bekö, G.; Lund, T.; Nors, F.; Toftum, J.; Clausen, G. Ventilation rates in the bedrooms of 500 Danish children. Build. Environ. 2010, 45, 2289–2295. [Google Scholar] [CrossRef]
  5. Van Tran, V.; Park, D.; Lee, Y.-C. Indoor Air Pollution, Related Human Diseases, and Recent Trends in the Control and Improvement of Indoor Air Quality. Int. J. Environ. Res. Public Health 2020, 17, 2927. [Google Scholar] [CrossRef] [Green Version]
  6. Sundell, J. On the history of indoor air quality and health. Indoor Air 2004, 14 (Suppl. 7), 51–58. [Google Scholar] [CrossRef]
  7. World Health Organization Household Air Pollution and Health. Available online: https://www.who.int/en/news-room/fact-sheets/detail/household-air-pollution-and-health (accessed on 20 December 2020).
  8. Assefa, S.Z.; Diaz-Abad, M.; Wickwire, E.M.; Scharf, S. The Functions of Sleep. AIMS Neurosci. 2015, 2, 155–171. [Google Scholar] [CrossRef]
  9. Zielinski, M.R.; McKenna, J.T.; McCarley, R.W. Functions and Mechanisms of Sleep. AIMS Neurosci. 2016, 3, 67–104. [Google Scholar] [CrossRef]
  10. Scott, A.J.; Webb, T.L.; Rowse, G. Does improving sleep lead to better mental health? A protocol for a meta-analytic review of randomised controlled trials. BMJ Open 2017, 7, e016873. [Google Scholar] [CrossRef]
  11. Magnavita, N.; Garbarino, S. Sleep, Health and Wellness at Work: A Scoping Review. Int. J. Environ. Res. Public Health 2017, 14, 1347. [Google Scholar] [CrossRef] [Green Version]
  12. Okamoto-Mizuno, K.; Mizuno, K. Effects of thermal environment on sleep and circadian rhythm. J. Physiol. Anthr. 2012, 31, 14. [Google Scholar] [CrossRef] [PubMed] [Green Version]
  13. Pan, L.; Lian, Z.; Lan, L. Investigation of sleep quality under different temperatures based on subjective and physiological measurements. HVAC R Res. 2012, 18, 1030–1043. [Google Scholar] [CrossRef]
  14. Blume, C.; Garbazza, C.; Spitschan, M. Effects of light on human circadian rhythms, sleep and mood. Somnologie 2019, 23, 147–156. [Google Scholar] [CrossRef] [PubMed] [Green Version]
  15. Halperin, D. Environmental noise and sleep disturbances: A threat to health? Sleep Sci. 2014, 7, 209–212. [Google Scholar] [CrossRef] [PubMed] [Green Version]
  16. Katsoyiannis, A.; Cincinelli, A. ‘Cocktails and dreams’: The indoor air quality that people are exposed to while sleeping. Curr. Opin. Environ. Sci. Health 2019, 8, 6–9. [Google Scholar] [CrossRef]
  17. Lan, L.; Lian, Z. Ten questions concerning thermal environment and sleep quality. Build. Environ. 2016, 99, 252–259. [Google Scholar] [CrossRef]
  18. Canha, N.; Alves, A.C.A.C.O.; Marta, C.S.C.S.; Lage, J.; Belo, J.; Faria, T.; Cabo Verde, S.; Viegas, C.; Alves, C.; Almeida, S.M.S.M. Compliance of indoor air quality during sleep with legislation and guidelines—A case study of Lisbon dwellings. Environ. Pollut. 2020, 264, 114619. [Google Scholar] [CrossRef]
  19. Moher, D.; Liberati, A.; Tetzlaff, J.; Altman, D.G.; Altman, D.; Antes, G.; Atkins, D.; Barbour, V.; Barrowman, N.; Berlin, J.A.; et al. Preferred reporting items for systematic reviews and meta-analyses: The PRISMA statement. PLoS Med. 2009, 6, e1000097. [Google Scholar] [CrossRef] [Green Version]
  20. Mazaheri, M.; Clifford, S.; Jayaratne, R.; Mokhtar, M.A.M.; Fuoco, F.; Buonanno, G.; Morawska, L. School Children’s Personal Exposure to Ultrafine Particles in the Urban Environment. Environ. Sci. Technol. 2014, 48, 113–120. [Google Scholar] [CrossRef] [Green Version]
  21. Xiong, J.; Lan, L.; Lian, Z.; De Dear, R. Associations of bedroom temperature and ventilation with sleep quality. Sci. Technol. Built Environ. 2020, 26, 1274–1284. [Google Scholar] [CrossRef]
  22. Wangchuk, T.; Mazaheri, M.; Clifford, S.; Dudzinska, M.R.; He, C.; Buonanno, G.; Morawska, L. Children’s personal exposure to air pollution in rural villages in Bhutan. Environ. Res. 2015, 140, 691–698. [Google Scholar] [CrossRef] [PubMed]
  23. Mazaheri, M.; Lin, W.; Clifford, S.; Yue, D.; Zhai, Y.; Xu, M.; Rizza, V.; Morawska, L. Characteristics of school children’s personal exposure to ultrafine particles in Heshan, Pearl River Delta, China—A pilot study. Environ. Int. 2019, 132, 105134. [Google Scholar] [CrossRef] [PubMed]
  24. Fan, G.; Xie, J.; Yoshino, H.; Yanagi, U.; Hasegawa, K.; Kagi, N.; Goto, T.; Zhang, Q.; Wang, C.; Liu, J. Indoor environmental conditions in urban and rural homes with older people during heating season: A case in cold region, China. Energy Build. 2018, 167, 334–346. [Google Scholar] [CrossRef]
  25. Lei, Z.; Liu, C.; Wang, L.; Li, N. Effect of natural ventilation on indoor air quality and thermal comfort in dormitory during winter. Build. Environ. 2017, 125, 240–247. [Google Scholar] [CrossRef]
  26. Hou, J.; Zhang, Y.; Sun, Y.; Wang, P.; Zhang, Q.; Kong, X.; Sundell, J. Air change rates at night in northeast Chinese homes. Build. Environ. 2018, 132, 273–281. [Google Scholar] [CrossRef]
  27. Lin, Z.; Deng, S. The outdoor air ventilation rate in high-rise residences employing room air conditioners. Build. Environ. 2003, 38, 1389–1399. [Google Scholar] [CrossRef]
  28. Wong, N.H.; Huang, B. Comparative study of the indoor air quality of naturally ventilated and air-conditioned bedrooms of residential buildings in Singapore. Build. Environ. 2004, 39, 1115–1123. [Google Scholar] [CrossRef]
  29. Sekhar, S.C.; Goh, S.E. Thermal comfort and IAQ characteristics of naturally/mechanically ventilated and air-conditioned bedrooms in a hot and humid climate. Build. Environ. 2011, 46, 1905–1916. [Google Scholar] [CrossRef]
  30. Kim, M.; Chun, C.; Han, J. A Study on Bedroom Environment and Sleep Quality in Korea. Indoor Built Environ. 2010, 19, 123–128. [Google Scholar] [CrossRef]
  31. Liao, C.; Marc Delghust, J.L. Association between indoor air quality and sleep quality. In Proceedings of the 40th AIVC—8th TightVent—6th Venticool Conference, Ghent, Belgium, 15–16 October 2019; p. 10. [Google Scholar]
  32. Buonanno, G.; Marini, S.; Morawska, L.; Fuoco, F.C. Individual dose and exposure of Italian children to ultrafine particles. Sci. Total Environ. 2012, 438, 271–277. [Google Scholar] [CrossRef] [Green Version]
  33. Mainka, A.; Zajusz-Zubek, E. Keeping Doors Closed as One Reason for Fatigue in Teenagers—A Case Study. Appl. Sci. 2019, 9, 3533. [Google Scholar] [CrossRef] [Green Version]
  34. Canha, N.; Lage, J.; Candeias, S.; Alves, C.; Almeida, S.M. Indoor air quality during sleep under different ventilation patterns. Atmos. Pollut. Res. 2017, 8, 1132–1142. [Google Scholar] [CrossRef]
  35. Almeida-Silva, M.; Wolterbeek, H.T.; Almeida, S.M. Elderly exposure to indoor air pollutants. Atmos. Environ. 2014, 85, 54–63. [Google Scholar] [CrossRef]
  36. Canha, N.; Lage, J.; Coutinho, J.T.; Alves, C.; Almeida, S.M. Comparison of indoor air quality during sleep in smokers and non-smokers’ bedrooms: A preliminary study. Environ. Pollut. 2019, 249, 248–256. [Google Scholar] [CrossRef] [PubMed]
  37. Almeida-Silva, M.; Almeida, S.M.; Gomes, J.F.; Albuquerque, P.C.; Wolterbeek, H.T. Determination of Airborne Nanoparticles in Elderly Care Centers. J. Toxicol. Environ. Health Part A Curr. Issues 2014, 77, 867–878. [Google Scholar] [CrossRef]
  38. Mishra, A.K.; Van Ruitenbeek, A.M.; Loomans, M.G.L.C.; Kort, H.S.M. Window/door opening-mediated bedroom ventilation and its impact on sleep quality of healthy, young adults. Indoor Air 2018, 28, 339–351. [Google Scholar] [CrossRef] [Green Version]
  39. Williams, A.A.; Spengler, J.D.; Catalano, P.; Allen, J.G.; Cedeno-Laurent, J.G. Building Vulnerability in a Changing Climate: Indoor Temperature Exposures and Health Outcomes in Older Adults Living in Public Housing during an Extreme Heat Event in Cambridge, MA. Int. J. Environ. Res. Public Health 2019, 16, 2373. [Google Scholar] [CrossRef] [Green Version]
  40. Mølhave, L.; Krzyzanowski, M. The right to healthy indoor air: Status by 2002. Indoor Air 2003, 13, 50–53. [Google Scholar] [CrossRef]
  41. WHO. WHO Guidelines for Indoor Air Quality: Selected Pollutants; WHO European Centre for Environment and Health: Bonn, Germany, 2010. [Google Scholar]
  42. Abdul-Wahab, S.A.; Chin Fah En, S.; Elkamel, A.; Ahmadi, L.; Yetilmezsoy, K. A review of standards and guidelines set by international bodies for the parameters of indoor air quality. Atmos. Pollut. Res. 2015, 6, 751–767. [Google Scholar] [CrossRef]
  43. Settimo, G.; Manigrasso, M.; Avino, P. Indoor Air Quality: A Focus on the European Legislation and State-of-the-Art Research in Italy. Atmosphere 2020, 11, 370. [Google Scholar] [CrossRef] [Green Version]
  44. Ministérios do Ambiente, Ordenamento do Território e Energia, da Saúde e da Solidariedade, Emprego e Segurança Social. Portaria No. 353-A/2013; 1.ª série — N.º 235 — 4 de dezembro de 2013; Diário da República: Lisbon, Portugal, 2013; p. 6644(8). [Google Scholar]
  45. Farraia, M.; Paciência, I.; Ribeiro, A.I.; Moreira, A.; Rufo, J.C. Indoor Air Quality in Hospitals: How Is the Situation in Portugal? In Occupational and Environmental Safety and Health; Springer International Publishing: Berlin, Germany, 2019; pp. 303–311. [Google Scholar]
  46. ISO. ISO 7730:2005 ISO 7730—Ergonomics of the Thermal Environment—Analytical Determination and Interpretation of Thermal Comfort Using Calculation of the PMV and PPD Indices and Local Thermal Comfort Criteria; International Organization for Standardization: Geneva, Switzerland, 2005. [Google Scholar]
  47. European Committee for Standardization (CEN). EN 16798-1:2019|Energy Performance of Buildings—Ventilation for Buildings—Part 1: Indoor Environmental Input Parameters for Design and Assessment of Energy Performance of Buildings Addressing Indoor Air Quality, Thermal Environment, Lighting and Aco; European Committee for Standardization: Brussels, Belgium, 2019. [Google Scholar]
  48. EEA. Air Quality in Europe—2019 Report—EEA Report No 10/2019; Publications Office of the European Union: Luxembourg, 2019. [Google Scholar]
  49. Loomis, D.; Grosse, Y.; Lauby-Secretan, B.; El Ghissassi, F.; Bouvard, V.; Benbrahim-Tallaa, L.; Guha, N.; Baan, R.; Mattock, H.; Straif, K. The carcinogenicity of outdoor air pollution. Lancet Oncol. 2013, 14, 1262–1263. [Google Scholar] [CrossRef]
  50. Persily, A.; De Jonge, L. Carbon dioxide generation rates for building occupants. Indoor Air 2017, 27, 868–879. [Google Scholar] [CrossRef]
  51. Canha, N.; Mandin, C.; Ramalho, O.; Wyart, G.; Ribéron, J.; Dassonville, C.; Hänninen, O.; Almeida, S.M.; Derbez, M. Assessment of ventilation and indoor air pollutants in nursery and elementary schools in France. Indoor Air 2016, 26, 350–365. [Google Scholar] [CrossRef] [PubMed]
  52. Mullen, N.A.; Li, J.; Russell, M.L.; Spears, M.; Less, B.D.; Singer, B.C. Results of the California Healthy Homes Indoor Air Quality Study of 2011–2013: Impact of natural gas appliances on air pollutant concentrations. Indoor Air 2016, 26, 231–245. [Google Scholar] [CrossRef] [PubMed] [Green Version]
  53. Canha, N.; Lage, J.; Galinha, C.; Coentro, S.; Alves, C.; Almeida, S. Impact of Biomass Home Heating, Cooking Styles, and Bread Toasting on the Indoor Air Quality at Portuguese Dwellings: A Case Study. Atmosphere 2018, 9, 214. [Google Scholar] [CrossRef] [Green Version]
  54. Ramos, C.A.; Wolterbeek, H.T.; Almeida, S.M. Air pollutant exposure and inhaled dose during urban commuting: A comparison between cycling and motorized modes. Air Qual. Atmos. Health 2016, 9, 867–879. [Google Scholar] [CrossRef]
  55. Zhou, M.; Liu, Y.; Duan, Y. Breath biomarkers in diagnosis of pulmonary diseases. Clin. Chim. Acta 2012, 413, 1770–1780. [Google Scholar] [CrossRef]
  56. Wu, L.; Wang, R. Carbon Monoxide: Endogenous Production, Physiological Functions, and Pharmacological Applications. Pharmacol. Rev. 2005, 57, 585–630. [Google Scholar] [CrossRef]
  57. Canha, N.; Almeida, S.M.; Freitas, M.C.; Täubel, M.; Hänninen, O. Winter Ventilation Rates at Primary Schools: Comparison Between Portugal and Finland. J. Toxicol. Environ. Health Part A Curr. Issues 2013, 76, 400–408. [Google Scholar] [CrossRef]
  58. Becher, R.; Øvrevik, J.; Schwarze, P.E.; Nilsen, S.; Hongslo, J.K.; Bakke, J.V. Do Carpets Impair Indoor Air Quality and Cause Adverse Health Outcomes: A Review. Int. J. Environ. Res. Public Health 2018, 15, 184. [Google Scholar] [CrossRef] [Green Version]
  59. Wieslander, G.; Norbäck, D.; Björnsson, E.; Janson, C.; Boman, G. Asthma and the indoor environment: The significance of emission of formaldehyde and volatile organic compounds from newly painted indoor surfaces. Int. Arch. Occup. Environ. Health 1996, 69, 115–124. [Google Scholar] [CrossRef] [PubMed]
  60. Chin, J.-Y.; Godwin, C.; Parker, E.; Robins, T.; Lewis, T.; Harbin, P.; Batterman, S. Levels and sources of volatile organic compounds in homes of children with asthma. Indoor Air 2014, 24, 403–415. [Google Scholar] [CrossRef] [PubMed] [Green Version]
  61. Vicente, E.D.; Ribeiro, J.P.; Custódio, D.; Alves, C.A. Assessment of the indoor air quality in copy centres at Aveiro, Portugal. Air Qual. Atmos. Health 2017, 10, 117–127. [Google Scholar] [CrossRef]
  62. Shrubsole, C.; Dimitroulopoulou, S.; Foxall, K.; Gadeberg, B.; Doutsi, A. IAQ guidelines for selected volatile organic compounds (VOCs) in the UK. Build. Environ. 2019, 165, 106382. [Google Scholar] [CrossRef]
  63. Savdie, J.; Canha, N.; Buitrago, N.; Almeida, S.M. Passive Exposure to Pollutants from a New Generation of Cigarettes in Real Life Scenarios. Int. J. Environ. Res. Public Health 2020, 17, 3455. [Google Scholar] [CrossRef]
  64. Mueller, D.; Uibel, S.; Braun, M.; Klingelhoefer, D.; Takemura, M.; Groneberg, D.A. Tobacco smoke particles and indoor air quality (ToPIQ)—The protocol of a new study. J. Occup. Med. Toxicol. 2011, 6, 35. [Google Scholar] [CrossRef] [Green Version]
  65. Bahl, V.; Jacob, P.; Havel, C.; Schick, S.F.; Talbot, P. Thirdhand Cigarette Smoke: Factors Affecting Exposure and Remediation. PLoS ONE 2014, 9, e108258. [Google Scholar] [CrossRef] [Green Version]
  66. Sun, X.; He, J.; Yang, X. Human breath as a source of VOCs in the built environment, Part I: A method for sampling and detection species. Build. Environ. 2017, 125, 565–573. [Google Scholar] [CrossRef]
  67. He, J.; Sun, X.; Yang, X. Human respiratory system as sink for volatile organic compounds: Evidence from field measurements. Indoor Air 2019, 29, 968–978. [Google Scholar] [CrossRef]
  68. Tsushima, S.; Wargocki, P.; Tanabe, S. Sensory evaluation and chemical analysis of exhaled and dermally emitted bioeffluents. Indoor Air 2018, 28, 146–163. [Google Scholar] [CrossRef] [Green Version]
  69. Rovira, J.; Roig, N.; Nadal, M.; Schuhmacher, M.; Domingo, J.L. Human health risks of formaldehyde indoor levels: An issue of concern. J. Environ. Sci. Health Part A Toxic/Hazard. Subst. Environ. Eng. 2016, 51, 357–363. [Google Scholar] [CrossRef] [PubMed] [Green Version]
  70. Nielsen, G.D.; Larsen, S.T.; Wolkoff, P. Re-evaluation of the WHO (2010) formaldehyde indoor air quality guideline for cancer risk assessment. Arch. Toxicol. 2017, 91, 35–61. [Google Scholar] [CrossRef] [PubMed] [Green Version]
  71. Salthammer, T. Formaldehyde sources, formaldehyde concentrations and air exchange rates in European housings. Build. Environ. 2019, 150, 219–232. [Google Scholar] [CrossRef]
  72. Uchiyama, S.; Tomizawa, T.; Tokoro, A.; Aoki, M.; Hishiki, M.; Yamada, T.; Tanaka, R.; Sakamoto, H.; Yoshida, T.; Bekki, K.; et al. Gaseous chemical compounds in indoor and outdoor air of 602 houses throughout Japan in winter and summer. Environ. Res. 2015, 137, 364–372. [Google Scholar] [CrossRef] [PubMed]
  73. Haghighat, F.; De Bellis, L. Material emission rates: Literature review, and the impact of indoor air temperature and relative humidity. Build. Environ. 1998, 33, 261–277. [Google Scholar] [CrossRef]
  74. Caddick, Z.A.; Gregory, K.; Arsintescu, L.; Flynn-Evans, E.E. A review of the environmental parameters necessary for an optimal sleep environment. Build. Environ. 2018, 132, 11–20. [Google Scholar] [CrossRef]
  75. Wallace, L.A.; Wheeler, A.J.; Kearney, J.; Van Ryswyk, K.; You, H.; Kulka, R.H.; Rasmussen, P.E.; Brook, J.R.; Xu, X. Validation of continuous particle monitors for personal, indoor, and outdoor exposures. J. Expo. Sci. Environ. Epidemiol. 2011, 21, 49–64. [Google Scholar] [CrossRef]
  76. McNamara, M.L.; Noonan, C.W.; Ward, T.J. Correction Factor for Continuous Monitoring of Wood Smoke Fine Particulate Matter. Aerosol Air Qual. Res. 2011, 11, 316–323. [Google Scholar] [CrossRef]
  77. Cavaliere, A.; Carotenuto, F.; Di Gennaro, F.; Gioli, B.; Gualtieri, G.; Martelli, F.; Matese, A.; Toscano, P.; Vagnoli, C.; Zaldei, A. Development of Low-Cost Air Quality Stations for Next Generation Monitoring Networks: Calibration and Validation of PM2.5 and PM10 Sensors. Sensors 2018, 18, 2843. [Google Scholar] [CrossRef] [Green Version]
  78. Liu, H.-Y.; Schneider, P.; Haugen, R.; Vogt, M. Performance Assessment of a Low-Cost PM2.5 Sensor for a near Four-Month Period in Oslo, Norway. Atmosphere 2019, 10, 41. [Google Scholar] [CrossRef] [Green Version]
  79. Ohlwein, S.; Kappeler, R.; Kutlar Joss, M.; Künzli, N.; Hoffmann, B. Health effects of ultrafine particles: A systematic literature review update of epidemiological evidence. Int. J. Public Health 2019, 64, 547–559. [Google Scholar] [CrossRef] [PubMed]
  80. Schraufnagel, D.E. The health effects of ultrafine particles. Exp. Mol. Med. 2020, 52, 311–317. [Google Scholar] [CrossRef] [PubMed]
  81. Chen, C.; Zhao, B. Review of relationship between indoor and outdoor particles: I/O ratio, infiltration factor and penetration factor. Atmos. Environ. 2011, 45, 275–288. [Google Scholar] [CrossRef]
  82. Stephens, B.; Siegel, J.A. Penetration of ambient submicron particles into single-family residences and associations with building characteristics. Indoor Air 2012, 22, 501–513. [Google Scholar] [CrossRef] [PubMed]
  83. Hussein, T.; Alameer, A.; Jaghbeir, O.; Albeitshaweesh, K.; Malkawi, M.; Boor, B.E.; Koivisto, A.J.; Löndahl, J.; Alrifai, O.; Al-Hunaiti, A. Indoor Particle Concentrations, Size Distributions, and Exposures in Middle Eastern Microenvironments. Atmosphere 2019, 11, 41. [Google Scholar] [CrossRef] [Green Version]
  84. Afshari, A.; Matson, U.; Ekberg, L.E. Characterization of indoor sources of fine and ultrafine particles: A study conducted in a full-scale chamber. Indoor Air 2005, 15, 141–150. [Google Scholar] [CrossRef]
  85. Manigrasso, M.; Guerriero, E.; Avino, P. Ultrafine Particles in Residential Indoors and Doses Deposited in the Human Respiratory System. Atmosphere 2015, 6, 1444–1461. [Google Scholar] [CrossRef] [Green Version]
  86. Sekhar, C.; Akimoto, M.; Fan, X.; Bivolarova, M.; Liao, C.; Lan, L.; Wargocki, P. Bedroom ventilation: Review of existing evidence and current standards. Build. Environ. 2020, 184, 107229. [Google Scholar] [CrossRef]
  87. González-Martín, J.; Kraakman, N.J.R.; Pérez, C.; Lebrero, R.; Muñoz, R. A state–of–the-art review on indoor air pollution and strategies for indoor air pollution control. Chemosphere 2021, 262, 128376. [Google Scholar] [CrossRef]
  88. Franco, A.; Leccese, F. Measurement of CO2 concentration for occupancy estimation in educational buildings with energy efficiency purposes. J. Build. Eng. 2020, 32, 101714. [Google Scholar] [CrossRef]
  89. Hospodsky, D.; Qian, J.; Nazaroff, W.W.; Yamamoto, N.; Bibby, K.; Rismani-Yazdi, H.; Peccia, J. Human Occupancy as a Source of Indoor Airborne Bacteria. PLoS ONE 2012, 7, e34867. [Google Scholar] [CrossRef] [PubMed] [Green Version]
  90. Ibáñez, V.; Silva, J.; Cauli, O. A survey on sleep assessment methods. PeerJ 2018, 6, e4849. [Google Scholar] [CrossRef] [PubMed] [Green Version]
  91. Marino, M.; Li, Y.; Rueschman, M.N.; Winkelman, J.W.; Ellenbogen, J.M.; Solet, J.M.; Dulin, H.; Berkman, L.F.; Buxton, O.M. Measuring Sleep: Accuracy, Sensitivity, and Specificity of Wrist Actigraphy Compared to Polysomnography. Sleep 2013, 36, 1747–1755. [Google Scholar] [CrossRef] [PubMed]
  92. Ibáñez, V.; Silva, J.; Navarro, E.; Cauli, O. Sleep assessment devices: Types, market analysis, and a critical view on accuracy and validation. Expert Rev. Med. Devices 2019, 16, 1041–1052. [Google Scholar] [CrossRef] [PubMed]
  93. Xu, X.; Lian, Z.; Shen, J.; Cao, T.; Zhu, J.; Lin, X.; Qing, K.; Zhang, W.; Zhang, T. Experimental study on sleep quality affected by carbon dioxide concentration. Indoor Air 2020, ina12748. [Google Scholar] [CrossRef]
  94. Accinelli, R.A.; Llanos, O.; López, L.M.; Pino, M.I.; Bravo, Y.A.; Salinas, V.; Lazo, M.; Noda, J.R.; Sánchez-Sierra, M.; Zárate, L.; et al. Adherence to reduced-polluting biomass fuel stoves improves respiratory and sleep symptoms in children. BMC Pediatr. 2014, 14, 12. [Google Scholar] [CrossRef] [Green Version]
  95. Wei, F.; Nie, G.; Zhou, B.; Wang, L.; Ma, Y.; Peng, S.; Ou, S.; Qin, J.; Zhang, L.; Li, S.; et al. Association between Chinese cooking oil fumes and sleep quality among a middle-aged Chinese population. Environ. Pollut. 2017, 227, 543–551. [Google Scholar] [CrossRef]
  96. Chuang, H.C.; Su, T.Y.; Chuang, K.J.; Hsiao, T.C.; Lin, H.L.; Hsu, Y.T.; Pan, C.H.; Lee, K.Y.; Ho, S.C.; Lai, C.H. Pulmonary exposure to metal fume particulate matter cause sleep disturbances in shipyard welders. Environ. Pollut. 2018, 232, 523–532. [Google Scholar] [CrossRef]
  97. Lappharat, S.; Taneepanichskul, N.; Reutrakul, S.; Chirakalwasan, N. Effects of Bedroom Environmental Conditions on the Severity of Obstructive Sleep Apnea. J. Clin. Sleep Med. 2018, 14, 565–573. [Google Scholar] [CrossRef] [Green Version]
  98. Castañeda, J.L.; Kheirandish-Gozal, L.; Gozal, D.; Accinelli, R.A. Effect of reductions in biomass fuel exposure on symptoms of sleep apnea in children living in the peruvian andes: A preliminary field study. Pediatr. Pulmonol. 2013, 48, 996–999. [Google Scholar] [CrossRef]
  99. Sánchez, T.; Gozal, D.; Smith, D.L.; Foncea, C.; Betancur, C.; Brockmann, P.E. Association between air pollution and sleep disordered breathing in children. Pediatr. Pulmonol. 2019, 54, 544–550. [Google Scholar] [CrossRef] [PubMed]
  100. Grandner, M.A. Sleep duration across the lifespan: Implications for health. Sleep Med. Rev. 2012, 16, 199–201. [Google Scholar] [CrossRef] [PubMed] [Green Version]
  101. Canha, N.; Almeida, S.M.; Freitas, M.D.C.; Trancoso, M.; Sousa, A.; Mouro, F.; Wolterbeek, H.T. Particulate matter analysis in indoor environments of urban and rural primary schools using passive sampling methodology. Atmos. Environ. 2014, 83, 21–34. [Google Scholar] [CrossRef] [Green Version]
  102. Simoni, M.; Baldacci, S.; Maio, S.; Cerrai, S.; Sarno, G.; Viegi, G. Adverse effects of outdoor pollution in the elderly. J. Thorac. Dis. 2015, 7, 34–45. [Google Scholar] [PubMed]
  103. Almeida, S.M.; Ramos, C.A.; Almeida-Silva, M. Exposure and inhaled dose of susceptible population to chemical elements in atmospheric particles. J. Radioanal. Nucl. Chem. 2016, 309, 309–315. [Google Scholar] [CrossRef]
  104. Tang, J.; Liao, Y.; Kelly, B.C.; Xie, L.; Xiang, Y.-T.; Qi, C.; Pan, C.; Hao, W.; Liu, T.; Zhang, F.; et al. Gender and Regional Differences in Sleep Quality and Insomnia: A General Population-based Study in Hunan Province of China. Sci. Rep. 2017, 7, 1–9. [Google Scholar] [CrossRef] [PubMed]
  105. Fatima, Y.; Doi, S.A.R.; Najman, J.M.; Al Mamun, A. Exploring Gender Difference in Sleep Quality of Young Adults: Findings from a Large Population Study. Clin. Med. Res. 2016, 14, 138–144. [Google Scholar] [CrossRef] [PubMed] [Green Version]
  106. Buysse, D.J.; Hall, M.L.; Strollo, P.J.; Kamarck, T.W.; Owens, J.; Lee, L.; Reis, S.E.; Matthews, K.A. Relationships Between the Pittsburgh Sleep Quality Index (PSQI), Epworth Sleepiness Scale (ESS), and Clinical/Polysomnographic Measures in a Community Sample. J. Clin. Sleep Med. 2008, 4, 563–571. [Google Scholar] [CrossRef] [Green Version]
  107. Mong, J.A.; Cusmano, D.M. Sex differences in sleep: Impact of biological sex and sex steroids. Philos. Trans. R. Soc. B Biol. Sci. 2016, 371, 20150110. [Google Scholar] [CrossRef]
  108. Serrano-Jiménez, A.; Lizana, J.; Molina-Huelva, M.; Barrios-Padura, Á. Indoor environmental quality in social housing with elderly occupants in Spain: Measurement results and retrofit opportunities. J. Build. Eng. 2020, 30, 101264. [Google Scholar] [CrossRef]
  109. Bo, M.; Salizzoni, P.; Clerico, M.; Buccolieri, R. Assessment of Indoor-Outdoor Particulate Matter Air Pollution: A Review. Atmosphere 2017, 8, 136. [Google Scholar] [CrossRef] [Green Version]
  110. Galvão, E.S.; Santos, J.M.; Lima, A.T.; Reis, N.C.; Orlando, M.T.D.A.; Stuetz, R.M. Trends in analytical techniques applied to particulate matter characterization: A critical review of fundaments and applications. Chemosphere 2018, 199, 546–568. [Google Scholar] [CrossRef] [PubMed]
  111. Hopke, P.K.; Dai, Q.; Li, L.; Feng, Y. Global review of recent source apportionments for airborne particulate matter. Sci. Total Environ. 2020, 740, 140091. [Google Scholar] [CrossRef] [PubMed]
  112. Vicente, E.D.; Vicente, A.M.; Evtyugina, M.; Calvo, A.I.; Oduber, F.; Alegre, C.B.; Castro, A.; Fraile, R.; Nunes, T.; Lucarelli, F.; et al. Impact of vacuum cleaning on indoor air quality. Build. Environ. 2020, 180, 107059. [Google Scholar] [CrossRef]
  113. Isaxon, C.; Gudmundsson, A.; Nordin, E.Z.; Lönnblad, L.; Dahl, A.; Wieslander, G.; Bohgard, M.; Wierzbicka, A. Contribution of indoor-generated particles to residential exposure. Atmos. Environ. 2015, 106, 458–466. [Google Scholar] [CrossRef]
  114. Manoukian, A.; Quivet, E.; Temime-Roussel, B.; Nicolas, M.; Maupetit, F.; Wortham, H. Emission characteristics of air pollutants from incense and candle burning in indoor atmospheres. Environ. Sci. Pollut. Res. 2013, 20, 4659–4670. [Google Scholar] [CrossRef]
  115. Serfozo, N.; Chatoutsidou, S.E.; Lazaridis, M. The effect of particle resuspension during walking activity to PM 10 mass and number concentrations in an indoor microenvironment. Build. Environ. 2014, 82, 180–189. [Google Scholar] [CrossRef]
  116. Alves, C.A. A short review on atmospheric cellulose. Air Qual. Atmos. Health 2017, 10, 669–678. [Google Scholar] [CrossRef]
  117. Faria, T.; Martins, V.; Correia, C.; Canha, N.; Diapouli, E.; Manousakas, M.; Eleftheriadis, K.; Almeida, S.M. Children’s exposure and dose assessment to particulate matter in Lisbon. Build. Environ. 2020, 171, 106666. [Google Scholar] [CrossRef]
  118. Gall, E.T.; Carter, E.M.; Earnest, C.M.; Stephens, B. Indoor Air Pollution in Developing Countries: Research and Implementation Needs for Improvements in Global Public Health. Am. J. Public Health 2013, 103, e67–e72. [Google Scholar] [CrossRef]
  119. Zhang, J.; Smith, K.R. Indoor air pollution: A global health concern. Br. Med. Bull. 2003, 68, 209–225. [Google Scholar] [CrossRef] [PubMed] [Green Version]
  120. Grandner, M.A.; Smith, T.E.; Jackson, N.; Jackson, T.; Burgard, S.; Branas, C. Geographic distribution of insufficient sleep across the United States: A county-level hotspot analysis. Sleep Health 2015, 1, 158–165. [Google Scholar] [CrossRef] [PubMed] [Green Version]
Figure 1. PRISMA workflow of the article selection process for the identification of suitable articles to be included in our review analysis. * Exclusion criteria is defined in the Methods section.
Atmosphere 12 00110 g001
Figure 2. Temperatures monitored in bedrooms during warm and cold seasons, with natural (NV), mechanical (MV) and mixed (NMV) ventilation settings. Studies index is regarding type of building: A—apartment; A/DH—mixed (apartment and detached house); DH—detached house; SR—scholar residence. Bars provide mean values (along with standard deviation when available). Max, min and med stand for maximum, minimum and median values, respectively. *—This study does not specify the type of bedroom ventilation.
Atmosphere 12 00110 g002
Figure 3. Relative humidity levels monitored in bedrooms during warm and cold seasons, with natural (NV), mechanical (MV) and mixed (NMV) ventilation settings. Studies index is regarding type of building: A—apartment; A/DH—mixed (apartment and detached house); DH—detached house; SR—scholar residence. Bars provide mean values (along with standard deviation when available). Max, min and med stand for maximum, minimum and median values, respectively. *—This study does not specify the type of bedroom ventilation.
Atmosphere 12 00110 g003
Figure 4. Carbon dioxide levels monitored in bedrooms, with natural (NV), mechanical (MV) and mixed (NMV) ventilation settings. Studies index is regarding type of building: A—apartment; A/DH—mixed (apartment and detached house); DH—detached house; SR—scholar residence. Bars provide mean values (along with standard deviation when available). Max and min stand for maximum and minimum values, respectively. *—This study does not specify the type of bedroom ventilation. LV stands for the limit value established by the Portuguese Ordinance no. 353-A/2013 [44].
Atmosphere 12 00110 g004
Figure 5. Carbon monoxide levels monitored during the sleeping period at bedrooms in different types of building (A—apartment; A/DH—mixed (apartment and detached house); DH—detached house) and different types of ventilation settings (NV—natural; mechanical—MV; mixed—NMV). Bars provide mean values (along with standard deviation when available). WHO AQG stands for the air quality guideline value recommended by WHO [41], and max and min stand for maximum and minimum values, respectively.
Atmosphere 12 00110 g005
Figure 6. Volatile Organic Compounds levels monitored during the sleeping period at bedrooms in different types of building (A—apartment; A/DH—mixed (apartment and detached house); DH—detached house) and different types of ventilation settings (NV—natural; mechanical—MV; mixed—NMV). Bars provide mean values (along with standard deviation when available). LV stands for the limit value established by the Portuguese Ordinance no. 353-A/2013 [44], and max and min stand for maximum and minimum values, respectively.
Atmosphere 12 00110 g006
Figure 7. Formaldehyde levels monitored during the sleep period at bedrooms in different types of building (A—apartment; A/—mixed (apartment and detached house); DH—detached house) and different types of ventilation settings (NV—natural; mechanical—MV; mixed—NMV). Bars provide mean values (along with standard deviation when available). WHO AQG stands for the air quality guideline value recommended by WHO [41], and max and min stand for maximum and minimum values, respectively.
Atmosphere 12 00110 g007
Figure 8. PM2.5 (top) and PM10 (bottom) levels monitored during the sleep period for three types of ventilation setting. Studies index is regarding type of building: A—apartment; A/DH—mixed (apartment and detached house); DH—detached house; EEC—elderly care centre. Bars provide mean values (along with standard deviation when available). AQG stands for the air quality guidelines (red—24 h; green—1 year) recommended by WHO [41].
Atmosphere 12 00110 g008
Figure 9. Ultrafine particles levels monitored during the sleep period in naturally ventilated bedrooms in different types of building: A—apartment; A/DH—mixed (apartment and detached house); DH—detached house. Bars provide mean values (along with standard deviation when available). * These studies do not specify the type of bedroom ventilation.
Atmosphere 12 00110 g009
Figure 10. Air changes per hour during the sleep period in bedrooms in different types of building (A—apartment; A/DH—mixed (apartment and detached house); SR—scholar residence) and different types of ventilation settings (NV—natural; mechanical—MV; mixed—NMV). Bars provide mean values (along with standard deviation when available). Red line stands for the minimum value of 0.7 h−1 established for bedrooms by EN 16798-1:2019 [47].
Atmosphere 12 00110 g010
Table 1. Characteristics of selected studies regarding type of environment, housing, ventilation, number of occupants per bedroom and season.
Number of Studies
ParameterSettingAustraliaAsiaEuropeNorth AmericaTotal
Type of
environment
Urban265114
Suburban 1 1
Mixed (urban and suburban) 2 2
Rural 1 1
Mixed (urban and rural) 22 4
Total2910122
Type of
housing
Apartment 5319
Detached house 11 2
Mixed (apartment and detached house)222 6
Scholar residence 12 3
Elderly care centre 2 2
Total2910122
Type of
ventilation
Natural155112
Mixed (natural and mechanical) 34 7
No info available111 3
Total2910122
Number of occupants per bedroom1 37 10
2 23 5
1 or 21 1
4 or 6 1 1
No info available13 15
Total2910122
Type of
Season
Warm season 3216
Cold season128 10
Both seasons13 5
No info available 1 1
Total2910122
Table 2. Limit values and guidelines for each considered environmental parameter in indoor environments and their source legislation/guideline.
ParameterWHO Air Quality GuidelineReference ValueReference
CO2-2250 mg·m−3 (8 h)[44]
CO10 mg·m−3 (8 h)-[41]
VOC-600 µg·m−3 (8 h)[44]
CH2O0.1 mg·m−3 (30 min)-[41]
PM2.525 µg·m−3 (24 h), 10 µg·m−3 (1 year)-[41]
PM1050 µg·m−3 (24 h), 20 µg·m−3 (1 year)-[41]
T-20–24 °C (cold season)[46]
-23–26 °C (warm season)
RH-30–70%
Air changes per hour-0.7 h−1[47]
Publisher’s Note: MDPI stays neutral with regard to jurisdictional claims in published maps and institutional affiliations.