Designing a Climate Service for Planning Climate Actions in Vulnerable Countries
Abstract
:1. Introduction
2. Materials and Methods
2.1. Data Production
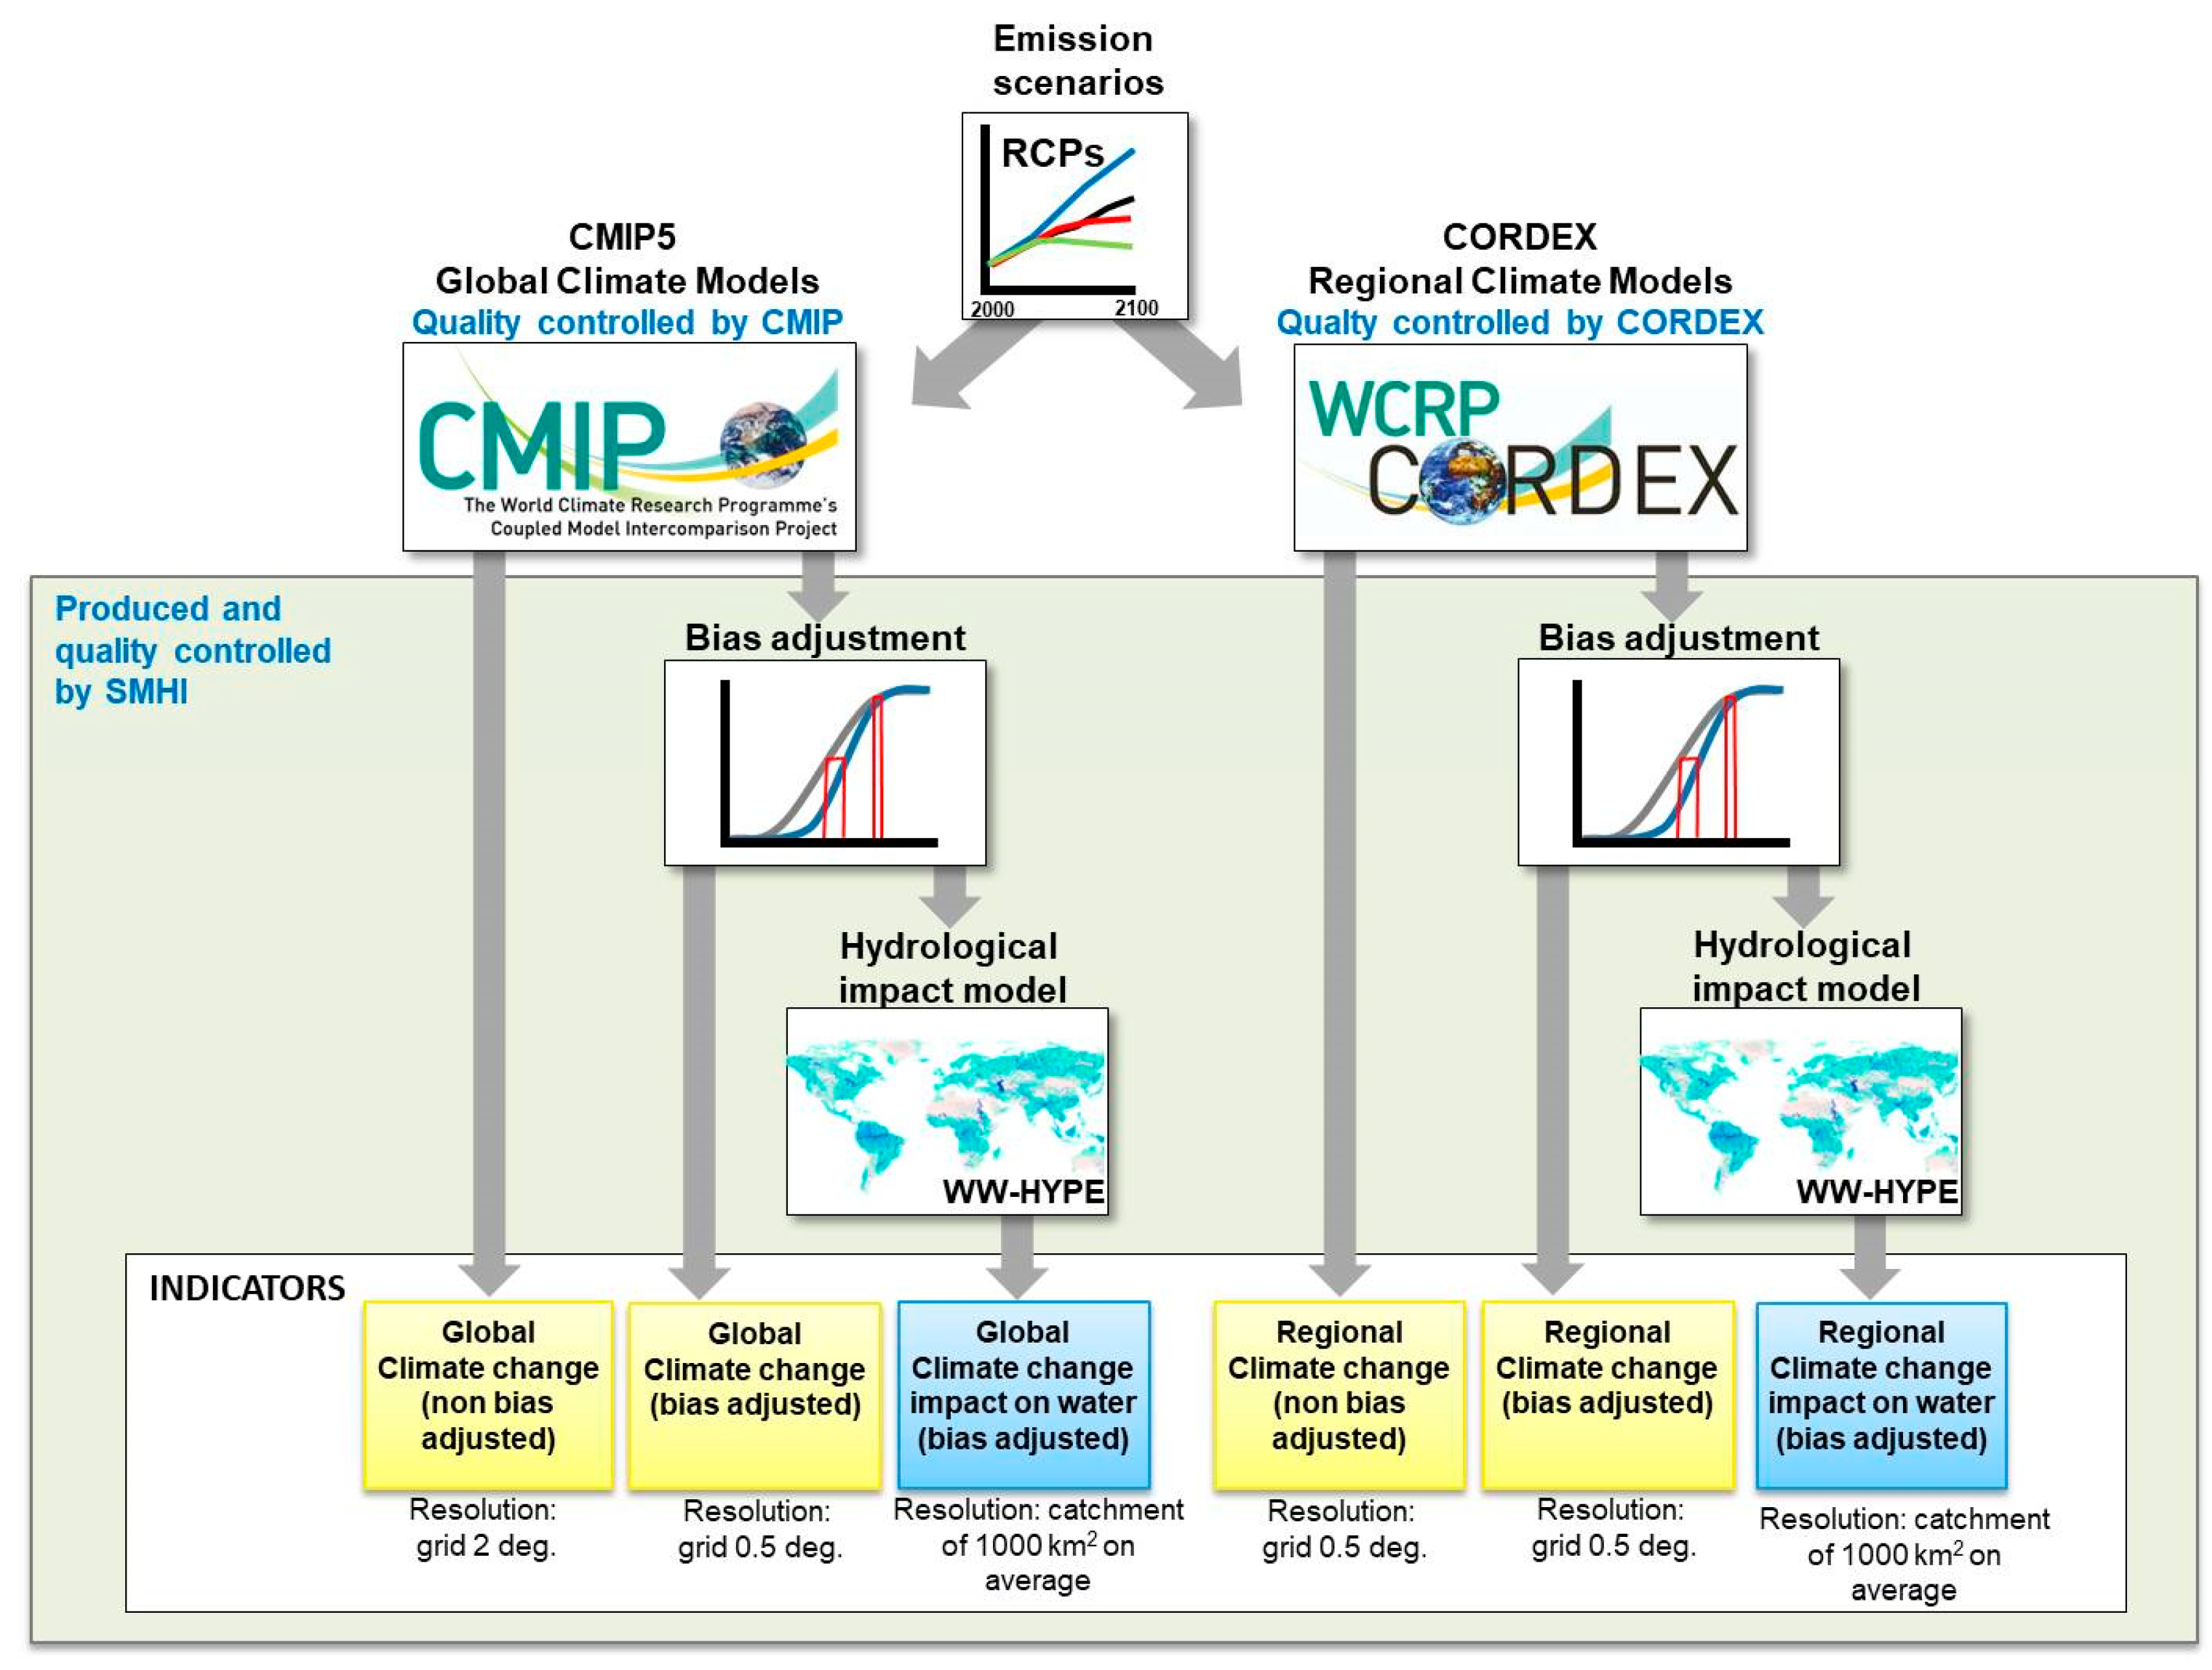
2.1.1. Global and Regional Climate Models
Bias Adjustment
2.1.2. Climate Indicators
2.1.3. Global Hydrological Modelling and Water Indicators
2.2. Development of the Web-Based Platform
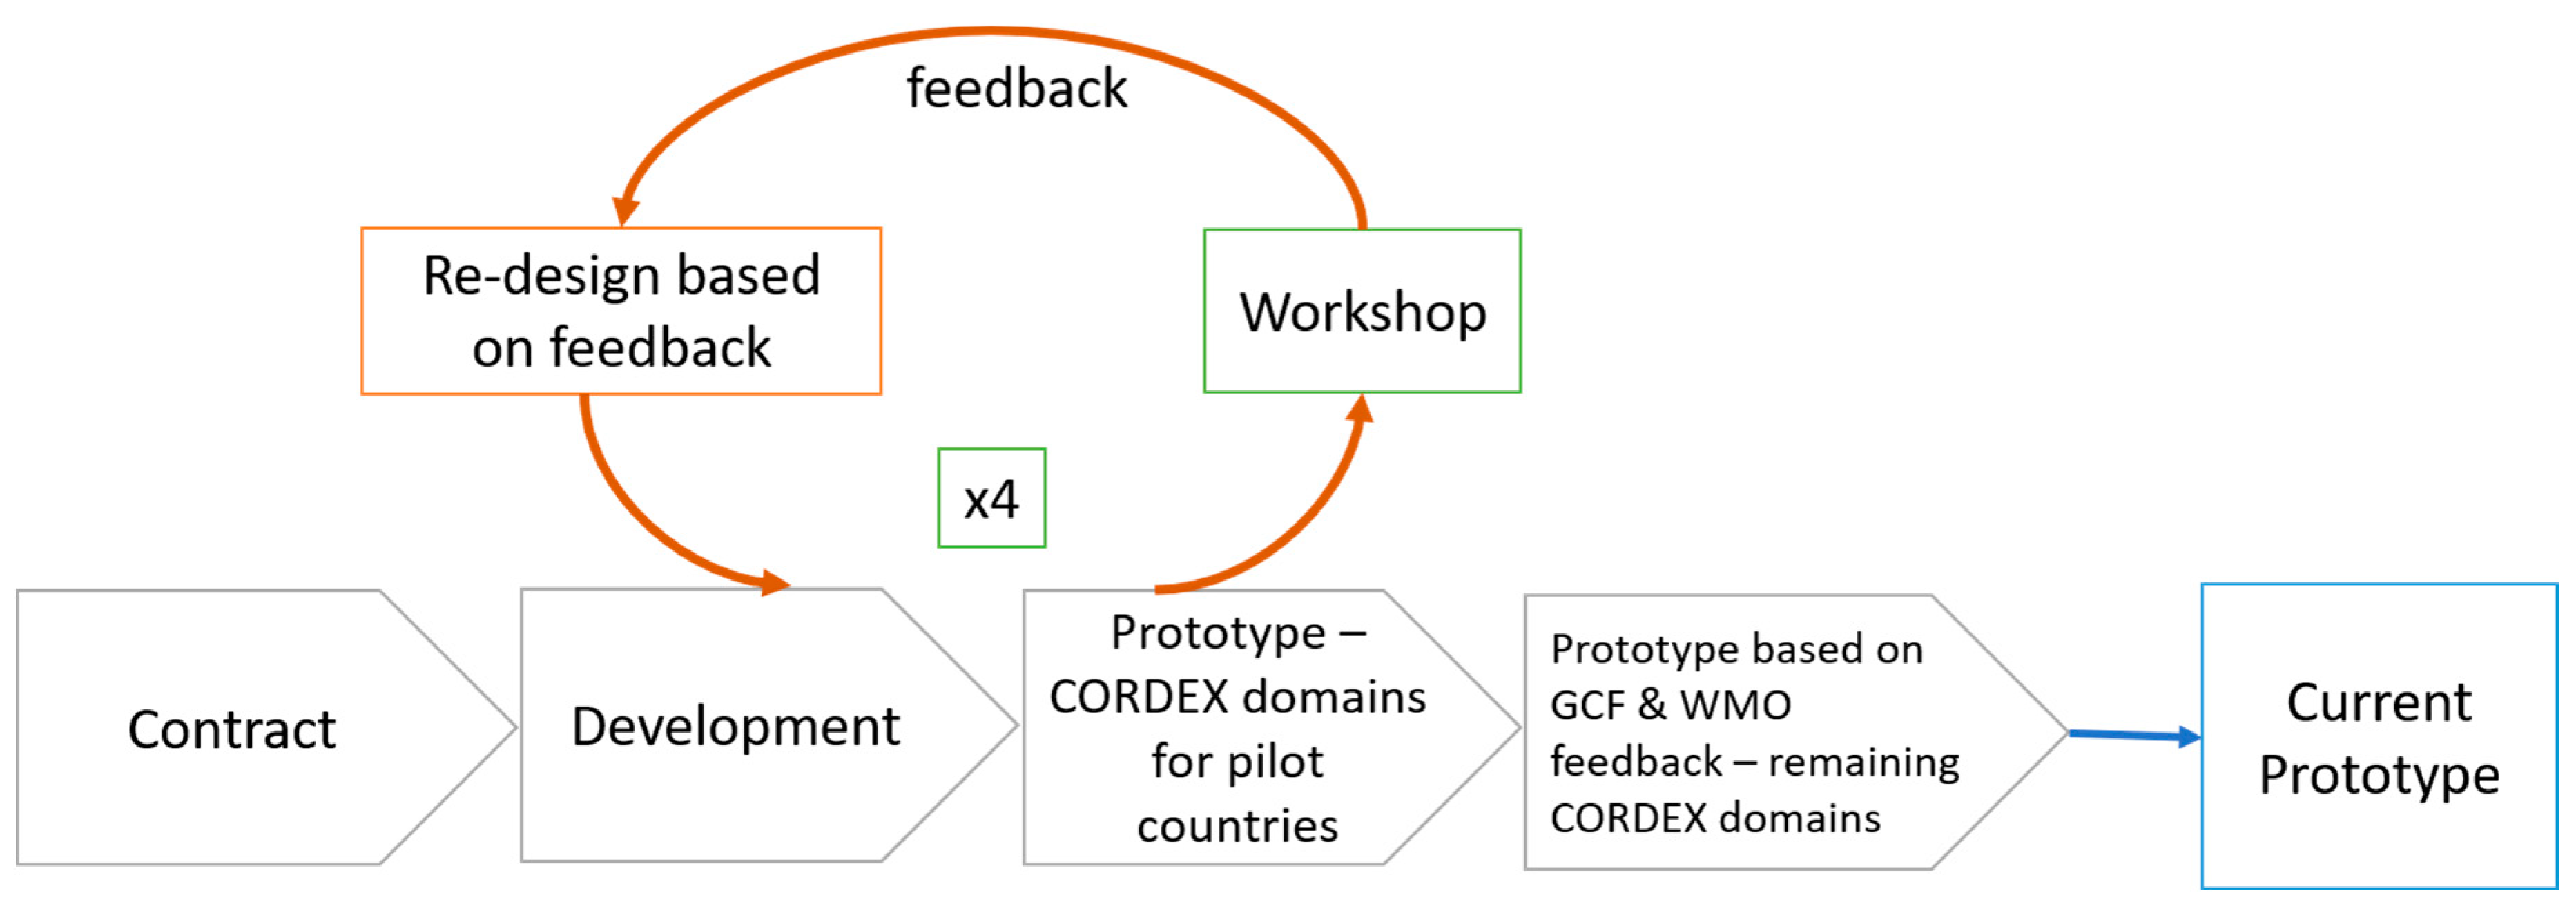
- Quiz and online interactive exercise: This exercise began with a quiz, where workshop participants were divided into teams and given questions to encourage exploring the platform and finding relevant information. After the quiz, participants were asked to provide feedback in four categories; what they liked, what could be improved and how, what other climate science information do they want to see in the Knowledge Base, and what other web-based climate services have been used before.
- Interactive feedback exercise: In this feedback process, participants were asked about their understanding of climate change data and climate services. Specifically, in the feedback form, participants were asked to give their professional background, their current role and years of experience. Secondly, the participants were asked to provide input on:
- ○
- Web-based climate services: why do they use a web-based climate service and for each purpose they need the information provided by the service;
- ○
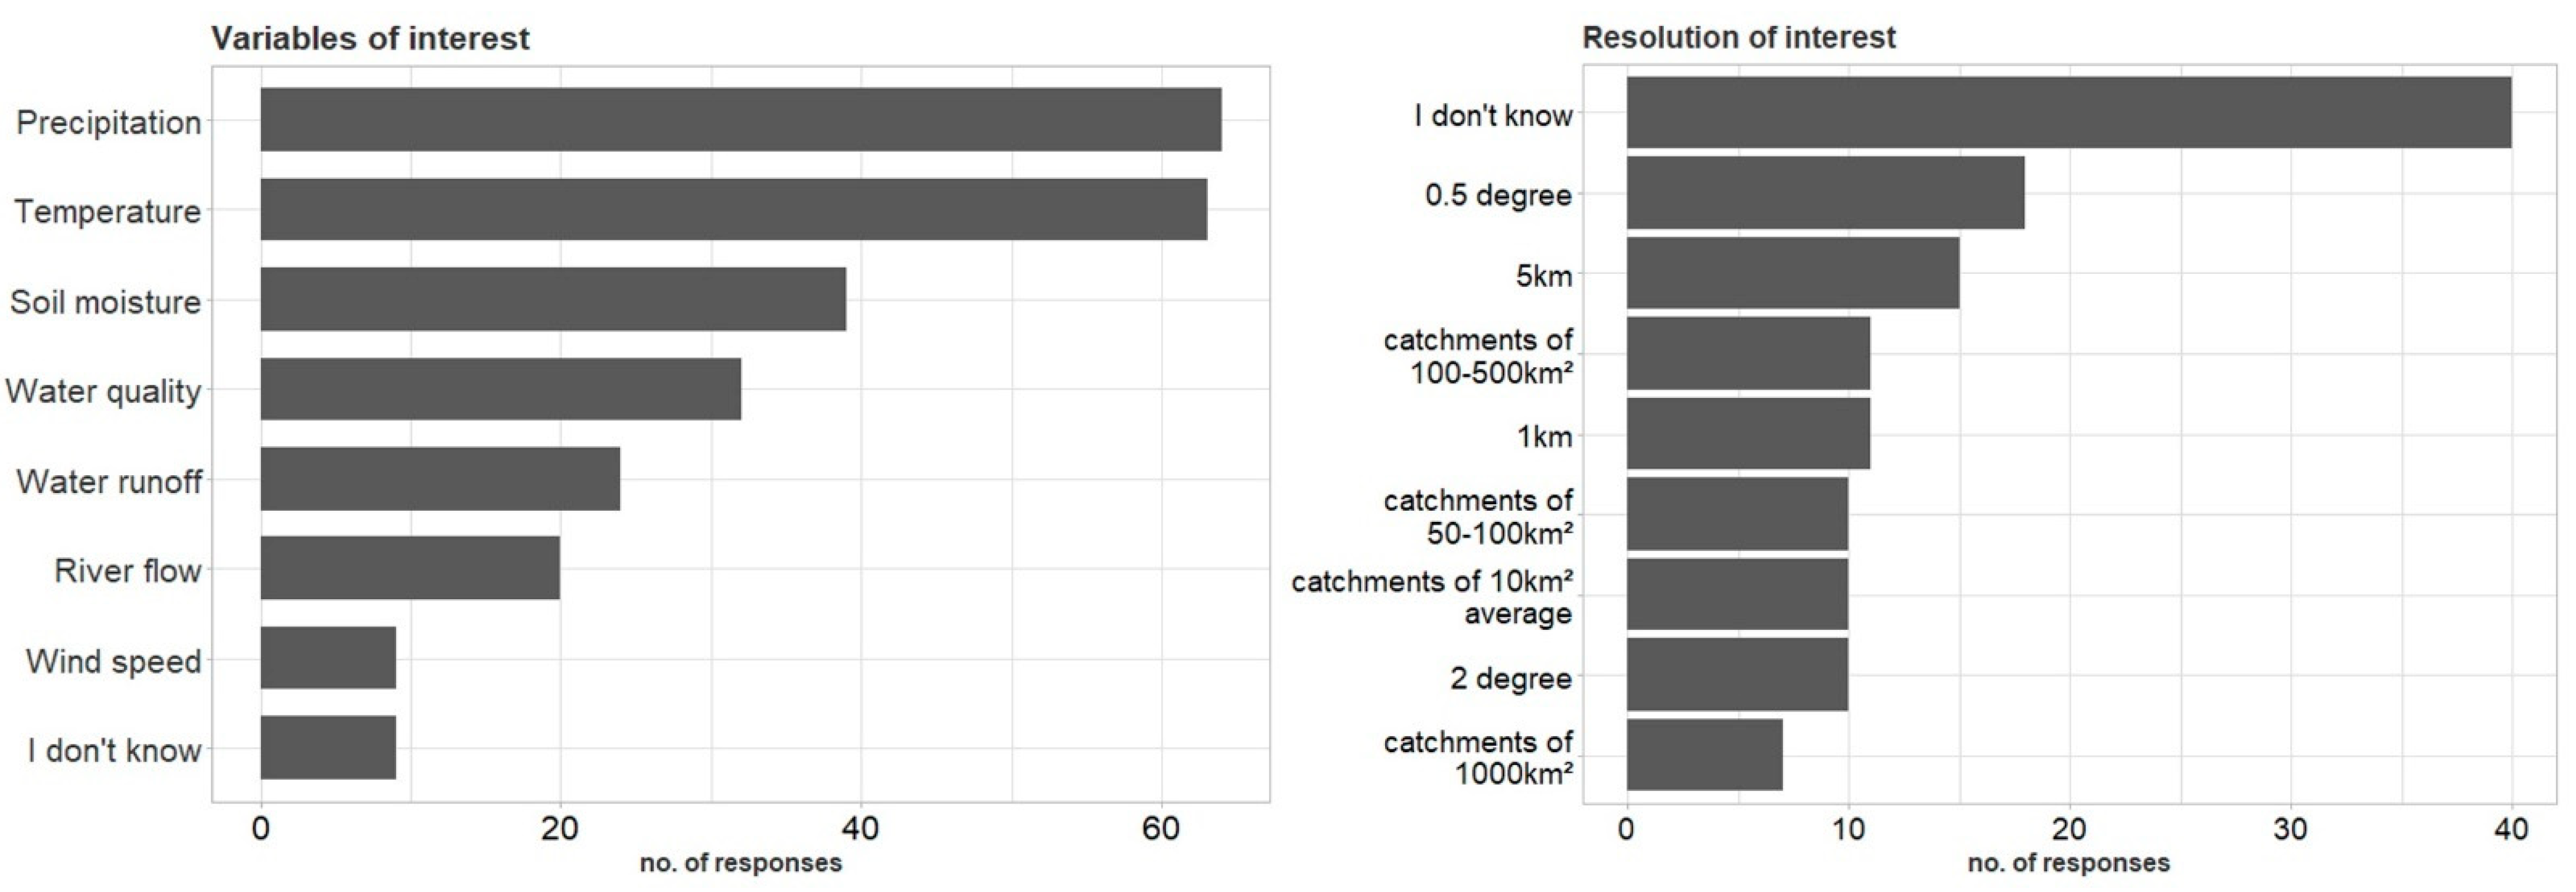
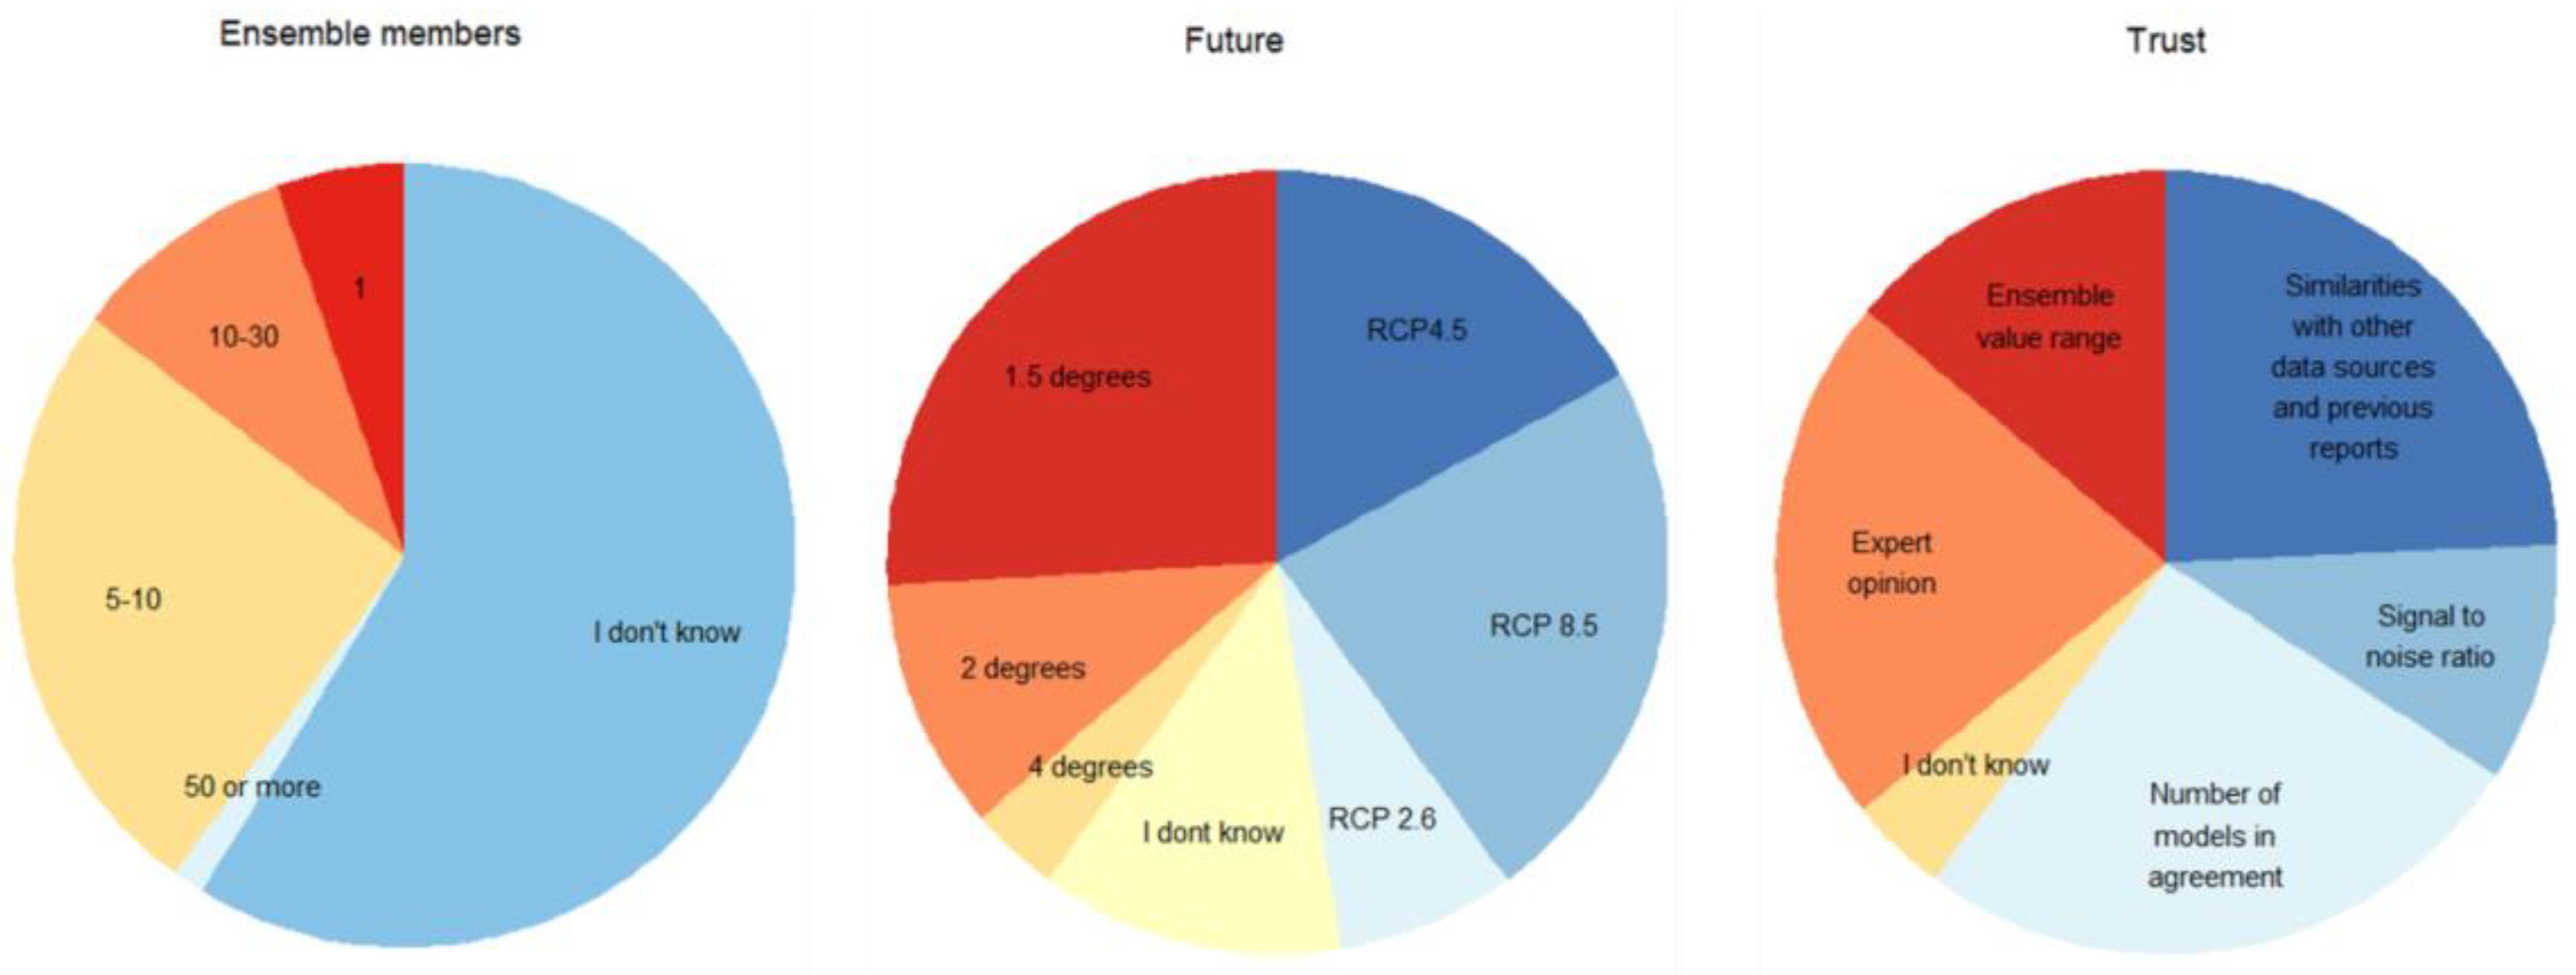
- Data, Information, and Confidence: What variables do they usually use, in which spatial resolution, how many ensemble members do they prefer to work with, what kind of future scenario are they most interested in, and what kind of information they need to trust climate data more.
- ○
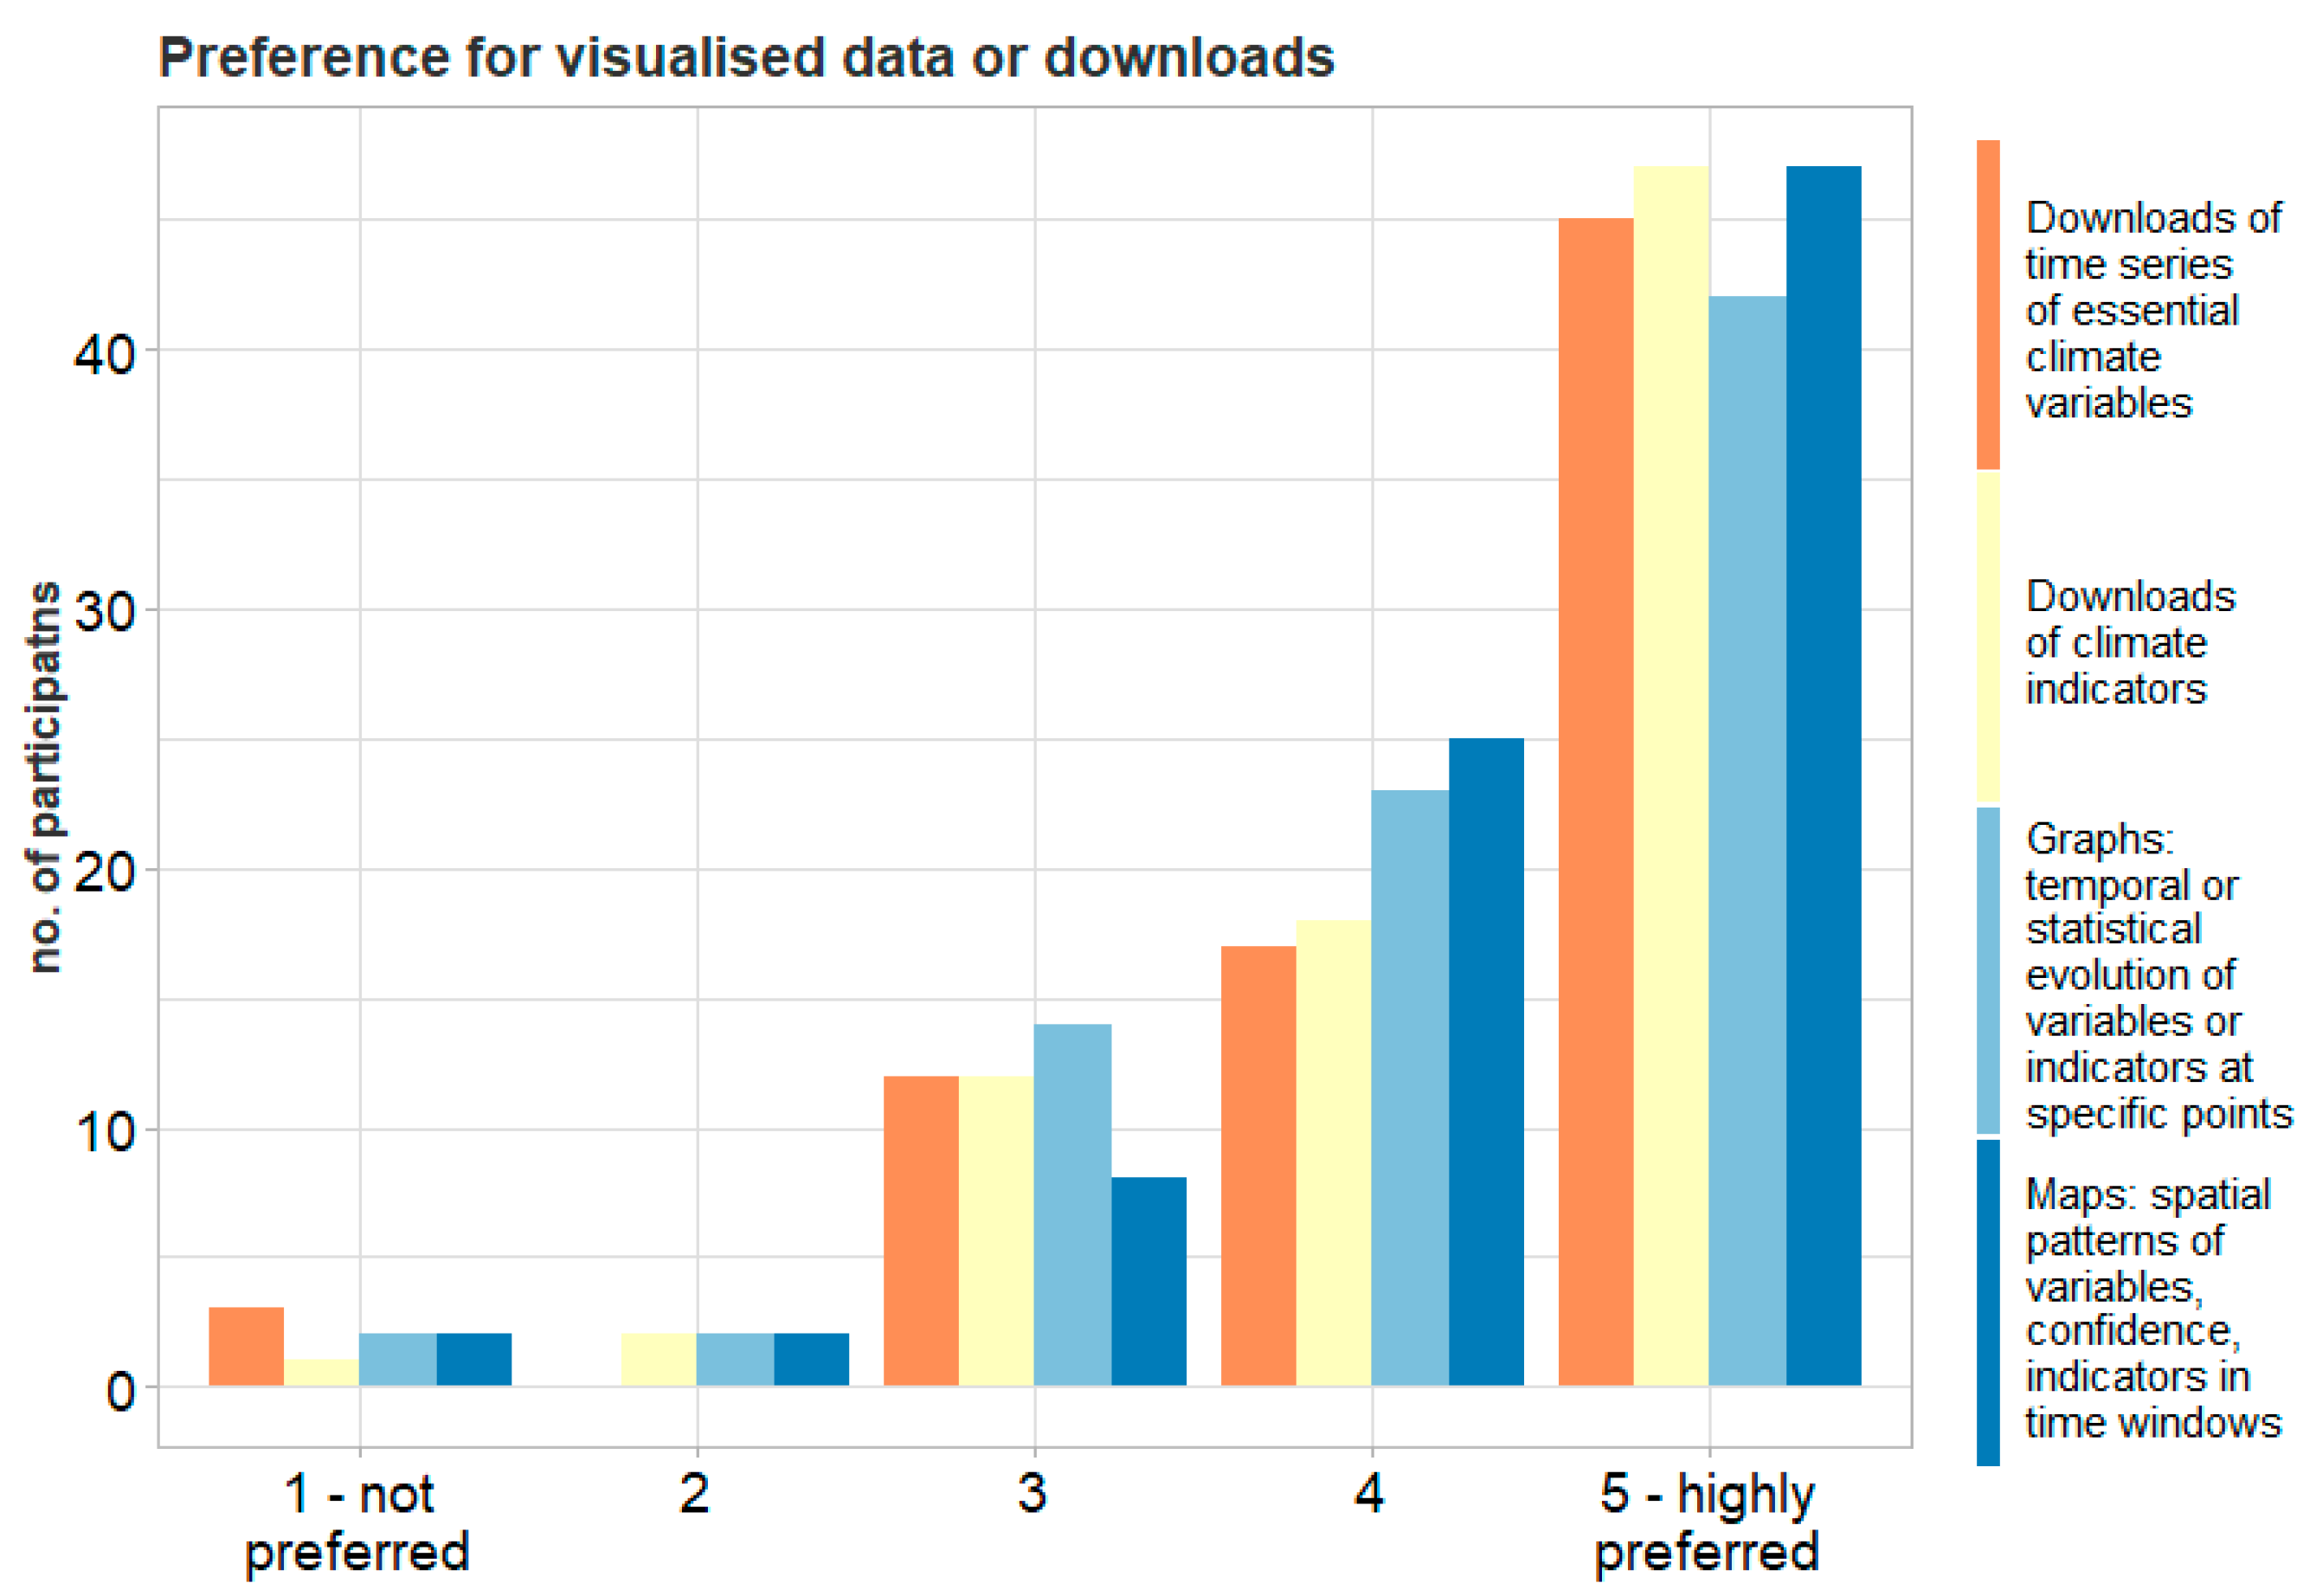
- Guidance: what kind of form they prefer to receive guidance for climate science and information (written, visual).
- Understanding Users questionnaire: participants were asked about their roles and duties, insight, motivation, capacity, and support (in free text):
- ○
- Insight: what are the main obstacles for them to use climate change data and how to overcome them;
- ○
- Motivation: What are the main drivers, added value and goals for them in using climate change data?
- ○
- Capacity: What capacity do they think is needed to work with climate change data and adaptation? (main skills, methods, technology, and institutional collaborations);
- ○
- Support: What support would they need to use climate data in their climate science basis (education, training and guidance, FAQ, help desk, showcases)?
3. Results
3.1. The Climate Information Platform—Main Tools
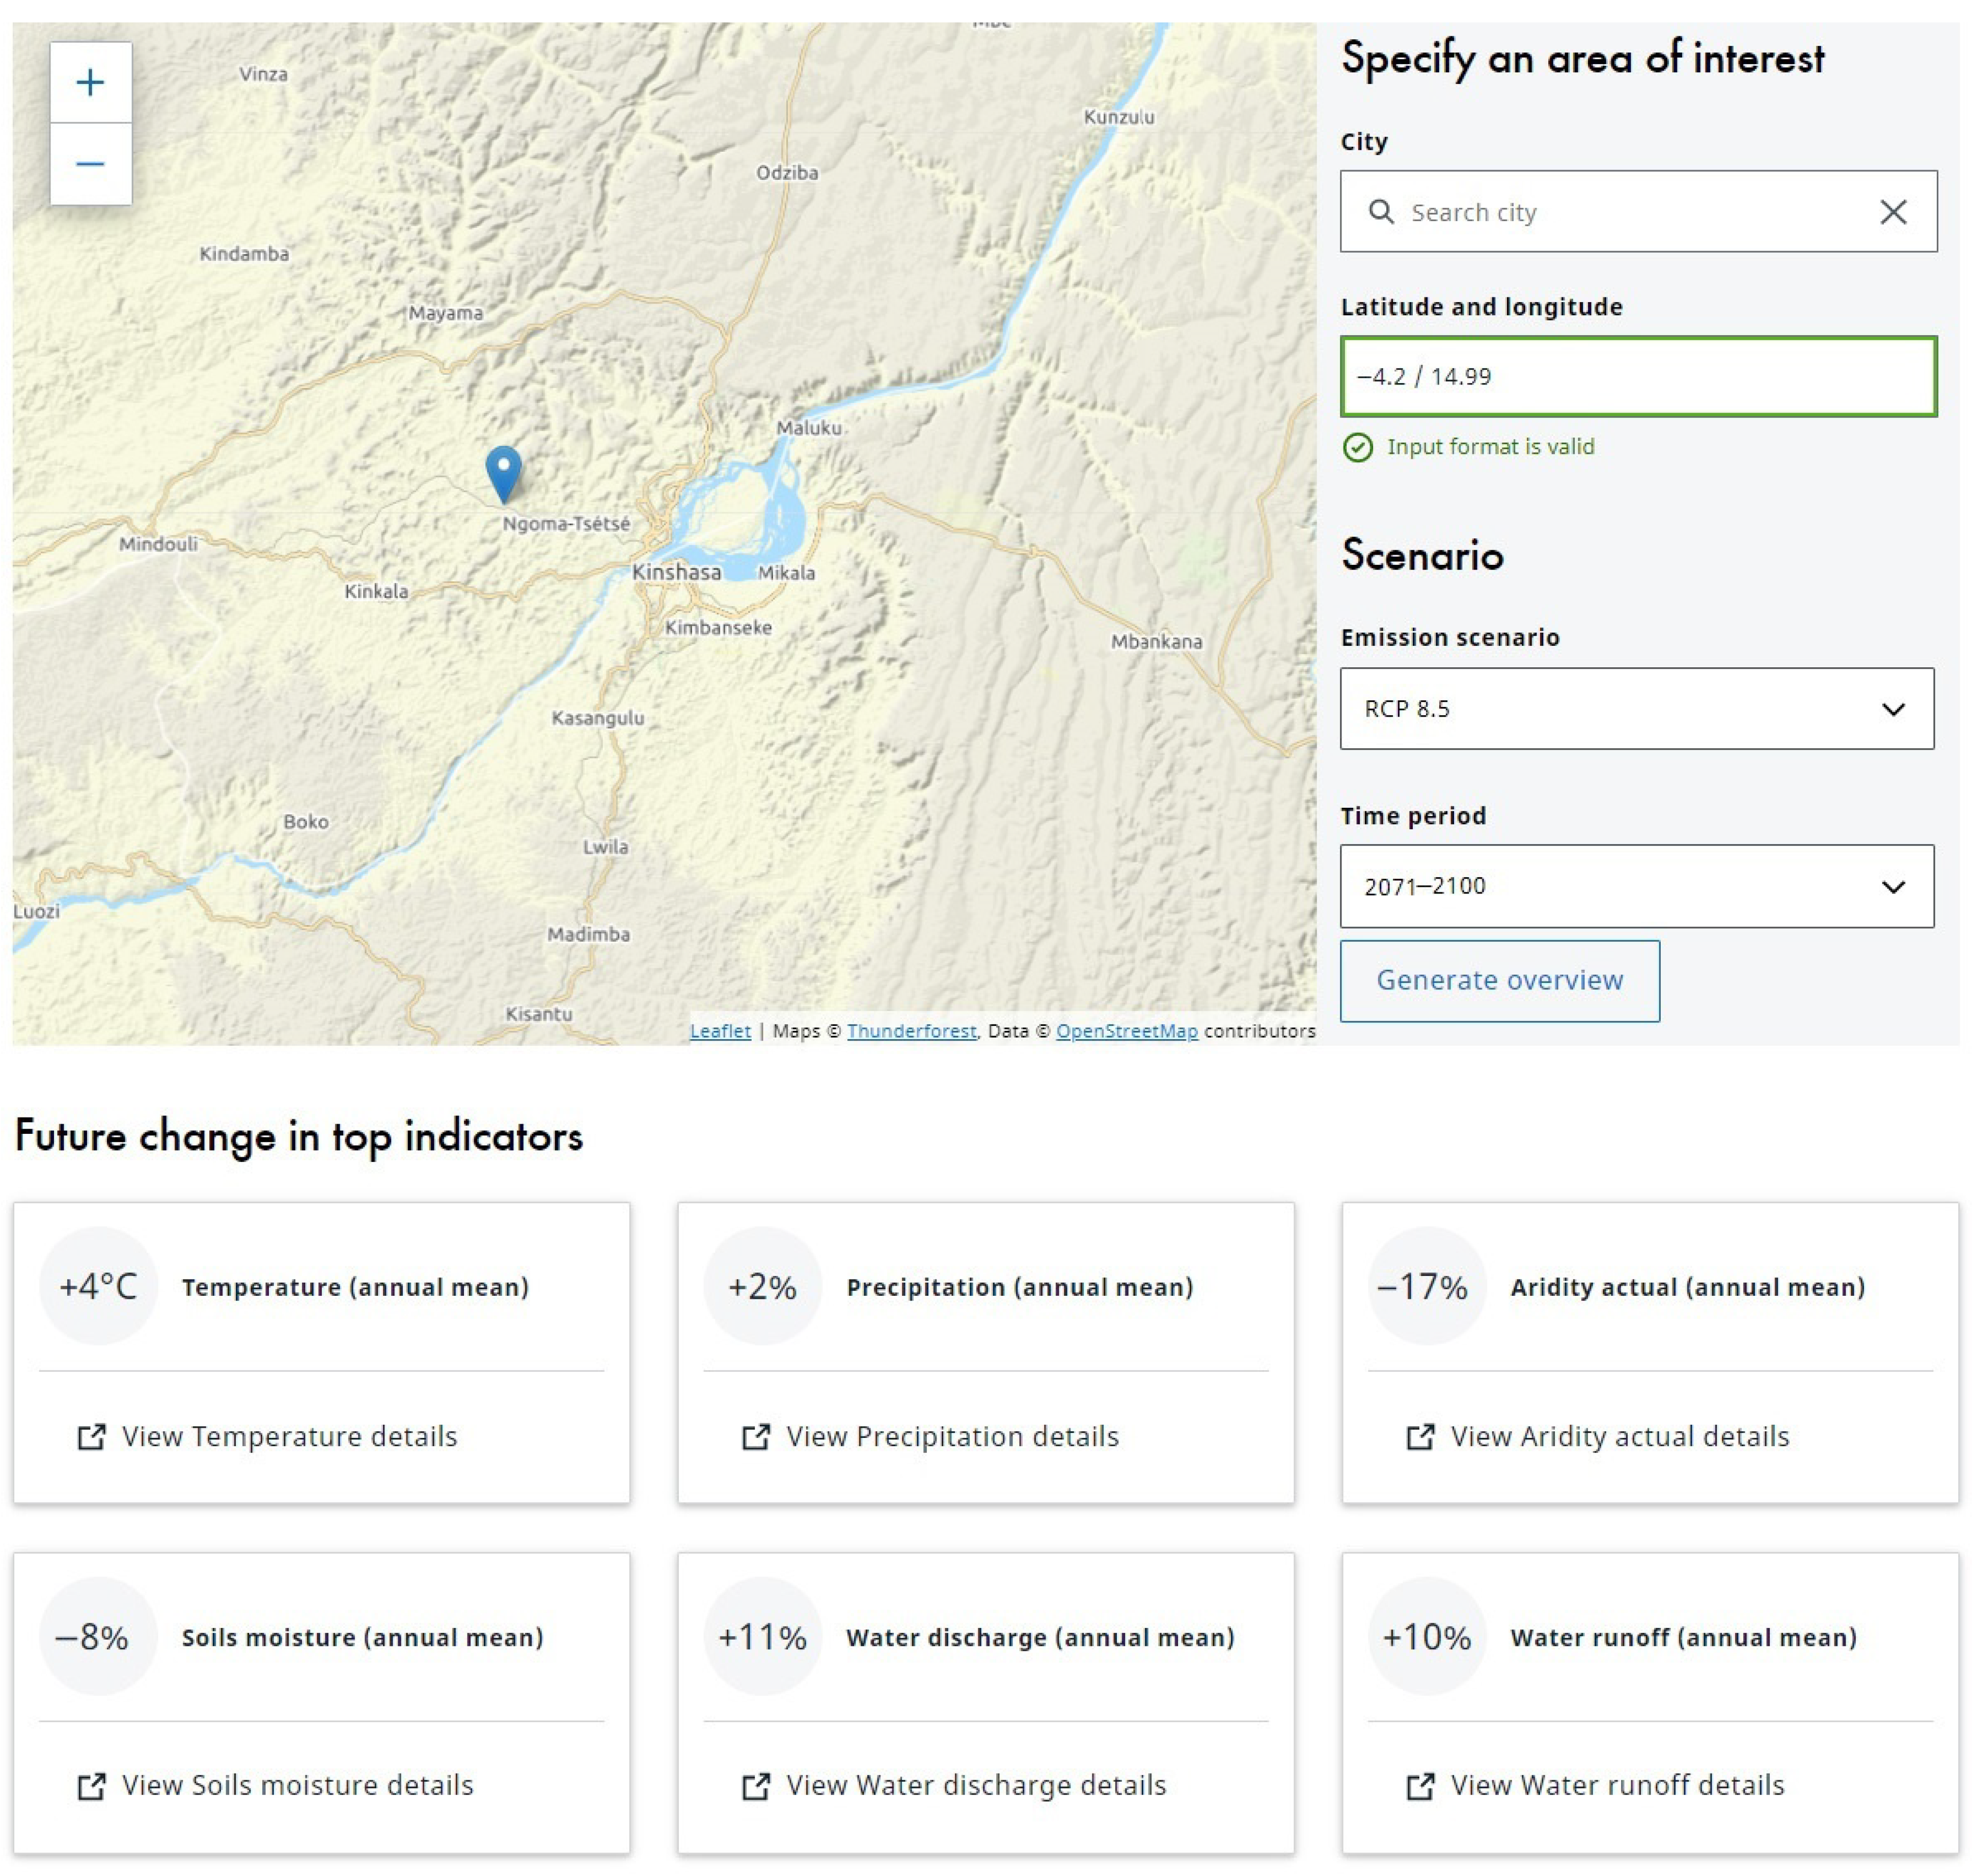
3.1.1. Site-Specific Report (SSR)
- a short description of the indicator (annual mean) with a link to more details (metadata),
- a map, covering the country or region of the selected point, showing annual mean of the indicator,
- boxplots presenting the annual mean ensemble spread (median, 25–75 percentiles, and min–max) for the three time periods,
- the ensemble agreement, i.e., how many models agree on the sign of change.
- a key message of the indicator (annual mean)
- a short description of the indicator (monthly mean) with a link to more details (metadata),
- a graph presenting monthly values (median, 25th—75th percentiles, and min–max)
- a key message of the indicator (monthly mean).
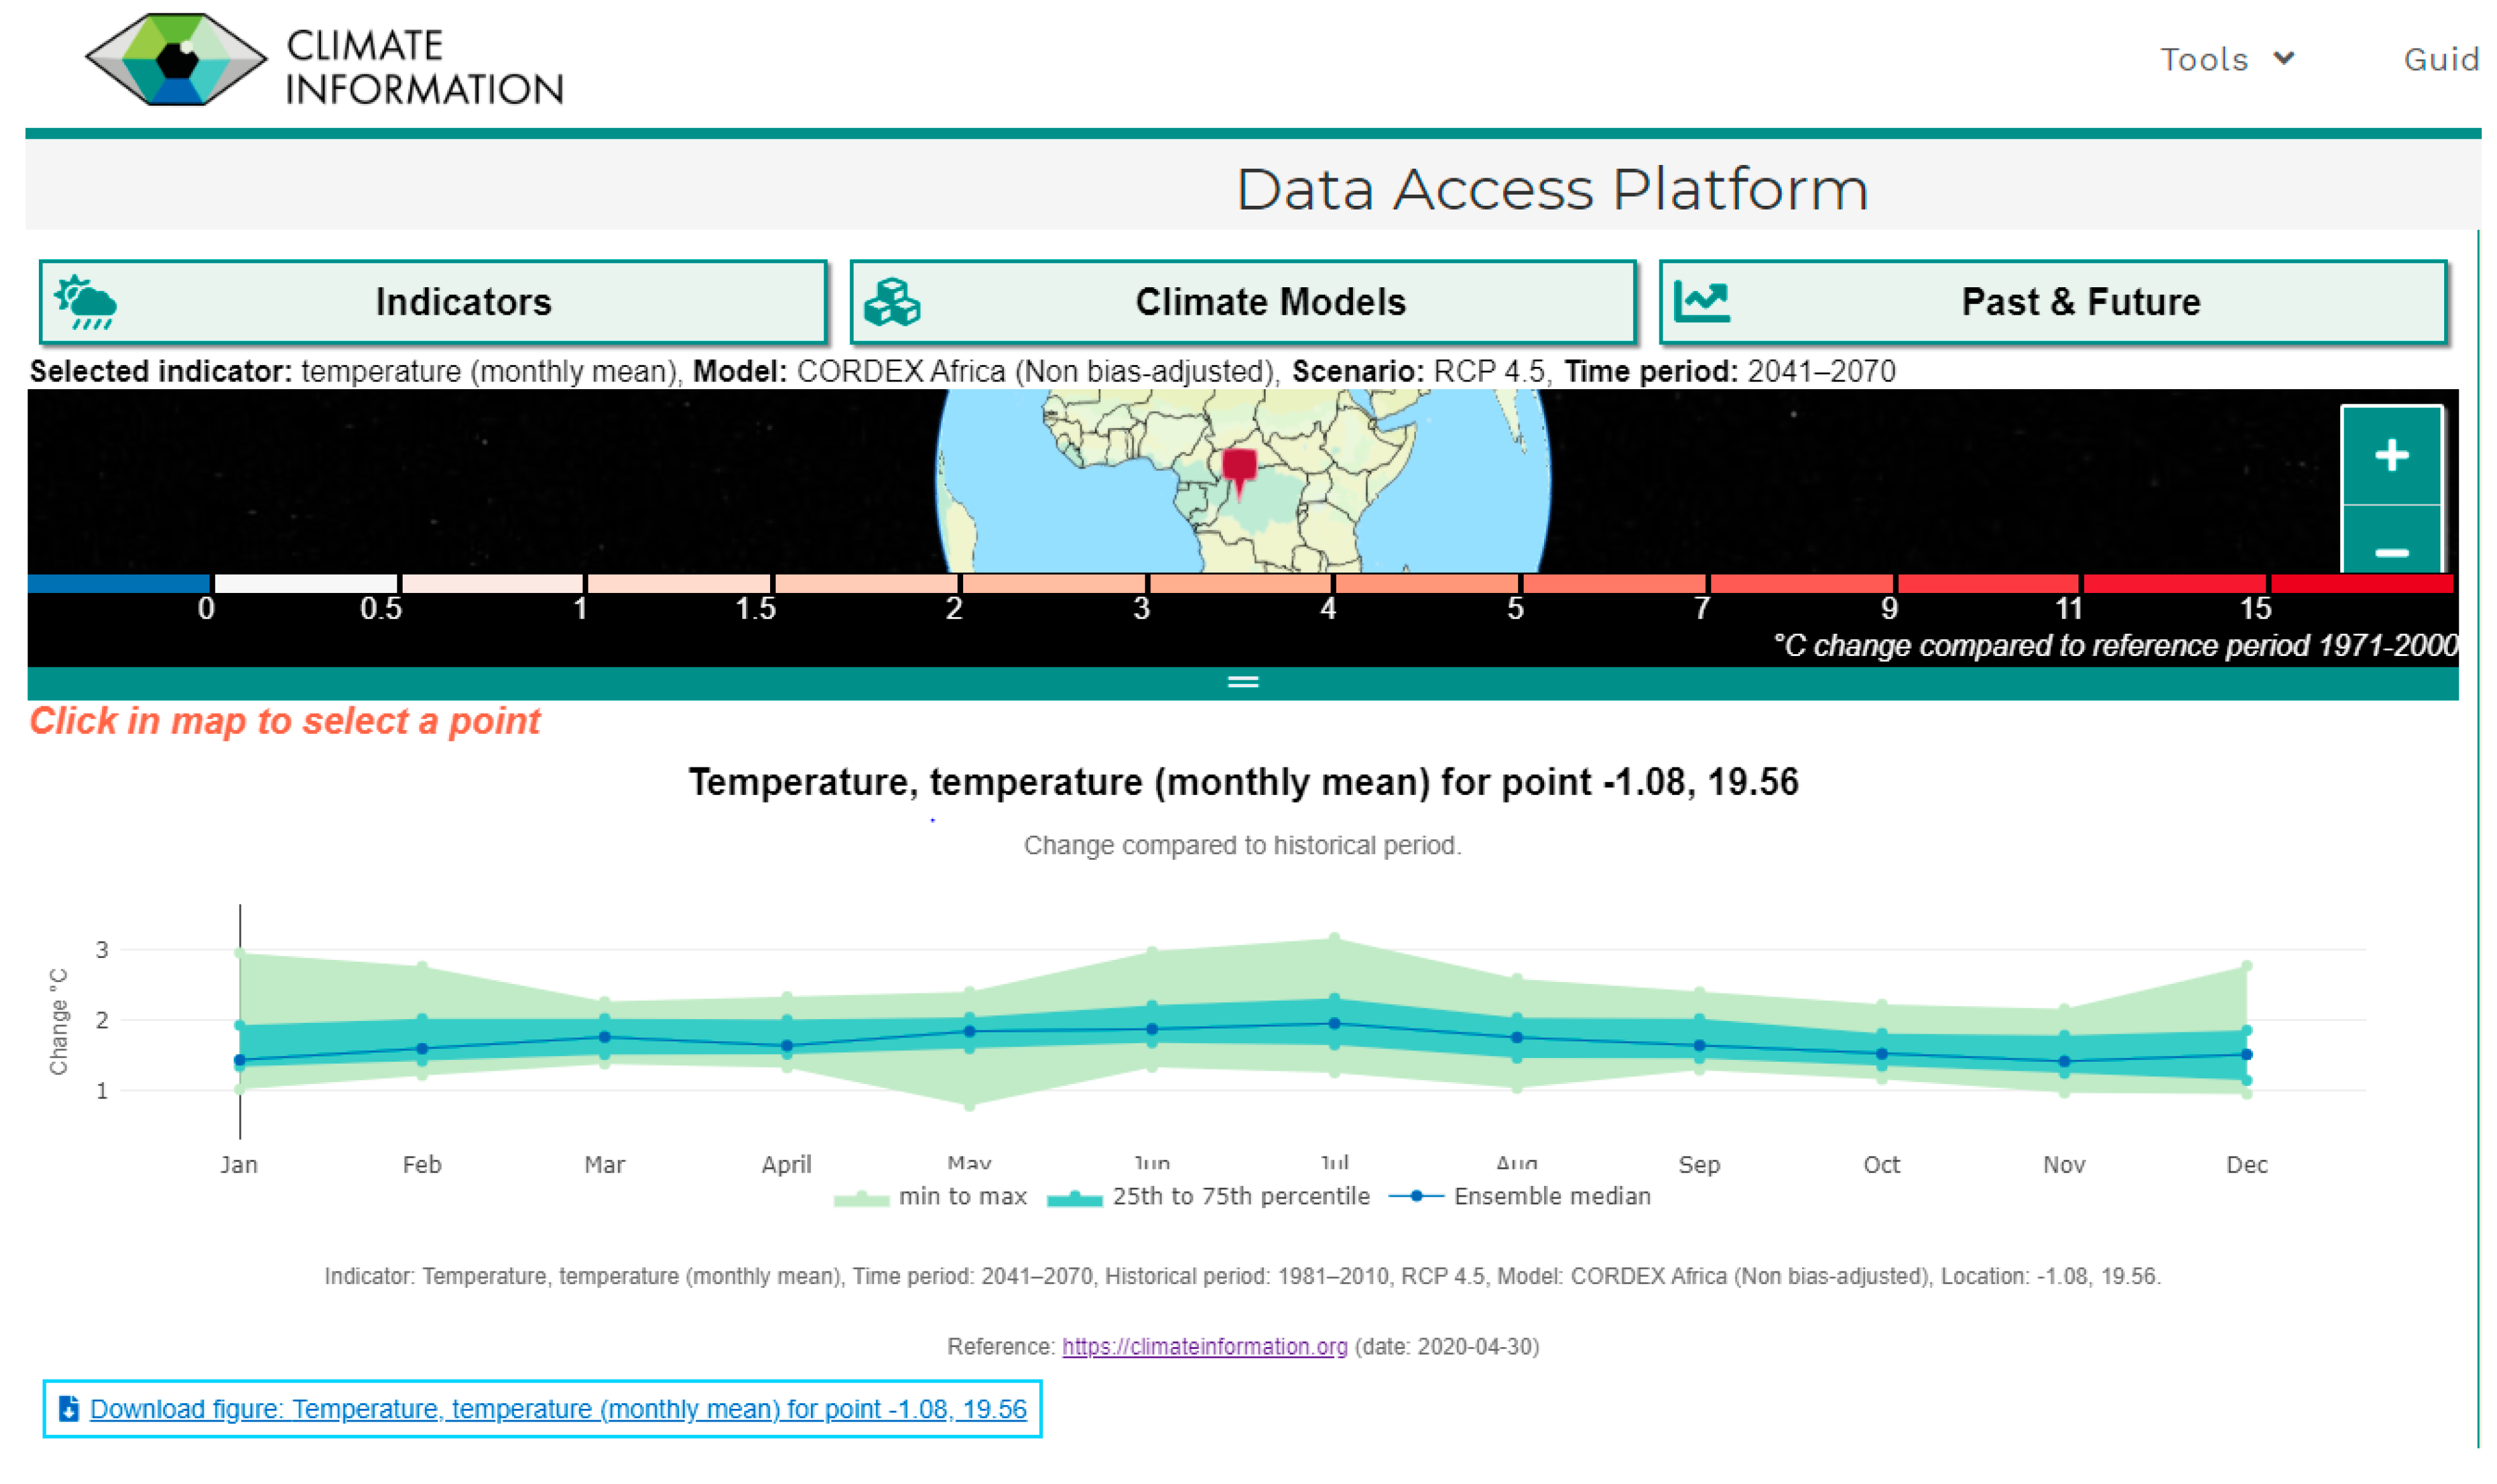
3.1.2. Data Access Platform
3.2. Development of the Climate Information Platform and Feedback Process
3.2.1. Quiz and Online Interactive Exercise
3.2.2. Interactive Feedback Exercise
3.2.3. Understanding Users Questionnaire
- Data variables: How to estimate local or regional climate change; What is a climate indicator; What is CMIP5 and CORDEX; What do different RCP mean, and what is a climate model and projections;
- Data production and tailoring: Which methods was used to bias adjust global and regional climate variables; Global forcing data for hydrology; How to produce climate indicators; Why select an area for download of data instead of a single point; Problems discovered while processing the climate model data; Which quality controls are done when producing indicators; What is Statistical and Dynamical downscaling; Why is there a spread of values in the ensembles, Why use a model ensemble;
- Confidence and Robustness: How to interpret ensemble value range; How to interpret agreement on signs of change; How to explore confidence in the data;
- Climate Model Details: How to access daily time-series from climate models; What CORDEX Regional or CMIP5 Global models are available and which have been used.
4. Discussion
5. Conclusions
- There are different needs in each country on multiple levels. In the four workshops that were held the needs were not only different between the pilot countries but also between the sectors in each country. For instance, in St. Lucia and Cambodia there was a strong need for capacity building on bias adjustment and downscaling methods, while in DRC and Cabo Verde primarily data and basic information were needed, especially for the energy and agriculture sector. In all pilot countries there was a strong need for more general knowledge in climate science, while in most countries there was also an increasing need of capacity in hydrological modelling and water management.
- The co-development process is not always institutionalised in vulnerable countries and the capacity level restricts national entities to only act via international intermediaries. The level of knowledge and capacity in climate and hydrological science in the pilot countries varied significantly, which was an important obstacle when establishing a direct access modality to support international, national, and sub-national organisations. It was difficult to identify a “one-size-fits-all” for the web platform and it thus resulted in providing different tools as the user groups were too broad. Our interactions with the users, which covers a small part of a co-development process, facilitated the dialogue between service developers and users. Understanding the users, transparency on potentials and limitations of climate services, and capacity development in climate science and methods were required components in the co-development process.
- The web-based climate service was improved considerably through co-design and it changed continuously in an agile approach during the one-year project period. It was important to have a service up and running already from the start to get adequate user feedback, and thus, the co-development must start from an already existing product that can be transformed easily. When further designed to become user friendly, we managed to provide access to key information, in a usable way that satisfies the needs of different users’ profiles.
Author Contributions
Funding
Acknowledgments
Conflicts of Interest
Appendix A
| GCM | RCM | Realisation | RCP4.5 | RCP8.5 | RCP2.6 |
|---|---|---|---|---|---|
| CCCma-CanESM2 | CRCM5 | r1i1p1 | yes | no | no |
| CCCma-CanESM2 | RCA4 | r1i1p1 | yes | yes | no |
| CSIRO-QCCCE-CSIRO-Mk3-6-0 | RCA4 | r1i1p1 | yes | yes | no |
| ICHEC-EC-EARTH | CCLM4-8-17 | r12i1p1 | yes | yes | no |
| ICHEC-EC-EARTH | RACMO22T | r1i1p1 | yes | yes | no |
| ICHEC-EC-EARTH | RACMO22T | r12i1p1 | no | no | yes |
| ICHEC-EC-EARTH | RCA4 | r12i1p1 | yes | yes | yes |
| ICHEC-EC-EARTH | REMO2009 | r12i1p1 | yes | yes | yes |
| IPSL-IPSL-CM5A-LR | REMO2009 | r1i1p1 | no | no | yes |
| IPSL-IPSL-CM5A-MR | RCA4 | r1i1p1 | yes | yes | no |
| MIROC-MIROC5 | RCA4 | r1i1p1 | yes | yes | yes |
| MIROC-MIROC5 | REMO2009 | r1i1p1 | no | yes | yes |
| MOHC-HadGEM2-ES | CCLM4-8-17 | r1i1p1 | yes | yes | no |
| MOHC-HadGEM2-ES | RACMO22T | r1i1p1 | yes | yes | yes |
| MOHC-HadGEM2-ES | RCA4 | r1i1p1 | yes | yes | yes |
| MOHC-HadGEM2-ES | REMO2009 | r1i1p1 | no | yes | yes |
| MPI-M-MPI-ESM-LR | CCLM4-8-17 | r1i1p1 | yes | yes | no |
| MPI-M-MPI-ESM-LR | CRCM5 | r1i1p1 | yes | no | no |
| MPI-M-MPI-ESM-LR | RCA4 | r1i1p1 | yes | yes | yes |
| MPI-M-MPI-ESM-LR | REMO2009 | r1i1p1 | yes | yes | yes |
| NCC-NorESM1-M | RCA4 | r1i1p1 | yes | yes | yes |
| NOAA-GFDL-GFDL-ESM2M | RCA4 | r1i1p1 | yes | yes | no |
| GCM | RCM | Realisation | RCP4.5 | RCP8.5 | RCP2.6 |
|---|---|---|---|---|---|
| CCCma-CanESM2 | RCA4 | r1i1p1 | no | yes | no |
| CSIRO-QCCCE-CSIRO-Mk3-6-0 | RCA4 | r1i1p1 | no | yes | no |
| ICHEC-EC-EARTH | RCA4 | r12i1p1 | yes | yes | yes |
| IPSL-IPSL-CM5A-MR | RCA4 | r1i1p1 | no | yes | no |
| MIROC-MIROC5 | RCA4 | r1i1p1 | no | yes | yes |
| MOHC-HadGEM2-ES | RCA4 | r1i1p1 | yes | yes | yes |
| MPI-M-MPI-ESM-LR | RCA4 | r1i1p1 | yes | yes | yes |
| NCC-NorESM1-M | RCA4 | r1i1p1 | no | yes | yes |
| NOAA-GFDL-GFDL-ESM2M | RCA4 | r1i1p1 | no | yes | no |
| GCM | RCM | Realisation | RCP4.5 | RCP8.5 | RCP2.6 |
|---|---|---|---|---|---|
| CCCma-CanESM2 | RCA4 | r1i1p1 | yes | yes | no |
| CCCma-CanESM2 | RegCM4-4 | r1i1p1 | yes | yes | no |
| CSIRO-QCCCE-CSIRO-Mk3-6-0 | RCA4 | r1i1p1 | yes | yes | no |
| CSIRO-QCCCE-CSIRO-Mk3-6-0 | RegCM4-4 | r1i1p1 | yes | yes | no |
| ICHEC-EC-EARTH | RCA4 | r12i1p1 | yes | yes | yes |
| IPSL-IPSL-CM5A-MR | RCA4 | r1i1p1 | yes | yes | no |
| MIROC-MIROC5 | RCA4 | r1i1p1 | yes | yes | yes |
| MOHC-HadGEM2-ES | RCA4 | r1i1p1 | yes | yes | yes |
| MPI-M-MPI-ESM-LR | RCA4 | r1i1p1 | yes | yes | yes |
| MPI-M-MPI-ESM-LR | REMO2009 | r1i1p1 | yes | yes | yes |
| MPI-M-MPI-ESM-MR | RegCM4-4 | r1i1p1 | yes | yes | no |
| NCC-NorESM1-M | RCA4 | r1i1p1 | yes | yes | yes |
| NOAA-GFDL-GFDL-ESM2M | RegCM4-4 | r1i1p1 | yes | yes | no |
| NOAA-GFDL-GFDL-ESM2M | RCA4 | r1i1p1 | yes | yes | no |
| GCM | RCM | Realisation | RCP4.5 | RCP8.5 | RCP2.6 |
|---|---|---|---|---|---|
| ICHEC-EC-EARTH | RCA4-SN | r12i1p1 | no | yes | no |
| ICHEC-EC-EARTH | RCA4 | r12i1p1 | yes | yes | yes |
| MPI-M-MPI-ESM-LR | RCA4 | r1i1p1 | yes | yes | no |
| MPI-M-MPI-ESM-LR | RCA4-SN | r1i1p1 | no | yes | no |
| MPI-M-MPI-ESM-LR | RRCM | r1i1p1 | no | yes | no |
| NCC-NorESM1-M | RCA4 | r1i1p1 | yes | yes | no |
| GCM | RCM | Realisation | RCP4.5 | RCP8.5 | RCP2.6 |
|---|---|---|---|---|---|
| ICHEC-EC-EARTH | CCLM4-8-17-CLM3-5 | r12i1p1 | yes | yes | no |
| MPI-M-MPI-ESM-LR | CCLM4-8-17-CLM3-5 | r1i1p1 | yes | yes | no |
| GCM | RCM | Realisation | RCP4.5 | RCP8.5 | RCP2.6 |
|---|---|---|---|---|---|
| ICHEC-EC-EARTH | CCLM5-0-2 | r12i1p1 | yes | yes | no |
| MOHC-HadGEM2-ES | CCLM5-0-2 | r1i1p1 | yes | yes | no |
| MPI-M-MPI-ESM-LR | CCLM5-0-2 | r1i1p1 | yes | yes | no |
| GCM | RCM | Realisation | RCP4.5 | RCP8.5 | RCP2.6 |
|---|---|---|---|---|---|
| CCCma-CanESM2 | RCA4 | r1i1p1 | yes | yes | no |
| CSIRO-QCCCE-CSIRO-Mk3-6-0 | RCA4 | r1i1p1 | yes | yes | no |
| ICHEC-EC-EARTH | CCLM5-0-6 | r12i1p1 | no | yes | no |
| ICHEC-EC-EARTH | RACMO22E | r1i1p1 | yes | yes | no |
| ICHEC-EC-EARTH | RACMO22E | r12i1p1 | no | no | yes |
| ICHEC-EC-EARTH | RCA4 | r12i1p1 | yes | yes | yes |
| IPSL-IPSL-CM5A-MR | RCA4 | r1i1p1 | yes | yes | no |
| IPSL-IPSL-CM5A-MR | WRF331F | r1i1p1 | yes | yes | no |
| MIROC-MIROC5 | CCLM5-0-6 | r1i1p1 | no | yes | no |
| MIROC-MIROC5 | RCA4 | r1i1p1 | yes | yes | yes |
| MOHC-HadGEM2-ES | RACMO22E | r1i1p1 | yes | yes | yes |
| MOHC-HadGEM2-ES | RCA4 | r1i1p1 | yes | yes | yes |
| MPI-M-MPI-ESM-LR | CCLM4-8-17 | r1i1p1 | yes | yes | no |
| MPI-M-MPI-ESM-LR | CCLM5-0-6 | r1i1p1 | no | yes | no |
| MPI-M-MPI-ESM-LR | RCA4 | r1i1p1 | yes | yes | yes |
| MPI-M-MPI-ESM-LR | REMO2009 | r1i1p1 | yes | yes | yes |
| MPI-M-MPI-ESM-LR | REMO2009 | r2i1p1 | yes | yes | yes |
| NCC-NorESM1-M | RCA4 | r1i1p1 | yes | yes | yes |
| NOAA-GFDL-GFDL-ESM2M | RCA4 | r1i1p1 | yes | yes | no |
| GCM | RCM | Realisation | RCP4.5 | RCP8.5 | RCP2.6 |
|---|---|---|---|---|---|
| ICHEC-EC-EARTH | RCA4 | r12i1p1 | yes | yes | yes |
| NOAA-GFDL-GFDL-ESM2M | RCA4 | r1i1p1 | yes | yes | no |
| GCM | RCM | Realisation | RCP4.5 | RCP8.5 | RCP2.6 |
|---|---|---|---|---|---|
| CCCma-CanESM2 | CRCM5 | r1i1p1 | yes | no | no |
| CCCma-CanESM2 | RCA4 | r1i1p1 | yes | yes | no |
| ICHEC-EC-EARTH | RCA4 | r12i1p1 | yes | yes | yes |
| MPI-M-MPI-ESM-LR | CRCM5 | r1i1p1 | yes | no | no |
| GCM | RCM | Realisation | RCP4.5 | RCP8.5 | RCP2.6 |
|---|---|---|---|---|---|
| CCCma-CanESM2 | RCA4 | r1i1p1 | yes | yes | no |
| CSIRO-QCCCE-CSIRO-Mk3-6-0 | RCA4 | r1i1p1 | yes | yes | no |
| ICHEC-EC-EARTH | RCA4 | r12i1p1 | yes | yes | yes |
| IPSL-IPSL-CM5A-MR | RCA4 | r1i1p1 | yes | yes | no |
| MIROC-MIROC5 | RCA4 | r1i1p1 | yes | yes | yes |
| MOHC-HadGEM2-ES | RCA4 | r1i1p1 | yes | yes | yes |
| MPI-M-MPI-ESM-LR | REMO2009 | r1i1p1 | yes | no | no |
| MPI-M-MPI-ESM-LR | RCA4 | r1i1p1 | yes | yes | yes |
| NCC-NorESM1-M | RCA4 | r1i1p1 | yes | yes | yes |
| NOAA-GFDL-GFDL-ESM2M | RCA4 | r1i1p1 | yes | yes | no |
| Institute | GCM Name | Scenario |
|---|---|---|
| CSIRO-BOM | ACCESS1-0 | rcp45, rcp85 |
| CSIRO-BOM | ACCESS1-3 | rcp45, rcp85 |
| BNU | BNU-ESM | rcp45, rcp85 |
| IPSL | IPSL-CM5A-MR | rcp45, rcp85 |
| IPSL | IPSL-CM5A-LR | rcp45, rcp85 |
| IPSL | IPSL-CM5B-LR | rcp45, rcp85 |
| MPI-M | MPI-ESM-MR | rcp45, rcp85 |
| MPI-M | MPI-ESM-LR | rcp45, rcp85 |
| MOHC | HadGEM2-ES | rcp45, rcp85 |
| MOHC | HadGEM2-CC | rcp45, rcp85 |
| NCC | NorESM1-M | rcp45, rcp85 |
| NOAA-GFDL | GFDL-ESM2G | rcp45, rcp85 |
| GFDL-ESM2M | GFDL-ESM2M | rcp45, rcp85 |
| NOAA-GFDL | GFDL-CM3 | rcp45, rcp85 |
| CNRM-CERFACS | CNRM-CM5 | rcp45, rcp85 |
| INM | INM-CM4 | rcp45, rcp85 |
| BCC | BCC-CSM1.1 | rcp45, rcp85 |
| BCC | BCC-CSM1.1(m) | rcp45, rcp85 |
| ICHEC | EC-EARTH | rcp45, rcp85 |
Appendix B
| St Lucia, Caribbean | DR Congo, Africa | Cabo Verde, Africa | Cambodia, Asia |
|---|---|---|---|
| Simple and easy to use, aesthetically pleasing (13 comments) | Easy access, user friendly platform with data and useful information (15 comments) | User-friendliness of the platform/interface, with good layout, interactive information, data and documentation (10 comments) | Easy access to lots of information, visualised maps and graphs, easy to download data (11 comments) |
| User friendly (11 comments) | Wide range of useful data on climate projections and indicators (5 comments) | Ability to make more detailed analyses, obtain plots (3 comments) | User friendly design (3 comments) |
| Interactivity (7 comments) | Simulations of scenarios and climate change for Cabo Verde (2 comments) | Provides model ensembles and projections for different periods in this century (3 comments) | |
| Good access to main guidance and other information for understanding climate science (4 comments) | Access to new data in excel format (3 comments) | Site-specific report is easy to use and you can search specific coordinates or names (4 comments) |
Appendix C
| Role and Duties (no. of respondents) | Insight | Motivation | Capacity | Support |
|---|---|---|---|---|
| Administrator (3) | Hoping for more data-driven decisions (based on accurate data) and capacity within the country | Want funding for projects, capacity development, understanding past and future climate | Knowledge to select right tools and methodologies for climate data, analytical skills | Specialised training needed, showcases, FAQ |
| Coordinators (15) | There is a lack of scientific knowledge, practice, learning and skills, lack of data/data access/access to climate projections (available in paper form, not ratified) that are relevant for climate change assessments, need for more sophisticated computers. | Motivation is to improve project rationale in environmental projects, and improve understanding, to use climate data in research, that decision making and sustainable development is based on past and future climate data as ‘business as usual’ will lead to more difficult problems. | Need to build collaboration between institutes, combine databases, verify local/seasonal trends, the right tools to analyse climate data, to improve knowledge management capabilities. Need to have basic understanding climate data, be able to transform international information into relevant national information. | Specialised education, training and guidance needed for using climate information, to build databases, to understand climate modelling, to conduct specialised studies. English language needed; collaboration with international experts. Remote assistance needed. |
| Meteorologist (7) | Main obstacle is knowing how to organise and save data appropriately, process climate data and to observe conclusive climate change trends at stations. A challenge to use the right tools. Also difficult to identify challenges, build shared awareness in public audiences. | Main driver is to better understand climate and future climate changes, conduct research, use science to drive policy. Climate change has devastating consequences, need to act now. | Need to build technology and institutional collaboration, use known tools and methods that are adjusted for the region, gain expertise and data access, training in analysis and research. | Showcases needed, training in how to access data, to use and understand new products as they become available. Training and guidance in climate change in general. |
| Policy makers/Government level roles (16) | Main obstacle is data access/availability, analysis and interpretation of climate data. Specialised guidance and an information network could overcome these (in Cape Verde, Cambodia). Another main obstacle is use and interpretation of climate change for all different sectors. Climate change impacts need factual based discussion. There is a lack of finance and capacity development opportunities. | Need to make decisions, research, add value to project assessments, improve political decisions for adaptation to climate change. Need new approaches to problem solving, need to protect the environment and create resilience for the future. Driven to write better proposals for GCF. | Need institutional collaborations, coordinated platforms and systems for data sharing and management (with quality assurance). A holistic approach in departmental structure. Need qualified personnel, skills in interpreting climate change data, training in sustainability. Have an expert on UNFCCC roster of experts (Cabo Verde). | Education and long term guidance, specifically in modelling, database management, training in using the platform are needed. Develop decision making abilities, continuous workshops, face-to-face training needed. Training in climate risks and uses, proposal writing and observation equipment (thermometers etc) |
| Scientist, Research, Scientific/Data analysis Role (23) | Lack of meteo stations in some regions, low horizontal resolution in small island states, problems on downloading data from global climate models, lack of climate indicators, data quality, harmonization, linking available data to what is needed, lack of downscaling skills. Lack of understanding of climate change, impacts, bias, uncertainties and how to link this information to socio-economic data. No marine data. If climate services were delivered to society, could lead to shared awareness, better decision making. | Want to understand climate projections to support decision making, do research, help society, get better understanding/planning of adaptation actions. Main driver is to analyse trends, form hypotheses, make data available (to public), understand the relationship between climate and oceanographic/marine data. Bridge the science and society communities. | Need skills on understanding climate models, downscaling to small islands, bias adjustment, reanalysis. Need to fill in gaps in time series, more data access. Need new technologies, training in interpretation, institutional collaborations for expertise exchange. St Lucia have access to knowledge base, literature, software, data. | Support to run climate models and store data needed, specific educations and guidance for understanding climate change, showcases to give examples. Training/education should be given periodically. Need training in R/Python, continued expert advice, training in downscaling methods |
| Technician, Technical Role (13) | Lack of experience, local and hydrological data. Need for outputs to be translated into suitable format for non-technical stakeholders. Climate change will have a world-wide impact, raised awareness is needed. Need to overcome the challenge of connecting climate change data with all different sectors. Can be overcome using co-creating climate services with sector representatives and understanding of sectoral processes | Using climate data adds value to projects, need data (precipitation, water runoff, water quality, soil moisture) to provide sound basis for proposals. Motivated to use generated indicators later to check original assumptions. Want to know more about tools for climate change data, be the central agency to help collate required data. Motivated to contribute to decisions based on trusted climate science. | ICT, Statistics, GIS, WRMA, Agriculture, basic level of understanding but need capacity for model choice, data inputs to generate useful outputs for proposals. Also need capacity in evaluating different datasets. Limited modelling experiences. Need understanding of climate change processes, links between global and local scales, and understand uncertainties. | Education and guidance in modelling, examples of ‘how to’, data collections, using provided tools and methods. Both face-to-face and virtual interaction platforms needed. Develop regional capacity to learn and deliver, then extra-regional institutions provide support. Climate projection tools. Training in downscaling, bias adjustment and local climate assessments |
| Other—medical dr, trainee, not specified (3) | Missing data, use platform for further comparisons | Want to improve the networks, cooperation between national and international institutions, know climate of the region | Everything is needed | Education and specialised guidance needed. Support can be provided through communities of practice, online forums, youtube tutorials so can develop water availability indices and models |
References
- UN. Transforming Our World: The 2030 Agenda for Sustainable Development; A/RES/70/1; UN: New York, NY, USA, 2015. [Google Scholar]
- UNFCCC. The Paris Agreement to the United Nations Framework Convention on Climate Change; T.I.A.S. No. 16-1104; UNFCCC: Paris, France, 2015. [Google Scholar]
- Dessai, S.; Hulme, M.; Lempert, R.; Pielke, R. Climate prediction: A limit to adaptation. In Adapting to Climate Change: Thresholds, Values, Governance; Lorenzoni, I., Brien, K.L., Adger, W.N., Eds.; Cambridge University Press: Cambridge, UK, 2009; pp. 64–78. ISBN 978-0-521-76485-8. [Google Scholar]
- Otto, J.; Brown, C.; Buontempo, C.; Doblas, R.F.; Jacob, D.; Juckes, M.; Keup, T.E.; Kurnik, B.; Schulz, J.; Taylor, A.; et al. Uncertainty: Lessons Learned for Climate Services. Bull. Am. Meteorol. Soc. 2016, 97, ES265–ES269. [Google Scholar] [CrossRef] [Green Version]
- Hewitt, C.; Mason, S.; Walland, D. The Global Framework for Climate Services. Nat. Clim. Chang. 2012, 2, 831–832. [Google Scholar] [CrossRef] [Green Version]
- Hewitt, C.D.; Allis, E.; Mason, S.J.; Muth, M.; Pulwarty, R.; Shumake, G.J.; Bucher, A.; Brunet, M.; Fischer, A.M.; Hama, A.M.; et al. Making Society Climate Resilient: International Progress under the Global Framework for Climate Services. Bull. Am. Meteorol. Soc. 2020, 101, E237–E252. [Google Scholar] [CrossRef] [Green Version]
- Vaughan, C.; Dessai, S. Climate services for society: Origins, institutional arrangements, and design elements for an evaluation framework. WIREs Clim. Chang. 2014, 5, 587–603. [Google Scholar] [CrossRef] [PubMed]
- WMO. 2019 State of Climate Services Report; WMO: Geneva, Switzerland, 2019; ISBN 978-92-63-11242-2. [Google Scholar]
- Dilling, L.; Lemos, M.C. Creating usable science: Opportunities and constraints for climate knowledge use and their implications for science policy. Glob. Environ. Chang. 2011, 21, 680–689. [Google Scholar] [CrossRef]
- Nie, E.C. Delivering Climate Services: Organizational Strategies and Approaches for Producing Useful Climate-Science Information. Weather Clim. Soc. 2013, 5, 14–26. [Google Scholar] [CrossRef]
- Weichselgartner, J.; Arheimer, B. Evolving Climate Services into Knowledge–Action Systems. Weather Clim. Soc. 2019, 11, 385–399. [Google Scholar] [CrossRef] [Green Version]
- Maraun, D.; Widmann, M.; Gutiérrez, J.M.; Kotlarski, S.; Chandler, R.E.; Hertig, E.; Wibig, J.; Huth, R.; Wilcke, R.A.I. VALUE: A framework to validate downscaling approaches for climate change studies. Earths Future 2015, 3, 1–14. [Google Scholar] [CrossRef] [Green Version]
- Sweeney, C.F.; Jones, R.G.; Lee, R.W.; Rowell, D.P. Selecting CMIP5 GCMs for downscaling over multiple regions. Clim. Dyn. 2015, 44, 3237–3260. [Google Scholar] [CrossRef] [Green Version]
- WMO. Step-by-Step Guidelines for Establishing a National Framework for Climate Services; WMO- No. 1206; WMO: Geneva, Switzeralnd, 2018; ISBN 978-92-63-11206-4. [Google Scholar]
- Norström, A.V.; Cvitanovic, C.; Löf, M.F.; West, S.; Wyborn, C.; Balvanera, P.; Bednarek, A.T.; Bennett, E.M.; Biggs, R.; Bremond, A.; et al. Principles for knowledge co-production in sustainability research. Nat. Sustain. 2020, 3, 182–190. [Google Scholar] [CrossRef]
- Vincent, K.; Carter, S.; Steynor, A.; Visman, E.; Wågsæther, K.L. Addressing power imbalances in co-production. Nat. Clim. Change 2020, 10, 877–878. [Google Scholar] [CrossRef]
- Merks, J.; Photiadou, C.; Ludwig, F.; Arheimer, B. Comparison of open access global climate services for hydrological data. Hydrol. Sci. J. 2020, 1–17. [Google Scholar] [CrossRef]
- Taylor, K.E.; Stouffer, R.J.; Meehl, G.A. An Overview of CMIP5 and the Experiment Design. Bull. Am. Meteorol. Soc. 2012, 93, 485–498. [Google Scholar] [CrossRef] [Green Version]
- Jacob, D.; Petersen, J.; Eggert, B.; Alias, A.; Christensen, O.B.; Bouwer, L.M.; Braun, A.; Colette, A.; Déqué, M.; Georgievski, G.; et al. EURO-CORDEX: New high-resolution climate change projections for European impact research. Reg. Environ. Chang. 2014, 14, 563–578. [Google Scholar] [CrossRef]
- Hurk, B.; Hewitt, C.; Jacob, D.; Bessembinder, J.; Doblas, R.F.; Döscher, R. The match between climate services demands and Earth System Models supplies. Clim. Serv. 2018, 12, 59–63. [Google Scholar] [CrossRef]
- Yang, W.; Andréasson, J.; Phil, G.L.; Olsson, J.; Rosberg, J.; Wetterhall, F. Distribution-based scaling to improve usability of regional climate model projections for hydrological climate change impacts studies. Hydrol. Res. 2010, 41, 211–229. [Google Scholar] [CrossRef]
- Berg, P.; Donnelly, C.; Gustafsson, D. Near-real-time adjusted reanalysis forcing data for hydrology. Hydrol. Earth Syst. Sci. 2018, 22, 989–1000. [Google Scholar] [CrossRef] [Green Version]
- Arheimer, B.; Pimentel, R.; Isberg, K.; Crochemore, L.; Andersson, J.C.M.; Hasan, A.; Pineda, L. Global catchment modelling using World-Wide HYPE (WWH), open data, and stepwise parameter estimation. Hydrol. Earth Syst. Sci. 2020, 24, 535–559. [Google Scholar] [CrossRef] [Green Version]
- Maraun, D.; Shepherd, T.G.; Widmann, M.; Zappa, G.; Walton, D.; Gutiérrez, J.M.; Hagemann, S.; Richter, I.; Soares, P.M.M.; Hall, A.; et al. Towards process-informed bias correction of climate change simulations. Nat. Clim. Chang. 2017, 7, 764–773. [Google Scholar] [CrossRef] [Green Version]
- Zhang, X.; Alexander, L.; Hegerl, G.C.; Jones, P.; Tank, A.K.; Peterson, T.C.; Trewin, B.; Zwiers, F.W. Indices for monitoring changes in extremes based on daily temperature and precipitation data. WIREs Clim. Chang. 2011, 2, 851–870. [Google Scholar] [CrossRef]
- Sillmann, J.; Kharin, V.V.; Zhang, X.; Zwiers, F.W.; Bronaugh, D. Climate extremes indices in the CMIP5 multimodel ensemble: Part 1. Model evaluation in the present climate. J. Geophys. Res. Atmos. 2013, 118, 1716–1733. [Google Scholar] [CrossRef]
- Crochemore, L.; Isberg, K.; Pimentel, R.; Pineda, L.; Hasan, A.; Arheimer, B. Lessons learnt from checking the quality of openly accessible river flow data worldwide. Hydrol. Sci. J. 2020, 65, 699–711. [Google Scholar] [CrossRef] [Green Version]
- Clifford, K.R.; Travis, W.R.; Nordgren, L.T. A climate knowledges approach to climate services. Clim. Serv. 2020, 18. [Google Scholar] [CrossRef]
- Visscher, K.; Stegmaier, P.; Damm, A.; Hamaker, T.R.; Harjanne, A.; Giordano, R. Matching supply and demand: A typology of climate services. Clim. Serv. 2020, 17. [Google Scholar] [CrossRef]
- Mauser, W.; Klepper, G.; Rice, M.; Schmalzbauer, B.S.; Hackmann, H.; Leemans, R.; Moore, H. Transdisciplinary global change research: The co-creation of knowledge for sustainability. Curr. Opin. Environ. Sustain. 2013, 5, 420–431. [Google Scholar] [CrossRef] [Green Version]
- Ekström, M.; Grose, M.; Heady, C.; Turner, S.; Teng, J. The method of producing climate change datasets impacts the resulting policy guidance and chance of mal-adaptation. Clim. Serv. 2016, 4, 13–29. [Google Scholar] [CrossRef] [Green Version]
- Donnelly, C.; Ernst, K.; Arheimer, B. A comparison of hydrological climate services at different scales by users and scientists. Clim. Serv. 2018, 11, 24–35. [Google Scholar] [CrossRef]
- Nissan, H.; Goddard, L.; de Perez, E.C.; Furlow, J.; Baethgen, W.; Thomson, M.C.; Mason, S.J. On the use and misuse of climate change projections in international development. WIREs Clim. Change 2019, 10, e579. [Google Scholar] [CrossRef] [Green Version]
- Goldstein, A.; Turner, W.R.; Gladstone, J.; Hole, D.G. The private sector’s climate change risk and adaptation blind spots. Nat. Clim. Chang. 2019, 9, 18–25. [Google Scholar] [CrossRef]
- Meah, N. Climate uncertainty and policy making—what do policy makers want to know? Reg. Environ. Chang. 2019, 19, 1611–1621. [Google Scholar] [CrossRef]
- Vaughan, C.; Buja, L.; Kruczkiewicz, A.; Goddard, L. Identifying research priorities to advance climate services. Clim. Serv. 2016, 4, 65–74. [Google Scholar] [CrossRef] [Green Version]
- Karlsson, S.; Srebotnjak, T.; Gonzales, P. Understanding the North–South knowledge divide and its implications for policy: A quantitative analysis of the generation of scientific knowledge in the environmental sciences. Environ. Sci. Policy 2007, 10, 668–684. [Google Scholar] [CrossRef]
- Gupta, J. The North–South divide. In Research Handbook on Climate Governance; Edward Elgar Publishing: Cheltenham, UK, 2015. [Google Scholar]
- Kelman, I. No change from climate change: Vulnerability and small island developing states. Geogr. J. 2014, 180, 120–129. [Google Scholar] [CrossRef] [Green Version]
- Naess, L.O.; Newell, P.; Newsham, A.; Phillips, J.; Quan, J.; Tanner, T. Climate policy meets national development contexts: Insights from Kenya and Mozambique. Glob. Environ. Chang. 2015, 35, 534–544. [Google Scholar] [CrossRef] [Green Version]
- WMO. Valuing weather and climate: Economic Assessment of Meteorological and Hydrological Services; WMO-N°. 1153; WMO: Geneva, Switzerland, 2015; ISBN 978-92-63-11153-1. [Google Scholar]
- Richards, M. A Review of The Effectiveness Of Developing Country Participation. In The Climate Change Convention Negotiations; Overseas Development Institute: London, UK, 2001; Volume 41. [Google Scholar]
- Biagini, B.; Bierbaum, R.; Stults, M.; Dobardzic, S.; Neeley, S.M. A typology of adaptation actions: A global look at climate adaptation actions financed through the Global Environment Facility. Glob. Environ. Chang. 2014, 25, 97–108. [Google Scholar] [CrossRef] [Green Version]
- Bremer, S.; Wardekker, A.; Dessai, S.; Sobolowski, S.; Slaattelid, R.; Sluijs, J. Toward a multi-faceted conception of co-production of climate services. Clim. Serv. 2019, 13, 42–50. [Google Scholar] [CrossRef]
- Boukalová, Z.; Těšitel, J.; KřIVÁNEK, Z. The contribution of climate services to sustainable wine production in san juan, Argentina. WIT Trans. Ecol. Environ. 2017, 221, 23–32. [Google Scholar] [CrossRef] [Green Version]
- Damm, A.; Köberl, J.; Stegmaier, P.; Jiménez Alonso, E.; Harjanne, A. The market for climate services in the tourism sector – An analysis of Austrian stakeholders’ perceptions. Clim. Serv. 2019. [Google Scholar] [CrossRef]
- Cortekar, J.; Bender, S.; Brune, M.; Groth, M. Why climate change adaptation in cities needs customised and flexible climate services. Clim. Serv. 2016, 4, 42–51. [Google Scholar] [CrossRef] [Green Version]






| Precipitation (mm/d) | Daily Mean Temp. (°C) | Daily Min. Temp. (°C) | Daily Max. Temp. (°C) | N | |||||
|---|---|---|---|---|---|---|---|---|---|
| Uncorr. | Corr. | Uncorr. | Corr. | Uncorr. | Corr. | Uncorr. | Corr. | ||
| AFR-44 | 1.11 | 0.12 | 1.54 | 0.11 | 2.00 | 0.12 | 1.54 | 0.13 | 54 |
| ARC-44 | 0.40 | 0.02 | 2.37 | 0.15 | 2.58 | 0.19 | 2.39 | 0.22 | 11 |
| AUS-44 | 4.00 | 0.07 | 1.39 | 0.04 | 1.33 | 0.04 | 1.57 | 0.04 | 4 |
| CAM-44 | 2.02 | 0.36 | 1.52 | 0.05 | 1.51 | 0.05 | 1.75 | 0.06 | 21 |
| EAS-44 | 4.14 | 0.27 | 1.80 | 0.06 | 1.81 | 0.07 | 2.05 | 0.08 | 10 |
| EUR-44 | 0.56 | 0.20 | 3.44 | 0.19 | 3.88 | 0.24 | 3.41 | 0.22 | 51 |
| MNA-44 | 1.14 | 0.25 | 2.18 | 0.08 | 3.23 | 0.08 | 1.78 | 0.10 | 7 |
| NAM-44 | 0.80 | 0.06 | 2.18 | 0.12 | 2.46 | 0.16 | 2.09 | 0.17 | 9 |
| SAM-44 | 1.59 | 0.10 | 1.52 | 0.05 | 1.87 | 0.05 | 1.57 | 0.06 | 27 |
| WAS-44 | 1.90 | 0.14 | 2.24 | 0.07 | 3.04 | 0.08 | 2.06 | 0.09 | 38 |
| Main Variable Used | Definitions (Mean of Average, Unit) |
|---|---|
| Precipitation | Precipitation (mm/day): Calculated as the mean annual and monthly values of daily precipitation averaged over a 30-year period. |
| Longest dry spells (no. of days): Calculated as the maximum number of consecutive dry days (daily precipitation < 1 mm) over a 30-year period. | |
| Number of dry spells (no. of days): Calculated as the number of dry periods for more than 5 days for a 30 year period. | |
| Mean Temperature | Temperature (°C): Calculated as the mean annual and monthly values of daily mean temperature (at 2 m height) averaged over a 30 year period. |
| Heating degree (°C): Calculated as the annual and monthly sum of 17 °C minus daily mean temperature (at 2 m height) when it is below 17C averaged over a 30-year period. Zero values indicate no heating degree. | |
| Maximum Temperature | Maximum temperature (°C): Calculated as the maximum annual and monthly values of daily maximum temperature (at 2 m height) averaged over a 30-year period. |
| Minimum Temperature | Minimum temperature (°C): Calculated as the minimum annual and monthly values of daily minimum temperature (at 2 m height) averaged over a 30-year period. |
| Frost days (no. of days): Calculated as the number of days per year and month when daily minimum temperature (at 2 m height) is below 0 °C, averaged over a 30-year period. | |
| Tropical nights (no. of days): Calculated as the annual and monthly number of days when daily minimum temperature (at 2 m height) is above 20 °C, averaged over a 30-year period. |
| Main Variable Used | Definitions (Unit) |
|---|---|
| Water runoff | Water runoff (mm): Defined as the local runoff over land areas. Calculated as the annual and monthly water runoff, averaged over a 30 year period. |
| Water discharge | Water discharge (m3/s): Defined as the simulated outflow from a subcatchment. Calculated as the annual and monthly discharge, averaged over a 30 year period. |
| Flow recurrence (m3/s): Calculated as the daily maximum river flows that correspond to return periods of 2, 5, 10, 20, and 50 year, using a Gumbel distribution, for a 30 year period. | |
| Maximum water discharge (m3/s): Calculated as the annual daily maximum discharge averaged over a 30 year period. | |
| Min water discharge (m3/s): Calculated as the annual daily minimum discharge averaged over a 30 year period. | |
| No. of days below annual minimum discharge (no. of days): Calculated as the annual number of days below annual minimum discharge (threshold calculated from reference period) averaged over a 30 year period. | |
| Soil moisture | Soil moisture (-): Defined as the soil moisture in the root zone as fraction of the water content volume and depends on the soil type (land use). Calculated as the annual value, averaged over a 30 year period. The indicator is nondimensional. |
| Aridity | Actual Aridity: Defined as the ratio between actual evapotranspiration and precipitation. Calculated as the annual value, averaged over a 30 year period. The indicator is nondimensional. |
| Potential Aridity: Defined as the ratio between potential evapotranspiration and precipitation. Calculated as the annual value, averaged over a 30 year period. The indicator is nondimensional. | |
| Precipitation | Wetness potential (mm/day): Defined as the difference between precipitation and potential evapotranspiration. Calculated as the monthly mean averaged over a 30 year period. |
| Effective precipitation (mm/day): Defined as the difference between precipitation and actual evapotranspiration. Calculated as the monthly mean averaged over a 30 year period. | |
| Water temperature | Water temperature (°C): Defined as the in-stream water temperature. Calculated as the monthly mean averaged over a 30 year period. |
| Pilot Countries | No. of National Experts | No. of International Experts |
|---|---|---|
| St. Lucia | 41 | 19 |
| Democratic Republic of Congo | 57 | 15 |
| Cabo Verde | 46 | 13 |
| Cambodia | 52 | 28 |
| Total | 196 | 75 |
Publisher’s Note: MDPI stays neutral with regard to jurisdictional claims in published maps and institutional affiliations. |
© 2021 by the authors. Licensee MDPI, Basel, Switzerland. This article is an open access article distributed under the terms and conditions of the Creative Commons Attribution (CC BY) license (http://creativecommons.org/licenses/by/4.0/).
Share and Cite
Photiadou, C.; Arheimer, B.; Bosshard, T.; Capell, R.; Elenius, M.; Gallo, I.; Gyllensvärd, F.; Klehmet, K.; Little, L.; Ribeiro, I.; et al. Designing a Climate Service for Planning Climate Actions in Vulnerable Countries. Atmosphere 2021, 12, 121. https://doi.org/10.3390/atmos12010121
Photiadou C, Arheimer B, Bosshard T, Capell R, Elenius M, Gallo I, Gyllensvärd F, Klehmet K, Little L, Ribeiro I, et al. Designing a Climate Service for Planning Climate Actions in Vulnerable Countries. Atmosphere. 2021; 12(1):121. https://doi.org/10.3390/atmos12010121
Chicago/Turabian StylePhotiadou, Christiana, Berit Arheimer, Thomas Bosshard, René Capell, Maria Elenius, Ilaria Gallo, Frida Gyllensvärd, Katharina Klehmet, Lorna Little, Isabel Ribeiro, and et al. 2021. "Designing a Climate Service for Planning Climate Actions in Vulnerable Countries" Atmosphere 12, no. 1: 121. https://doi.org/10.3390/atmos12010121
APA StylePhotiadou, C., Arheimer, B., Bosshard, T., Capell, R., Elenius, M., Gallo, I., Gyllensvärd, F., Klehmet, K., Little, L., Ribeiro, I., Santos, L., & Sjökvist, E. (2021). Designing a Climate Service for Planning Climate Actions in Vulnerable Countries. Atmosphere, 12(1), 121. https://doi.org/10.3390/atmos12010121


