Article

Oxygen Isotopes in Tree Rings from Greenland: A New Proxy of NAO

1
Key Laboratory of Cenozoic Geology and Environment, Institute of Geology and Geophysics, Chinese Academy of Sciences, Beijing 100029, China
2
CAS Center for Excellence in Life and Paleoenvironment, Beijing 100044, China
3
Tree Ring Laboratory, Lamont-Doherty Earth Observatory, Columbia University, Palisades, New York, NY 10964, USA
4
Department of Plants, Soils, and Climate, Utah State University, Logan, UT 84322, USA
5
Graduate School of Environment Studies, Nagoya University, Nagoya 464-8601, Japan
*
Author to whom correspondence should be addressed.
Atmosphere 2021, 12(1), 39; https://doi.org/10.3390/atmos12010039
Submission received: 17 November 2020 / Revised: 24 December 2020 / Accepted: 24 December 2020 / Published: 30 December 2020
(This article belongs to the Special Issue Climate and the Oxygen Isotope Patterns from Trees)

Abstract

:
We present the first Greenlandic tree ring oxygen isotope record (δ18OGTR), derived from four birch trees collected from the Qinguadalen Valley in southwestern Greenland in 1999. Our δ18O record spans from 1950–1999 and is significantly and positively correlated with winter ice core δ18O from southern Greenland. δ18OGTR records are positively correlated with southwestern Greenland January–August mean temperatures. North Atlantic Oscillation (NAO) reconstructions have been developed from a variety of proxies, but never with Greenlandic tree rings, and our δ18OGTR record is significantly correlated with NAO (r = −0.64), and spatial correlations with sea-level pressure indicate a classic NAO pressure seesaw pattern. These results may facilitate a longer NAO reconstruction based on long time series of tree ring δ18O records from Greenland, provided that subfossil wood can be found in areas vacated by melting glaciers.

1. Introduction

Tree rings are one of the most important proxies for paleoclimate studies, due to their high temporal resolution and accurate dating [1,2]. Based on the tree ring oxygen isotope fractionation model [3], the stable oxygen isotope (δ18O) in tree rings is controlled by the δ18O/oxygen isotope (signature) of precipitation and relative humidity, both of which are influenced by climate. Therefore, we have used tree ring δ18O for climate reconstruction [4,5]. Compared to tree ring width (TRW), tree ring δ18O sometimes exhibits stronger correlations with climate than ring width [6,7]. Tree ring δ18O does not usually exhibit a strong, age-related trend [8,9,10], and could retain more climatic low frequency variability that might be related to climate [6]. Precipitation δ18O is affected by large-scale atmospheric circulation [11], and thus tree ring δ18O can reveal a significant link with atmospheric circulation, such as synoptic weather type, ENSO, Arctic Oscillation and Antarctic Oscillation [12,13,14,15,16]. Therefore, tree ring δ18O can not only be used for traditional climate variable reconstruction, but may also be exploited for reconstruction of large-scale atmospheric circulation [13,16].
The North Atlantic Oscillation (NAO) is a major feature of the atmospheric circulation over the northern hemisphere with widespread impacts on climate across Europe, Greenland, northern North America, North Africa and Asia, and is characterized as the dipole of sea-level pressure (SLP) between the Azores and Iceland [17,18,19,20]. Because of the importance of the NAO, and the limitations that result from temporally limited instrumental data, many NAO index reconstruction studies have been conducted during the last 20 years. These studies utilize the earliest instrumental data, historical documentation, ice cores, tree rings and speleothems from across Europe, Northern America and northern Africa to investigate NAO variability and its responses to external forcing [21,22,23,24,25,26,27]. However, a detailed review of the published NAO reconstructions showed a lack of agreement between them, particularly on decadal to multi-decadal time scales [27]. Thus, it is necessary to explore a novel, high resolution proxy for the reconstruction of NAO, to improve the quantification of the response of NAO variability to both natural and anthropogenic climate forcings.
Despite the NAO’s primary signature around Greenland, Greenlandic tree rings have not been used for NAO reconstructions in previous studies [26,27] (Figure 1a), since limited tree ring research has been conducted in Greenland. Beschel and Webb (1963) demonstrated that Salix glauca and Juniperus communis from western Greenland formed annual rings [28], but did not develop a regional time series for comparison with climate. Kuivenen and Lawson (1982) collected cores of Betula pubescens (birch) from the Qinguadalen Valley of southern Greenland that they successfully cross-dated and correlated with regional temperature [29]. It is these trees that we resampled in 1999 and use in the current study. Precipitation δ18O in Greenland is correlated with temperature, which is related to NAO [30]. We assume that tree ring δ18O preserves the precipitation δ18O signal and can be used for NAO reconstruction. In the present study, we aim to produce a new tree ring δ18O record from Greenland and to examine the possibility of reconstructing NAO using tree ring δ18O.

2. Materials and Methods

In the summer of 1999, co-author Buckley collected birch samples (Betula pubescens) from the Qinguadalen Valley of southwestern Greenland (Figure 1), in order to update the Kuivenen and Lawson (1982) collection. He cross-dated and measured ring width from 28 core samples and developed a tree ring width record that spanned from 1884–1999 (unpublished). In this study, four trees from this collection (Sample ID: QUN24, 25, 30 and 45) were used for oxygen isotope analysis. In order to obtain enough wood material to extract purified cellulose, we selected discernable and relatively wide rings for the establishment of tree ring δ18O series. The final timespan of the tree ring oxygen series for each tree is 1950–1999, 1950–1999, 1950–1998 and 1950–1988, respectively. The common period of the individual tree ring oxygen series from the four trees is 1950–1972. The modified plate method [31] was employed to extract α-cellulose. We first used a low-speed diamond wheel saw to cut the cores into 1-mm-thick plates, along surfaces perpendicular to the cellulose fiber directions. Then we packed the plate by two Teflon punch sheets and put it into a glass tube for chemical reactions. Next, we followed the Jayme and Wise method to conduct the chemical protocol in order to extract α-cellulose from the tree rings [32,33]. The glass tube with the plate was treated with an acidified NaClO2 solution in a water bath (70 °C) for 60 min to remove lignin, and this step had to be repeated several times until the color of the plate turned white. To remove hemicellulose, a 17 wt% NaOH solution was poured into the glass tube in a water bath (80 °C) for 60 min, and this was repeated three times. After that, the wood plate was gently washed with a diluted HCl solution and distilled water. The wood plate was then treated with toluene and ethanol (1:1) at room temperature for 10 min, then with acetone overnight to remove lipids. Finally, the cellulose plate was dried in an oven for three hours and the rings were cut from each cellulose plate with a scalpel under a binocular microscope at annual resolution.
The α-cellulose samples (80–260 μg) were wrapped into silver foil, and tree ring cellulose oxygen isotope values were measured using an isotope ratio mass spectrometer (Delta V Advantage, Thermo Electron Corporation, Bremen, Germany) interfaced with an elemental analyzer (TC/EA) at the Research Institute for Humanity and Nature, Japan. There are several gaps for the tree ring δ18O data due to narrow rings from which we could not collect enough cellulose for measurement (Figure 2). Cellulose δ18O values were calculated by comparison with analysis of Merck cellulose (laboratory working standard) which has been calibrated with IAEA-C3. Merck cellulose was inserted after every eight tree samples during the measurements. Oxygen isotope results are presented in δ notation as the per mil (‰) deviation from Vienna Standard Mean Ocean Water (VSMOW), δ18O = [(Rsample/Rstandard) − 1] × 1000, where Rsample and Rstandard are the 18O/16O ratios of the sample and standard, respectively. The analytical uncertainties on repeated measurements of the Merck cellulose were approximately ±0.2‰ (n = 32).
The relationship among δ18O from different trees was quantified using Pearson’s correlation coefficient (r). The expressed population signal (EPS) is used to measure the internal coherence of a tree ring chronology. Generally, it is widely considered that EPS values exceeding 0.85 indicate that the composite record represents the mean variance of the population and yields a signal relatively free of noise because of individual variations [34]. We also calculated the average correlation (Rbar) to analyze the synchrony of variations of tree ring δ18O. It is the average correlation of individual correlation coefficients among inter-tree δ18O. In addition, to evaluate the relationships between climate variables and tree ring δ18O, we calculated Pearson’s correlation coefficients r between tree ring δ18O values and monthly resolved instrumental temperature. Student’s t-test was used to evaluate the significance of the correlation coefficients. To test the spatial coherence between the tree ring δ18O and local to regional climatic variations, we computed spatial Pearson’s correlation coefficient between tree ring δ18O and the CRU TS 4.02 gridded temperature, and sea-level pressure (SLP) from the NCEP Reanalysis data (https://www.esrl.noaa.gov/psd/) and the Standardized Precipitation Evapotranspiration Index (SPEI) [35] using the KNMI climate explorer software (Royal Netherlands Meteorological Institute; http://climexp.knmi.nl). Furthermore, a monthly NAO index from the Climate Prediction center of NOAA [36] was employed to evaluate the relationship between tree ring δ18O and NAO.

3. Results and Discussion

3.1. Inter-Tree δ18O Variability and Regional δ18O Chronology

The Greenland Tree Ring oxygen isotope time series (δ18OGTR) derived from four birch trees is shown in Figure 2, while the underlying data can be found in the Supplementary Materials. δ18O values in all trees fall within the same range, with values from 22.7–28.4‰ and an average of 25.3‰ (±1.08‰). The δ18O mean of QUN 24, 25, 30 and 45 during the common period of 1950–1972 is 25.61‰ (±1.12‰), 25.83‰ (±1.11‰), 25.22% (±0.99‰) and 25.50‰ (±1.07‰), respectively. We also calculated the standard deviation of δ18O in the four trees for each year, which exhibited a range of 0.1–1.3‰, smaller than previous studies (1‰–4‰) [37]. Inter-tree δ18O correlations are very high (EPS > 0.85) and the average correlation among inter-tree δ18O (Rbar) is 0.9 (Table 1, Figure 2). By way of comparison, Dinis et al. (2019) reported Rbar of 0.59 for δ18O from Labrador black spruce [15], while Naulier et al. (2014) reported an Rbar of 0.5 for black spruce δ18O from northeastern Québec [38].
Because δ18O shows consistent between-tree variations, we developed a regional δ18O chronology (δ18OGTR) by averaging the four δ18O time series (QUN 24, 25, 30 and 45). The first-order autocorrelation for δ18OGTR is low (0.01), which indicates the tree ring δ18O of the current year is little affected by the tree ring δ18O in previous year(s).

3.2. Comparison between Tree Ring δ18O and Ice Core δ18O

Tree ring δ18O is controlled by precipitation δ18O and relative humidity [3], while ice core δ18O is derived from precipitation δ18O [39]. Figure 3 shows a comparison of δ18OGTRwith winter/summer ice core δ18O in Greenland [40] during the common period (for DYE-3 = 1950–1978; for Crete = 1950–1973; and for GRIP = 1950–1979). The spatial correlation between δ18OGTR and ice core δ18O is inversely correlated with distance, for summer and winter (Supplementary Materials Figure S1), suggesting a strong locality in Greenland’s climate that shows different regimes between the southwestern coastline and inner, high-elevation regions.
It should be noted that δ18OGTR showed higher correlations with ice core δ18O in winter rather than summer, even though trees mostly grow in summer. For example, the correlation between tree ring and summer/winter DYE-3 δ18O is 0.27 and 0.45, respectively. There are two possible reasons: first, the trees in Greenland could have absorbed more winter precipitation or snow/ice than summer precipitation. Some studies have suggested that winter snowmelt comprises a large portion of the source water for trees [41], such that previous winter snow/ice that melts at the beginning of the growth season is taken up by the trees in summer. This could explain the significant correlation between tree ring δ18O and winter ice core δ18O. Second, summer precipitation δ18O used by trees in the growing season is modified by transpiration [3], which weakens both the signature of summer precipitation δ18O imprinted in trees, and the correlations between tree ring and summer ice core δ18O.
Previous studies reported that tree ring δ18O reflects prior winter precipitation and temperature, rather than summer [4,42]. For example, tree ring δ18O from the southeastern Tibetan Plateau showed variations similar to those in annual ice core δ18O in the southeastern Tibetan Plateau (Dr. Weiling An, personal communications). The significant correlation between tree ring δ18O and ice core δ18O provides the opportunity to obtain a robust climate reconstruction. Because cross-dating for the trees at our site is robust and has an annual resolution, comparing ice core and tree ring δ18O should be helpful for accurate cross-dating. Furthermore, high-resolution seasonal tree ring δ18O with distinctive winter and summer signals may improve ice core dating and provide more detailed climate information. For now, however, our tree ring records extend only into the late 19th century, so older living trees and subfossil trees emerging from sediment and melting ice could be targeted for in future.

3.3. Climatic Implications of Tree Ring δ18O

Previous studies in northeast Canada have shown that tree ring δ18O has positive correlations with summer temperature and negative correlations with summer rainfall [15,38,43]. Therefore, we conducted correlation analyses between δ18OGTR and temperature at Nuuk and Qaqortoq for the period 1950–1999 (Figure 4). We show a positive correlation with current January–August temperature (r = 0.57 for Nuuk and r = 0.58 for Qaqortaq; n = 55; p < 0.001), which indicates that the main climate signal influencing tree ring δ18O originates from the January–August temperature. Spatial correlations between tree ring δ18O and temperature also support their relationship (Figure 5a). The significant correlation between δ18OGTR and temperature can be explained by the positive relationship between precipitation δ18O and temperature, which is used widely for ice-core-based temperature reconstruction [21,44]. Before being absorbed by trees growing in summer, isotopic fractionation processes associated with precipitation formation before and during the growing season depend directly on temperature variations. The higher temperatures will result in more δ18O enrichment in the precipitation and soil water, and thus in trees.
Relative humidity is another controlling factor for tree ring δ18O during the growth season [3]. Local relative humidity data are not available, so we used the summertime Standardized Precipitation Evapotranspiration Index (SPEI) to evaluate evapotranspiration influences on tree ring δ18O. We found a negative correlation between SPEI and δ18OGTR (Figure 5b), indicating that a higher SPEI is associated with relatively wet conditions and reduced evapotranspiration. Such conditions would result in depletion of leaf water and soil water δ18O, and subsequently lower cellulose δ18O. Positive correlations between tree ring δ18O with temperature and negative correlations with moisture were also reported in northeast Canada [38,43]. The correlations between tree ring δ18O and temperature are higher than with SPEI (Figure 5), which reveal that precipitation δ18O rather than relative humidity has the dominant influence over tree ring δ18O at our study site in southwestern Greenland.

3.4. Relationship with NAO

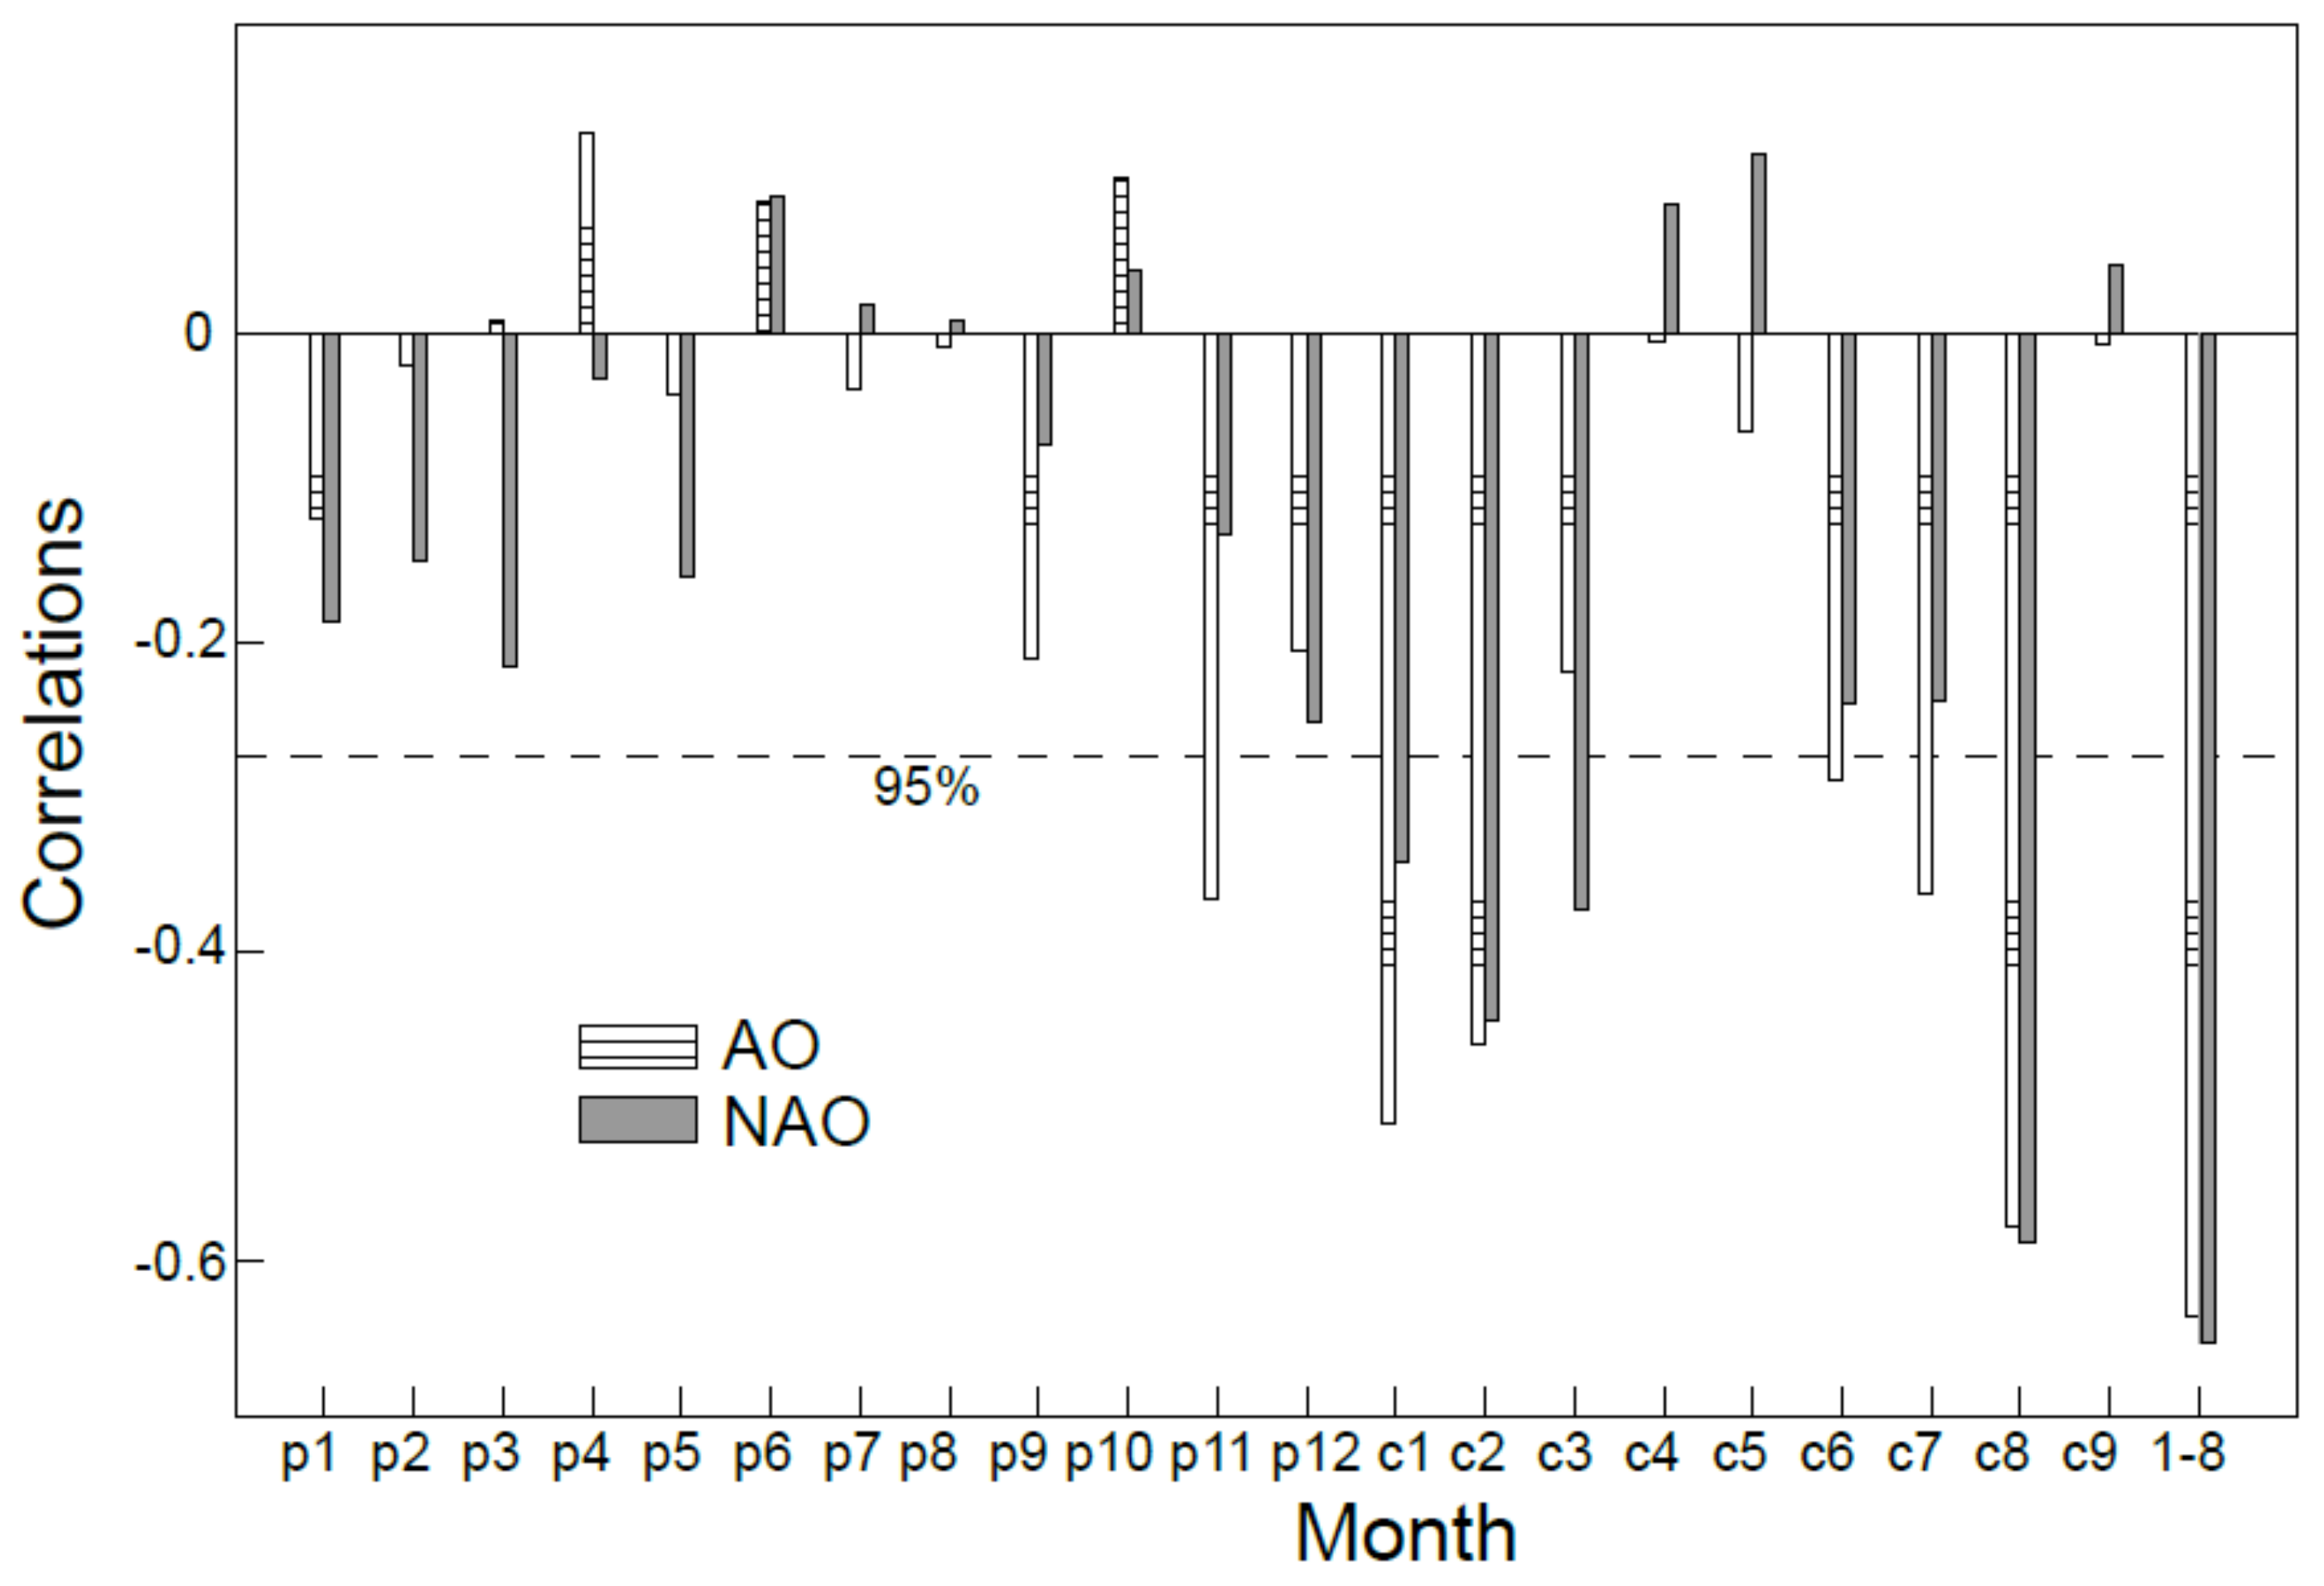
As shown in Figure 6, we find significant negative correlations between tree ring δ18O and AO/NAO, which are strongest for the January–August NAO index (r = −0.64, p < 0.001, n = 50). A similarly strong correlation (r = −0.64, p < 0.001, n = 50) is also found with the Arctic Oscillation index (AO). Interestingly, the relationship between NAO and Greenland ice core δ18O is relatively weak (Figure S2). To evaluate the relationship between NAO and tree ring δ18O further, we plot our results from spatial correlation analyses between δ18OGTR and sea-level pressure (SLP) during the different months in Figure 7. We show that δ18OGTR is positively correlated with SLP in the high-latitude area centered in Greenland and negatively correlated with SLP in the mid-latitude Atlantic, both in winter (Figure 7a) and summer (Figure 7b). This pattern reflects the classic NAO pattern [18]. By conducting the same correlation analysis with SST, δ18OGTR showed strong correlations with SST anomalies around the southern coastlines of Greenland (Figure 7d–f). This localized SST response with tree ring δ18O, with the absence of any broader or tropical signal, suggests that tree ring δ18O mainly reflects atmospheric variability which is related to NAO. Tree ring δ18O is mainly controlled by precipitation δ18O, which is in turn controlled by temperature of the air mass during precipitation and the isotopic fractionation processes that follow (for either rain or snow). Therefore, a positive phase of NAO brings lower temperatures to Greenland and depleted precipitation δ18O, which is in turn reflected in lower tree ring δ18O.
We next compared δ18OGTR with previous NAO reconstructions during the common period of 1950–1999, revealing negative correlations with a couple of NAO reconstructions: one based on historical documents across Europe [23] (r = −0.47, p < 0.01) and the other based on tree rings from eastern North America, Morocco, Europe and ice cores in Greenland [24] (r = −0.51, p < 0.01). These significant correlations between independent proxies indicate that δ18OGTR is as effective a proxy of NAO as other proxy variables and can explain around 41% of the actual variance of NAO, which is comparable to Cook et al. (2002) [24]. It is noted that our δ18OGTR record is derived from only four trees, while the Cook et al. (2002) NAO reconstruction is based on 367 records [24]. Therefore, we believe we have demonstrated the strong climate signal preserved in tree ring δ18O from Greenland, which could provide an opportunity for climate reconstruction with limited samples. However, a much larger data set with a longer time span is highly desirable. Future efforts are needed to look for older and subfossil trees, in order to use tree ring δ18O data from Greenland as a proxy of NAO. As a matter of fact, many long tree ring δ18O chronologies have been successfully established by combining living trees with subfossil trees preserved in lake sediments [43,45] and then cross-dating these stems to determine the ages of subfossil trees [46]. There are many lakes in Greenland [47,48], so a long-term tree ring δ18O record from living trees and subfossil trees could be established in future.

4. Conclusions

We present here the first tree ring δ18O chronology from Greenland, based on four birches that span the period of 1950–1999. These four tree ring δ18O time series are highly coherent and the resultant record (δ18OGTR) is significantly correlated with winter ice core δ18O in southern Greenland. We demonstrate that tree ring δ18O has a significant correlation with temperature and NAO during the early half of the year, and is therefore a promising proxy for reconstructing NAO over Greenland.

Supplementary Materials

The following are available online at https://www.mdpi.com/2073-4433/12/1/39/s1, Figure S1: The variations of correlations between tree ring oxygen isotopes with summer (a) and winter (b) ice core oxygen isotope with that of distances between tree ring sampling site and ice core sites presented in Figure 3, Figure S2: Correlations between tree ring oxygen isotope with NAO/AO during the period of 1950–1970. Numbers in x-axis represent the months of the year, and numbers with a “p” and “c” prefix indicate the previous year and current year, respectively. Table S1: The time span of ice cores presented in Figure 3.

Author Contributions

Conceptualization, C.X. and B.M.B.; methodology, C.X.; W.A.; Z.L.; T.N.; formal analysis, C.X.; S.-Y.S.W.; B.M.B.; Z.G.; writing—original draft preparation, C.X; writing—review and editing, C.X.; S.-Y.S.W.; B.M.B.; W.A.; Z.L.; T.N.; Z.G. All authors have read and agreed to the published version of the manuscript.

Funding

This study was funded by the National Natural Science Foundation of China, Grant Number: 41,888,101,42,022,059,41,630,529, 41,672,179, 41,690,114; the Chinese Academy of Sciences (CAS) Pioneer Hundred Talents Program, the National Key R&D Program of China, Grant Number: 2017YFE0112800; the Strategic Priority Research Program of the Chinese Academy of Sciences, Grant Number: XDB26020000 and XDA13010106. The collection of the QUN core samples was funded by the Lamont Climate Center. Lamont Contribution Number 8464. Simon Wang is supported by NSF P2C2 award number—1903721.

Institutional Review Board Statement

Not applicable.

Informed Consent Statement

Not applicable.

Data Availability Statement

The data presented in this study can be accessed from WDC for Geophysics, Beijing (http://wdc.geophys.ac.cn, DOI:10.12197/2020GA022).

Conflicts of Interest

The authors declare no conflict of interest.

References

  1. Fritts, H.C. Tree Rings and Climate; Academic: London, UK, 1976. [Google Scholar]
  2. Cook, E.R.; Anchukaitis, K.J.; Buckley, B.M.; D’Arrigo, R.D.; Jacoby, G.C.; Wright, W.E. Asian Monsoon Failure and Megadrought During the Last Millennium. Science 2010, 328, 486–489. [Google Scholar] [CrossRef] [PubMed] [Green Version]
  3. Roden, J.S.; Lin, G.; Ehleringer, J.R. A mechanistic model for interpretation of hydrogen and oxygen isotope ratios in tree-ring cellulose. Geochim. Cosmochim. Acta 2000, 64, 21–35. [Google Scholar] [CrossRef]
  4. Treydte, K.; Schleser, G.H.; Helle, G.; Frank, D.C.; Winiger, M.; Haug, G.H.; Esper, J. The twentieth century was the wettest period in northern Pakistan over the past millennium. Nat. Cell Biol. 2006, 440, 1179–1182. [Google Scholar] [CrossRef] [PubMed]
  5. Xu, C.; An, W.; Wang, S.-Y.S.; Yi, L.; Ge, J.; Nakatsuka, T.; Sano, M.; Guo, Z. Increased drought events in southwest China revealed by tree ring oxygen isotopes and potential role of Indian Ocean Dipole. Sci. Total Environ. 2019, 661, 645–653. [Google Scholar] [CrossRef] [PubMed]
  6. Gagen, M.; McCarroll, D.; Loader, N.J.; Robertson, I. Stable Isotopes in Dendroclimatology: Moving Beyond ‘Potential’. Dendroclimatology 2011, 11, 147–172. [Google Scholar]
  7. Xu, C.; Sano, M.; Nakatsuka, T. Tree ring cellulose δ18O of Fokienia hodginsii in northern Laos: A promising proxy to re-construct ENSO? J. Geophys. Res. 2011, 116, D24109. [Google Scholar]
  8. Young, G.H.F.; Demmler, J.C.; Gunnarson, B.E.; Kirchhefer, A.J.; Loader, N.J.; McCarroll, D. Age trends in tree ring growth and isotopic archives: A case study of Pinus sylvestris L. from northwestern Norway. Global Biogeochem. Cycles 2011, 25, GB2020. [Google Scholar] [CrossRef]
  9. Sano, M.; Tshering, P.; Komori, J.; Fujita, K.; Xu, C.; Nakatsuka, T. May-September precipitation in the Bhutan Himalaya since 1743 as reconstructed from tree ring cellulose δ18O. J. Geophys. Res. Atmos. 2013, 118, 8399–8410. [Google Scholar] [CrossRef]
  10. Xu, C.; Ge, J.; Nakatsuka, T.; Yi, L.; Zheng, H.; Sano, M. Potential utility of tree ring δ 18 O series for reconstructing precipitation records from the lower reaches of the Yangtze River, southeast China. J. Geophys. Res. Atmos. 2016, 121, 3954–3968. [Google Scholar] [CrossRef]
  11. Ichiyanagi, K.; Yamanaka, M.D. Interannual variation of stable isotopes in precipitation at Bangkok in response to El Niño–Southern Oscillation. Hydrol. Process. 2005, 19, 3413–3423. [Google Scholar] [CrossRef]
  12. Saurer, M.; Kress, A.; Leuenberger, M.; Rinne, K.T.; Treydte, K.S.; Siegwolf, R.T.W. Influence of atmospheric circulation patterns on the oxygen isotope ratio of tree rings in the Alpine region. J. Geophys. Res. Space Phys. 2012, 117, 05118. [Google Scholar] [CrossRef] [Green Version]
  13. Xu, C.; Sano, M.; Nakatsuka, T. A 400-year record of hydroclimate variability and local ENSO history in northern Southeast Asia inferred from tree-ring δ18O. Palaeogeogr. Palaeoclim. Palaeoecol. 2013, 386, 588–598. [Google Scholar] [CrossRef]
  14. Xu, C.; Sano, M.; Dimri, A.P.; Ramesh, R.; Nakatsuka, T.; Shi, F.; Guo, Z. Decreasing Indian summer monsoon on the northern Indian sub-continent during the last 180 years: Evidence from five tree-ring cellulose oxygen isotope chronologies. Clim. Past 2018, 14, 653–654. [Google Scholar] [CrossRef] [Green Version]
  15. Dinis, L.; Bégin, C.; Savard, M.M.; Marion, J.; Brigode, P.; Alvarez, C. Tree-ring stable isotopes for regional discharge recon-struction in eastern Labrador and teleconnection with the Arctic Oscillation. Clim. Dynam. 2019, 53, 3625–3640. [Google Scholar] [CrossRef]
  16. Meier, W.J.-H.; Aravena, J.-C.; Jaña, R.; Braun, M.H.; Hochreuther, P.; Soto-Rogel, P.; Grießinger, J. A tree-ring δ18O series from southernmost Fuego-Patagonia is recording flavors of the Antarctic Oscillation. Glob. Planet. Chang. 2020, 195, 103302. [Google Scholar] [CrossRef]
  17. Hurrell, J.W. Decadal Trends in the North Atlantic Oscillation: Regional Temperatures and Precipitation. Science 1995, 269, 676–679. [Google Scholar] [CrossRef] [Green Version]
  18. Hurrell, J.W.; Kushnir, Y.; Ottersen, G.; Visbeck, M. An overview of the North Atlantic Oscillation. Geophys. Monogr. Am. Geophys. Union 2003, 134, 1–36. [Google Scholar]
  19. Casado, M.; Ortega, P.; Masson-Delmotte, V.; Risi, C.; Swingedouw, D.; Daux, V.; Genty, D.; Maignan, F.; Solomina, O.; Vinther, B.M.; et al. Impact of precipitation intermittency on NAO-temperature signals in proxy records. Clim. Past 2013, 9, 871–886. [Google Scholar] [CrossRef] [Green Version]
  20. Goswami, B.N.; Madhusoodanan, M.S.; Neema, C.P.; Sengupta, D. A physical mechanism for North Atlantic SST influence on the Indian summer monsoon. Geophys. Res. Lett. 2006, 33, 024803. [Google Scholar] [CrossRef] [Green Version]
  21. Jones, P.D.; Jonsson, T.; Wheeler, D. Extension to the North Atlantic oscillation using early instrumental pressure observations from Gibraltar and south-west Iceland. Int. J. Climatol. 1997, 17, 1433–1450. [Google Scholar] [CrossRef]
  22. Appenzeller, C.; Stocker, T.F.; Anklin, M. North Atlantic Oscillation Dynamics Recorded in Greenland Ice Cores. Science 1998, 282, 446–449. [Google Scholar] [CrossRef] [PubMed]
  23. Luterbacher, J.; Xoplaki, E.; Dietrich, D.; Jones, P.D.; Davies, T.D.; Portis, D.; Gonzalez-Rouco, J.F.; Storch, H.V.; Gyalistras, D.; Casty, C. Extending North Atlantic Oscillation reconstructions back to 1500. Atmos. Sci. Lett. 2001, 2, 114–124. [Google Scholar] [CrossRef]
  24. Cook, E.R.; D’Arrigo, R.; Mann, M.E. A well-verified, multiproxy reconstruction of the winter North Atlantic Oscillation index since A.D. 1400. J. Clim. 2002, 15, 1754–1764. [Google Scholar]
  25. Trouet, V.; Esper, J.; Graham, N.E.; Baker, A.; Scourse, J.D.; Frank, D.C. Persistent Positive North Atlantic Oscillation Mode Dominated the Medieval Climate Anomaly. Science 2009, 324, 78–80. [Google Scholar] [CrossRef] [Green Version]
  26. Ortega, P.; Lehner, F.; Swingedouw, D.; Masson-Delmotte, V.; Raible, C.C.; Casado, M.; Yiou, P. A model-tested North Atlantic Oscillation reconstruction for the past millennium. Nat. Cell Biol. 2015, 523, 71–74. [Google Scholar] [CrossRef]
  27. Cook, E.R.; Kushnir, Y.; Smerdon, J.E.; Williams, A.P.; Anchukaitis, K.J.; Wahl, E.R. A Euro-Mediterranean tree-ring recon-struction of the winter NAO index since 910 CE. Clim. Dynam. 2019, 53, 1567–1580. [Google Scholar] [CrossRef]
  28. Beschel, R.E.; Webb, D. Growth ring studies on arctic willow. In Axel Heiberg Island: Preliminary Report; McGill University: Montreal, QC, Canada, 1962; pp. 189–198. [Google Scholar]
  29. Kuivinen, K.C.; Lawson, M.P. Dendroclimatic Analysis of Birch in South Greenland. Arct. Alp. Res. 1982, 14, 243–250. [Google Scholar]
  30. Vinther, B.M.; Johnsen, S.J.; Andersen, K.K.; Clausen, H.; Hansen, A.W. NAO signal recorded in the stable isotopes of Greenland ice cores. Geophys. Res. Lett. 2003, 30, 40–41. [Google Scholar] [CrossRef] [Green Version]
  31. Xu, C.; Zheng, H.; Nakatsuka, T.; Sano, M. Oxygen isotope signatures preserved in tree ring cellulose as a proxy for April-September precipitation in Fujian, the subtropical region of southeast China. J. Geophys. Res. Atmos. 2013, 118, 12805. [Google Scholar] [CrossRef]
  32. Green, J. Wood cellulose. In Method in Carbohydrate Chemistry; Whistler, R.L., Ed.; Academic: San Diego, CA, USA, 1963; pp. 9–21. [Google Scholar]
  33. Loader, N.; Robertson, I.; Barker, A.; Switsur, V.; Waterhouse, J. An improved technique for the batch processing of small wholewood samples to a-cellulose. Chem. Geol. 1997, 136, 313–317. [Google Scholar] [CrossRef]
  34. Wigley, T.; Briffa, K.; Jones, P. On the average of correlated time series, with applications in dendroclimatology and hydro-meteorology. J. Clim. Appl. Meteorol. 1984, 23, 201–213. [Google Scholar] [CrossRef]
  35. Vicente-Serrano, S.M.; Beguería, S.; López-Moreno, J.I.; Angulo, M.; El Kenawy, A. A New Global 0.5° Gridded Dataset (1901–2006) of a Multiscalar Drought Index: Comparison with Current Drought Index Datasets Based on the Palmer Drought Severity Index. J. Hydrometeorol. 2010, 11, 1033–1043. [Google Scholar] [CrossRef] [Green Version]
  36. Barnston, A.G.; Livezey, R.E. Classification, Seasonality and Persistence of Low-Frequency Atmospheric Circulation Patterns. Mon. Weather. Rev. 1987, 115, 1083–1126. [Google Scholar] [CrossRef]
  37. Leavitt, S. Tree-ring C-H-O isotope variability and sampling. Sci. Total Environ. 2010, 408, 5244–5253. [Google Scholar] [CrossRef]
  38. Naulier, M.; Savard, M.; Bégin, C.; Marion, J.; Arseneault, D.; Bégin, Y. Carbon and oxygen isotopes of lakeshore black spruce trees in northeastern Canada as proxies for climatic reconstruction. Chem. Geol. 2014, 37–43. [Google Scholar] [CrossRef]
  39. Johnsen, S.J.; Dahljensen, D.; Dansgaard, W.; Gundestrup, N. Greenland palaeotemperatures derived from GRIP bore hole temperature and ice core isotope profiles. Tellus B 1995, 47, 624–629. [Google Scholar] [CrossRef] [Green Version]
  40. Vinther, B.M.; Jones, P.D.; Briffa, K.R.; Clausen, H.; Andersen, K.K.; Dahl-Jensen, D.; Johnsen, S. Climatic signals in multiple highly resolved stable isotope records from Greenland. Quat. Sci. Rev. 2010, 29, 522–538. [Google Scholar] [CrossRef]
  41. West, A.G.; Hultine, K.R.; Burtch, K.G.; Ehleringer, J.R. Seasonal variations in moisture use in a piñon–juniper woodland. Oecologia 2007, 153, 787–798. [Google Scholar] [CrossRef]
  42. Voelker, S.L.; Wang, S.-Y.S.; Dawson, T.E.; Roden, J.S.; Still, C.J.; Longstaffe, F.J.; Ayalon, A. Tree-ring isotopes adjacent to Lake Superior reveal cold winter anomalies for the Great Lakes region of North America. Sci. Rep. 2019, 9, 4412. [Google Scholar] [CrossRef] [Green Version]
  43. Naulier, M.; Savard, M.M.; Bégin, C.; Gennaretti, F.; Arseneault, D.; Marion, J.; Nicault, A.; Bégin, Y. A millennial summer temperature reconstruction for northeastern Canada using oxygen isotopes in subfossil trees. Clim. Past 2015, 11, 1153–1164. [Google Scholar] [CrossRef] [Green Version]
  44. Jouzel, J.; Alley, R.B.; Cuffey, K.M.; Dansgaard, W.; Grootes, P.; Hoffmann, G.; Johnsen, S.J.; Koster, R.D.; Peel, D.; Shuman, C.A.; et al. Validity of the temperature reconstruction from water isotopes in ice cores. J. Geophys. Res. Space Phys. 1997, 102, 26471–26487. [Google Scholar] [CrossRef]
  45. Savard, M.M.; Bégin, C.; Marion, J.; Arseneault, D.; Bégin, Y. Evaluating the integrity of C and O isotopes in sub-fossilwood from boreal lakes. Palaeogeogr. Palaeoecol. 2012, 348–349, 21–31. [Google Scholar] [CrossRef]
  46. Arseneault, D.; Dy, B.; Gennaretti, F.; Autin, J.; Bégin, Y. Developing millennial tree ring chronologies in the fire-prone North American boreal forest. J. Quat. Sci. 2013, 28, 283–292. [Google Scholar] [CrossRef]
  47. Bennike, O.; Björck, S. Lake sediment coring in South Greenland in 1999. Geol. Surv. Den. Greenl. Bull. 2000, 186, 60–64. [Google Scholar] [CrossRef]
  48. Cremer, H.; Bennike, O.; Wagner, B. Lake sediment evidence for the last deglaciation of eastern Greenland. Quat. Sci. Rev. 2008, 27, 312–319. [Google Scholar] [CrossRef]
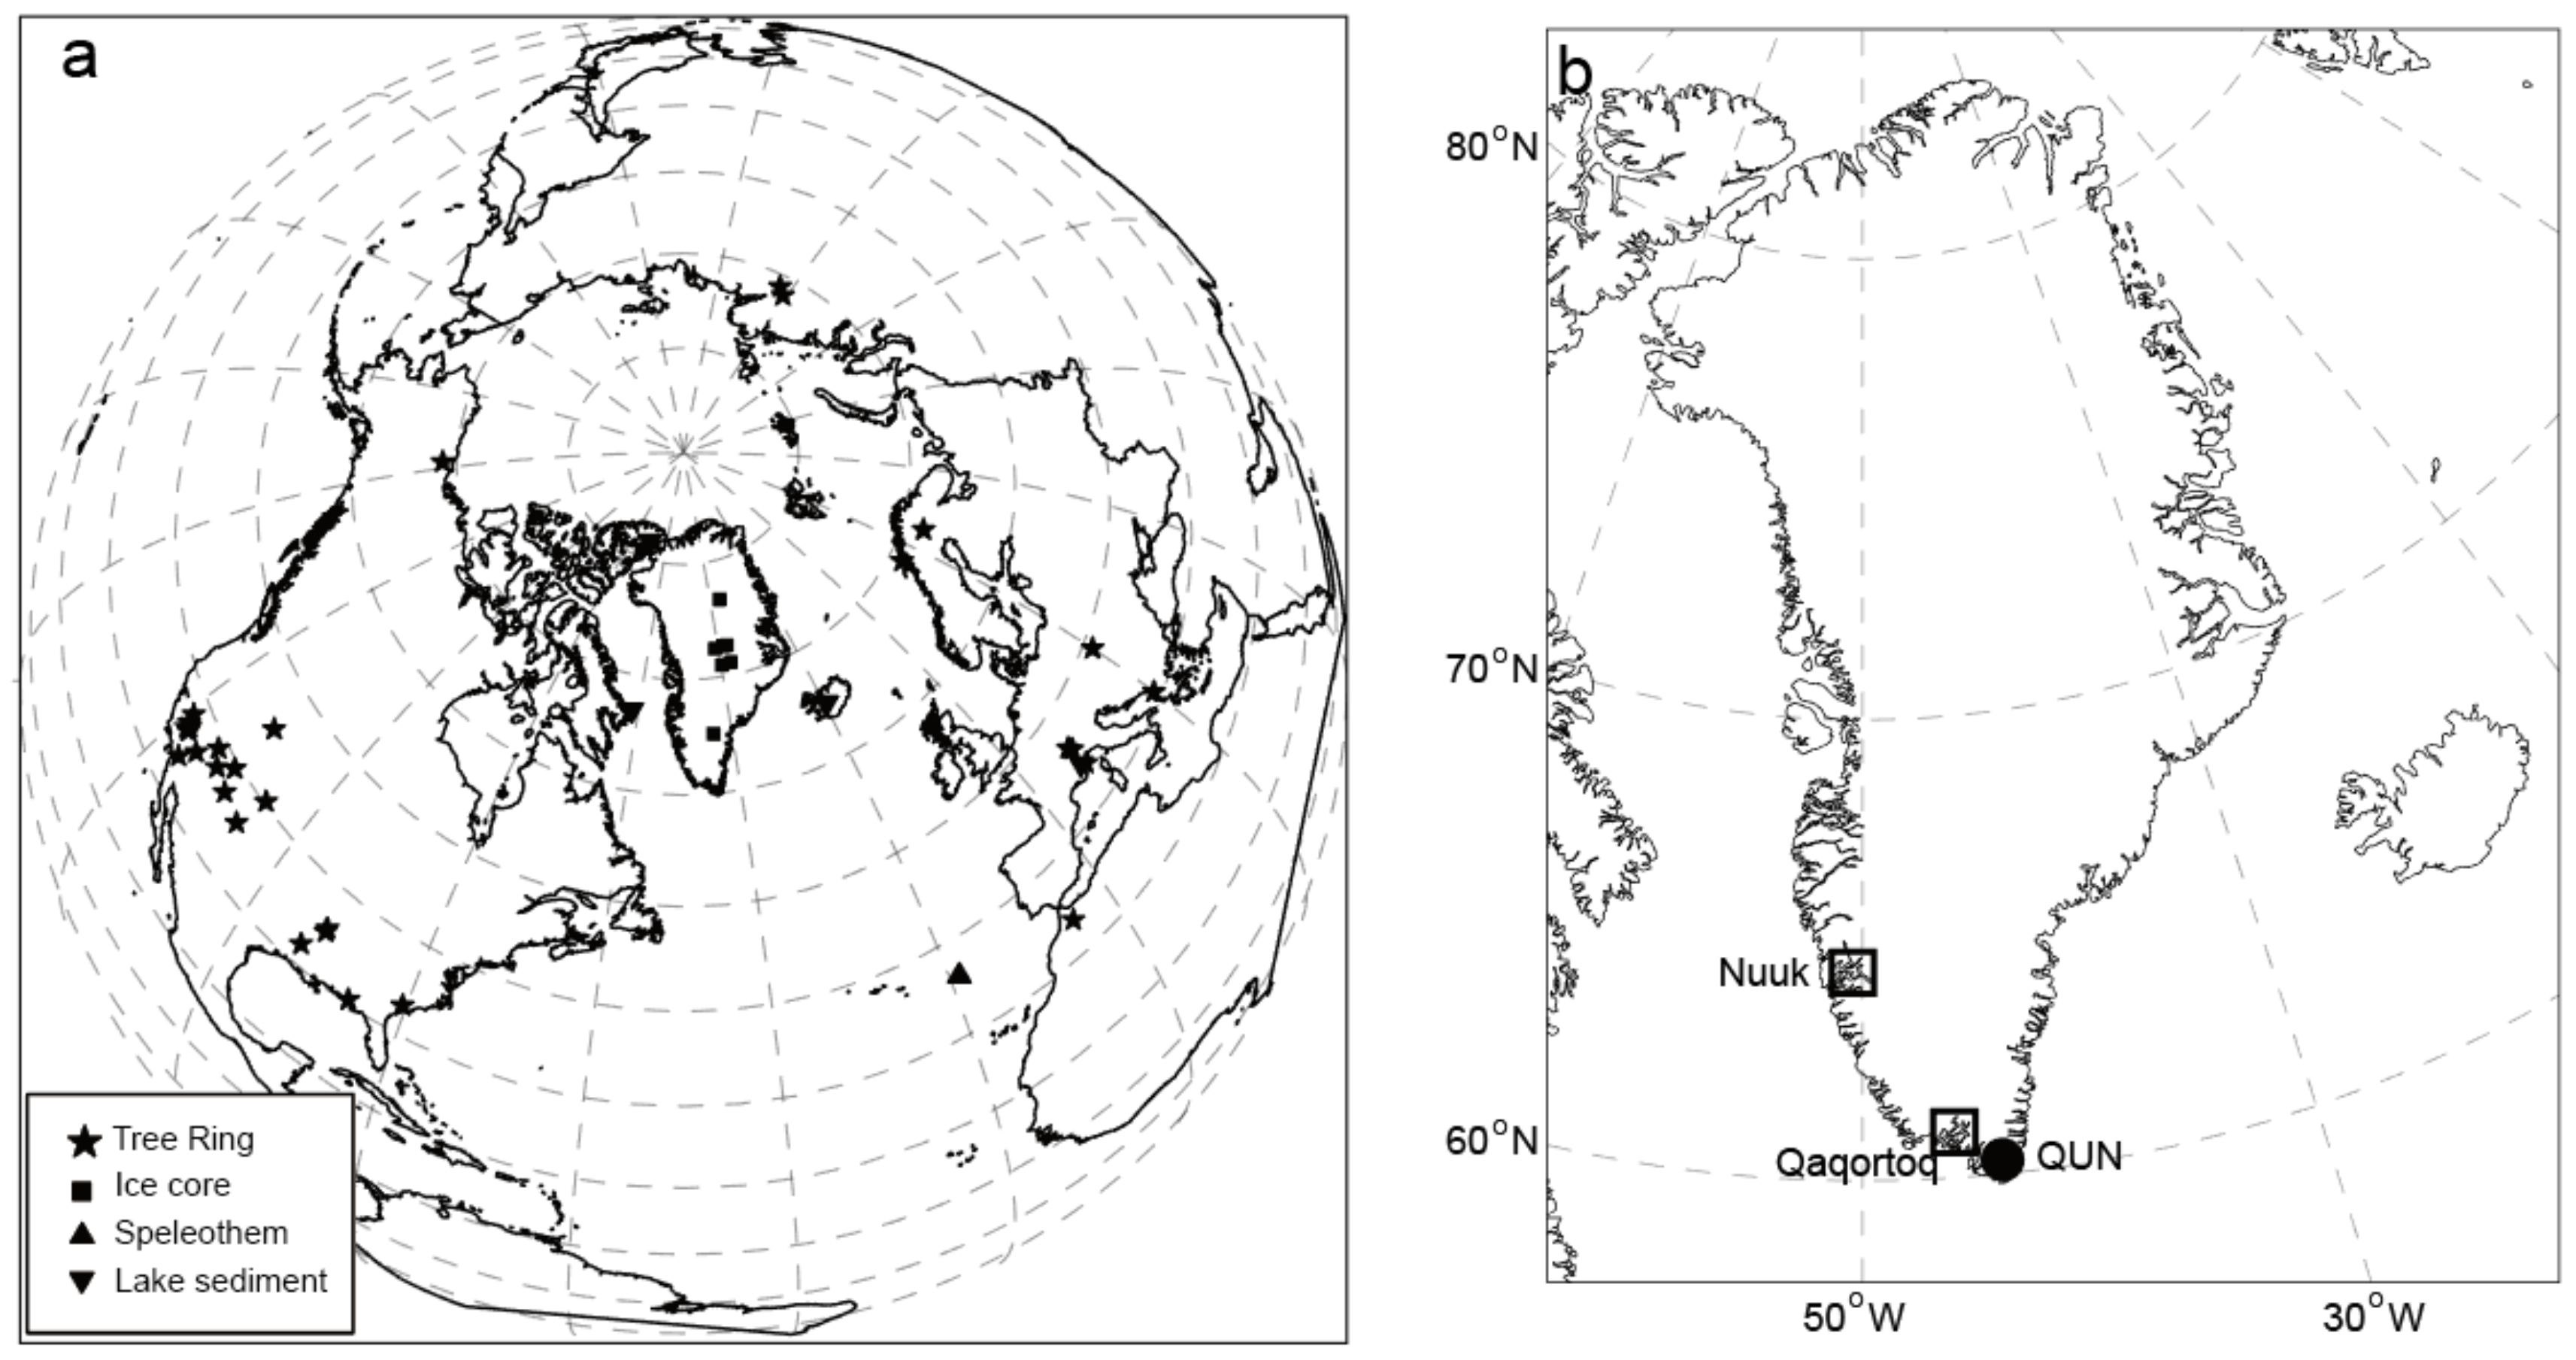
Figure 1. (a) Location of the ice cores, lake sediments, speleothems and tree rings that were used for NAO (North Atlantic Oscillation) reconstructions (modified from [26]). (b) Location of sampling site for the presented tree ring oxygen isotope (spot) and Nuuk and Qaqortoq meteorological stations (square).
Atmosphere 12 00039 g001
Figure 2. Tree ring oxygen isotope time series from four birch during the period of 1950–1999.
Atmosphere 12 00039 g002
Figure 3. Spatial correlations between tree ring δ18O with summer (a) and winter (b) ice core δ18O. The time spans of the ice core records are presented in Table S1.
Atmosphere 12 00039 g003
Figure 4. Correlations between tree ring δ18O with monthly temperature at Nuuk and Qaqortoq station during the period of 1950–1999. Numbers in x-axis represent the months of the year, and numbers with a “p” and “c” prefix indicate the previous year and current year, respectively. The dashed line indicates the 95% confidence level threshold.
Atmosphere 12 00039 g004
Figure 5. Spatial correlations between tree ring δ18O with January–August air temperature (a) and June-August SPEI (b) for the period of 1950–1999. Correlations not significant at the 95% level have been masked out.
Atmosphere 12 00039 g005
Figure 6. Correlations between tree ring oxygen isotope with NAO/AO during the period of 19501999. Numbers in the x-axis represent the months of the year, and numbers with a “p” and “c” prefix indicate the previous year and current year, respectively.
Atmosphere 12 00039 g006
Figure 7. Spatial correlations between tree ring oxygen isotope with sea-level pressure (ac) and sea surface temperature (df) during the period of 1950–1999. Correlations not significant at the 95% level have been masked out.
Atmosphere 12 00039 g007
Table 1. Correlation coefficients among tree ring oxygen isotopes.
CorrelationQUN24QUN25QUN30
QUN250.94 *
QUN300.85 *0.91 *
QUN450.94 *0.91 *0.86 *
* indicates p < 0.01.
Publisher’s Note: MDPI stays neutral with regard to jurisdictional claims in published maps and institutional affiliations.