Abstract
North African dust intrusions can contribute to exceedances of the European PM10 and PM2.5 limit values and World Health Organisation standards, diminishing air quality, and increased mortality and morbidity at higher concentrations. In this study, the contribution of North African dust in Mediterranean countries was estimated using the time series clustering method. This method combines the non-parametric approach of Hidden Markov Models for studying time series, and the definition of different air pollution profiles (regimes of concentration). Using this approach, PM10 and PM2.5 time series obtained at background monitoring stations from seven countries were analysed from 2015 to 2018. The average characteristic contributions to PM10 were estimated as 11.6 ± 10.3 µg·m−3 (Bosnia and Herzegovina), 8.8 ± 7.5 µg·m−3 (Spain), 7.0 ± 6.2 µg·m−3 (France), 8.1 ± 5.9 µg·m−3 (Croatia), 7.5 ± 5.5 µg·m−3 (Italy), 8.1 ± 7.0 µg·m−3 (Portugal), and 17.0 ± 9.8 µg·m−3 (Turkey). For PM2.5, estimated contributions were 4.1 ± 3.5 µg·m−3 (Spain), 6.0 ± 4.8 µg·m−3 (France), 9.1 ± 6.4 µg·m−3 (Croatia), 5.2 ± 3.8 µg·m−3 (Italy), 6.0 ± 4.4 µg·m−3 (Portugal), and 9.0 ± 5.6 µg·m−3 (Turkey). The observed PM2.5/PM10 ratios were between 0.36 and 0.69, and their seasonal variation was characterised, presenting higher values in colder months. Principal component analysis enabled the association of background sites based on their estimated PM10 and PM2.5 pollution profiles.
1. Introduction
Air pollution is a mixture of particles and gases, which can reach unsafe concentrations for human health, the environment, and vegetation. It has become one of the main sustainability issues and a concerning topic in atmospheric science. According to the World Health Organisation (WHO), 90% of the world population lives in highly polluted environments, and about 7 million deaths are caused every year by outdoor and indoor air pollution [1].
Particulate matter (PM) is one of the most concerning air pollutants in Europe [2,3]. It comprises suspended particles in the air with variable composition and size, which results from several anthropogenic activities. The main sources are industrial facilities, power plants, traffic emissions, wood stove combustion, dust, and forest fires. PM can be divided into two main components [4,5]: (i) primary PM emitted directly by pollution sources; and (ii) secondary PM that is produced in the atmosphere by chemical reactions with primary gaseous pollutants (e.g., organic compounds, sulphur dioxide, and nitrogen oxides). PM is usually classified according to its size, with fine particles being designated as PM2.5 (PM with an aerodynamic diameter <2.5 µm). The group of fine (with an aerodynamic diameter less than 2.5 µm) and coarse (with an aerodynamic diameter between 2.5 and 10 µm) particles is designated as PM10. The monitoring of PM concentrations according to their sizes is relevant due to the corresponding impact, in particular on human health [6]. Concerning the respiratory system, the upper respiratory tract is affected by PM10, while fine particles have the capacity to deeply penetrate in the human respiratory system until lung alveoli (therefore, more hazardous to human health than the coarser particles) [7]. Besides human health, PM is associated with environmental concerns (e.g., visibility impairment—haze) and the damage of ecosystems [8,9]. The impact depends on size, surface, number, and composition of particles, of which characteristics are mainly affected by anthropogenic and natural sources, meteorology (that influences their dispersion, transport, and deposition), and urbanisation level.
The monitoring and the understanding of the temporal and spatial behaviours of PM concentrations are essential for the implementation of air quality policies and the definition of effective measures to mitigate PM presence and its effects. Besides the study of PM2.5 and PM10, the ratio between their concentrations (PM2.5/PM10) may give relevant information about PM sources and effects [10,11,12,13]. High values indicate an increased contribution of anthropogenic sources, while low values are associated with natural sources due to a high fraction of coarse particles. In Europe, the Directive 2008/50/EC defines the limits for the concentrations of several air pollutants, including PM (daily limit of 50 µg·m−3 not to be exceeded more than 35 times per year for PM10, and the annual limit value of 20 µg·m−3 for PM2.5). However, the limit values for PM concentrations in Mediterranean countries are not easily fulfilled. The main reason is the strong influence of dust transport from the Sahara Desert (North Africa). The contribution of this natural source should be known for each country in order for the European legislation to be fairly applied. The directive allows the subtraction of daily limit value exceedances of PM10 concentrations (50 µg/m3) when these episodes are attributed to natural events (articles 2.15 and 20.1). There are several statistical techniques that were applied to quantify the contribution of this natural source. Gómez-Losada et al. [14] applied the Hidden Markov Model (HMM) to estimate PM10 contributions using the data of 33 background sites in Spain and Portugal. The model results were then compared with the method widely accepted to estimate the daily African PM10 load: the 40th percentile (P40) method introduced by Escudero et al. [15]. The HMM model presented a better estimation of the Sahara dust contribution in the monitored values of PM10 concentrations. Stafoggia et al. [16] distinguished PM10 from desert and non-desert sources in 13 Southern European cities for 2001–2010. They combined modelling tools, back-trajectories, and satellite data to identify desert dust advection days. In 15% of the days, PM10 concentrations were influenced by desert dust, with most episodes occurred in spring–summer. Gama et al. [17] estimated the contribution of desert dust to the PM10 and PM2.5 concentrations in background sites in Portugal during 2016. Two different approaches were applied: the 40th percentile (P40) method and the WRF-CHIMERE model (multi-scale chemistry-transport model). The P40 method identified higher African dust contributions than the modelling approach. The PM10 contributions in most of the regions were between 0 and 90 µg·m−3, while for PM2.5 this natural source was responsible for 0 to 30 µg·m−3.
This study aims to estimate the particulate matter contributions from desert outbreaks. Specific objectives are: (i) to characterise PM pollution behaviour in different Mediterranean counties, (ii) to estimate the different PM10 and PM2.5 pollution profiles from Southern Europe remote monitoring stations, and once they are obtained, (iii) estimate these air pollutant contributions from desert dust outbreaks.
2. Data and Methods
2.1. Data
PM10 and PM2.5 validated hourly time series (TS) from background stations of southern regions of Europe were obtained from the European Environment Agency data repository (DiscoMap, https://discomap.eea.europa.eu) for the 2015 to 2018 period. Only TS with time coverage higher than 80% (7008 hourly observations per annual TS) were considered in this study and independently analysed for each year. The number of analysed TS from background sites fulfilling this data quality criterion is indicated in Table 1, together with their distribution by countries and years. A relation of the studied PM10 and PM2.5 background monitoring sites is provided as Supplementary Material (SM) in two comma-separated value files. In these files, the typology, main pollution source, and the geographical coordinates of monitoring stations are given in EPSG 4979 projection. The length of the analysed TS from each station by year is also provided.

Table 1.
Country distribution of PM10 and PM2.5 time series from background stations analysed in this study.
For the years 2015, 2016, 2017, and 2018, a total of 61, 70, 73, and 86 PM10 TS were studied, respectively; with respect to PM2.5, 35, 33, 23, and 44 TS, respectively, were studied for those years. All of these PM10 and PM2.5 TS were obtained from background monitoring stations. Table 2 and Table 3 show summary statistics for dust desert days based on the exceedance of PM10 and PM2.5 daily average concentrations of 150 and 43 µg·m−3, respectively. These values were selected as threshold values due to the maximum levels of these pollutant concentrations in Southern Europe during dust outbreaks [18,19]. They correspond to a lower bound of ranges typically found in this region.

Table 2.
Average concentration by country for PM10 time series during desert and non-desert days in background monitoring sites (in µg·m−3). n, number of days with exceedance of 150 µg·m−3 PM10 daily average. BA- Bosnia and Herzegovina; ES—Spain; FR—France; HR—Croatia; IT—Italy; PT—Portugal; TR—Turkey.

Table 3.
Average concentration by country for PM2.5 time series as in Table 1. n, number of days with exceedance of 43 µg·m−3 PM2.5 daily average. ES—Spain; FR—France; HR—Croatia; IT—Italy; PT—Portugal.
2.2. Time Series Clustering
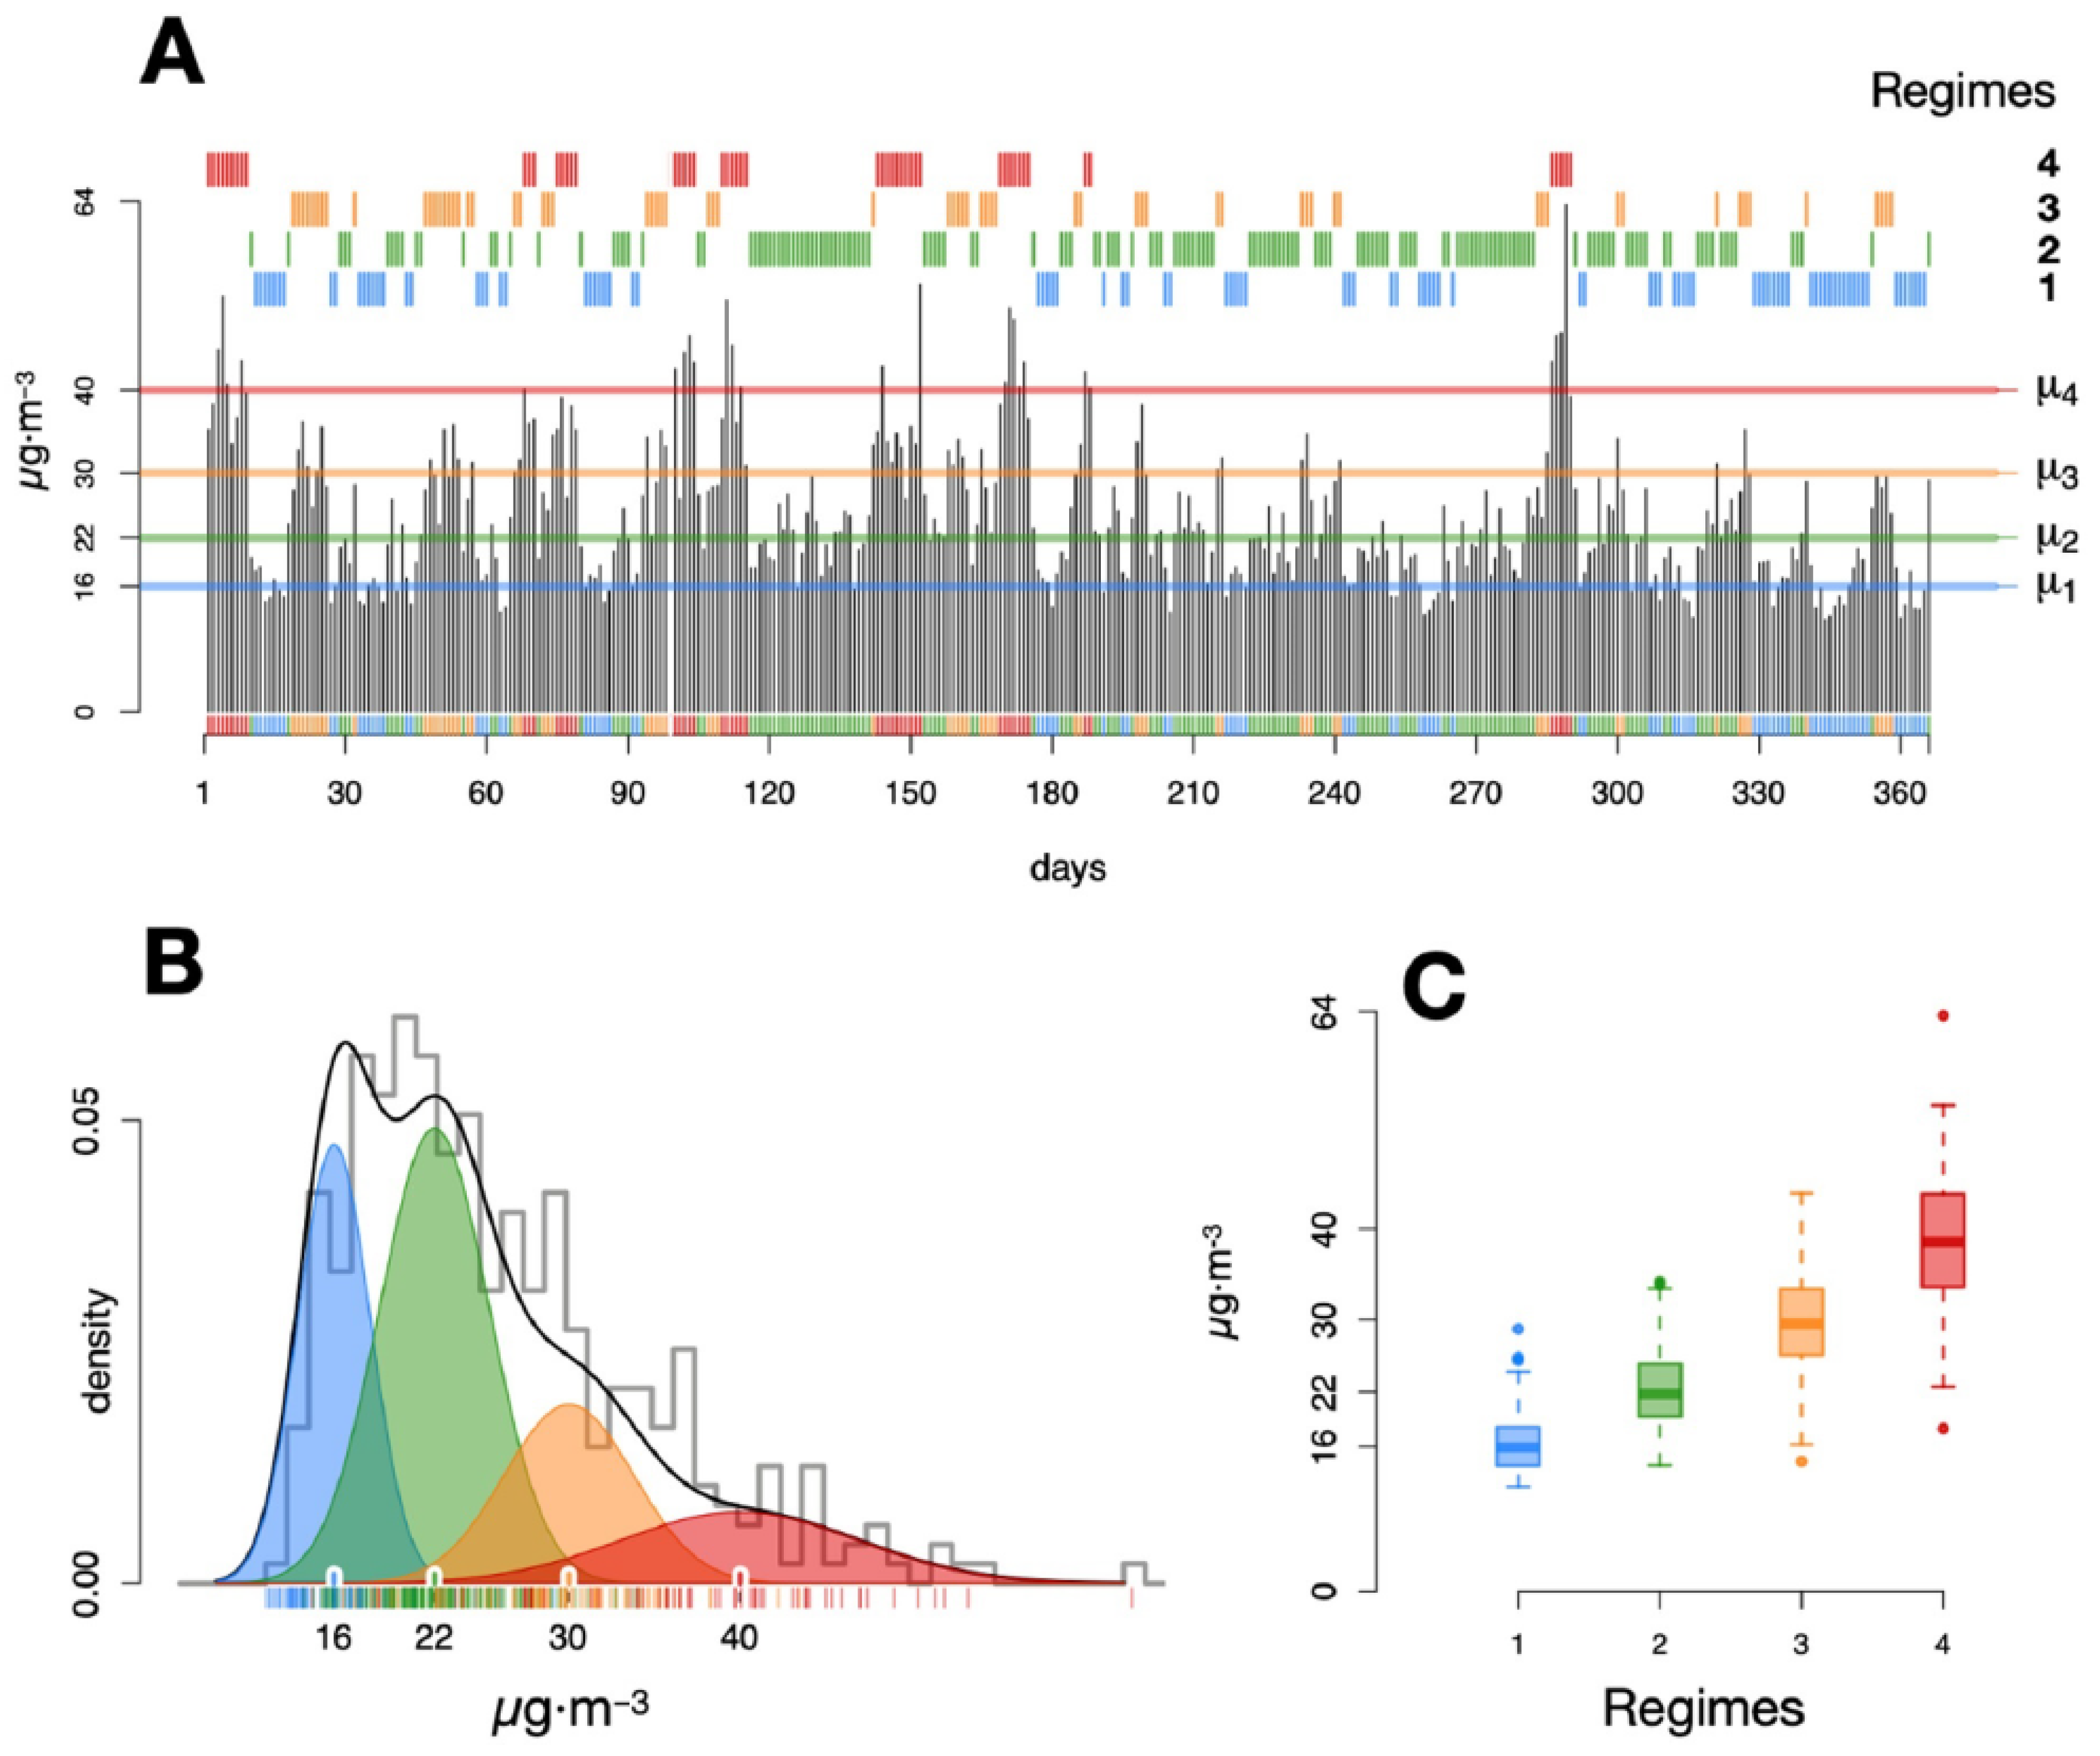
In this study, HMM were used to detect clusters in PM10 and PM2.5 TS data. It represents a model-based strategy for clustering by assuming that each cluster of data is described by a different probability distribution (components of the mixture). This methodology is explained in Gómez-Losada et al. [14,20] and illustrated graphically in Figure 1. A complete definition and elements of HMM are provided in SM1. HMM represents a flexible method of modelling TS that exhibits dependence over time as those obtained in air quality monitoring networks. The model estimation lies in finding the parameter of the HMM that is most likely to have generated a given TS. This is referred to as the maximum likelihood estimation problem, which in this study was solved using the Expectation-Maximisation algorithm [21,22]. The computational implementation of HMM in this study was accomplished using the depmixS4 package [23] from open-source software R [24]. The basic script of this implementation is provided in SM2.
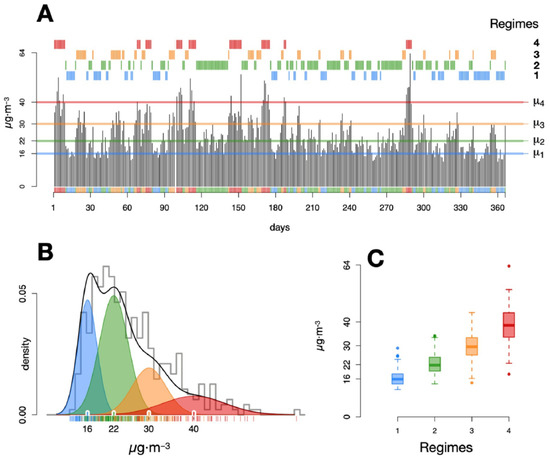
Figure 1.
Time series (TS) clustering method showing the four pollution profiles (regimes) detected in the PM10 TS from the ES1517 Spanish station (2017). First to fourth pollution regimes are represented in blue, green, orange, and red, respectively. (A) TS observations (grey). Below TS, each observation is associated with a cluster. Separately, this grouping is represented above the TS. Horizontal lines represent the average values of each cluster (µ1, µ2, µ3, µ4). (B) The estimated density of the mixture of distributions (black line) is superimposed onto the histogram of TS data (grey line). Components of the mixture are represented for each cluster (coloured shadows). (C) Distribution of values of each TS pollution profile is represented as box-whisker plots.
For many practical applications, there is often some physical significance attached to the hidden states of the HMM. For instance, in economics, states of the HMM can be related to expansion and recession periods and the interest is in studying the dynamics between them [25]; in developmental psychology, the states of the HMM are used to quantify knowledge that subjects express in an implicit learning task [26]. In this work, clusters of TS data are assigned to represented different PM concentration ranges (regimes of concentration or pollution profiles) in each modelled annual TS. HMM provides, inter alia, the mean and standard deviation values for each regime. These values represent the different parameterisation of the Gaussian distributions assigned to the regimes, providing very useful information as they fully characterise every analysed TS for a given time period and monitoring site. Each cluster’s average values were represented as µi (i = 1,…, n) with n the number of detected clusters in the TS data (Figure 1A).
2.3. Time Series Clustering
Once the pollution profiles in the TS data are determined, a meaning for each profile must be then assigned to estimate the PM10 and PM2.5 contributions from desert outbreaks. The following definitions are provided for the average values of each profile [14], applied to the remote stations studied in this work and considering as an example, the PM10 TS from Figure 1:
- µ1 (16 µg·m−3) represents the underlying or threshold (background) concentration over which great changes in value are not expected over the years if atmospheric and pollution conditions remain relatively constant, being a characteristic of the studied area. Daily average PM10 concentrations assigned to this regime are supposedly not caused by any direct influence of natural or anthropogenic sources, or if they are, they are negligible.
- µ2 (22 µg·m−3) is the average PM10 concentration on the days affected by moderate contributions of anthropogenic sources due to activities that take place in the region. The value of µ2 is subject to slightly more variation than µ1 between years. The referenced days may be affected by contributions from natural sources attributable to African dust transport episodes that have a minor impact on the observed PM10 concentrations.
- µ3 (30 µg·m−3) is the average PM10 concentration on days affected by characteristic, usual contributions from African outbreaks. These contributions are highly variable in concentration and are the main factor responsible for the exceedances of the 50 µg·m−3 limit value established by the Directive 2008/50/EC on ambient air quality and cleaner air for Europe (Directive, 2008) for this pollutant.
- µ4 (40 µg·m−3) is the average PM10 concentration on days with unusual but severe episodes of natural contributions from North African episodes.
Some useful quantities can be then roughly estimated using these definitions, namely:
- µ2–µ1 (6 µg·m−3): average concentration due to anthropogenic contributions from the region.
- µ3–µ2 (8 µg·m−3): average concentration associated with characteristic contributions from dry regions from North Africa when they occur.
- µ4–µ2 (18 µg·m−3): average concentration from severe contributions from dry regions from North Africa when they occur.
It must be noted that the above definitions coincide from a conceptual point of view with those of horizontal profiles given by Lenschow et al. [27] when studying the PM10 regimes of concentrations in the Berlin area. These definitions have to be adapted then to the geographical location under study and adapted to each monitoring network. Given the transnational scope of this study and it being unfeasible to characterise every PM regime for each station and country, these definitions were adopted and used generically. Furthermore, it must also be considered that contributions from other sources of PM such as those from wildfires or other anthropogenic sources of pollution could also be represented in the aforementioned defined pollution profiles. In this study, the above definitions are extended to the PM2.5 case.
As with other available modelling techniques deriving information about pollution sources and the amount they contribute to ambient air pollution levels (e.g., chemical mass balance and positive matrix factorisation models), the time series clustering method is also subject to intrinsic limitations. Among them are that it provides estimates together with its uncertainties only based on the observed concentrations of pollutants (in this study, PM10 and PM2.5). To overcome this setback, definitions given to each of the pollution regimes were incorporated into this method when created (Gómez-Losada et al., 2015) to provide a reasonable physical explanation to these regimes. However, even though these definitions work well in general, it can ignore some local or regional peculiarities from areas where emission sources originate. In this study, this limitation was partially overcome by selecting only background monitoring stations from the studied countries when analysing the contributions from North African arid regions. Another understandable disadvantage of the time series clustering method is that it does not take into consideration the origin or location of the emission sources, as air mass trajectory or wind-based models can do. For that reason, only countries bordering the Mediterranean Sea were selected for this study (Portugal was included due to being strongly influenced by Saharan dust) due to their proximity to the North African regions. Having exposed all of the above, it is also convenient to remember their advantages. As a modelling based on a statistical clustering technique, it does not require from expensive and time-consuming chemical assays, modelling outputs are comprehensive and easily interpreted, its computational implementation requires limited competence and low resources, and can be deployed using open-source software (R or Python programming languages). Moreover, scripts for the computational implementation have been provided by the authors on several occasions in other studies, and again, are available here upon request. Furthermore, the time clustering method can be used to complement other source apportionment methods, validate their modelling outputs, or simply used as an exploratory technique for deriving information from pollution sources.
2.4. Principal Component Analysis
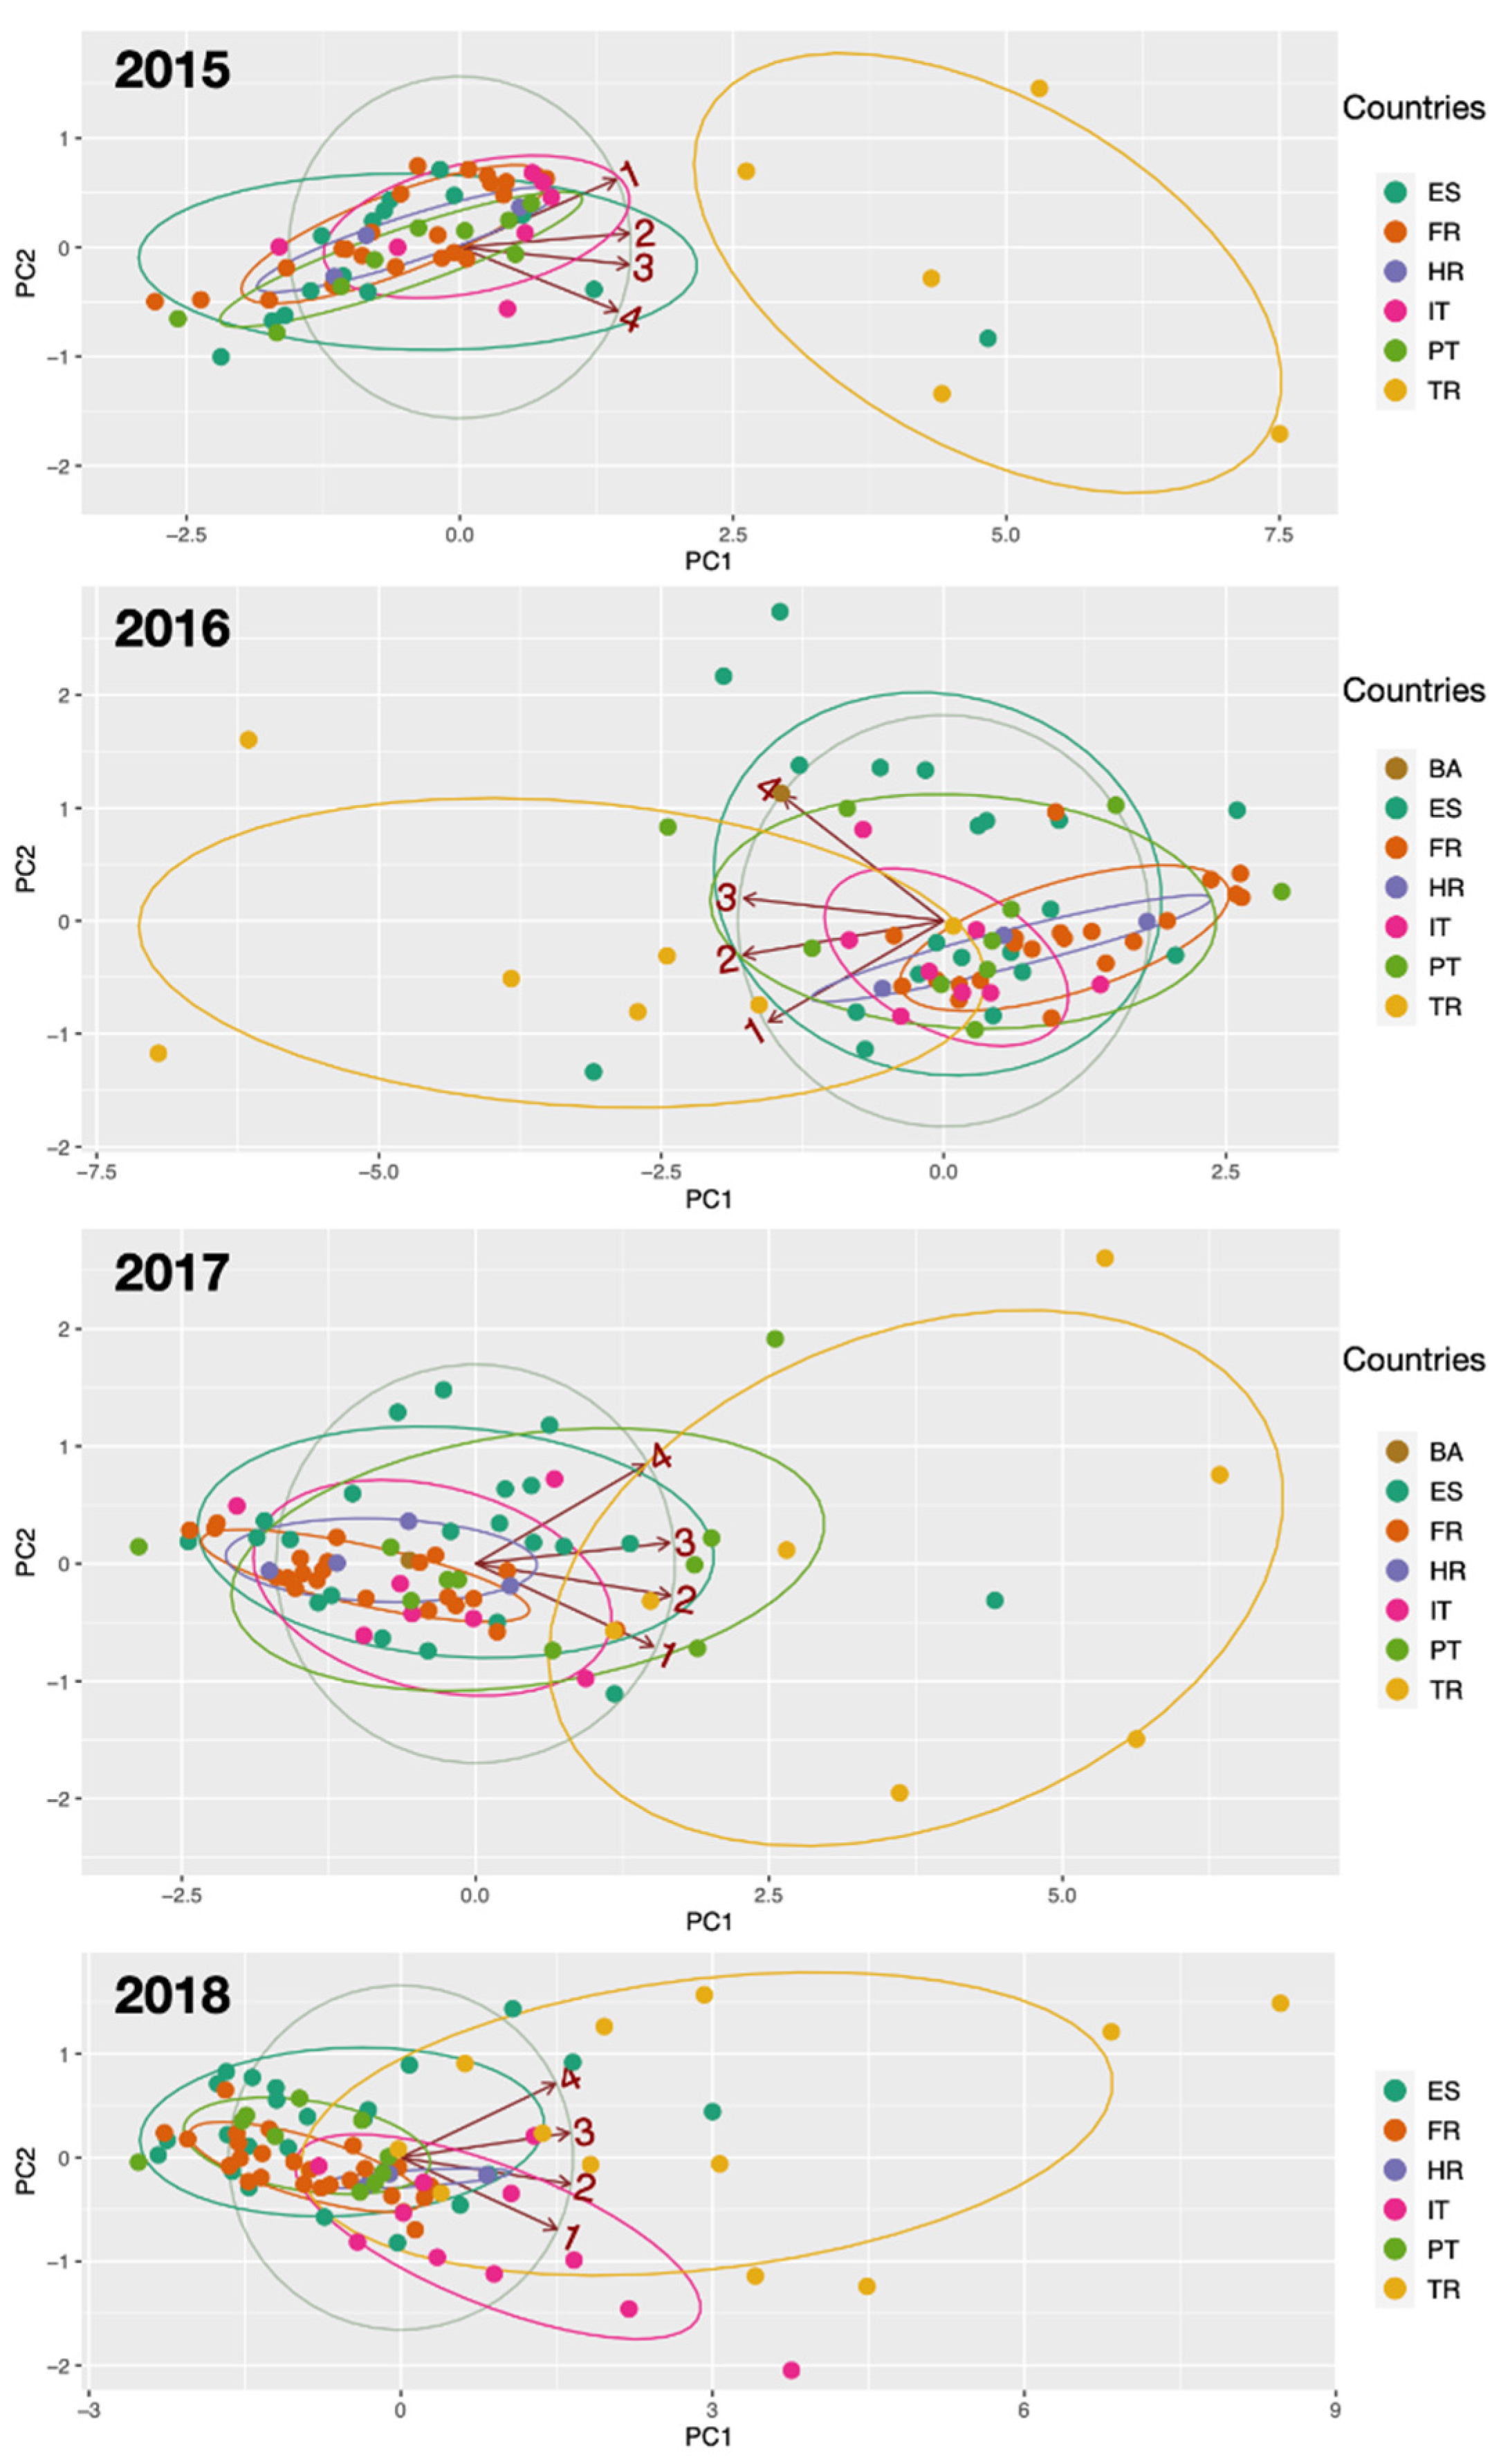
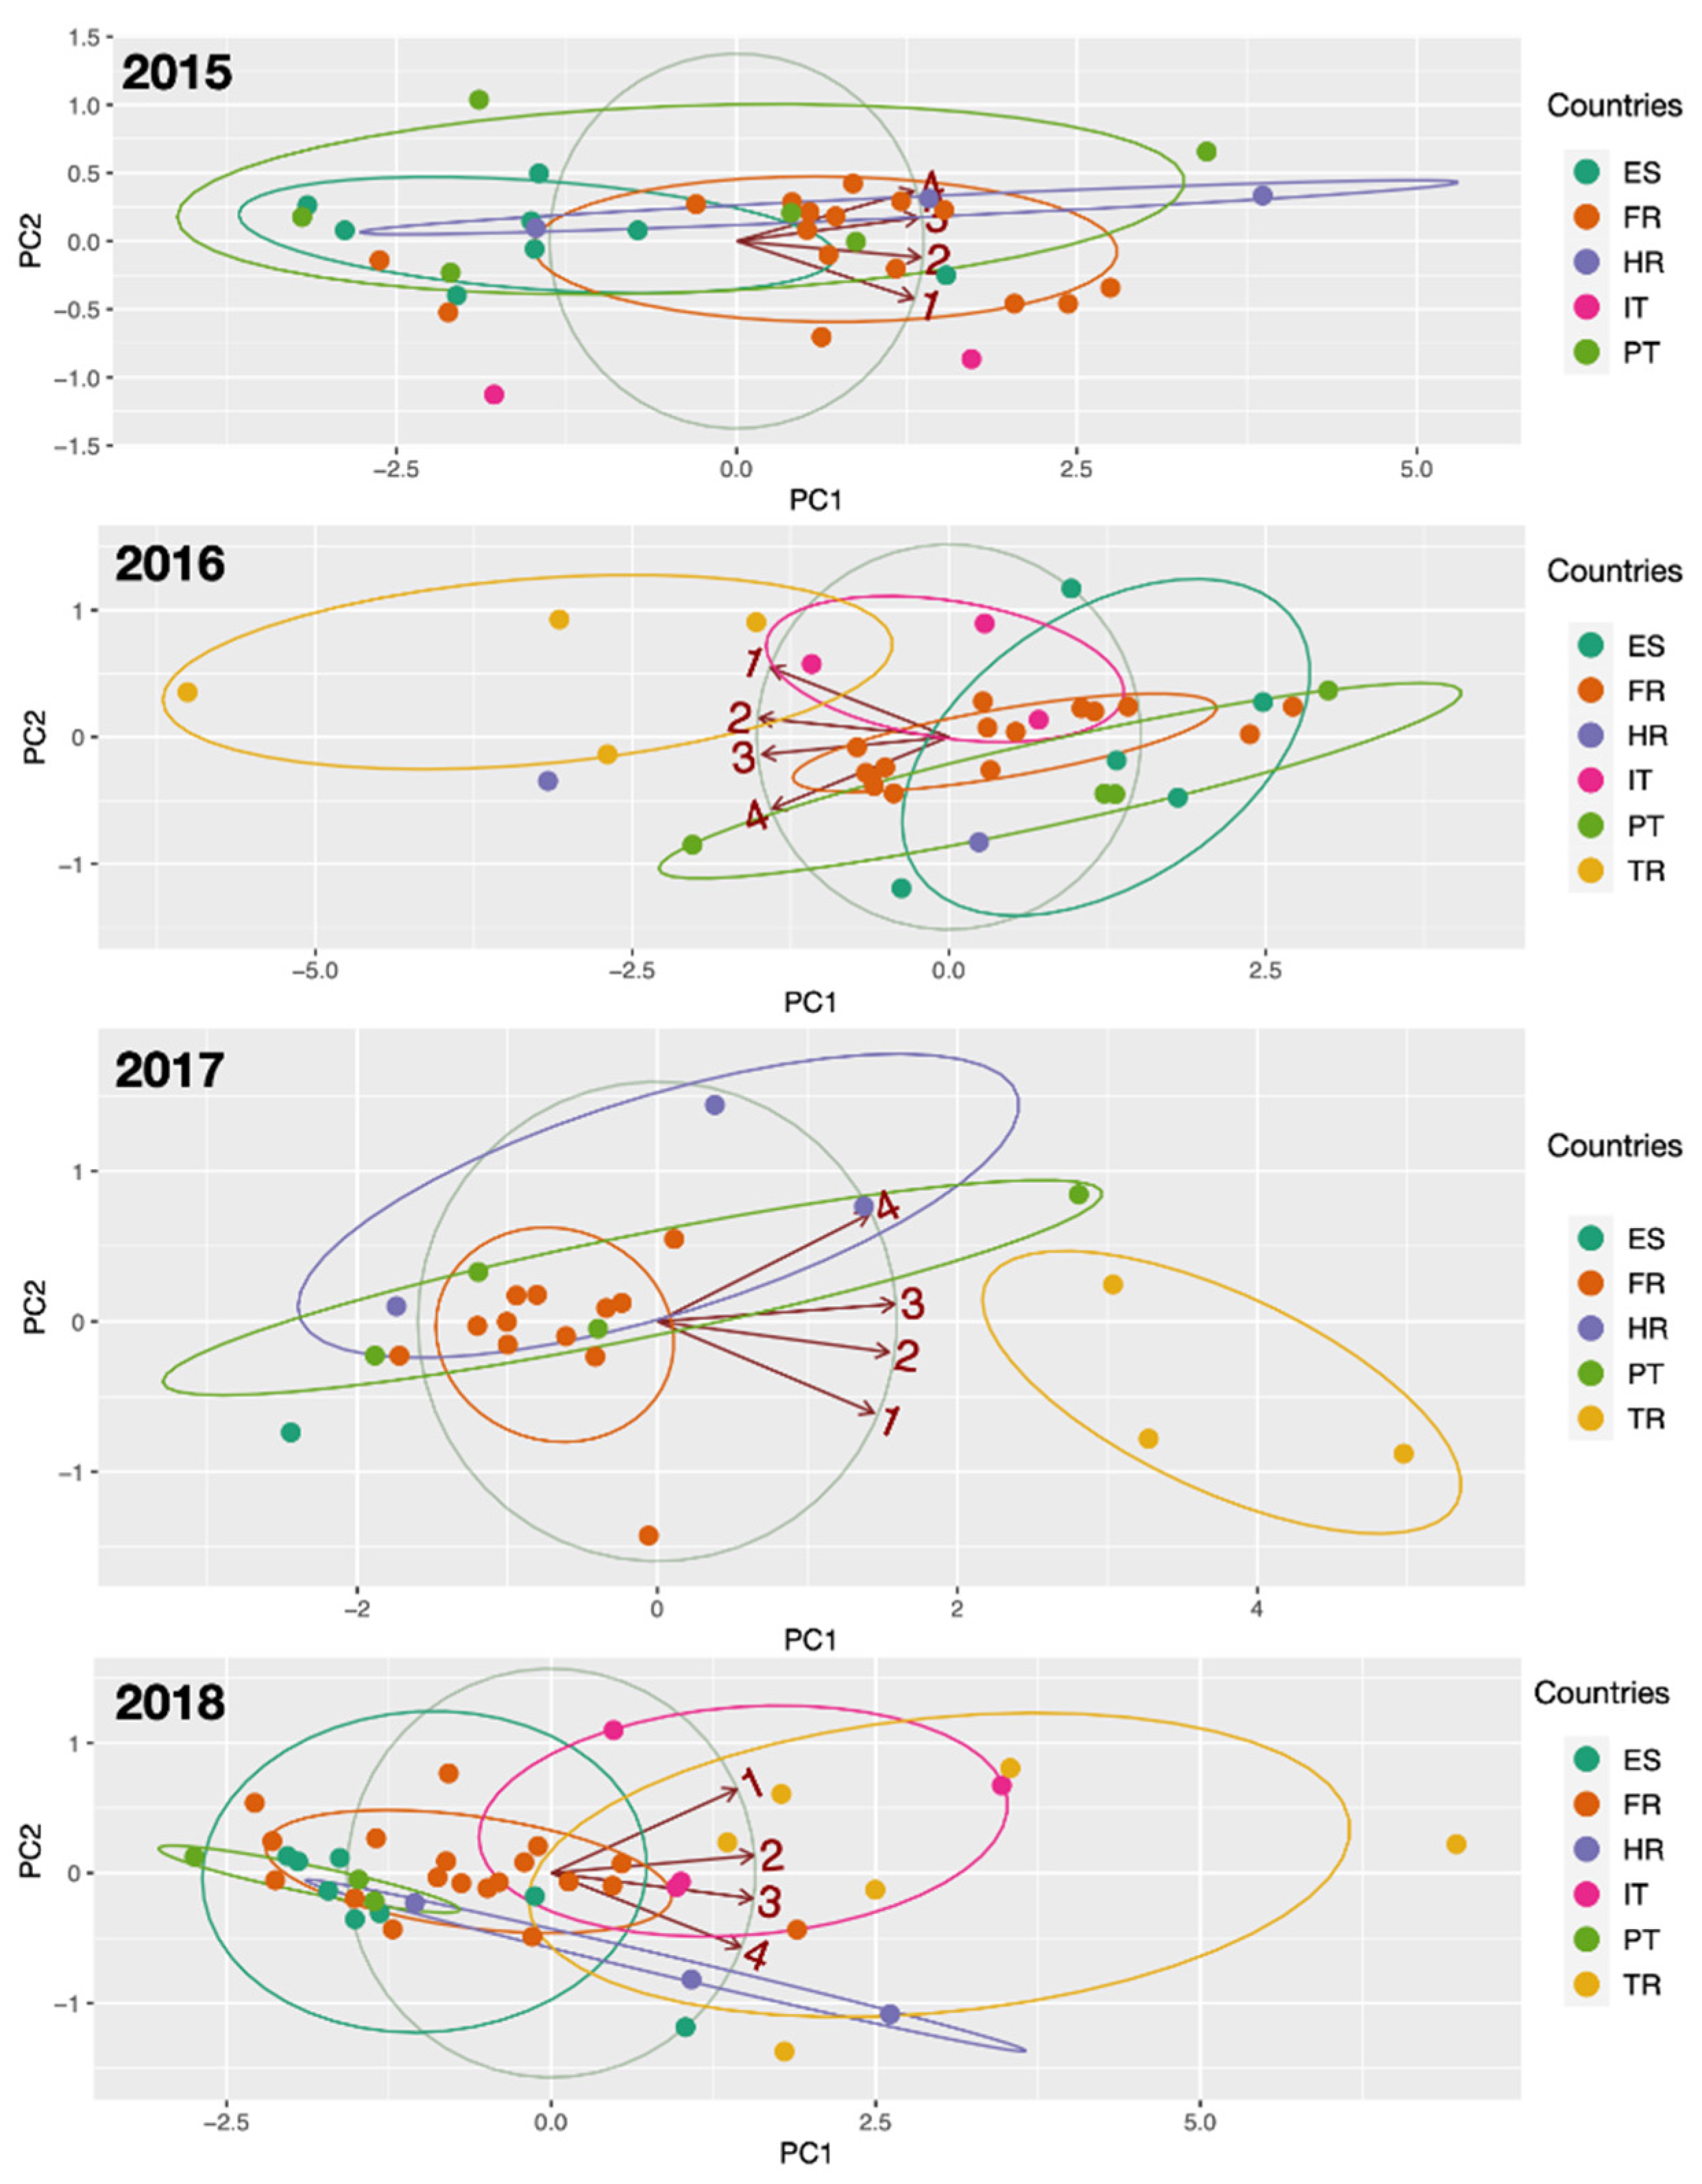
To study the clustering of remote monitoring sites according to the annual average values of their pollution profiles (µ1, µ2, µ3, µ4) for PM10 and PM2.5, a biplot principal component analysis (PCA) was performed for each year. To facilitate the analysis, 95% confidence interval ellipses were calculated by studied country. The computational implementation of PCA was performed using the ggplot2 function from the ggbiplot library from R [28]. Datasets containing the estimated pollution profiles by year are available upon request.
3. Results and Discussion
3.1. Behaviour of PM2.5/PM10 Ratio
PM2.5 and PM10 have several sources, thus presenting different physical and chemical properties. The study of PM2.5/PM10 ratio is a useful tool to identify PM sources and effects on human health [10,11]. Evolution of the PM2.5/PM10 ratios from 2015 to 2018 is illustrated in Figure 2. Remarkably, the pattern of the ratio in countries is similar to alternate years (2015 and 2017, 2016 and 2018). Even this analysis is absent for Turkey and Italy in 2015 and 2017, respectively, due to the lack of data fulfilling the quality criteria applied in this study; the highest ratios are obtained regularly for Croatia (HR—50% of the ratios were higher than 0.69 in 2016), followed by Italy (IT—with a median of 0.61 in 2016 and 2018), and the lowest ones for Portugal (PT—50% of the ratios were lower than 0.36 in 2016 and 2018) and Spain (ES—with a median of 0.5 in 2015 and 2017). The achieved values are in agreement with others already reported in the literature. For instance, Adães and Pires [9] analysed the PM2.5 concentrations measured at 23 stations distributed in 12 different European cities. Median ratio values were between 0.31 and 0.73 with high values attributed to sites with high traffic influences. Xu et al. [10] analysed the temporal and spatial variability of PM2.5/PM10 ratio. Mean values of 0.62 and 0.68 were determined for urban and background sites, respectively. Munir [11] analysed PM2.5/PM10 ratio at 46 monitoring sites in the UK, where medium values were between 0.4 and 0.8.

Figure 2.
Distribution of the general evolution of PM2.5/PM10 ratios in studied countries as box-whisker plots (2015–2018). As a reference, medians between countries are joined, and a dotted horizontal line is added at 0.5 ratio.
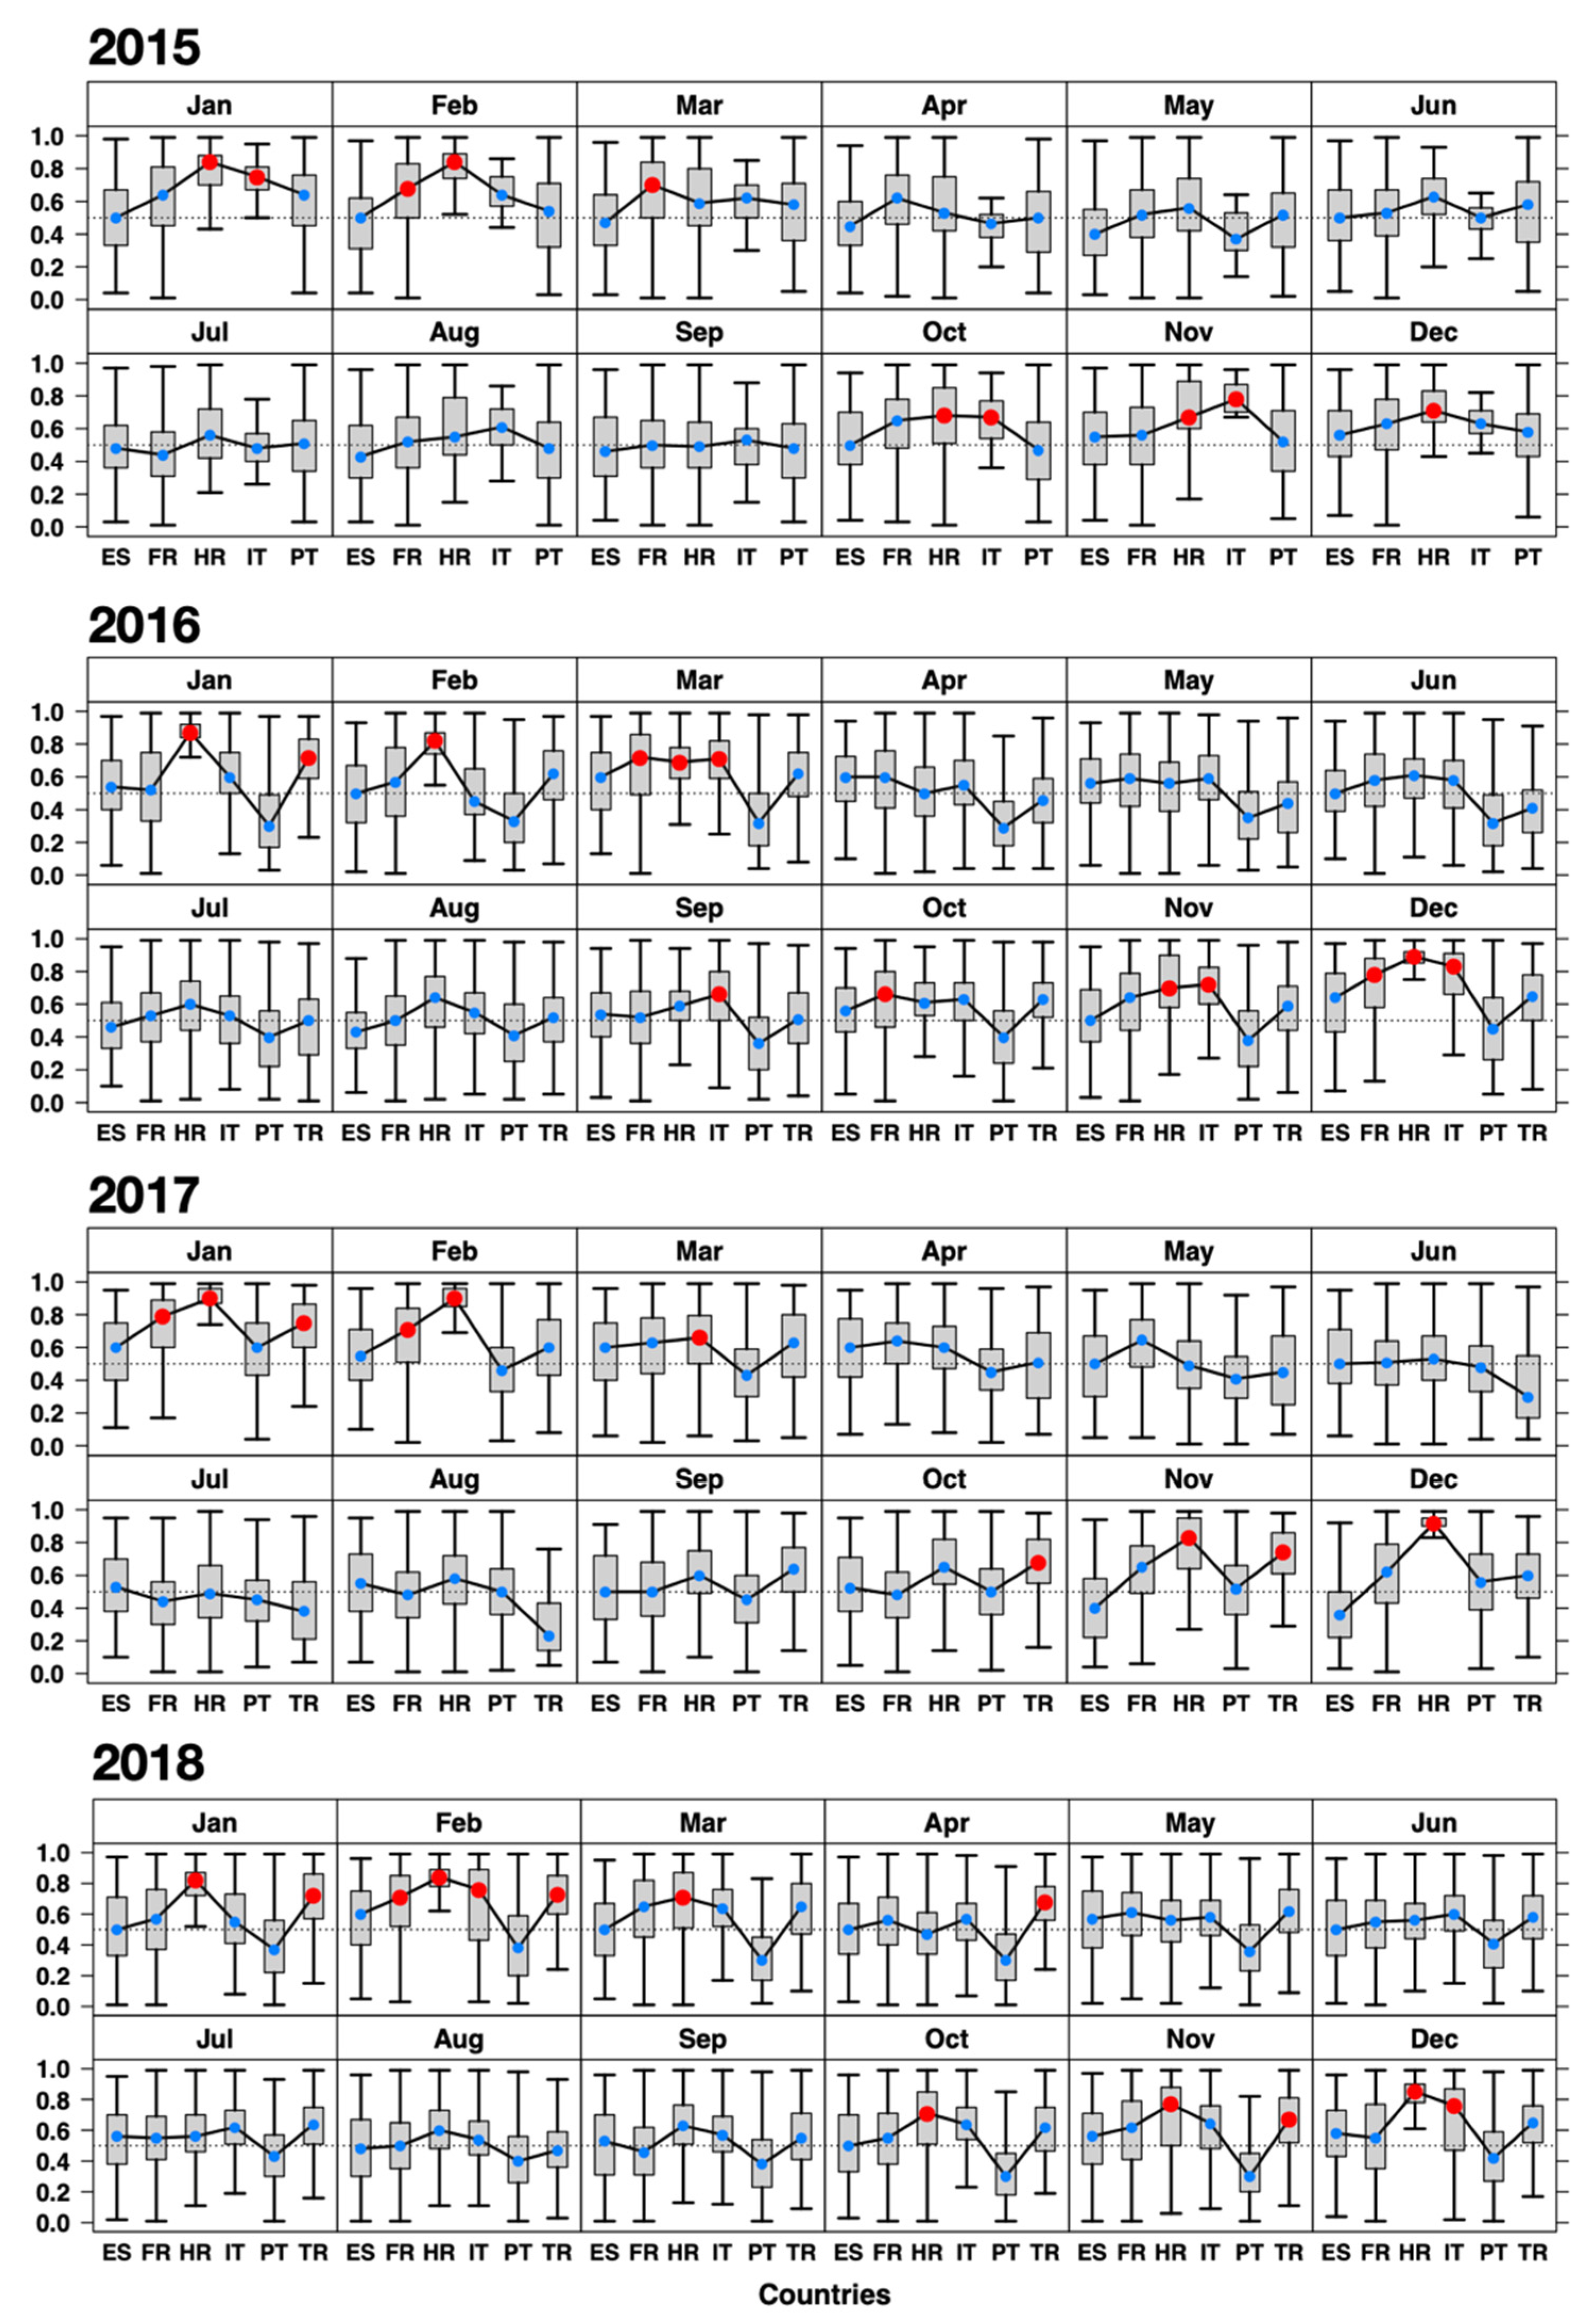
Figure 3 shows, as a more detailed analysis, a monthly analysis of PM2.5/PM10 ratio. Higher values (with median higher than 0.65) are indicated with a red median as a reference in the box-whisker plots. As a general rule, higher ratios are observed in the coldest months (October to February), in particular for countries like Croatia (HR) and Italy (IT). Other countries like France (FR) may show the highest ratios in February. This seasonal pattern is justified by the increase in fuel consumption in this period of the year for domestic and industrial heating [29]. Additionally, the stable atmospheric conditions promote the dry deposition of coarse particles, maintaining the fine particles in the air [10,30]. It can be slightly appreciated that PM2.5/PM10 ratio values higher than the P75 and lower than the P25 are prone to extending to the maximum and minimum ratios, respectively, in the warmest month.
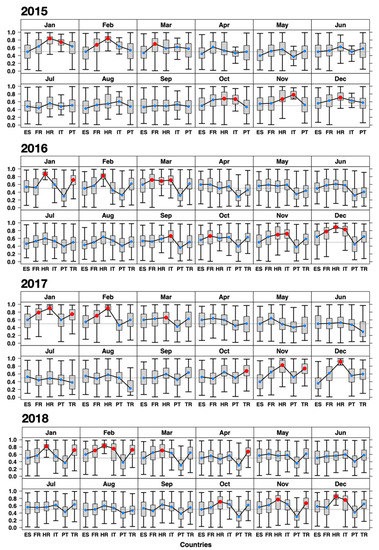
Figure 3.
Monthly distribution of PM2.5/PM10 ratios as in Figure 2. As a reference, countries exceeding the 0.65 ratio in 50% of the data are indicated by a red median, otherwise in blue. ES—Spain; FR—France; HR—Croatia; IT—Italy; PT—Portugal; TR—Turkey.
3.2. Study of Pollution Profiles over Time
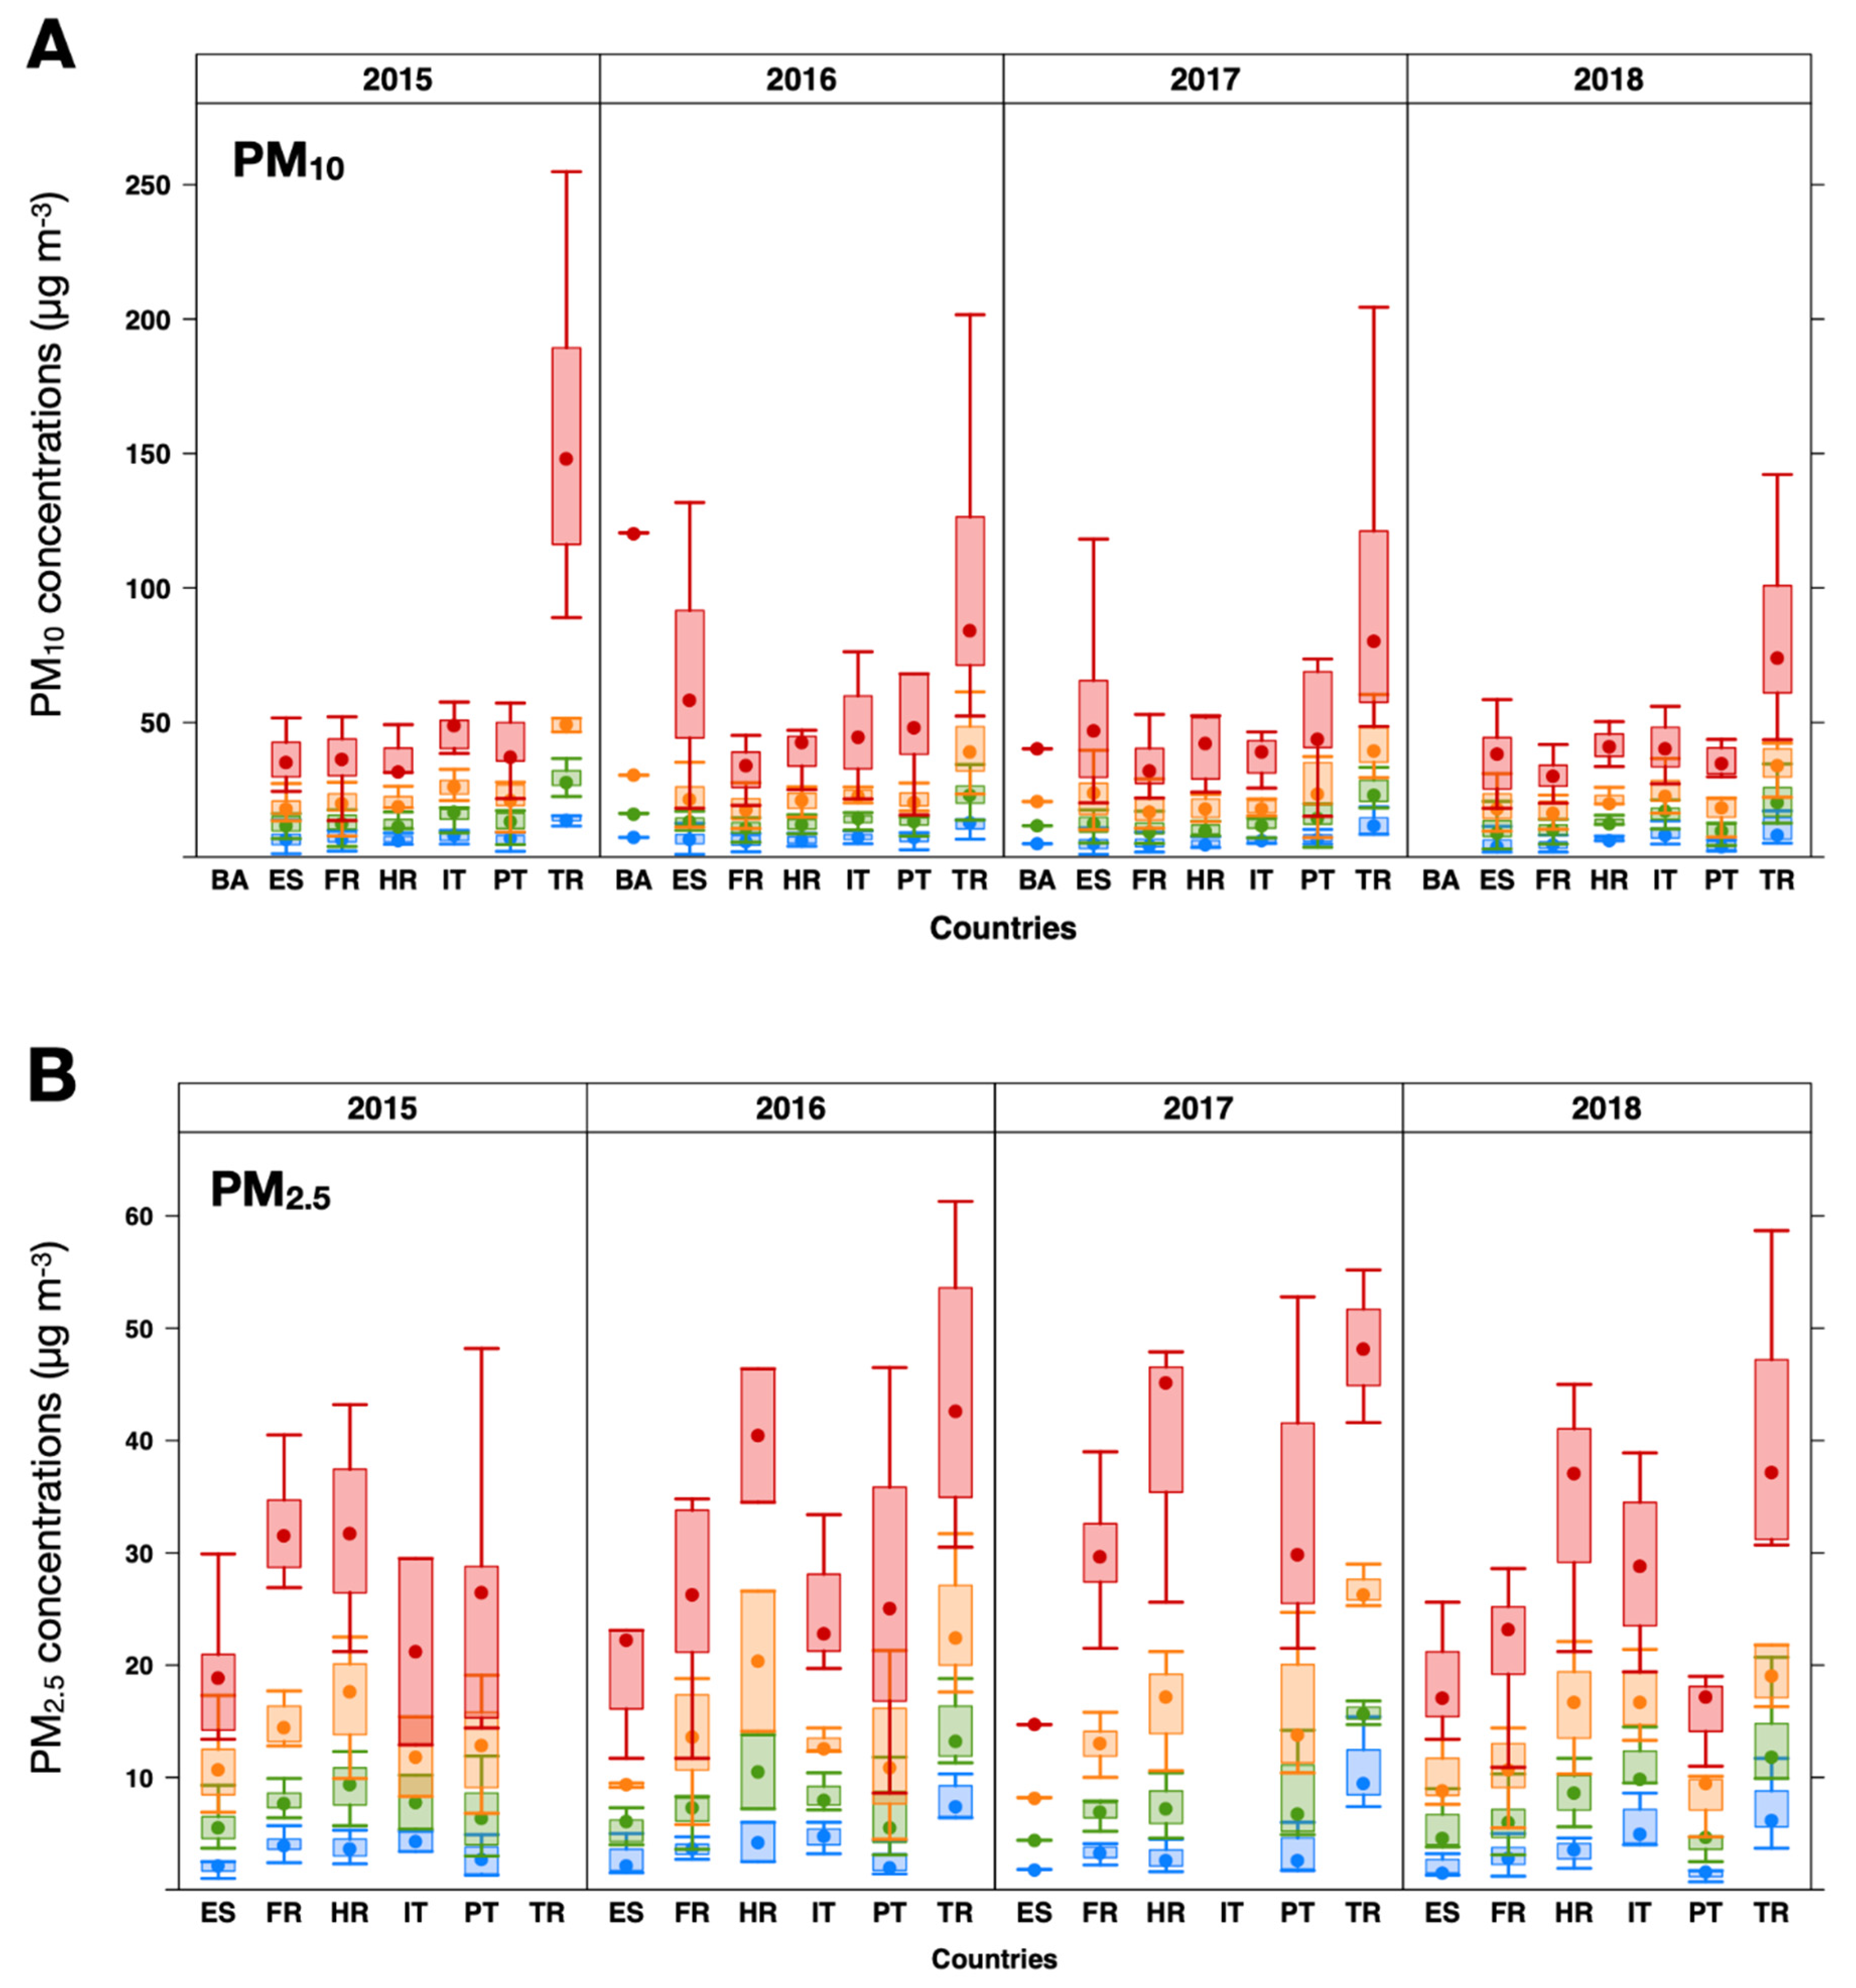
Every PM10 and PM2.5 TS from 2015 to 2018 obtained from the studied countries (Table 1) was analysed independently with HMM to estimate their regimes of concentration. Regimes of monitoring stations by countries are illustrated as box-whisker plots in Figure 4, for PM10 (A) and PM2.5 (B). The first to fourth pollution profiles are shown in blue, green, orange, and red, respectively. To detect the most representative particulate matter concentrations (PM10 and PM2.5), outliers (1.5 times below and higher the 25th and 75th percentile in distributions) were not considered in this study since the aim is to estimate the general trend of PM contributions quantitatively and not isolated outbreaks characterised by the highest concentrations. In Figure 4A, the highest pollution profile (red box-whisker plots) is estimated in Turkey (TR) and Spain (ES), while remaining with similar concentrations for the rest of countries (approximately around 50 µg·m−3), except for Italy (IT) in 2016 and Portugal (PT) in 2016 and 2017. Bosnia and Herzegovina (BA) lacks representativeness regarding its pollution profiles estimation since only one TS from a single monitoring station was available for this country for 2016 and 2017. The rest of the pollution profiles (one to three) remains similar to little variations for all countries.
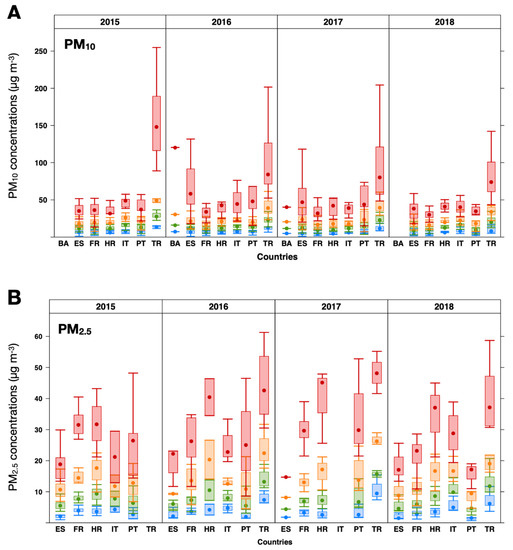
Figure 4.
PM10 (A) and PM2.5 (B) pollution profiles from monitoring sites by countries (2015–2018). First to fourth pollution profiles are shown in blue, green, orange, and red, respectively. ES—Spain; FR—France; HR—Croatia; IT—Italy; PT—Portugal; TR—Turkey.
Figure 4B shows the same analysis for PM2.5. The distribution of regimes is less homogenous than for PM10, although Turkey (TR) shows the highest concentration in the fourth pollution profile (red box-whisker plots) again. Croatia (HR) also exhibits the second highest concentrations in the fourth regime, followed by Portugal (PT)—2015 to 2017—Italy (IT)—2015 to 2016, and 2018—and France (FR). Remarkably, Spain (ES) shows the lowest fourth pollution profile even though it is a country markedly affected by PM contributions from North African deserts [31,32]. The rest of the regimes show some more variations with respect to PM2.5 than in the PM10 case. Another interesting profile is represented by the first (background) profile. Turkey (TR) shows the highest levels of PM2.5 background pollution (blue box-whisker plots) followed by Italy (IT), Croatia (HR), France (FR), and Spain (ES), similarly to the behaviour of the fourth pollution profile.
3.3. Estimation of African Dust Contributions to PM10 and PM2.5
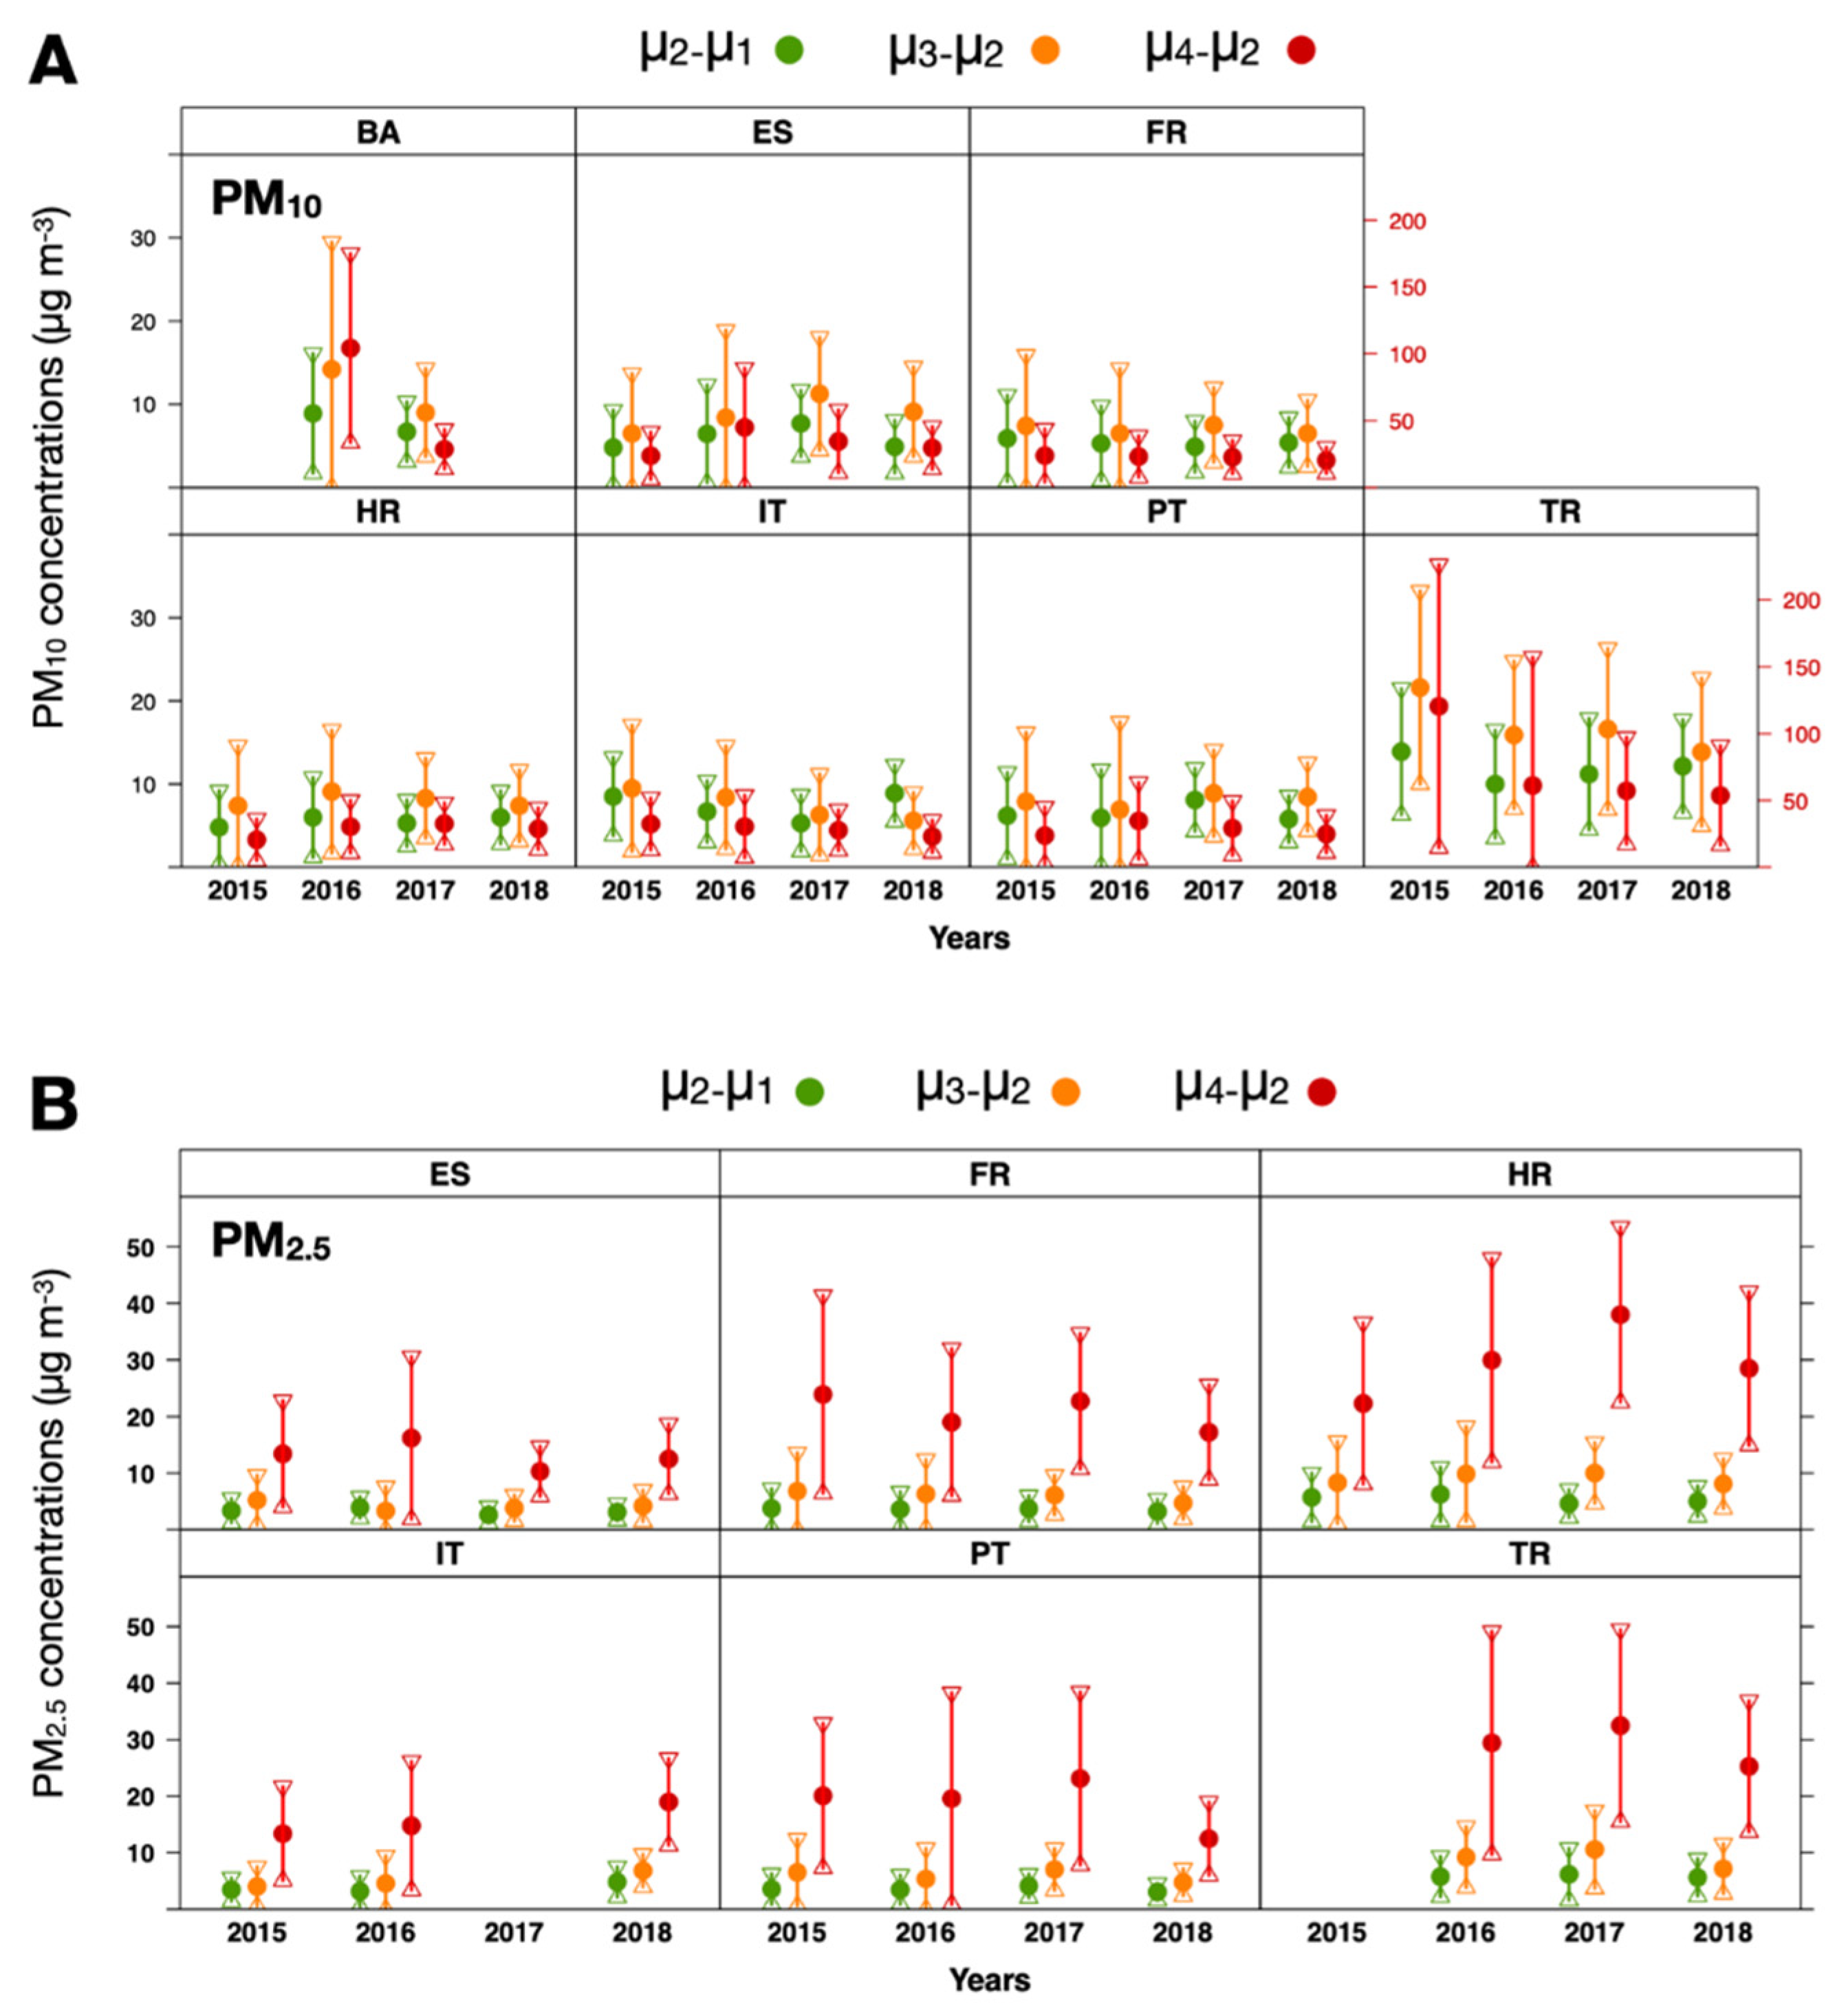
Once pollution profiles were estimated with HMM, PM10 and PM2.5 contributions (African dust contributions to PM10 and PM2.5) according to the regimes’ average values were calculated as defined in Section 2.3. These results are illustrated in Figure 5 for PM10 (A) and PM2.5 (B). Severe dust contributions to PM10 were estimated for Bosnia and Herzegovina (BA), Spain (ES), and Turkey (TR), although this first country lacks representativeness since just TS data from two monitoring sites were studied according to the quality criteria for data coverage used in this study. From 2015 to 2018, average severe contributions (µ4–µ2) were quantified as 66.4 ± 42.8 µg·m−3 (BA), 33.2 ± 25.4 µg·m−3 (ES), 22.5 ± 14.5 µg·m−3 (FR), 28.1 ± 16.7 µg·m−3 (HR), 28.4 ± 17.6 µg·m−3 (IT), 28.1 ± 21.2 µg·m−3 (PT), and 73.1 ± 69.8 µg·m−3 (TR). For the same period, average characteristic concentrations (µ3–µ2) were 11.6 ± 10.3 µg·m−3 (BA), 8.8 ± 7.5 µg·m−3 (ES), 7.0 ± 6.2 µg·m−3 (FR), 8.1 ± 5.9 µg·m−3 (HR), 7.5 ± 5.5 µg·m−3 (IT), 8.1 ± 7.0 µg·m−3 (PT), and 17.0 ± 9.8 µg·m−3 (TR).
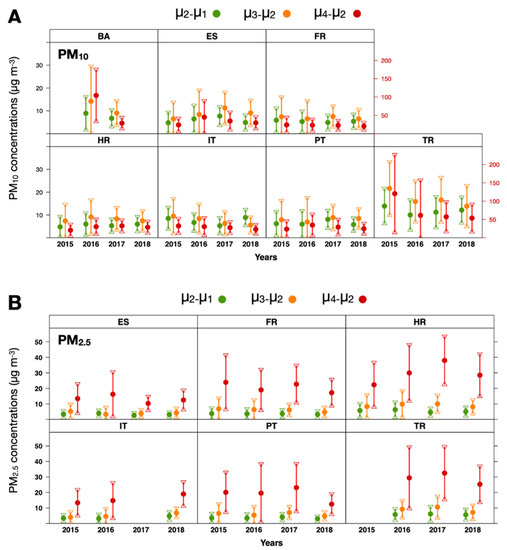
Figure 5.
Estimation of annual average dust desert contributions to PM10 (A) and PM2.5 (B) from 2015 to 2018. Anthropogenic contributions and characteristic and severe contributions by deserts are indicated in green, orange, and red colours, respectively. BA—Bosnia and Herzegovina; ES—Spain; FR—France; HR—Croatia; IT—Italy; PT—Portugal; TR—Turkey. Uncertainty is indicated by means of vertical bars. In A, severe contributions (in red) refer to the right Y-axis.
In the case of Spain, the average concentration associated with characteristic contributions from North African deserts (orange dots in Figure 5A) was estimated as 6.5 ± 7.2, 8.4 ± 10.5, 11.2 ± 6.8, and 9.1 ± 5.4 µg·m−3 from 2015 to 2018, respectively. The same estimated concentrations following the 40th percentile method [15,31,33] were 2.5, 4.0, 3.2, and 3.4 µg·m−3, for the same years [34,35,36,37]. Higher estimations of the time series clustering method in comparison with the 40th percentile method are also in agreement with those of Wang et al. [38], who estimated a concentration range for Spain of 10–20 µg·m−3 from 2016 to 2017 using the GEOS-Chem model. Highest severe contributions from dust desert to PM10 (red dots in Figure 5A) are estimated for Bosnia and Herzegovina (BA) and Turkey (TR).
With respect to PM2.5, the highest (severe) estimated contributions from dust desert to PM2.5 are slightly differentiated by countries (red dots in Figure 5B). However, Turkey (TR) and Croatia (HR) reached 32.5 and 38.0 µg·m−3 concentrations in 2017, respectively. The average concentrations associated with characteristic contributions from North African deserts (orange dots) were similar among studied countries, although Croatia (HR) and Turkey (TR) received the highest contributions and to a lesser extent, France (FR) and Portugal (PT). In the studied period (2015–2018), average severe contributions (µ4–µ2) were quantified in 13.1 ± 8.6 µg·m−3 (ES), 20.7 ± 12.7 µg·m−3 (FR), 29.7 ± 15.4 µg·m−3 (HR), 15.7 ± 9.1 µg·m−3 (IT), 18.8 ± 13.3 µg·m−3 (PT), and 29.1 ± 16.1 µg·m−3 (TR). Regarding average characteristic concentrations (µ3–µ2), these were 4.1 ± 3.5 µg·m−3 (ES), 6.0 ± 4.8 µg·m−3 (FR), 9.1 ± 6.4 µg·m−3 (HR), 5.2 ± 3.8 µg·m−3 (IT), 6.0 ± 4.4 µg·m−3 (PT), and 9.0 ± 5.6 µg·m−3 (TR).
3.4. Daily Level Evolution of PM2.5 and PM10 Regimes
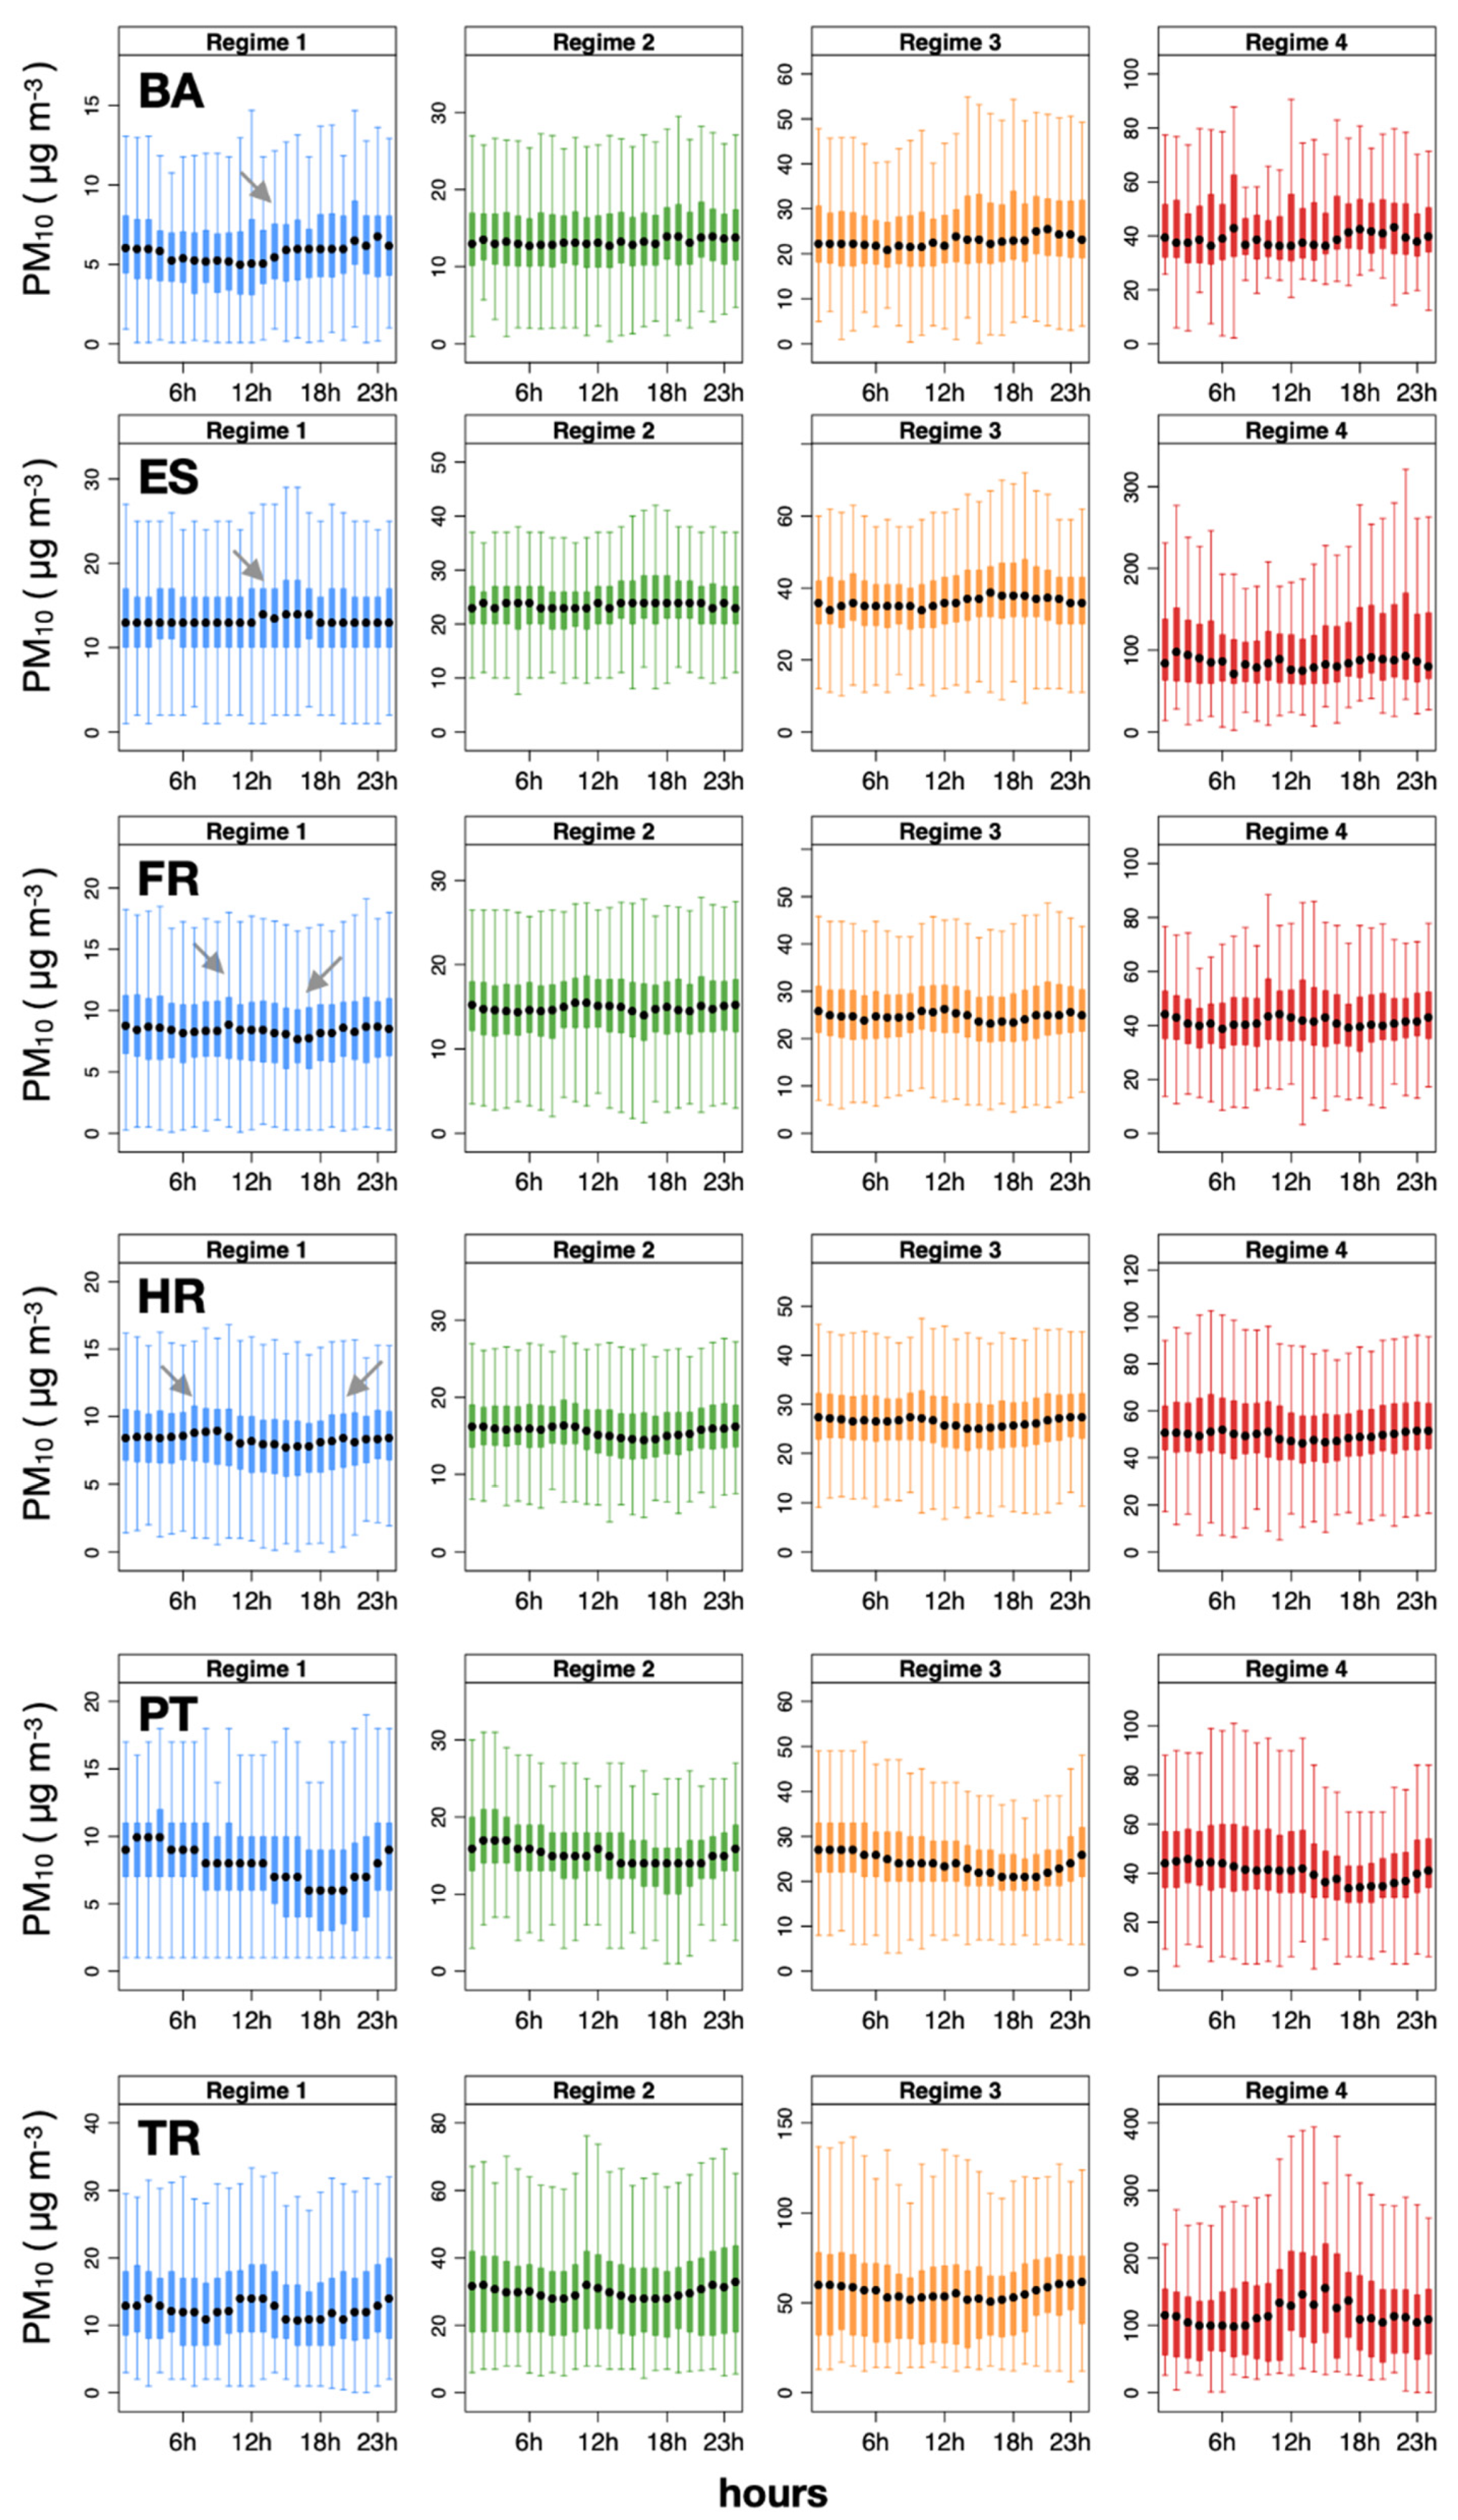
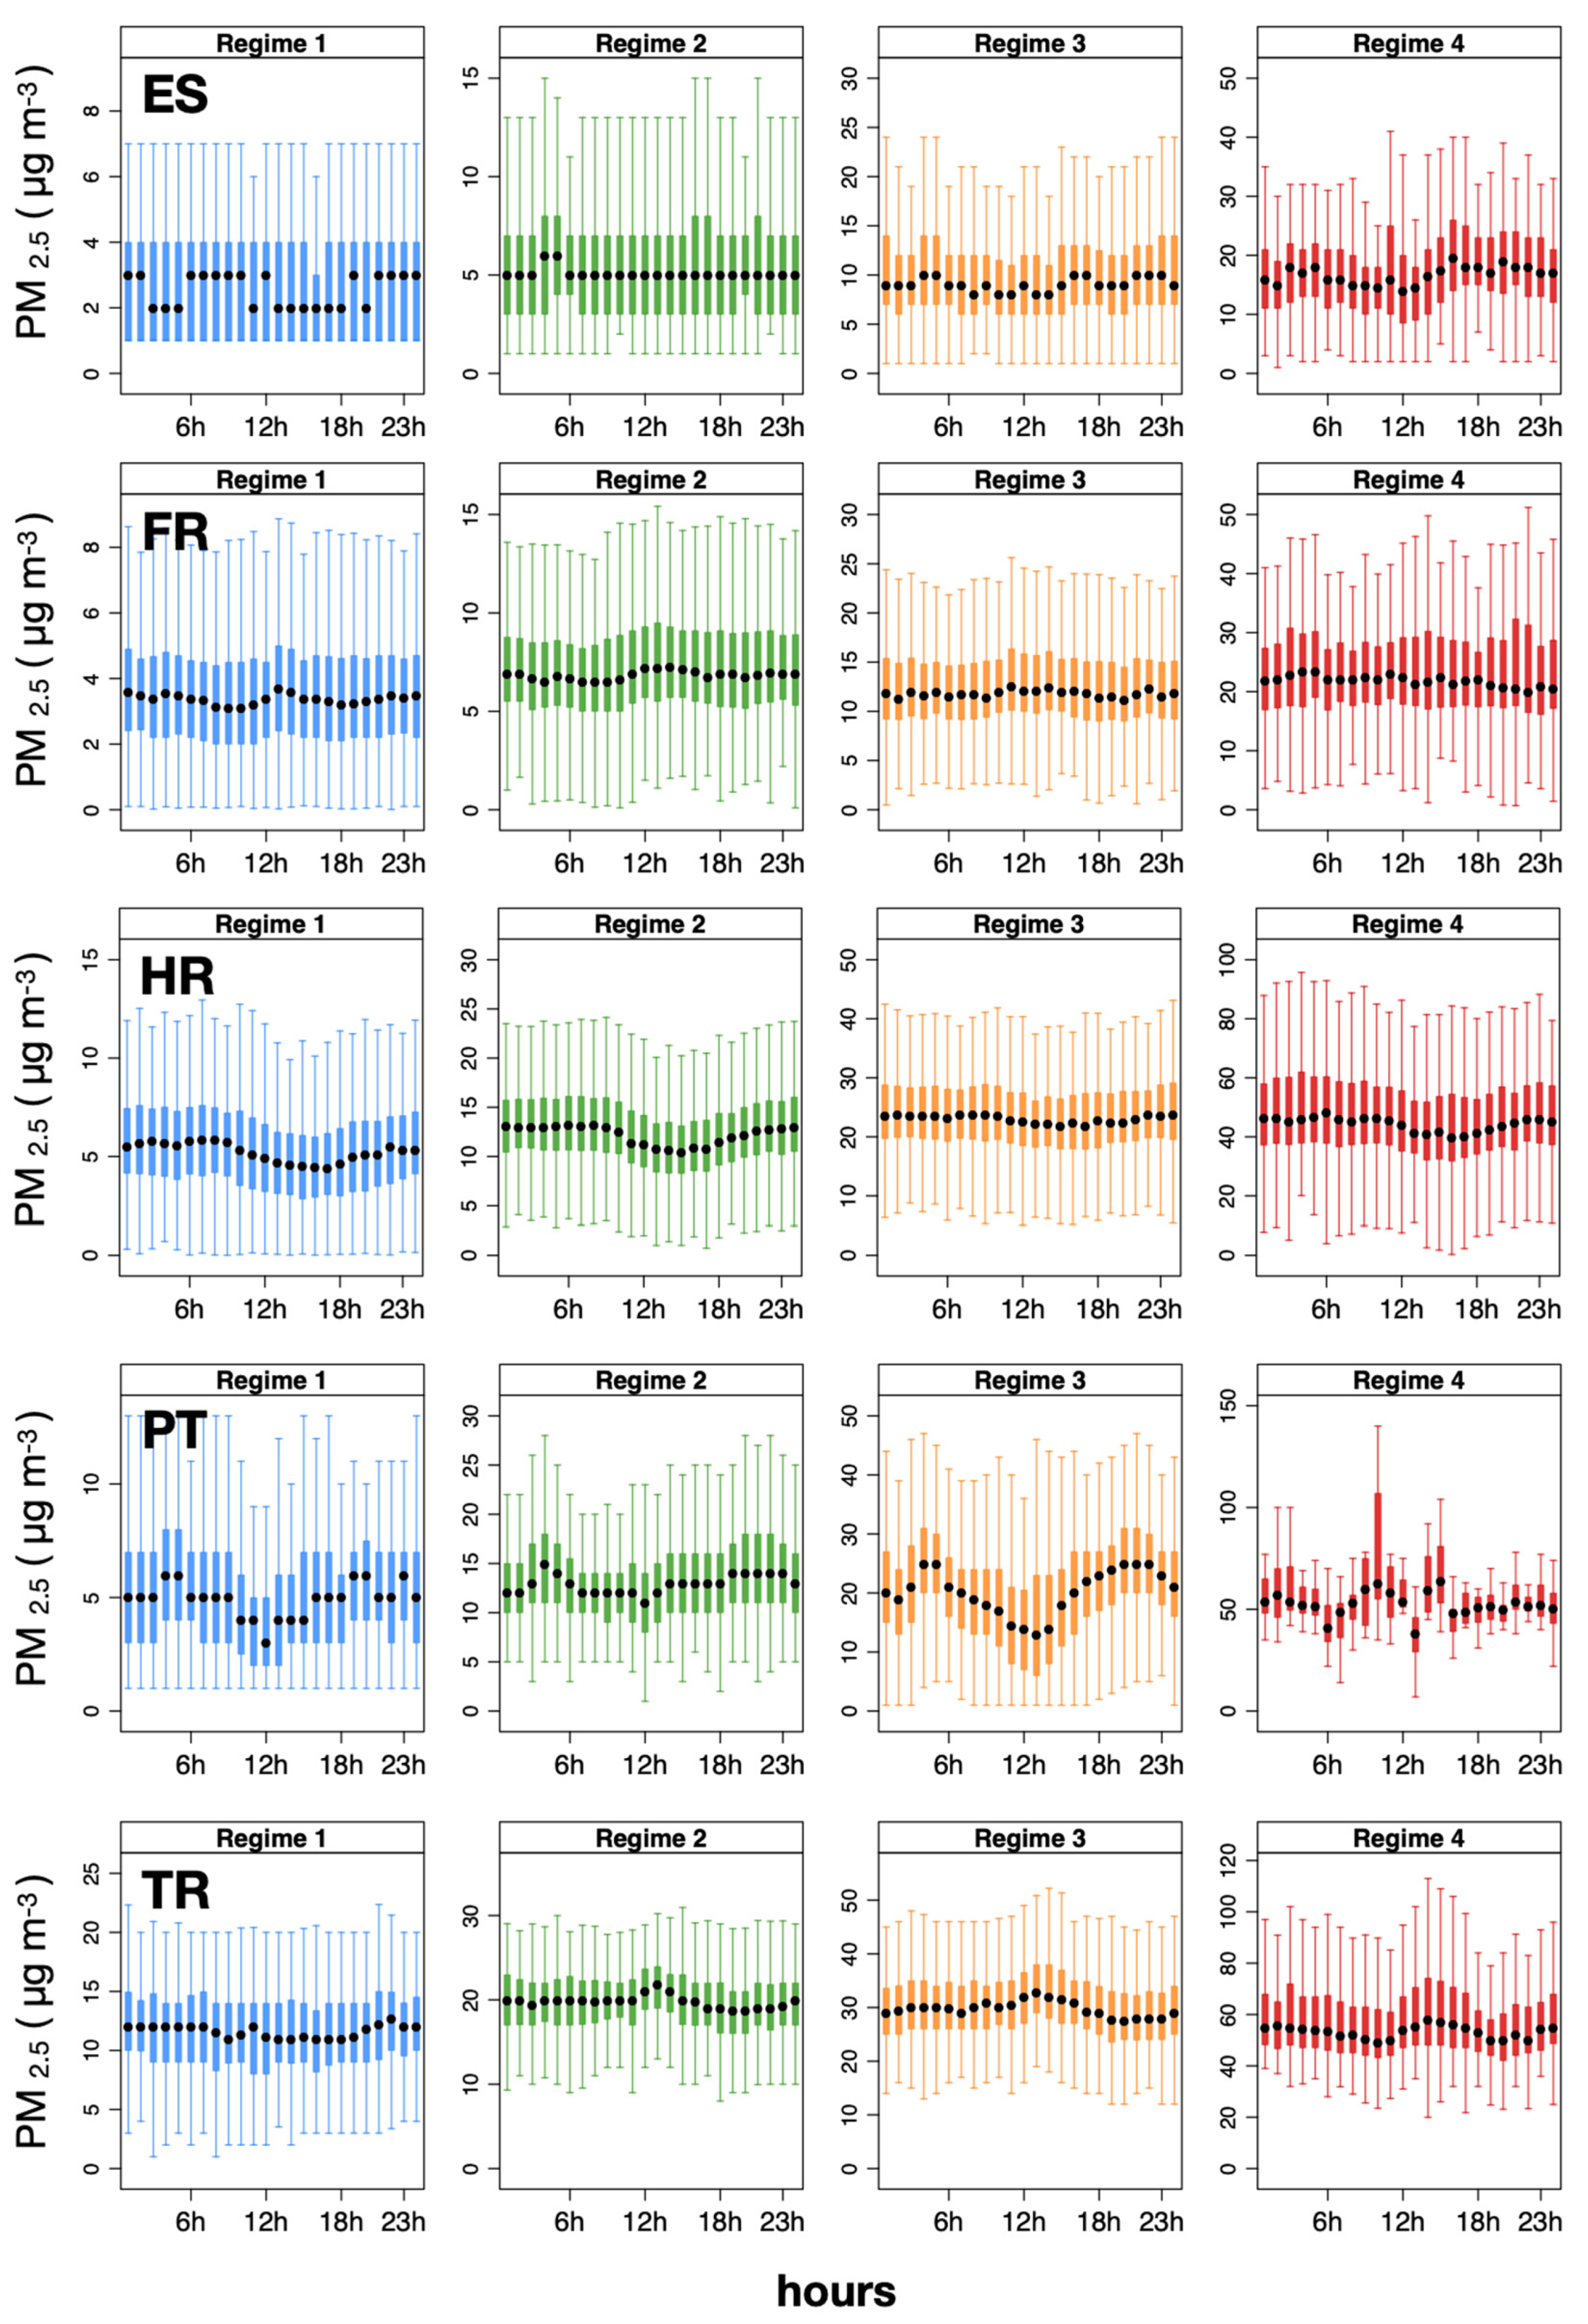
To provide a different insight regarding the evolution of the PM2.5/PM10 ratios, from those TS indicated in Table 1, the one with the highest PM10 and PM2.5 annual concentration average value for each country was selected (independently for each air pollutant), and their regimes of concentration were studied considering the hour of the day (analysed monitoring sites are provided in SM3). These results are graphically presented in Figure 6 for PM10 and in Figure 7 for PM2.5. For the sake of clarity, observations lower and higher than the 25th and 75th percentile were not represented. Only the selected air quality monitoring stations in TR coincided for the PM10 and PM2.5 air pollutants. The cases of the TS from IT for PM10 and PM2.5, and IT and BA for PM2.5 are omitted from this analysis for not being informative concerning the analysis performed in this section.
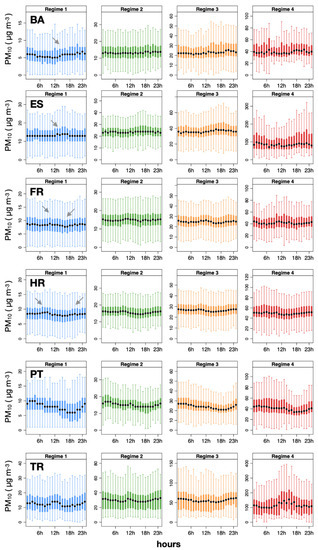
Figure 6.
Evolution of the PM10 concentration by regimes and hour of the day. Panels in rows describe the analysis for a single TS. Grey arrows indicate slight fluctuations in concentrations. ES—Spain; FR—France; HR—Croatia; IT—Italy; PT—Portugal; TR—Turkey.
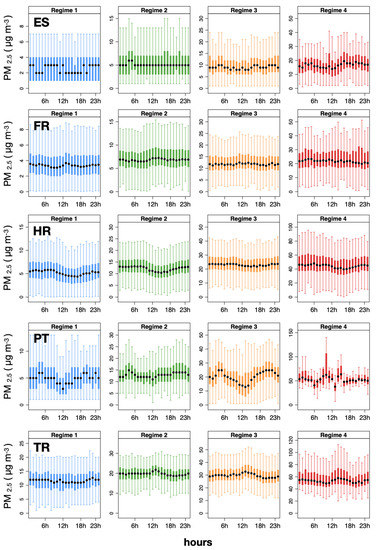
Figure 7.
Evolution of the PM2.5 concentration by regimes and hour of the day as in Figure 4.
Although the interpretation of these results would require an in-depth assessment of emission sources contributing to air quality at the monitoring stations from which TS were obtained, in Figure 6, it can be noticed that some of the relative fluctuations in concentrations detected in Regime 1 to Regime 3 could be showing some patterns of anthropogenic activity (grey arrows). However, this pattern could be reflected at a different time of the day depending on the location (distance) of the monitoring station with respect to the activities responsible for the emission. This could be the case of the TS from TR, BA, FR, and HR. In these TS, an increase in PM10 concentration can be detected in Regimes 1 and 3 before 12 h and after 18 h. Additionally, this latter activity is detected in the TS from PT. In the case of the TS from ES, this raise in PM10 concentration is detected just after 12 h. This could suggest that although Regime 3 was typically associated with moderate contributions from desert outbreaks (Section 2.3), this regime could also be influenced by contributions from these anthropogenic activities, although to a much lesser extent as evidenced by the magnitude of the fluctuations estimated in this regime. In this regard, another more plausible explanation could be related to the evaporation of semi-volatile organics or semi-volatile inorganic species. This could be similar to the diurnal cycle of the NO3 [39], in which the simultaneous drop in humidity and the rise of temperature causes the evaporation of NH4NO3. The case of PM2.5 in Figure 7 shows similarities with the analysis from Figure 6. Fluctuations around 12 and 18 h can be described for Regimes 1 to 3, being even more evident for the case of PT. In both, either PM10 or PM2.5 analysis, patterns of anthropogenic activity could be partially explained by the location of the stations at low altitude (eight out of ten stations are located below 200 m a.s.l—above sea level; see SM3), and therefore, more likely to be affected by its emission sources.
3.5. PCA
Results of PCA biplot analysis for the different pollution profiles obtained for PM10 and PM2.5 from analysed monitoring stations are illustrated in Figure 8 and Figure 9, respectively. The importance of the principal components is represented as the proportion of variance (in percentage) explained (Table 4). In Figure 8, the confidence ellipses indicate a remarkable grouping of most of the countries during all studied years, except for Turkey (TR—yellow ellipse), due to the higher dust load that this country receives from North African deserts. In particular, for the year 2015, this latter country exhibits a complete dissociation from the rest of the countries in the five studied stations. Monitoring stations from Spain (ES), a country typically suffering from desert particulate matter contributions, show similar behaviour with those from Turkey, since they appear within the TR confidence ellipse. Other monitoring stations showing similar behaviour to those from TR are from Portugal (PT) and Italy (IT), and to a lesser extent, from France (FR), indicated by the ellipse superposition during the studied years. All biplot vectors point to the location of the Turkey ellipse, indicating that these monitoring stations exhibit a higher magnitude than all the PM10 regimes estimated, coinciding with the values from Figure 4A. With respect to PM2.5, the superposition of ellipses is less evident than for the PM10 case, although the distinct role of Turkey remains regarding the magnitude of the estimated regimes (2016 and 2017). In general, PM10 and PM2.5 confidence ellipses show a similar pattern during the studied years, although the PM2.5 analysis for TR in 2015 is not available due to the lack of data.
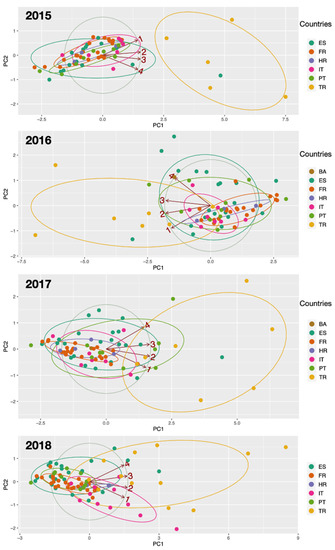
Figure 8.
PCA biplot analysis for PM10 (2015–2018), showing the relative position of monitoring stations by countries concerning the principal components. Four biplot vectors (in red) represent the four regimes of pollution as variables (1—first regime to 4—fourth regime). The 95% confidence interval ellipses are represented with a different colour for each country. BA—Bosnia and Herzegovina; ES—Spain; FR—France; HR—Croatia; IT—Italy; PT—Portugal; TR—Turkey.
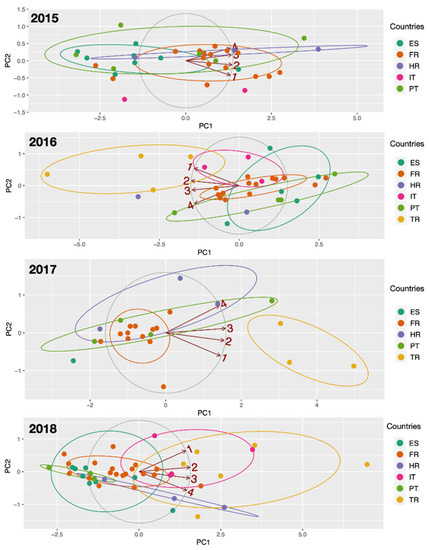
Figure 9.
PCA biplot analysis for PM2.5 (2015–2018), showing the relative position of monitoring stations by countries concerning the principal components. BA—Bosnia and Herzegovina; ES—Spain; FR—France; HR—Croatia; IT—Italy; PT—Portugal; TR—Turkey.

Table 4.
Proportion of variance explained (in %) by pollutant and principal components (PC1 and PC2).
4. Conclusions
This study aims to estimate the PM10 and PM2.5 pollution profiles at background locations in Mediterranean countries and to quantify the contributions to PM10 and PM2.5 caused by dust outbreaks from North African desert regions. The time series clustering method based on Hidden Markov Models was used to estimate such pollution profiles, and contributions were obtained according to their given definitions. A discussion on the advantages and limitations of the time series clustering methods was provided in the methodological section. Countries like Turkey and Spain show the PM10 profiles with the highest concentration, and Turkey, Croatia, Portugal, Italy, and France with respect to PM2.5. From 2015 to 2018, average characteristic contributions to PM10 (µ3–µ2) were estimated as 11.6 ± 10.3 µg·m−3 (Bosnia and Herzegovina), 8.8 ± 7.5 µg·m−3 (Spain), 7.0 ± 6.2 µg·m−3 (France), 8.1 ± 5.9 µg·m−3 (Croatia), 7.5 ± 5.5 µg·m−3 (Italy), 8.1 ± 7.0 µg·m−3 (Portugal), and 17.0 ± 9.8 µg·m−3 (Turkey). For the same period and PM2.5, the estimated average characteristic contributions were 4.1 ± 3.5 µg·m−3 (Spain), 6.0 ± 4.8 µg·m−3 (France), 9.1 ± 6.4 µg·m−3 (Croatia), 5.2 ± 3.8 µg·m−3 (Italy), 6.0 ± 4.4 µg·m−3 (Portugal), and 9.0 ± 5.6 µg·m−3 (Turkey). The analysed evolution of the PM2.5/PM10 ratios in background stations from 2015 to 2018 was in agreement with other studies in the literature. Later, principal component analysis grouped the monitoring stations according to the different estimated PM10 and PM2.5 pollution profiles.
Supplementary Materials
The description of the applied methods and the list of monitoring stations are available online at https://www.mdpi.com/2073-4433/12/1/5/s1.
Author Contributions
Conceptualisation, Á.G.-L.; methodology, Á.G.-L. and J.C.M.P.; software, Á.G.-L.; validation, Á.G.-L. and J.C.M.P.; formal analysis, Á.G.-L.; investigation, Á.G.-L. and J.C.M.P.; resources, Á.G.-L.; data curation, Á.G.-L.; writing—original draft preparation, Á.G.-L. and J.C.M.P.; writing—review and editing, Á.G.-L. and J.C.M.P.; visualization, Á.G.-L.; supervision, Á.G.-L. and J.C.M.P.; project administration, Á.G.-L. and J.C.M.P.; funding acquisition, Á.G.-L. and J.C.M.P. All authors have read and agreed to the published version of the manuscript.
Funding
This work was financially supported by Base Funding—UIDB/00511/2020 of the Laboratory for Process Engineering, Environment, Biotechnology and Energy—LEPABE—funded by national funds through the FCT/MCTES (PIDDAC). J.C.M. Pires acknowledges the FCT Investigator 2015 Programme (IF/01341/2015).
Acknowledgments
The authors thank the European Environment Agency for providing the air quality data used in this study.
Conflicts of Interest
The authors declare no conflict of interest.
References
- WHO. 9 Out of 10 People Worldwide Breathe Polluted Air, But More Countries are Taking Action. Available online: https://www.who.int/news-room/detail/02-05-2018-9-out-of-10-people-worldwide-breathe-polluted-air-but-more-countries-are-taking-action (accessed on 19 November 2020).
- Guerreiro, C.B.B.; Foltescu, V.; de Leeuw, F. Air quality status and trends in europe. Atmos. Environ. 2014, 98, 376–384. [Google Scholar] [CrossRef]
- Juda-Rezler, K.; Reizer, M.; Maciejewska, K.; Blaszczak, B.; Klejnowski, K. Characterization of atmospheric pm(2.5 )sources at a central european urban background site. Sci. Total Environ. 2020, 713, 136729. [Google Scholar] [CrossRef] [PubMed]
- Yang, W.; Chen, H.; Wu, J.; Wang, W.; Zheng, J.; Chen, D.; Li, J.; Tang, X.; Wang, Z.; Zhu, L.; et al. Characteristics of the source apportionment of primary and secondary inorganic pm2.5 in the pearl river delta region during 2015 by numerical modeling. Environ. Pollut. 2020, 267, 115418. [Google Scholar] [CrossRef] [PubMed]
- Duan, L.; Yan, L.; Xiu, G. Online measurement of pm2.5 at an air monitoring supersite in yangtze river delta: Temporal variation and source identification. Atmosphere 2020, 11, 789. [Google Scholar] [CrossRef]
- Eeftens, M.; Tsai, M.Y.; Ampe, C.; Anwander, B.; Beelen, R.; Bellander, T.; Cesaroni, G.; Cirach, M.; Cyrys, J.; de Hoogh, K.; et al. Spatial variation of pm2.5, pm10, pm2.5 absorbance and pmcoarse concentrations between and within 20 european study areas and the relationship with no2—results of the escape project. Atmos. Environ. 2012, 62, 303–317. [Google Scholar] [CrossRef]
- Neophytou, A.M.; Yiallouros, P.; Coull, B.A.; Kleanthous, S.; Pavlou, P.; Pashiardis, S.; Dockery, D.W.; Koutrakis, P.; Laden, F. Particulate matter concentrations during desert dust outbreaks and daily mortality in nicosia, cyprus. J. Expo. Sci. Environ. Epid. 2013, 23, 275–280. [Google Scholar] [CrossRef]
- Green, M.; Xu, J. Causes of haze in the columbia river gorge. J. Air Waste Manag. 2007, 57, 947–958. [Google Scholar] [CrossRef][Green Version]
- Adaes, J.; Pires, J.C.M. Analysis and modelling of pm2.5 temporal and spatial behaviors in european cities. Sustainability 2019, 11, 6019. [Google Scholar] [CrossRef]
- Xu, G.; Jiao, L.M.; Zhang, B.E.; Zhao, S.L.; Yuan, M.; Gu, Y.Y.; Liu, J.F.; Tang, X. Spatial and temporal variability of the pm2.5/pm10 ratio in wuhan, central china. Aerosol. Air Qual. Res. 2017, 17, 741–751. [Google Scholar] [CrossRef]
- Munir, S. Analysing temporal trends in the ratios of pm2.5/pm10 in the uk. Aerosol. Air Qual. Res. 2017, 17, 34–48. [Google Scholar] [CrossRef]
- Sugimoto, N.; Shimizu, A.; Matsui, I.; Nishikawa, M. A method for estimating the fraction of mineral dust in particulate matter using pm2.5-to-pm10 ratios. Particuology 2016, 28, 114–120. [Google Scholar] [CrossRef]
- Speranza, A.; Caggiano, R.; Margiotta, S.; Trippetta, S. A novel approach to comparing simultaneous size-segregated particulate matter (pm) concentration ratios by means of a dedicated triangular diagram using the agri valley pm measurements as an example. Nat. Hazard. Earth Syst. 2014, 14, 2727–2733. [Google Scholar] [CrossRef]
- Gomez-Losada, A.; Pires, J.C.M.; Pino-Mejias, R. Time series clustering for estimating particulate matter contributions and its use in quantifying impacts from deserts. Atmos. Environ. 2015, 117, 271–281. [Google Scholar] [CrossRef]
- Escudero, M.; Querol, X.; Pey, J.; Alastuey, A.; Perez, N.; Ferreira, F.; Alonso, S.; Rodriguez, S.; Cuevas, E. A methodology for the quantification of the net african dust load in air quality monitoring networks. Atmos. Environ. 2007, 41, 5516–5524. [Google Scholar] [CrossRef]
- Stafoggia, M.; Zauli-Sajani, S.; Pey, J.; Samoli, E.; Alessandrini, E.; Basagana, X.; Cernigliaro, A.; Chiusolo, M.; Demaria, M.; Diaz, J.; et al. Desert dust outbreaks in southern europe: Contribution to daily pm10 concentrations and short-term associations with mortality and hospital admissions. Environ. Health Persp. 2016, 124, 413–419. [Google Scholar] [CrossRef]
- Gama, C.; Pio, C.; Monteiro, A.; Russo, M.; Fernandes, A.P.; Borrego, C.; Baldasano, J.M.; Tchepel, O. Comparison of methodologies for assessing desert dust contribution to regional pm10 and pm2.5 levels: A one-year study over portugal. Atmosphere 2020, 11, 134. [Google Scholar] [CrossRef]
- Goudie, A.S. Desert dust and human health disorders. Environ. Int. 2014, 63, 101–113. [Google Scholar] [CrossRef] [PubMed]
- Querol, X.; Tobias, A.; Perez, N.; Karanasiou, A.; Amato, F.; Stafoggia, M.; Garcia-Pando, C.P.; Ginoux, P.; Forastiere, F.; Gumy, S.; et al. Monitoring the impact of desert dust outbreaks for air quality for health studies. Environ. Int. 2019, 130, 104867. [Google Scholar] [CrossRef]
- Gomez-Losada, A.; Pires, J.C.M.; Pino-Mejias, R. Modelling background air pollution exposure in urban environments: Implications for epidemiological research. Environ. Modell Softw. 2018, 106, 13–21. [Google Scholar] [CrossRef]
- Dempster, A.P.; Laird, N.M.; Rubin, D.B. Maximum likelihood from incomplete data via the em algorithm. J. R. Stat. Soc. Ser. B 1977, 39, 1–38. [Google Scholar]
- Wu, X.D.; Kumar, V.; Quinlan, J.R.; Ghosh, J.; Yang, Q.; Motoda, H.; McLachlan, G.J.; Ng, A.; Liu, B.; Yu, P.S.; et al. Top 10 algorithms in data mining. Knowl. Inf. Syst. 2008, 14, 1–37. [Google Scholar] [CrossRef]
- Visser, I.; Speekenbrink, M. Depmixs4: An r package for hidden markov models. J. Stat. Softw. 2010, 36, 1–21. [Google Scholar] [CrossRef]
- R: A Language and Environment for Statistical Computing. Available online: http://www.R-project.org/ (accessed on 5 October 2020).
- Dias, J.G.; Vermunt, J.K.; Ramos, S. Mixture Hidden Markov Models in Finance Research, Advances in Data Analysis, Data Handling and Business Intelligence; Fink, A., Lausen, B., Seidel, W., Ultsch, A., Eds.; Springer: Berlin/Heidelberg, Germany, 2010; pp. 451–459. [Google Scholar]
- Visser, I.; Raijmakers, M.E.J.; Molenaar, P.C.M. Fitting hidden markov models to psychological data. Sci. Program. 2002, 10, 185–199. [Google Scholar] [CrossRef]
- Lenschow, P.; Abraham, H.J.; Kutzner, K.; Lutz, M.; Preuss, J.D.; Reichenbacher, W. Some ideas about the sources of pm10. Atmos. Environ. 2001, 35, S23–S33. [Google Scholar] [CrossRef]
- Vu, V.Q. A ggplot2 Based Biplot. Available online: http://github.com/vqv/ggbiplot (accessed on 5 October 2020).
- Liu, J.; Mauzerall, D.L.; Chen, Q.; Zhang, Q.; Song, Y.; Peng, W.; Klimont, Z.; Qiu, X.H.; Zhang, S.Q.; Hu, M.; et al. Air pollutant emissions from chinese households: A major and underappreciated ambient pollution source. Proc. Natl. Acad. Sci. USA 2016, 113, 7756–7761. [Google Scholar] [CrossRef] [PubMed]
- Huang, W.; Long, E.S.; Wang, J.; Huang, R.Y.; Ma, L. Characterising spatial distribution and temporal variation of pm10 and pm2.5 mass concentrations in an urban area of southwest china. Atmos. Pollut. Res. 2015, 6, 842–848. [Google Scholar] [CrossRef]
- Querol, X.; Perez, N.; Reche, C.; Ealo, M.; Ripoll, A.; Tur, J.; Pandolfi, M.; Pey, J.; Salvador, P.; Moreno, T.; et al. African dust and air quality over spain: Is it only dust that matters? Sci. Total Environ. 2019, 686, 737–752. [Google Scholar] [CrossRef]
- Perez, L.; Tobias, A.; Querol, X.; Kunzli, N.; Pey, J.; Alastuey, A.; Viana, M.; Valero, N.; Gonzalez-Cabre, M.; Sunyer, J. Coarse particles from saharan dust and daily mortality. Epidemiology 2008, 19, 800–807. [Google Scholar] [CrossRef]
- Salvador, P.; Alonso-Perez, S.; Pey, J.; Artinano, B.; de Bustos, J.J.; Alastuey, A.; Querol, X. African dust outbreaks over the western mediterranean basin: 11-year characterisation of atmospheric circulation patterns and dust source areas. Atmos. Chem. Phys. 2014, 14, 6759–6775. [Google Scholar] [CrossRef]
- Pérez, N.; Querol, X.; Alastuey, A.; Olivares, I.; Campos, A.; Hervás, M.; Cornide, M.J.; Javato, R.; Salvador, P.; Artínano, B.; et al. Episodios Naturales de Partículas 2018; Consejo Superior de Investigaciones Científicas (CSIC), Ministerio para la Transición Ecológica: Madrid, Spain, 2019. [Google Scholar]
- Pérez, N.; Querol, X.; Alastuey, A.; Orío, A.; Olivares, I.; Reina, F.; Hervás, M.; Cornide, M.J.; Javato, R.; Salvador, P.; et al. Episodios Naturales de Partículas 2016; CSIC, CIEMAT, Ministerio de Agricultura y Pesca, Alimentación y Medio Ambiente: Madrid, Spain, 2017. [Google Scholar]
- Pérez, N.; Querol, X.; Alastuey, A.; Orío, A.; Olivares, I.; Reina, F.; Hervás, M.; Cornide, M.J.; Javato, R.; Salvador, P.; et al. Episodios Naturales de Partículas 2017; CSIC, CIEMAT, Ministerio de Agricultura y Pesca, Alimentación y Medio Ambiente: Madrid, Spain, 2018. [Google Scholar]
- Pérez, N.; Querol, X.; Alastuey, A.; Orío, A.; Reina, F.; Pallarés, M.; Salvador, P.; Artínano, B.; de la Rosa, J. Episodios Naturales de Partículas 2015; CSIC, CIEMAT, Ministerio de Agricultura, Alimentación y Medio Ambiente: Madrid, Spain, 2016. [Google Scholar]
- Wang, Q.; Gu, J.; Wang, X. The impact of Sahara dust on air quality and public health in European countries. Atmos. Environ. 2020, 241, 117771. [Google Scholar] [CrossRef]
- Sun, P.; Nie, W.; Chi, X.; Xie, Y.; Huang, X.; Xu, Z.; Qi, X.; Xu, Z.; Wang, L.; Wang, T.; et al. Two years of online measurement of fine particulate nitrate in the western Yangtze River Delta: Influences of thermodynamics and N2O5 hydrolysis. Atmos. Chem. Phys. 2018, 18, 17177–17190. [Google Scholar] [CrossRef]
Publisher’s Note: MDPI stays neutral with regard to jurisdictional claims in published maps and institutional affiliations. |
© 2020 by the authors. Licensee MDPI, Basel, Switzerland. This article is an open access article distributed under the terms and conditions of the Creative Commons Attribution (CC BY) license (http://creativecommons.org/licenses/by/4.0/).

