Article

Low-Level Wind Shear Identification along the Glide Path at BCIA by the Pulsed Coherent Doppler Lidar

1
Institute for Advanced Ocean Study, College of Information Science and Engineering, Ocean Remote Sensing Institute, Ocean University of China, Qingdao 266100, China
2
North China Regional Air Traffic Management Bureau of CAAC, Beijing 100621, China
3
Qingdao Leice Transient Technology Co., Ltd., Qingdao 266100, China
4
Laboratory for Regional Oceanography and Numerical Modeling, Pilot National Laboratory for Marine Science and Technology (Qingdao), Qingdao 266200, China
*
Author to whom correspondence should be addressed.
Atmosphere 2021, 12(1), 50; https://doi.org/10.3390/atmos12010050
Submission received: 15 November 2020 / Revised: 22 December 2020 / Accepted: 28 December 2020 / Published: 31 December 2020
(This article belongs to the Special Issue Weather and Aviation Safety)

Abstract

:
Low-level wind shear is usually to be a rapidly changing meteorological phenomenon that cannot be ignored in aviation security service by affecting the air speed of landing and take-off aircrafts. The lidar team in Ocean University of China (OUC) carried out the long term particular researches on the low-level wind shear identification and regional wind shear inducement search at Beijing Capital International Airport (BCIA) from 2015 to 2020 by operating several pulsed coherent Doppler lidar (PCDL) systems. On account of the improved glide path scanning strategy and virtual multiple wind anemometers based on the rang height indicator (RHI) modes, the small-scale meteorological phenomenon along the glide path and/or runway center line direction can be captured. In this paper, the device configuration, scanning strategies, and results of the observation data are proposed. The algorithms to identify the low-level wind shear based on the reconstructed headwind profiles data have been tested and proved based on the lidar data obtained from December 2018 to January 2019. High spatial resolution observation data at vertical direction are utilized to study the regional wind shear inducement at the 36L end of BCIA under strong northwest wind conditions.

1. Introduction

With the rapid growth of passengers in the Beijing Capital International Airport (BCIA) (up to 100 million passengers per year), it is necessary to improve the airport operation efficiency and aviation safety. The terrain-induced wind shear and turbulence are notorious for their variability in intensity by affecting the aircraft airspeed during take-off and/or landing phases [1,2,3]. The disturbed wind speed profiles do more harm to the landing aircrafts than to the taking-off aircrafts, the focus of this paper was aimed on the landing aircraft and the operated landing ending. The criterion so-called “Obstacle Limitation Surfaces (OLS)” (ICAO Annex 14, Aerodromes) was introduced to verify the position and height of the planned constructions inside the airport. However, the obstacles in the vicinity of the airport are usually out of control as high plantings and mounts [4]. Constructions nearby the airport limited area can cause wakes, vortices, and turbulence that are disturbing to air traffic in certain meteorological conditions and/or under specific wind directions, as Figure 1 shows.
With the increasing emphasis on wind shear and the deployment of low level wind shear alerting system, the occurred rate of accidents related to low-level wind shear was reduced [4]. Nowadays, terminal control staff at most operational airport issued low level wind shear alerts with the help of terminal Doppler weather radar (TDWR), anemometer network and wind profilers [5]. The low-level wind shear alerting system (LLWAS) is a combine of the anemometer network, it was first utilized to alert the low-level wind shear at 1970s [6]. The accuracy of the LLWAS is decided by the density of configured anemometers. The spatial resolution of LLWAS is up to hundreds of meters, making it unable to observe small scale disturbance. The LLWAS is designed to detect the gust front and microburst. Hong Kong Observatory configured many weather buoys with anemometers surrounding the Hong Kong International Airport (HKIA) to extended capability of the LLWAS for the detection of the sea breeze induced wind shear events [7,8,9]. The microburst and gust front usually occurs with precipitation, thus the C-band TDWR with narrow beam was first developed by the Federal Aviation Administration (FAA) for wind shear alerting [10]. Many international airports in Southeast Asia installed TDWR for alerting of gust front and microburst due to its excellent performance under rainfall conditions [11,12,13,14]. However, TDWR is not available to contribute wind field information under the clean air conditions. The wind profilers were installed to obtain the vertical wind information above the located site. The wind profilers are not available to perform a glide path scan due to the lack of scanning device; thus; the wind profilers are often utilized to retrieval the background wind field. Lidar sensors have been proved to be flexible and effective remote sensing equipment to obtain detail information of wind, turbulence, wind turbine wake, aircraft wake vortices under non-rainy weather perform well in many projects [15,16,17,18].
The flexible lidar system has been utilized to measure turbulence, background wind information, and wind turbine wake characterization in complex terrain [19,20]. The coordinated virtual tower stares scanning pattern was developed to obtain accurate wind flow information [21]. The National Aerospace Laboratory (NLR) has qualified and quantified the wind disturbance more clearly than the existing ICAO guidelines. According to the detailed explanation of NLR, the speed deficit change of 6 knots must occur over a distance of at least 100 m. The fluctuation of wind speed induced by buildings would not do harm to the landing aircraft when the value is below 6 knots at the cross direction of the glide path [22].
The Hong Kong International Airport (HKIA) has made important explorations in the study of terrain induced wind shear observation and alerting. The complex orography around the HKIA poses a unique challenge to the detection and alerting of low-level wind shear. The HKIA was built on Chek Lap Kok Island. The mountainous Lantau Island with peaks rising to nearly 1000 m above ground level (AGL) and valleys as 400 m AGL is the prominent topography around the HKIA. To solve the problem of wind shear and turbulence monitor, Hong Kong Observatory configured several weather sensors including a TDWR; a network of anemometers on the surface, valleys, and hilltops; three weather buoys over the waters; two wind profilers over Lantau Island and two LIDAR systems at airport [23,24,25,26].
In terms of the BCIA, there are many high mounts and trees around the BCIA to its west (100 m away from the runway area), having peaks rising to nearly 30 m AGL as Figure 2 shows (The pictures were taken by Hongwei Zhang inside the BCIA on 30 November 2017).
By analyzing the historical wind direction and wind speed information of the three runways of BCIA from 1 January 2018 to 31 October 2019 (obtained by the supersonic anemometers, data number: 9459924), Runway 18R/36L is more likely to suffer from terrain induced wind shear especially under the western or northwest wind conditions (Figure 3). The results show that (1) The wind speed obtained by three anemometers configured at Runway 18R/36L are 55–65% lower than that measured at other endings under strong western wind (270°–320°) conditions. (2) The measured wind speed are 50–60% lower than those measured at other sites under the northwest wind (320°–350°) conditions, and the data of 36L endings are 60% lower. (3) There are nearly no significant difference between each sites under other prevailing wind conditions.
In this paper, the work utilized a pulsed coherent Doppler lidar (PCDL) system to observe and study the terrain induced wind shear at BCIA. The wind shear case studies proved by pilots’ reports were introduced.

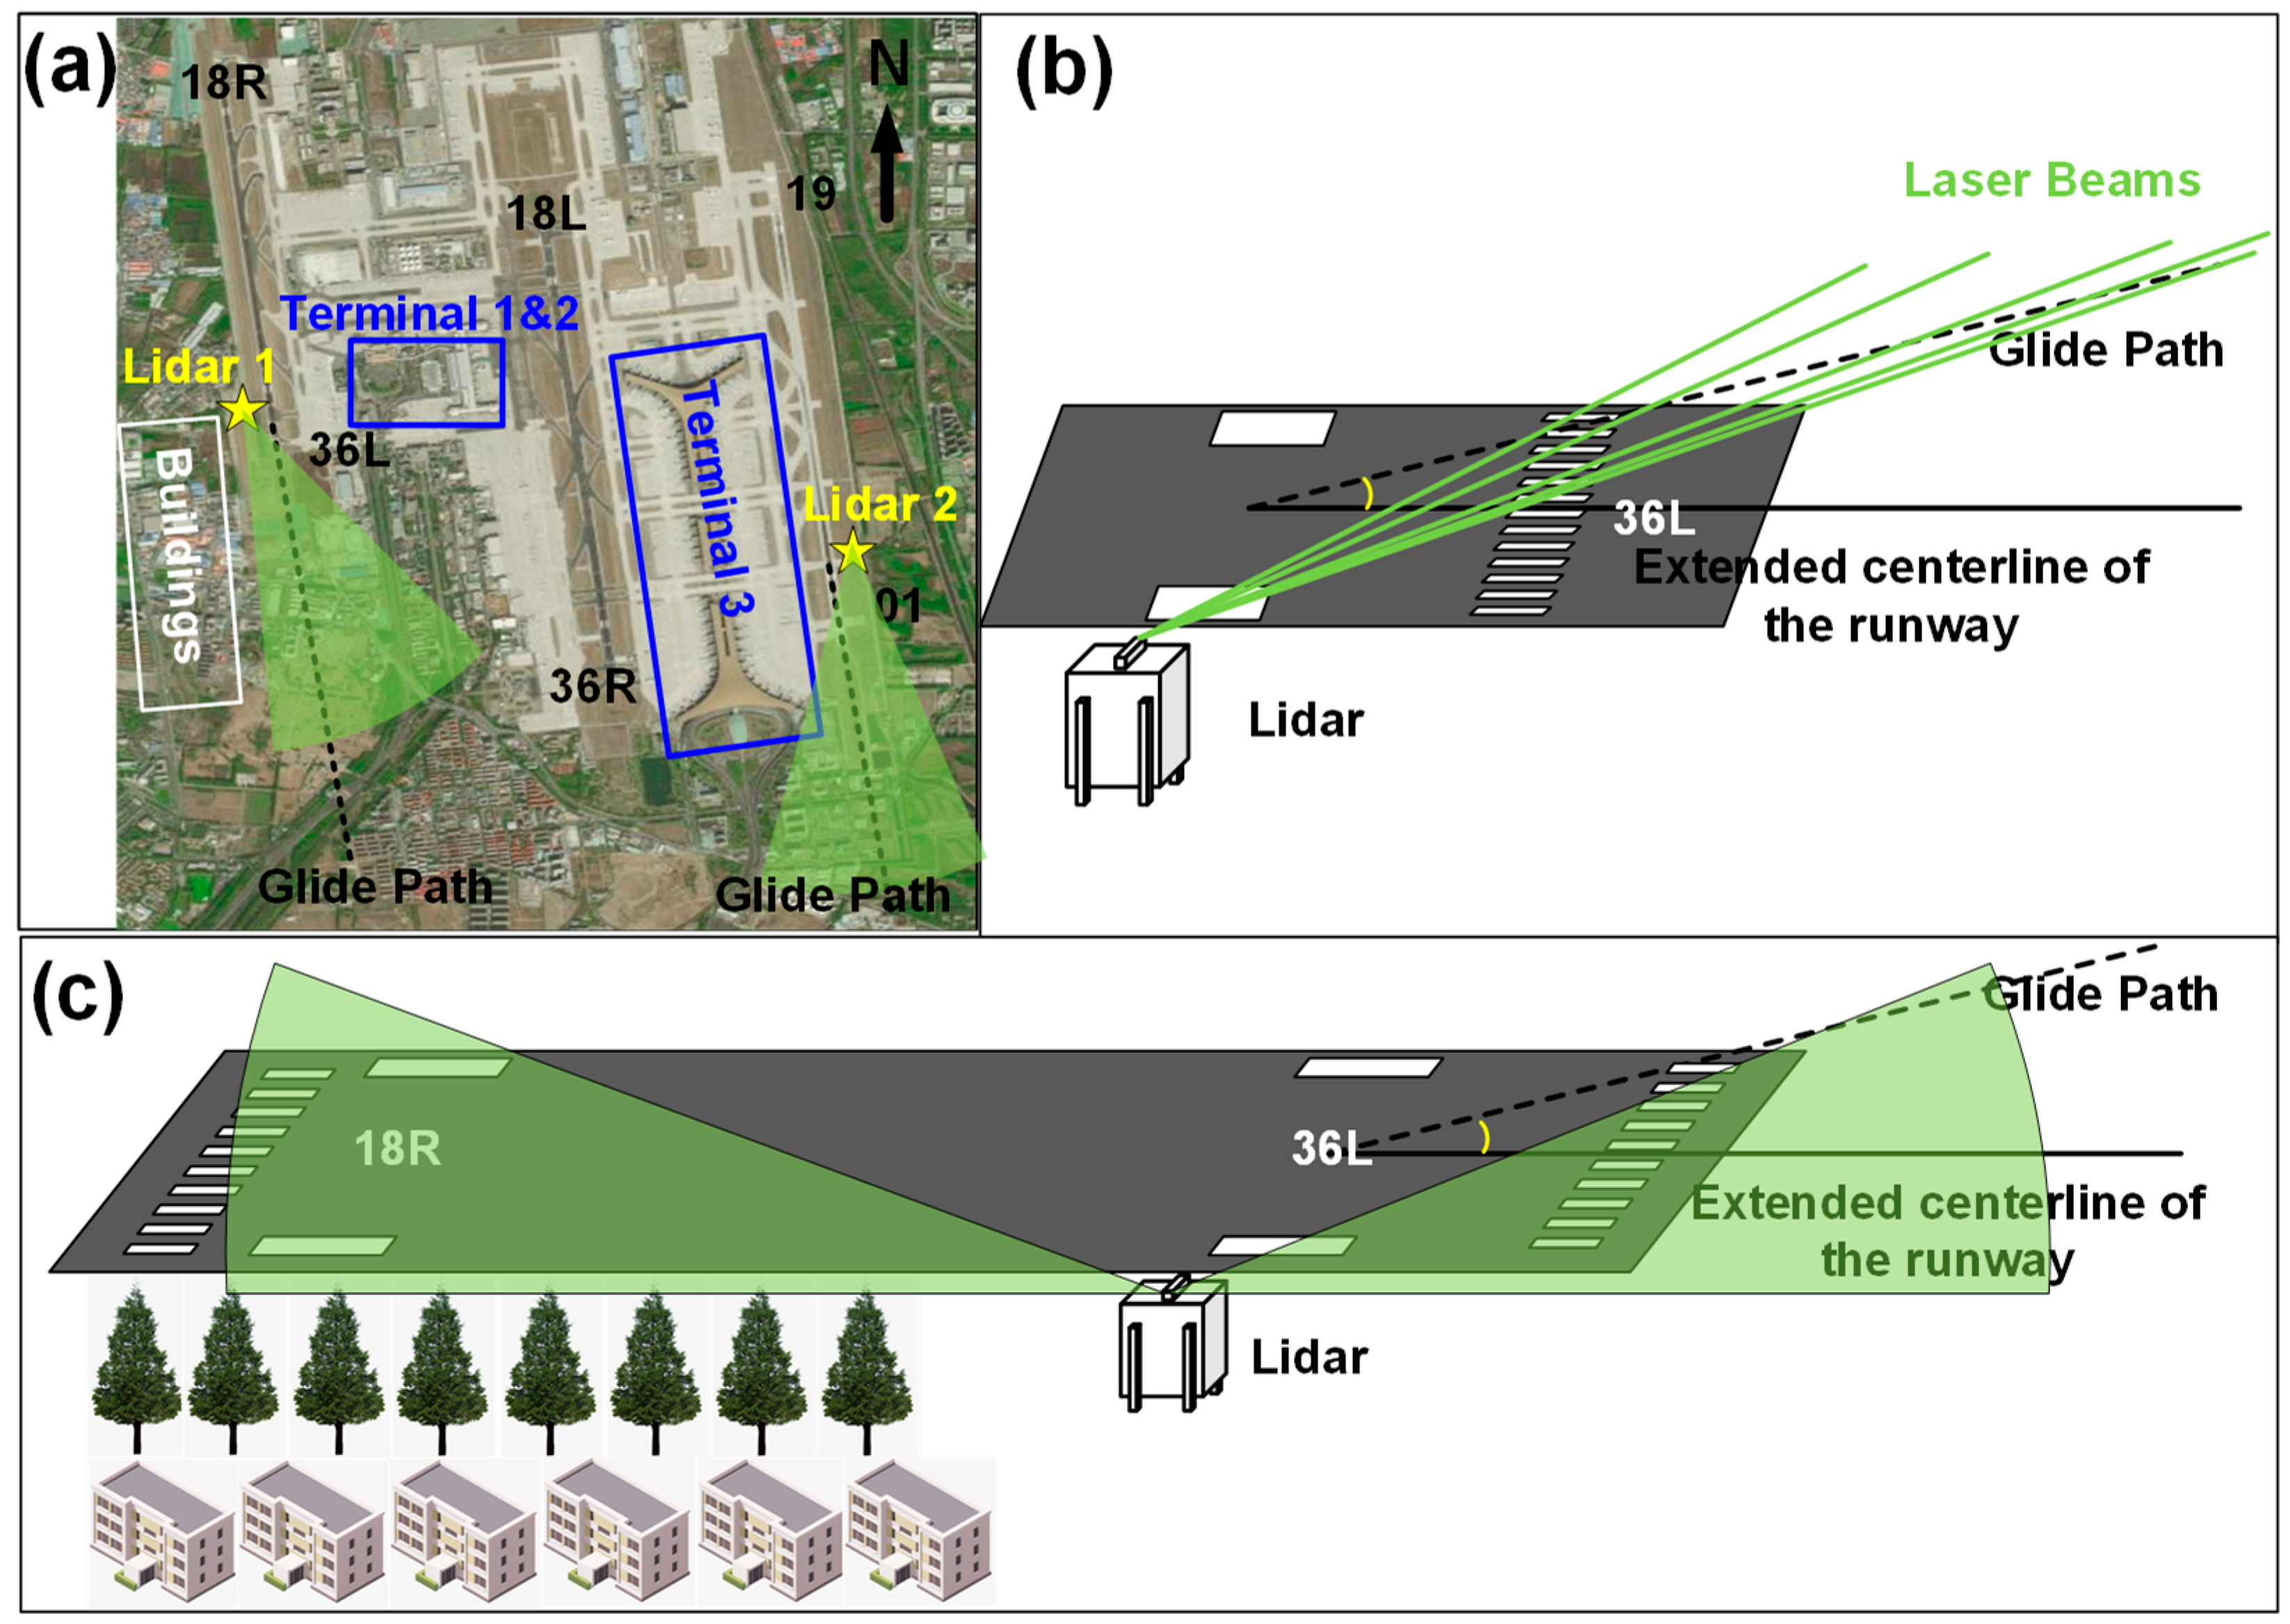
2. Device Configuration and Scanning Strategy

The OUC Lidar team carried out several field low level wind shear lidar observation campaigns at BCIA from 2015 to 2020 and designed different scanning modes for lidar observation of low level wind shear [27,28]. We have developed several types of PCDL for aviation meteorological application, including Wind Mast PBL, Wind3D 6000, and Wind3D 10 k, cooperated with the Qingdao Leice Transient Technology Co., Ltd. (Qingdao, China). The principle of the PCDL is to identify the frequency bias of radial backscattering information of aerosol particles which represents the movement of atmosphere along the laser beam pointing direction [29,30]. The wind field information could be induced by scanning the wind field with large span (usually ≥ 60°) [31]. Lidar system are flexible to achieve different scanning modes such as PPI (plane position indicator), RHI (range height indicator) and DBS (doppler beams swing) making it possible to capture small scale wind shear with quick evolution. The disturbed wind speed profiles do more harm to the landing aircrafts than to the taking-off aircrafts, the focus of this paper was aimed on the landing aircraft and the operated landing ending.
In this field campaign, one PCDL system was configured at the south ending (36L) of the Runway 36L/18R as shown in Figure 4a and another PCDL system with similar specifications was configured at the south ending (01) of Runway 01/19. Glide path scanning pattern was designed to fit the incident angle of aircraft landing path. The motivation of the glide path scanning pattern is to reveal the wind that the landing aircrafts would encounter. The pointing direction of laser beam was confirmed by calculating the relationship between the azimuth angles, distance to the centerline of runway and incident angle. The scheme of glide path scanning strategy is illustrated in Figure 4b.
For the study of terrain induced wind shear and lower wind speed occurred in Runway 18R/36L, RHI scanning mode was employed during the field campaign. The azimuth angles of RHI scanning mode have been set at 177° and 357° according to the runway direction and the pitching angle was set from 0° to 45°. The scanning diagram is illustrated as Figure 4c shows. This scanning mode can be used to study the influence of the surrounding geographical environment on the local wind field of the runway is explored by comparing the distribution of the runway low altitude vertical wind field under different prevailing wind direction conditions. Second, it is used to assist the analysis of wind field information around the runway when wind shear occurs.

3. Results

Glide path scanning strategy was designed to capture the wind shear over the glide path area and to construct the headwind profiles which reveal the wind turbulence that landing aircrafts would encounter. RHI scanning mode was operated to reveal the vertical wind field structure with high spatial resolution. Wind profiles depicting the horizontal wind velocity varying with height at different distance were retrieval from the RHI scanning pattern and it is effective tools to study the wind shear induced by the terrain.

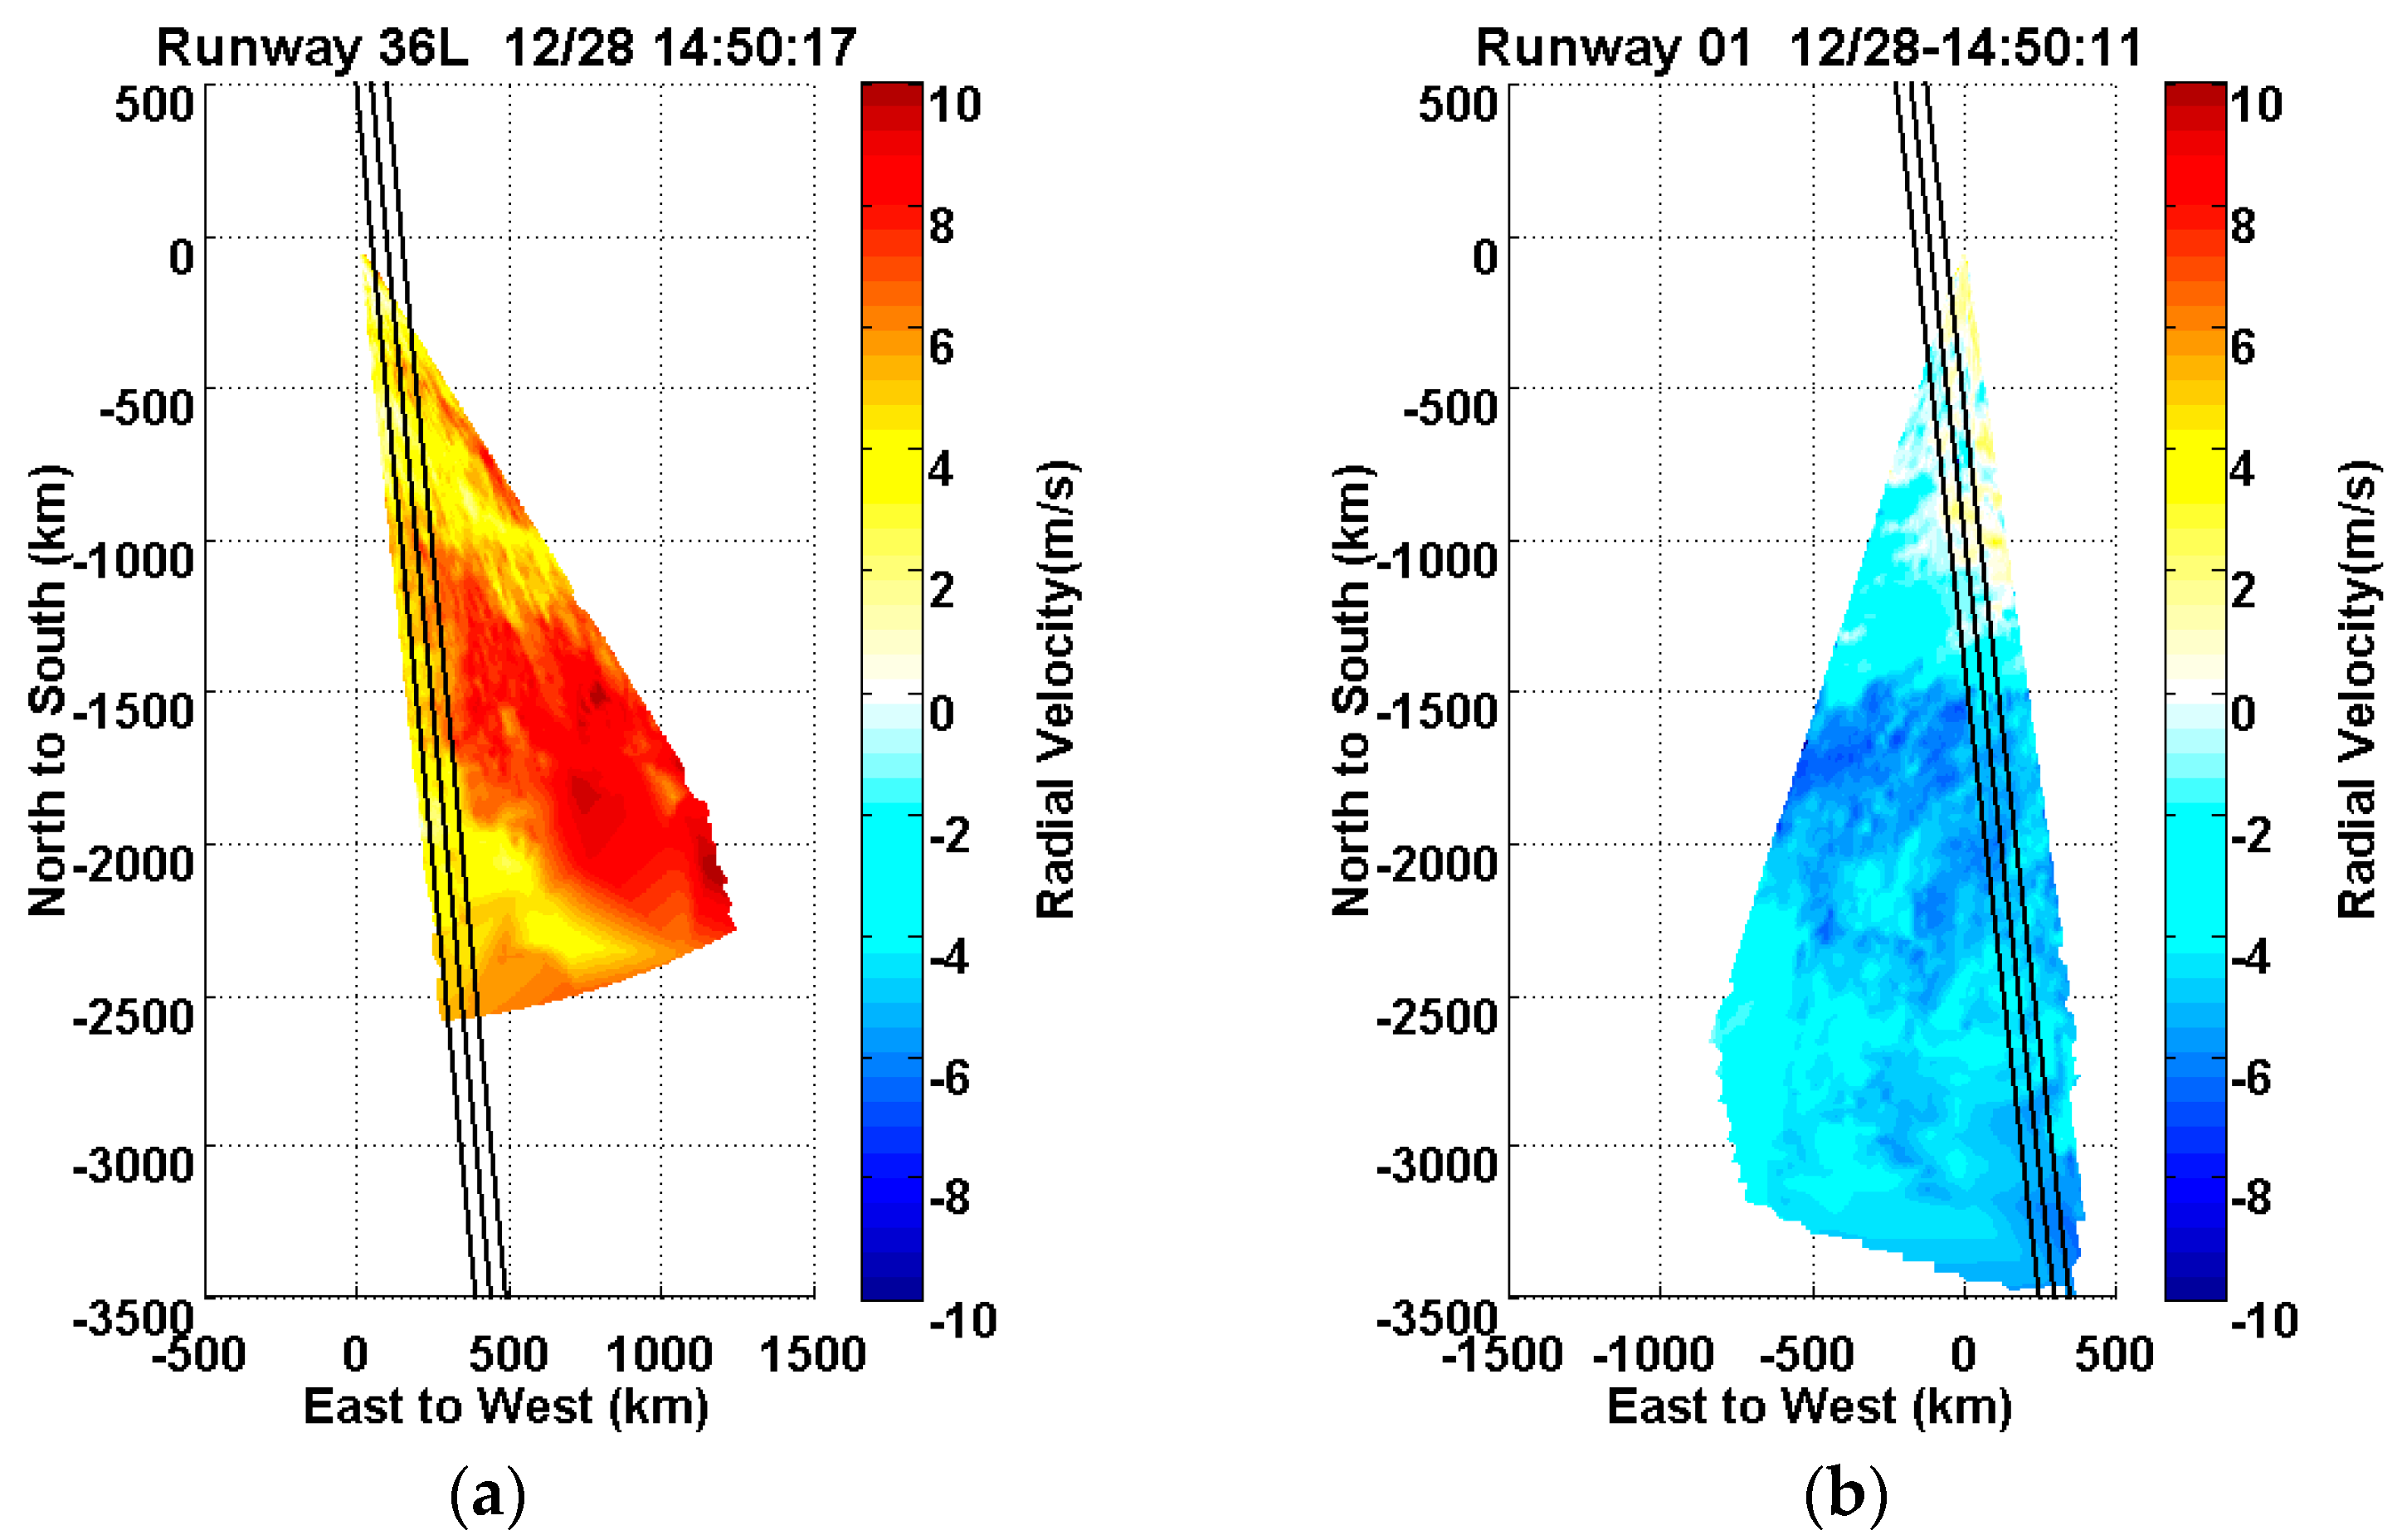
3.1. Glide Path Scanning

Wind information data (wind speed and wind direction) from the supersonic anemometer configured at Runway 01 and Runway 36L of the BCIA have been collected to illustrate the prevalent wind on the airport. From the Figure 5, we could conclude that the wind speed obtained by the supersonic anemometer are about 6 m/s, the wind speed of Runway 01 are slightly higher than those of Runway 36L. The prevalent wind on the airport is northwest wind.
Two PCDL systems were configured at 36L ending and 01 ending for glide path scanning separately. High spatial resolution airflow disturbances patterns have been captured by the PCDL system operated with glide path scanning mode as shown in Figure 6. The color in the Figure 6 represents the radial wind velocity (radial component of the wind vector at laser beam pointing direction). The red color indicate that particles flowing away from lidar, while the blue color represent the atmospheric particles flowing towards lidar system. The revisit time of the glide path scanning over glide path determines the capability of the PCDL system to capture the transient and small scale feature of the airflow disturbances. The temporal resolution of Glide Path Scanning is about 35 s in this study (nearly half time of the previous campaigns).
Three black lines in Figure 6 were illustrated to represent the relative distance between the PCDL system and the glide path of two runways. Three black lines depict the landing corridor of runway and these width are 100 m at total with taking the uncertainty with the flight path of the aircraft into consideration. From the Figure 6a, we could conclude that aircraft would suffer fluctuate headwind when it operated its landing process at that time. When it comes to the landing aircraft operated its landing process at Runway 01/19, the landing aircraft would suffer tailwind at height above 75 m (about 1500 m to the touch down area at horizontal direction. H = D × tan α , where D represents the horizontal distance to the touch down area, α is the incident angle of runway) and slight headwind at height below 75 m as Figure 6b illustrated. The reversion of wind are believed to arise from disruption of the northerly airflow by the Terminal 3 buildings (about 50 m above the ground surface, about 500 m to the centerline of Runway 01/19). The headwind profiles of Runway 36L/18R and Runway 01/19 were constructed to reveal the wind information of glide paths as shown in Figure 7. There are two criteria used for establishing beginning and the ending of turbulence. The first criterion is to calculate the wind shear intensity. The position of marker illustrated the position with maximum wind shear intensity. The second criterion is to identify the headwind speed difference along the whole glide path. The threshold to issuing wind shear alerting is set to 15 knots (gain or loss) following the internationally adopted wind shear alerting threshold. The second criterion has higher priority than the first criterion. The maximum wind speed difference of Runway 36L/18R is 5.48 m/s without wind shear alarm. While the wind speed fluctuation of Runway 01/19 is up to 9.91 m/s triggering the wind shear alarm. The wind shear alarm of Runway 01/19 has been proved by the pilot’s report at time 14:51 at height 75 m.
The wind shear report of the pilot during landing is very subjective, which is related to the pilot’s ability and aircraft type. Small-scale changes in wind speed (especially those less than the length of aircraft body) have little influence on the aircraft during landing process. Therefore, a parameter is needed to comprehensively consider the change value of wind speed and the change distance. Different pilots may have different reactions to the similar wind shear magnitude.
Severity factor I was firstly defined by Woodfield and Woods to descript the intensity of wind shear, the intensity of wind shear can be obtained by calculating
I = ( d V d t ) ( Δ V V a p p ) 2 = 1 V a p p | Δ V R 1 / 3 | 3
where Δ V / R 1 / 3 is the change rate of wind speed, Δ V is the total change of wind, V a p p means the normal approach speed of the aircraft, and R represents the ramp length as the study [32,33].
In this paper, we collected Glide path scans in the period of two months (December 2018 to January 2019) and calculated the wind shear severity factor as Figure 8 shows. Comparing with the carried out campaigns from 2015 to 2016 (published paper in 2019, H.W. Zhang et al., Infrared Physics and Technology 2019), the maximum ramp length in this study is 40 s (referring to 3000 m at spatial distance), assuming the typical approach speed at 75 m/s.
The severity factors of Runway 01/19 headwind profiles were represented by the blue dots (the maximum difference ≤15 knots) without wind shear alerting. The black dots depict the wind shear intensity scale of Runway 18R/36L. The red dots represent intensity of those headwind profiles whose maximum difference of wind speed exceed the alerting criterion. The alerting line is calculated by taking the ICAO criterion (maximum difference is 15 kts) and ramp length into Equation (1) as the dotted line in Figure 8. To avoid the false alarm due to the sharpen change of speed with shorter ramp length (as published paper illustrated), the improved algorithm in this paper smoothed the headwind profiles and limited the ramp length. From the Figure 8, we can find that the wind shear intensity scale of two runways are maintained at relative low level (0.03–0.1 m1/3s−2/3) at most part of time. Identifying the wind shear by single criterion (maximum difference of headwind profile or wind shear severity factor) may cause false alarm.
In the published paper, we have discussed the shortage of the criterion based on the headwind profiles with short ramp length. The method to setting a threshold to the maximum difference is more reliable than to identify the wind shear intensity scale especially for the headwind profiles with short ramp length. The gradient of headwind profiles with long ramp length usually slows down with the same speed difference, and the pilots of landing aircrafts may not report the wind shear events to the terminal office.
The terrain around the BCIA is complex, including small mount, artificial lake, buildings, and turfed area. To study the influence of Terminal 3 buildings to the Runway 01/19, CFD (computational fluid dynamics) software were utilized to simulate the wind field of BCIA under strong northwest wind conditions as Figure 9 shows. The domain of the simulation has a size of 5200 m (length) × 4000 m (width) and the top of the domain reaches a height of 300 m (height) with spatial resolution of 10 m. To study the influence of Terminal 3 on the glide path of Corridor 01, simulation domain in this paper was divided into two parts for performing a discretization with mixed grid system. The mixed grid system ensures calculation efficiency and high resolution over interested area. The vital important settings in the simulation are input data and boundary settings. The lateral boundaries and the top boundary were set as velocity-inlet type and bottom boundary is set as a non-slip wall. The RNG k ε turbulence model were set in the simulation. The input wind profiles in the simulation are obtained by the PCDL system operated at DBS mode. The blind area of wind profiles obtained by lidar is about 40 m, the wind information from 0 m to 40 m above ground level were calculated by the power law:
V = V 10 × ( z 10 ) α
where V 10 is the wind speed at 10 m height, α is the coefficient related to the roughness of ground.

3.2. Wind Profiles Obtained by RHI Scanning Mode

The horizontal wind speed along the runway direction obtained by PCDL system operated at RHI scanning mode are shown in Figure 10. The horizontal axis represents the distance to the PCDL system with positive values to the south of the lidar location and negative values meaning the north to the lidar. In the Figure 10, the color represents the horizontal velocity along the runway direction which is the component of the wind vector (the wind direction is northern wind). The red and the blue colors indicate the value of horizontal velocity along the runway direction. Wind profiles retrieved from the lidar operated at RHI scanning mode in Figure 10 have much higher vertical spatial resolution and lower blind area compared with the production of lidar for wind profiles. The spatial resolution of lidar systems for wind profiles is mainly limited to the laser pulsed width and the setting of pitch angles. Vertical black lines illustrated the virtual wind masts in this paper utilized to retrieval the wind profiles and the inclined black lines represent the glide path of Runway 36L/18R and Runway 01/19, respectively. The wind velocity at different height represents the horizontal wind velocity retrieved from the radial wind velocity, taking pitch angle into consideration. Figure 8 depicts high-resolution vertical stratifications of horizontal velocity above two runway limited area. The horizontal velocity of Runway 36L/18R are lower than those of Runway 01/19. The wind speed stratifications of Runway 36L/18R are higher at height than those of Runway 01/19.
To analyze the wind shear caused by the structures around the airport area, wind profiles along the runway are shown in Figure 11, illustrating the horizontal wind velocity varying with the height at different distances to the PCDL system. Wind profiles illustrated in Figure 11 are depicting the horizontal wind velocity varying with height at different distance assuming the wind direction is steady within one RHI scanning pattern. Nearly all the profiles illustrated that the horizontal velocity of Runway 36L/18R are lower than those of Runway 01/19 below height 200 m. The horizontal velocity difference decreased to zero with the distance increased to 1200 m south to the PCDL system.
The figure can be used to analyze wind speed distribution in high and low space, background wind speed and wind field characteristics at different horizontal distances from the PCDL system. During the wind shear warning, the figure can assist the windward structure analysis of the glide path to judge the degree of turbulence during the aircraft approach.

4. Discussion

According to the long term lidar observation and historical data analyzing, the landing aircrafts of BCIA are more likely to suffer the terrain-induced wind shear by the terminal buildings, high trees and mounds under northwest wind conditions. The wind speed measured by anemometers and the PCDL systems support the conclusion that the wind speed of Runway 36L are lower than those of Runway 01 at the same time.

4.1. Glide Path Scanning Strategy

Glide path scanning strategy in this paper is designed to retrieve the headwind profiles (the scanning azimuthal angles are nearly corresponding to the runway direction), when it comes to the wind component flowing perpendicular to runway direction towards the aircraft, it is not possible to effectively capture the cross wind from the radial wind. However, the cross wind shear are also great threats to the landing aircraft under strong wind conditions.

4.2. RHI Scanning Mode

Algorithm of retrieving the wind profiles from RHI scanning mode have been developed. The most important assumption in this method is that the wind direction is steady within one RHI scanning pattern. The wind velocity at different height represents the horizontal wind velocity retrieved from the LOS wind velocity, taking pitch angle into consideration and ignoring the influence of the vertical airflow.

4.3. Wind Shear Alerts

In the current study, we adopted the ICAO suggested criterion for issuing wind shear alerts. The wind shear intensity were calculated by taking wind velocity difference, approach speed of aircraft, and ramp length into consideration. The normal approach speed of aircraft is set at 75 m/s. The ramp length means the incline ramp length (not the horizontal distance).

5. Conclusions

In this paper, the complex three-dimensional wind field inversion of east and west runways of BCIA have been carried out by operating the PCDL system at PPI model, RHI model and Glide Path scanning model to study the influence of complex terrain. According to the above observation data, the runway wind field measured by PCDL system under different wind direction conditions and the runway wind field based on CFD simulation were analyzed. The influence of Terminal 3 buildings on the wind field were explored, and the reasons for the difference between the Runway 36L/18R and the Runway 01/19 were further analyzed. The PCDL system has been proved to be effective tool to observe the terrain induced low level wind shear at BCIA under non-rainy conditions.
The most important conclusions of the current work may be summarized as follows:
  • The PCDL systems utilized in this paper are effective tools to detect the wind shear events at a high spatial and temporal resolution.
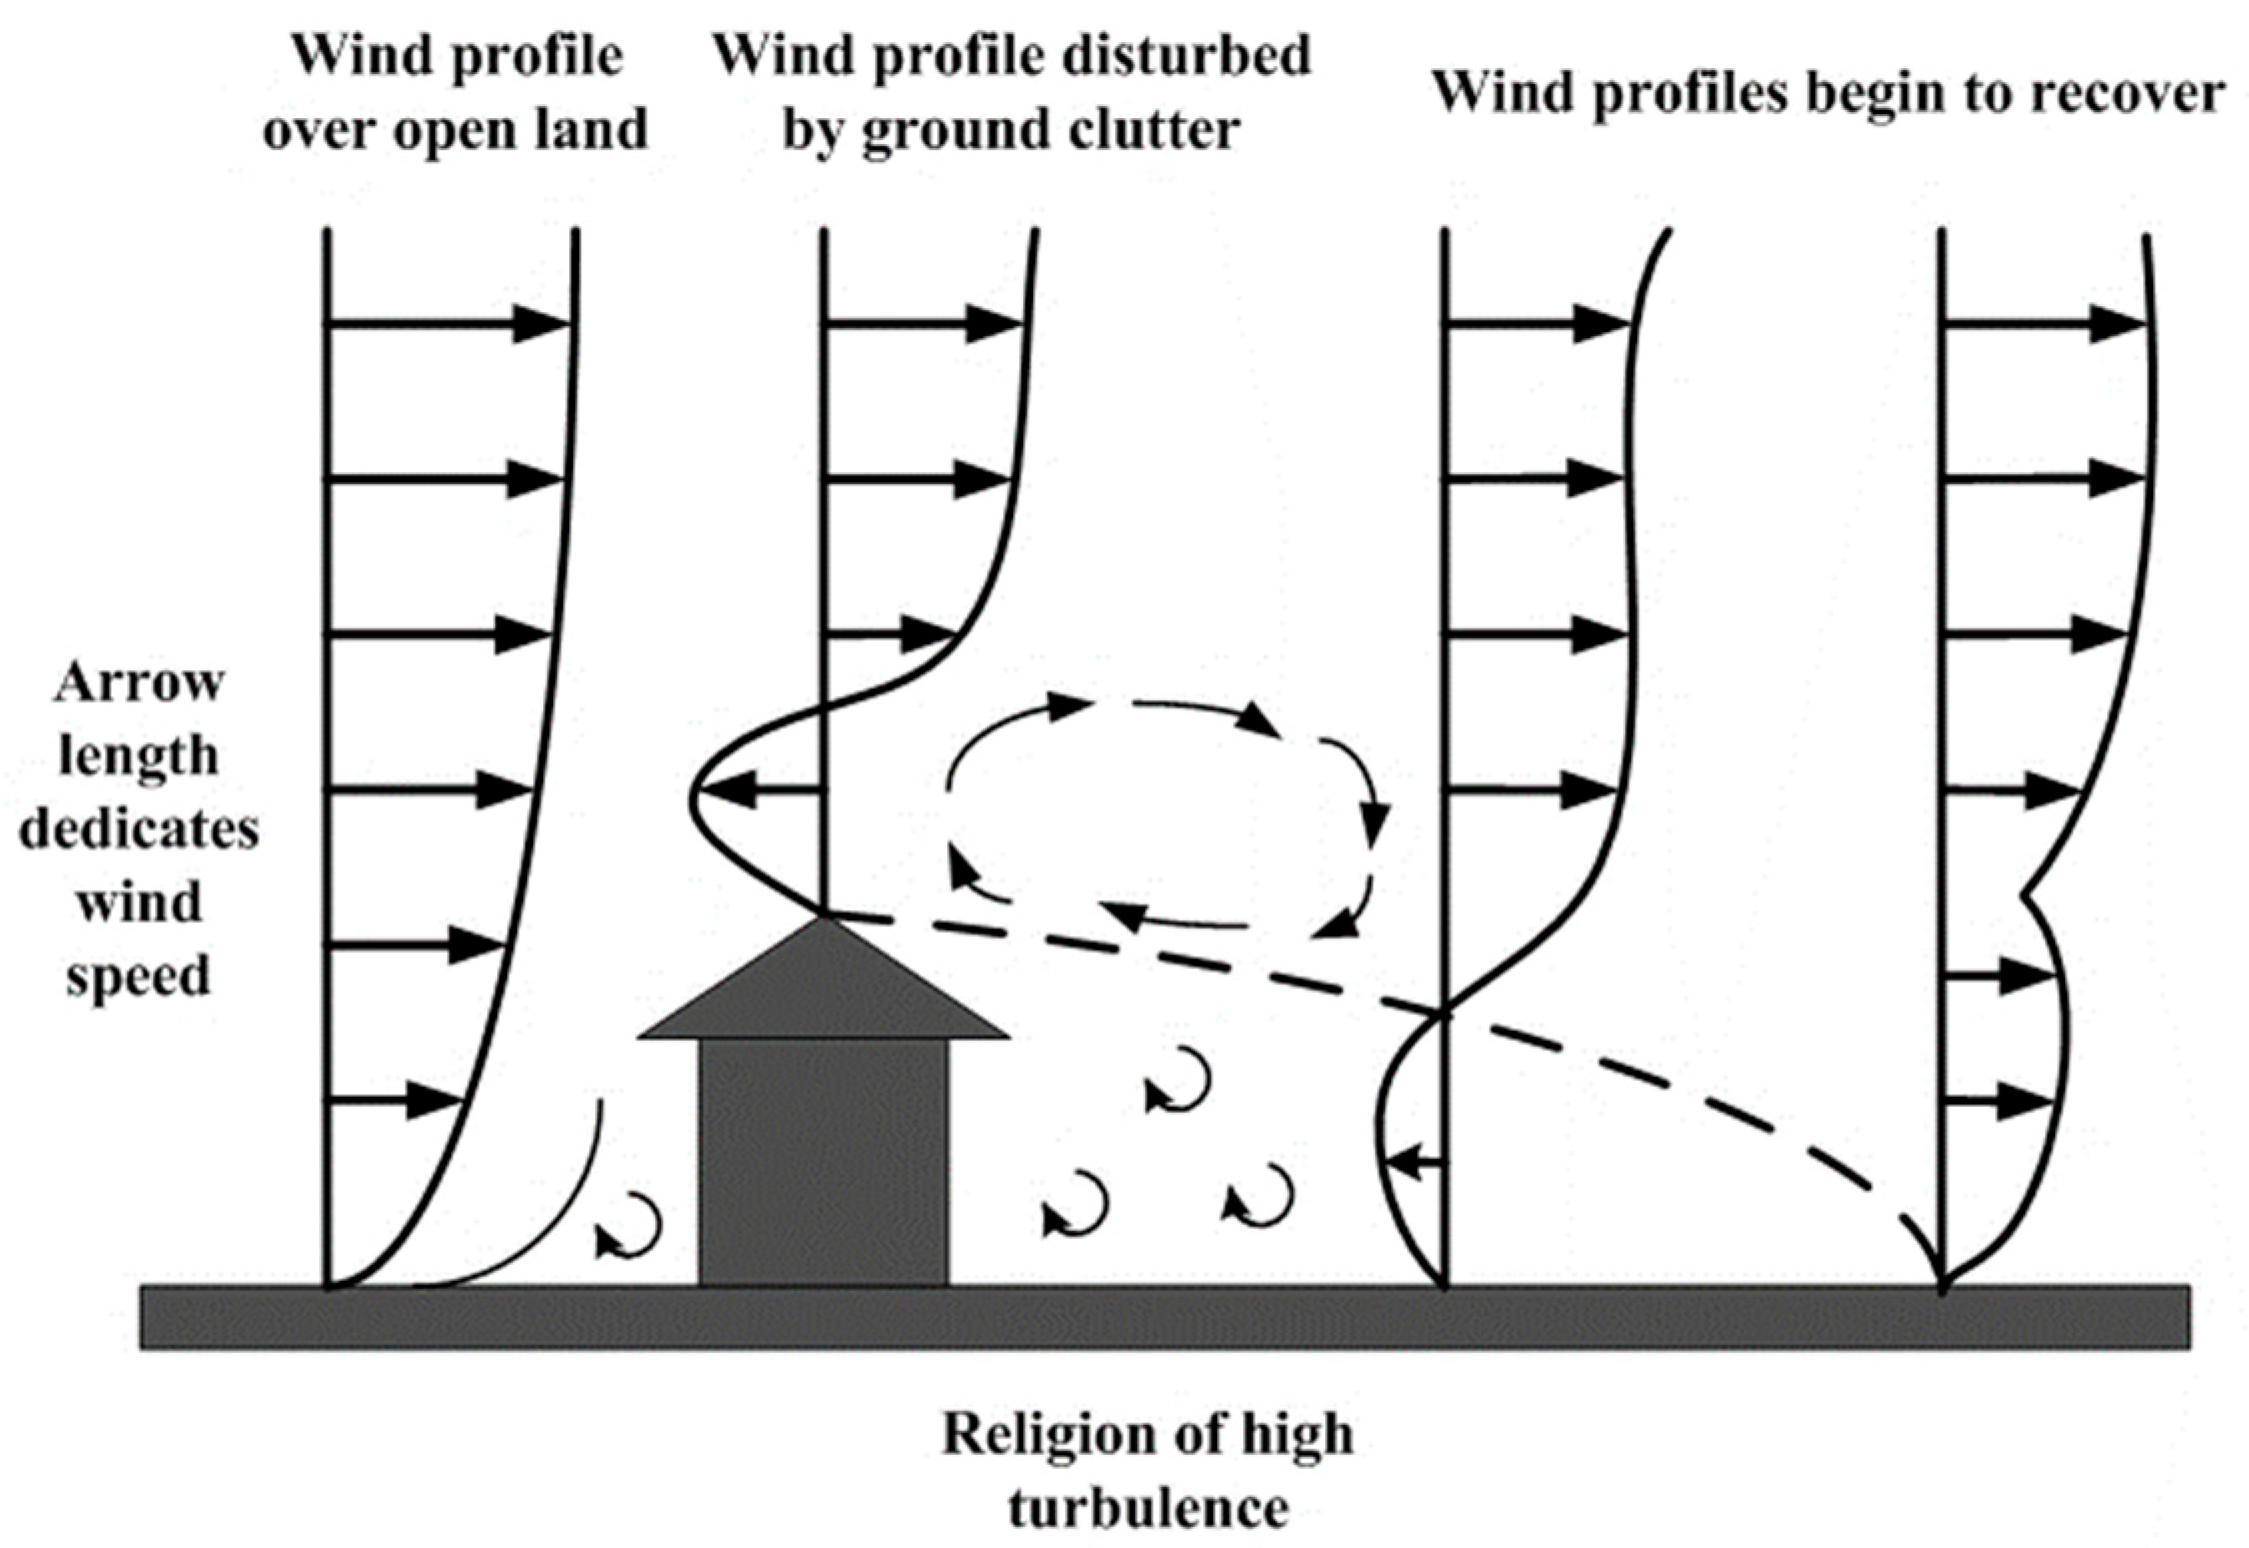
  • The core of the paper is aimed at quantifying the effect of terrain induced wind turbulence on the response and performance of landing aircraft.
  • Different observation modes (including the Glide path scanning and RHI scanning) have been designed to study the terrain induced wind shear events.
  • The PCDL system should not perform as a stand-alone wind shear detection system and it is a great complementary system to traditional radar systems.
Future works:
  • Collecting the data of PCDL system under notable meteorological conditions to assess the ability of wind shear measurement by PCDL systems.
  • Alerting the great threats caused by the cross wind to the landing aircraft under strong wind conditions.
  • Optimization of the pre-warning software interface and the reduction of the false alarm rate.

Author Contributions

Conceptualization, H.Z., X.L., and S.W.; methodology, H.Z., X.L., and Q.W.; validation, X.L., X.Z., and H.Z.; formal analysis, X.L., R.L., and H.Z.; investigation, H.Z. and K.Z.; data curation, X.L., X.Z., Z.H., and H.Z.; writing—original draft preparation, H.Z.; writing—review and editing, H.Z., S.W., Z.H., and J.T.; supervision, S.W.; project administration, S.W. and J.Z.; funding acquisition, S.W. All authors have read and agreed to the published version of the manuscript.

Funding

This work was a collaborated research project between the CAAC North China Regional Administration and Ocean University of China. This work was jointly supported by National Key Research and Development Program of China (2016YFC1400904, 2019YFC1408002), National Natural Science Foundation of China (No.41375016, No.41471309).

Institutional Review Board Statement

Not applicable.

Informed Consent Statement

Informed consent was obtained from all subjects involved in the study.

Data Availability Statement

Data sharing not applicable to this article as no datasets were generated or analyzed during the current study. The raw data required to reproduce these findings cannot be shared at this time as the data also forms part of an ongoing study.

Acknowledgments

We thank our colleagues for their kindly support during the field experiments, including Wei Zhong from North China Regional Air Traffic Management Bureau of CAAC for data collection; Xitao Wang and Yilin Qi from Qingdao Leice technology Inc. for operating the lidar at BCIA; Jiaping Yin from Qingdao Leice technology Inc. for data collection; Bin Yin, Guangyao Dai, Xinyu Zhang, Pei Chen, Xiaoye Wang, and Xiaomin Chen from Ocean University of China for discussion and suggestions.

Conflicts of Interest

The authors declare no conflict of interest.

References

  1. International Civil Aviation Organization. International standards and recommended practices. In Aerodromes Annex 14, Volume 1 Aerodrome Design and Operations; Chapter 4: Obstacle Restriction and Removal; International Civil Aviation Organization: Montréal, QC, Canada, 1995; pp. 252–254. [Google Scholar]
  2. Chun, H.Y.; Kim, J.H.; Lee, D.B.; Kim, S.H.; Strahan, M.; Pettegrew, B.; Lee, Y.G. Research collaborations for better predictions of aviation weather hazards. Bull. Am. Meteorol. Soc. 2017, 98, ES103–ES107. [Google Scholar] [CrossRef]
  3. Sharman, R.; Lane, T. Aviation Turbulence; In Springer International Publishing: Cham, Switzerland, 2016; Volume 10, pp. 978–981. [Google Scholar]
  4. Hallowell, R.G.; Cho, J.Y. Wind-Shear System Cost-Benefit Analysis. Linc. Lab. J. 2010, 18, 47–68. [Google Scholar]
  5. Armijo, L. A theory for the determination of wind and precipitation velocities with Doppler radars. J. Atmos. Sci. 1969, 26, 570–573. [Google Scholar] [CrossRef]
  6. ICAO. Manual on Low-Level Wind Shear and Turbulence, 1st ed.; International Civil Aviation Organization: Montréal, QC, Canada, 2005; p. 222. [Google Scholar]
  7. Shun, C.M.; Johnson, D.B. Implementation of a terminal Doppler weather radar for the new Hong Kong International Airport at Chek Lap Kok. In Proceedings of the Sixth Conference on Aviation Weather Systems, Dallas, TX, USA, 15–20 January 1995; pp. 530–534. [Google Scholar]
  8. Shun, C.M.; Chan, P.W. Applications of an infrared Doppler lidar in detection of wind shear. J. Atmos. Ocean. Technol. 2008, 25, 637–655. [Google Scholar] [CrossRef]
  9. Hon, K.K.; Chan, P.W. Application of LIDAR-derived eddy dissipation rate profiles in low-level wind shear and turbulence alerts at Hong Kong International Airport. Meteorol. Appl. 2014, 21, 74–85. [Google Scholar] [CrossRef]
  10. Weber, M.E.; Noyes, T.A. low level wind shear detection with airport surveillance radars. IEEE Aerosp. Electron. Syst. Mag. 1995, 10, 3–9. [Google Scholar] [CrossRef]
  11. Evans, J.E.; Bernella, D.M. Terminal Doppler weather radar (TDWR) coverage of satellite airports. In Proceedings of the 19th Digital Avionics Systems Conference, Philadelphia, PA, USA, 7–13 October 2000. [Google Scholar] [CrossRef]
  12. Sobli, N.H.M.; Ismail, A.F.; Isa, F.N.M.; Mansor, H. Initial assessment of radar reflectivity-rainfall rate, ZR relationships for moderate rain events in Malaysia. In Proceedings of the 2013 IEEE Symposium on IEEE Wireless Technology and Applications (ISWTA), Kuching, Malaysia, 22–25 September 2013; pp. 187–191. [Google Scholar] [CrossRef]
  13. Adachi, T.; Kusunoki, K.; Yoshida, S.; Arai, K.I.; Ushio, T. High-Speed Volumetric Observation of a Wet Microburst Using X-Band Phased Array Weather Radar in Japan. Mon. Weather Rev. 2016, 144, 3749–3765. [Google Scholar] [CrossRef]
  14. Barbaresco, F. Radar/lidar sensors for wind & wake-vortex monitoring on airport: First results of SESAR P12. 2.2 XP0 trials campaign at Paris CDG airport. Wake Turbulence in Current Operations and Beyond. In Proceedings of the WakeNet3–Europe Fourth Major Workshop, Langen, Germany, 28–29 February 2012. [Google Scholar]
  15. Wu, S.; Liu, B.; Liu, J.; Zhai, X.; Feng, C.; Wang, G.; Gallacher, D. Wind turbine wake visualization and characteristics analysis by Doppler lidar. Opt. Express 2016, 24, A762–A780. [Google Scholar] [CrossRef]
  16. Zhai, X.; Wu, S.; Liu, B. Doppler lidar investigation of wind turbine wake characteristics and atmospheric turbulence under different surface roughness. Opt. Express 2017, 25, A515–A529. [Google Scholar] [CrossRef]
  17. Liu, X.Y.; Wu, S.H.; Zhang, H.W.; He, Z.Q.; Zhang, J.J.; Wang, X.Y.; Chen, X.M. Low-level wind shear observation based on different physical mechanisms by coherent Doppler lidar. J. Infrared Millim. Waves 2020, 39, 491–504. [Google Scholar] [CrossRef]
  18. Li, L.Q.; Shao, A.M.; Zhang, K.J.; Ding, N.; Chan, P.-W. Low-level wind shear characteristics and lidar-based alerting at Lanzhou Zhongchuan International Airport, China. J. Meteorol. Res. 2020, 34, 633–645. [Google Scholar] [CrossRef]
  19. Pauscher, L.; Vasiljevic, N.; Callies, D.; Lea, G.; Mann, J.; Klaas, T.; Courtney, M. An inter-comparison study of multi-and DBS lidar measurements in complex terrain. Remote Sens. 2016, 8, 782. [Google Scholar] [CrossRef] [Green Version]
  20. Choukulkar, A.; Brewer, W.A.; Sandberg, S.P.; Weickmann, A.; Bonin, T.A.; Hardesty, R.M.; Debnath, M. Evaluation of single and multiple Doppler lidar techniques to measure complex flow during the XPIA field campaign. Atmos. Meas. Tech. 2017, 10, 247–264. [Google Scholar] [CrossRef] [Green Version]
  21. Fuertes, F.C.; Iungo, G.V.; Porté-Agel, F. 3D turbulence measurements using three synchronous wind lidars: Validation against sonic anemometry. J. Atmos. Ocean. Technol. 2014, 31, 1549–1556. [Google Scholar] [CrossRef]
  22. Nieuwpoort, A.M.H.; Gooden, J.H.M.; de Prins, J.L. Wind Criteria due to Obstacles at and around Airports. In National Aerospace Laboratory NLR-TP-2010-312 (Classification Report); Springer: Amsterdam, The Netherlands, 2010; pp. 4–5. [Google Scholar]
  23. Chan, P.W.; Lee, Y.F. Application of short-range lidar in wind shear alerting. J. Atmos. Ocean. Technol. 2012, 29, 207–220. [Google Scholar] [CrossRef]
  24. Hon, K.K.; Chan, P.W.; Chiu, Y.Y.; Tang, W. Application of short-range LIDAR in early alerting for low-level wind shear and turbulence at Hong Kong international airport. Adv. Meteorol. 2014, 2014, 1–8. [Google Scholar] [CrossRef]
  25. Hon, K.K. Predicting Low-Level Wind Shear Using 200-m-Resolution NWP at the Hong Kong International Airport. J. Appl. Meteorol. Climatol. 2020, 59, 193–206. [Google Scholar] [CrossRef]
  26. Chan, P.W.; Li, Q.S. Some observations of low level wind shear at the Hong Kong International Airport in association with tropical cyclones. Meteorol. Appl. 2020, 27, e1898. [Google Scholar] [CrossRef]
  27. Zhang, H.; Wu, S.; Wang, Q.; Liu, B.; Yin, B.; Zhai, X. Airport low-level wind shear lidar observation at Beijing Capital International Airport. Infrared Phys. Technol. 2019, 96, 113–122. [Google Scholar] [CrossRef] [Green Version]
  28. Zhang, H.; Wang, Q.; Wu, S. Low-Level Wind Shear Observation at Beijing Capital International Airport Based on Coherent Doppler Lidar. J. Atmos. Environ. Opt. 2018, 13, 34. [Google Scholar] [CrossRef]
  29. Smalikho, I.N.; Banakh, V.A.; Pichugina, Y.L.; Brewer, W.A.; Banta, R.M.; Lundquist, J.K.; Kelley, N.D. Lidar investigation of atmosphere effect on a wind turbine wake. J. Atmos. Ocean. Technol. 2013, 30, 2554–2570. [Google Scholar] [CrossRef]
  30. Sathe, A.; Mann, J. A review of turbulence measurements using ground-based wind lidars. Atmos. Meas. Tech. 2013, 6, 3147–3167. [Google Scholar] [CrossRef] [Green Version]
  31. Kasler, Y.; Rahm, S.; Simmet, R. Wake measurements of a multi-MW wind turbine with coherent long-range pulsed Doppler wind lidar. J. Atmos. Ocean. Technol. 2010, 27, 1529–1532. [Google Scholar] [CrossRef] [Green Version]
  32. Woodfield, A.; Woods, J.F. Wind Shear from Headwind Measurements on British Airways B747-236 Aircraft; Royal Aircraft Establishment Bedford: Bedford, UK, 1981. [Google Scholar]
  33. Woodfield, A.; Woods, J.F. Worldwide Experience of Wind Shear during 1981–1982; Royal Aircraft Establishment Bedford: Bedford, UK, 1983. [Google Scholar]
Figure 1. Scheme of wind shear caused by surface obstructions.
Atmosphere 12 00050 g001
Figure 2. Site photograph of Runway 18R/36L at BCIA. (a) facing to the North, high mount, and trees located around the Runway 18R ending; (b) facing to the South, high trees located around the Runway 36L ending.
Atmosphere 12 00050 g002
Figure 3. Wind speed obtained by supersonic anemometers configured at Runway 01 and Runway 36L.
Atmosphere 12 00050 g003
Figure 4. Configuration of lidar system and scanning strategy at Beijing Capital International Airport (BCIA). (a) Top view of the BCIA; (b) scheme of glide path scanning mode; (c) scheme of rang height indicator (RHI) scanning mode to identify the terrain induced wind shear.
Atmosphere 12 00050 g004
Figure 5. Wind information obtained by supersonic anemometers configured at Runway 01 and Runway 36L from 14:00 to 15:00 December 28.
Atmosphere 12 00050 g005
Figure 6. Radial speed obtained by pulsed coherent Doppler lidar (PCDL) system operated at Glide path scanning mode. (a) Glide path scanning pattern of Runway 36L; (b) Glide path scanning pattern of Runway 01.
Atmosphere 12 00050 g006
Figure 7. Headwind profile retrieved from the pointing direction scanning mode obtained by the PCDL system at BCIA.
Atmosphere 12 00050 g007
Figure 8. Wind shear intensity-ramp length diagram over 36L corridor and 01 corridor in the period of two months.
Atmosphere 12 00050 g008
Figure 9. Wind field of BCIA simulated by computational fluid dynamics (CFD) software. (a) Top view of BCIA at 30 m height; (b) Section plane of the Runway 01/19; (c) Section plane of the glide path; (d) Headwind profiles of Runway 01/19 under northwest wind at 14 m/s.
Atmosphere 12 00050 g009
Figure 10. Horizontal velocity along the runway direction obtained by the PCDL system operated at RHI scanning mode. (a) RHI scanning pattern of Runway 36L/18R; (b) RHI scanning pattern of Runway 01/19.
Atmosphere 12 00050 g010
Figure 11. Wind speed profile series along the Runway 36L/18R and Runway 01/19 retrieved from the Figure 8’s RHI measurement.
Atmosphere 12 00050 g011
Publisher’s Note: MDPI stays neutral with regard to jurisdictional claims in published maps and institutional affiliations.

