Article

Statistical Characteristics and Environmental Conditions of the Warm-Season Severe Convective Events over North China

1
Key Laboratory of Cloud-Precipitation Physics and Severe Storms, Institute of Atmospheric Physics, Chinese Academy of Sciences, Beijing 100029, China
2
College of Earth and Planetary Sciences, University of Chinese Academy of Sciences, Beijing 100049, China
3
State Key Laboratory of Operation and Control of Renewable Energy and Storage Systems, China Electric Power Research Institute, Beijing 100085, China
4
Electric Power Meteorology State Grid Corporation of China Joint Laboratory, Beijing 100192, China
5
Southern Marine Science and Engineering Guangdong Laboratory (Zhuhai), Zhuhai 519000, China
6
International Center for Climate and Environment Sciences, Institute of Atmospheric Physics, Chinese Academy of Sciences, Beijing 100029, China
7
Emergency Management Center, State Grid Shandong Electric Power Company, Jinan 250001, China
*
Author to whom correspondence should be addressed.
Atmosphere 2021, 12(1), 52; https://doi.org/10.3390/atmos12010052
Submission received: 30 October 2020 / Revised: 25 December 2020 / Accepted: 27 December 2020 / Published: 31 December 2020

Abstract

:
Based on severe weather reports, surface precipitation observations, surface routine observations, and the European Center for Medium-Range Weather Forecasts ERA5 reanalysis dataset during the warm seasons (May–September) of 2011–2018 over North China, this paper analyzes the statistical characteristics and environmental conditions of three types of severe convective events. Results are compared between events with different altitudes (i.e., mountains and plains), severities (i.e., ordinary and significant), and months. Hail and thunderstorm high winds (THWs) are more common over the mountains whereas short-duration heavy rainfall (SDHR) is more frequent over the plains. The occurrence frequency of severe convective events exhibits distinct monthly and diurnal variations. Analyses of the environmental parameters provide reference for the potential forecasting of severe convective events over this region. Specifically, the 850–500 hPa temperature lapse rate (LR85), pseudo-equivalent potential temperature at 500 hPa (thetase500), and precipitable water (PW) are skillful in distinguishing hail and THW environments from SDHR environments, and thetase500 is useful in discriminating between hail and THW environments. The convective environments over the plains are characterized by significantly higher (lower) PW (LR85) compared with mountains. The skill of these parameters in forecasting the severity of the convective hazards is limited. Probability distributions in the two parameters space indicate that the occurrence of significant hail requires both higher most unstable convective available potential energy (MUCAPE) and stronger 0–6 km bulk wind shear (SHR6) compared with ordinary hail. Compared with ordinary THWs, the significant THWs over the mountains depend more on the SHR6 whereas those over the plains rely more on the MUCAPE. The significant SDHR events over the plains tend to occur under a variety of instability conditions. The thermodynamic parameters (i.e., MUCAPE, thetase500, and downdraft convective available potential energy), and PW are significantly higher in July–August, whereas the LR85 and vertical wind shear are apparently higher in May, June and September.

1. Introduction

According to the National Meteorological Center (NMC), China Meteorological Administration (CMA), severe convective weather refers to ≥ 5 mm hail, thunderstorm high winds (THWs) with wind speeds ≥ 17.2 m s−1 or Beaufort scale 8, short-duration heavy rainfall (SDHR) with hourly precipitation ≥ 20 mm h−1, and any tornado [1]. Severe convective events occur frequently over North China during the warm season [2,3,4,5] and pose a significant threat to life and property in this region. Forecasting severe convective events over North China is particularly challenging, because the storm activities are strongly affected by the complex underlying surfaces, which include mountains, plains, and the Bohai sea from northwest to southeast, as well as large metropolitan areas in the national capital of Beijing [6,7,8,9] (Figure 1).
Currently, the potential prediction of severe convective weather is mainly based on pattern recognition and environmental parameter diagnosis. The latter is also recognized as an “ingredients-based” methodology, which considers the necessary ingredients for the initiation and development of severe convective storms. Since put forward, the “ingredients-based” methodology has been widely used in the forecasting operations [10,11,12,13]. Although the severe convective weather forecasting has experienced great improvements in recent years, the accurate forecasting of the type and severity of the severe convective weather remains challenging. An improvement in this regard requires knowledge of the climatology of different types of severe convective events as well as their associated environments. As a result, numerous studies have been carried out in this respect. For example, in the United States and Europe, the environmental conditions of tornadoes, hail, and wind gusts have been extensively analyzed and differentiated [14,15,16,17,18,19,20,21,22,23,24]. A lot of studies were also carried out in China [2,25,26,27,28,29,30,31,32]. For example, Tian et al. [33] found that the precipitable water (PW) discriminated the best between the environments of no precipitation, ordinary precipitation, and SDHR. The best convective available potential energy (i.e., the convective available potential energy of a parcel with the temperature, dew point temperature and pressure at the level where the equivalent temperature reached its highest in the 250-hPa layer above the surface) and vertical wind shear were unable to discriminate between precipitation with different severities. Yang et al. [30] analyzed the environmental conditions of THWs and nonsevere thunderstorms over South China. They found that THWs were generally associated with stronger baroclinity, instability, and dynamic forcing compared with nonsevere thunderstorms. Li et al. [2] suggested that the spatial distribution of the maximum hail diameter in China was associated with the East Asian summer monsoon: larger hail was mainly observed during the spring in South China in the presence of an upper-level jet and a low-level southwesterly flow accounting for large SHR6 and PW, whereas smaller hail occurred mainly during the summer over North China when pronounced baroclinicity providing large convective available potential energy (CAPE) and PW, moderate deep-layer shear, and low freezing level height.
Over North China, previous investigations into the severe convective storm environments mainly focused on those associated with a particular type of severe convective hazard [25,29,34,35,36,37], and fewer studies have compared the environments between different types of severe weather events [26,38]. Moreover, as indicated in [37,39], the environmental conditions of the severe convective events over the mountainous and plain areas are significantly different. It has also been demonstrated that the environments associated with severe convective events vary with month [30,36,40] and event severity [2,22,41]. However, less attention has been paid in these regards in the previous studies over North China. Therefore, this study aims to address the following two topics: (a) the statistical characteristics of the severe convective events during the warm season over North China; (b) the thermodynamic, dynamic, and water vapor conditions associated with the severe convective events. Particularly, we pay attention to comparing the environments between three types of severe convective events (i.e., hail, THWs, and SDHR), as well as between events with different severities (i.e., ordinary and significant) occurring over different altitudes (i.e., mountains and plains) and months using environmental parameters. The ordinary category includes hail ≥ 5 mm but < 10 mm, THWs with wind speeds ≥ 17.2 m s−1 but <24 m s−1, and SDHR with hourly rainfall ≥ 20 mm h−1 but < 50 mm h−1, and the significant category includes hail ≥ 10 mm, THWs with wind speeds ≥ 24 m s−1, and SDHR with hourly rainfall ≥ 50 mm h−1 [42] (Table 1). The distinction between mountain and plain events are based on the station altitude using a threshold of 500 m. The forecasting skill of each environmental parameter is quantitatively assessed through significance tests, and the results are evaluated in terms of not only the statistical significance but also the meteorological significance. Besides, the environments under which various severe convective events are most likely to occur are analyzed in two-parameter spaces. These results will provide reference for the potential forecasting of severe convective events over North China.

2. Data and Methodology

In this study, we consider three types of severe convective events, namely, hail, THWs, and SDHR. Tornadoes are not considered due to their infrequent occurrences in China [43]. The three-hourly severe weather reports (SWRs), hourly surface precipitation observations, hourly surface routine observations, and the 0.25° × 0.25° hourly European Center for Medium-Range Weather Forecasts (ECMWF) ERA5 reanalysis dataset [44] during the warm seasons (May–September) of 2011–2018 over North China are used. The North China region is defined as the region covering 35–45° N and 110–125° E (Figure 1). All observational data are obtained from the NMC, CMA. The SWRs dataset is used to obtain hail and THW events, and the precipitation observations are used to obtain SDHR events. The surface routine observations and the ERA5 reanalysis data are used to construct proximity soundings for the severe convective events. Since there is a distinct increase in the number of precipitation stations in the study domain during the study period, the precipitation stations in 2011 are used in analyzing the statistical characteristics of the SDHR events (Figure 2a).

2.1. The SWRs Dataset

The SWRs dataset documents severe weather including thunder, high winds, hail, tornadoes, snow, glaze, and those that cause obstruction to visibility. The data have a time interval of 3 h, giving eight files per day. In each file, all severe weather that occur in the adjacent three-hour period are recorded. For example, a SWR file at 0200 Beijing Standard Time (BST, BST = UTC + 8 h) records all severe weather that occur during 0000–0259 BST. Information such as the station ID, location (longitude and latitude), time (hour and minute), weather phenomena, etc. is provided for each severe weather event. The wind speed and direction are provided for a high wind report, and the maximum hail diameter is provided for a hail report.
The high wind reports in the SWRs include not only the convectively generated winds, but also various kinds of nonconvective winds such as those that are related to cold air and those that are caused by topography. For example, the study by Chai et al. [36] showed that the high winds were more frequent in the northwest of Zhangjiakou city, Hebei province, owing to the funnelling effect associated with topography. Since we are interested only in those caused by severe convective storms, the method documented in [5] is used to select THWs from all high wind reports in the SWRs. According to the CMA, a new report is required if the magnitude of the severe weather is reinforced or a mistake is found in a previous report. When this is the case, the latest report is retained and the previous one(s) are removed. After these filters are applied, a total of 365 and 467 stations in the SWRs dataset are obtained, each of which has at least one occurrence of hail and THWs, respectively, during our study period and domain (Figure 2b).

2.2. Construction of Proximity Soundings

Due to the limited spatial and temporal resolution of observational soundings, a growing number of studies have employed reanalysis soundings in climatological storm environment studies [17,18,45,46,47,48]. However, it has been highlighted by some studies that biases are present in the boundary layer variables of reanalysis soundings [49,50,51]. Therefore, the present study uses a two-step procedure to construct proximity soundings associated with the severe convective events: creating reanalysis soundings using the ERA5 reanalysis dataset, and correcting the low levels of the ERA5 soundings using surface observations.
The number of stations that perform precipitation observation is far greater than that perform hail and THW observations in the study area. To avoid great differences in the sample size of the three types of severe convective events, we use a total of 538 stations that have at least one occurrence of hail or THWs (i.e., the union of the 365 hail stations and 467 THW stations) for the environmental condition analysis in this study (note that all stations are used in the climatological characteristics analysis of the severe convective events). For each identified severe convective event, we associate it to the most recent hourly ERA5 sounding and surface observations prior to its occurrence. For example, any severe convective event during 1200–1259 BST is assigned with the ERA5 sounding and surface observations at 1200 BST. In the spatial sense, firstly, we determine an uncontaminated surface station for the severe convective event. To be specific, we start by identifying all surface stations in a 1° × 1° box centered at the severe convective event that recorded zero precipitation in the preceding two hours. For example, for a severe convective event at 1230 BST, we select stations whose precipitation amounts are zero during 1000–1200 BST in the 1° × 1° box. This is done by using the 1-hourly surface precipitation observations. Next, the nearest surface station to the severe convective event among all qualified stations from the last step is selected as the uncontaminated station. If no uncontaminated station is found for a severe convective event, the event is eliminated. Secondly, the ERA5 grid closest to and the observations at the uncontaminated surface station are used for the construction of proximity soundings. Specifically, variables including pressure, altitude, temperature, dew-point temperature, and horizontal wind at 32 pressure levels (i.e., all pressure levels from 1000 hPa to 10 hPa) at the identified ERA5 grid and time are used to construct ERA5 soundings. Layers with altitudes lower than the altitude of the uncontaminated surface station are removed. Then, observations at the uncontaminated surface station are used to correct the low levels of the ERA5 sounding [37,52,53]. It is worth noting that, ideally, ERA5 data on the model levels instead of isobaric levels should be used, since the vertical resolution of the former is markedly higher than the latter (i.e., 137 model levels vs. 37 pressure levels). Nevertheless, since the parameters used in this study do not rely heavily on the vertical resolution of the soundings as some parameters do (e.g., convective inhibition, [48,50]), the influence should be limited.
The three sounding categories (i.e., hail soundings, THW soundings, and SDHR soundings) are not exclusive. In a small number of cases when more than one type of severe convective event is recorded at a station during the 1-h window, the proximity soundings are included, respectively, in the corresponding severe weather types. We choose not to include these soundings in a new category mainly because of their small sample size. To avoid oversampling of the similar environments, all events in the same weather category are required to be 250 km or 6 h away from each other, as was done in [54] and similarly done in [17,55]. Since the occurrence frequency of the severe convective events varies significantly between mountains and plains, each of the three severe convective event categories is further divided into two groups—mountain and plain—to facilitate comparison of the environments over different altitudes. In addition, the environmental conditions of severe convective events with different severities in different months are also examined.

2.3. Parameter Computation

A variety of thermodynamic, dynamic and water vapor parameters are calculated using the proximity soundings based on the consideration of the key ingredients for the initiation and development of severe convective storms—conditional instability, boundary layer moisture, lifting mechanisms, and vertical wind shear [56,57]. Particularly, a total of seven parameters are presented in the paper (Table 2): most unstable CAPE (MUCAPE), downdraft CAPE (DCAPE), temperature lapse rate between 850 and 500 hPa (LR85), pseudo-equivalent potential temperature at 500 hPa (thetase500), 0–3 km above ground level (AGL) bulk wind shear (SHR3), 0–6 km AGL bulk wind shear (SHR6), and PW below 300 hPa. The CAPE provides a good overall estimate of the atmospheric instability and is extensively used in convective activity forecasting. The DCAPE can be used as a rough estimate of the downdraft or cold pool strength [58], and is, therefore, a useful parameter for forecasting THWs. Temperature lapse rates between different vertical levels were frequently evaluated in previous storm environment studies to describe the atmospheric instability [24,40]. For the purpose of this study, the LR85 is used to evaluate the mid-level instability. As hail and THWs often occur in environments with cold and dry mid-levels [26,59], the thetase500 is examined to verify if the combination of the 500 hPa temperature and moisture shows skill in discriminating between various severe convective weather categories. The vertical wind shear has been found to be important for severe convective storms [54,57,60]. The present study analyzes both the low-level (i.e., 0–3 km) and deep-layer (i.e., 0–6 km) vertical wind shear. Finally, the humidity conditions are described by PW. The virtual temperature correction is applied in the calculation of thermodynamic variables [61]. The MUCAPE is calculated as the CAPE of the most buoyant parcel in the lowest 300 hPa [61]. The DCAPE is calculated by sinking the parcel with the minimum wet-bulb potential temperature below 500 hPa [58]. The SHR3 (SHR6) is calculated as the magnitude of the vector difference between the 10-m wind and the wind at 3 (6) km AGL.
A simple quality control is then performed for all soundings based on the surface-based CAPE values to eliminate possibly nonrepresentative soundings, namely, soundings with the surface-based CAPE less than 50 J kg−1 are removed. Similar restrictions frequently appear in storm environment studies [14,15,23,24,40]. After all these steps, the final dataset consists of 563 hail soundings, 572 THW soundings, and 2392 SDHR soundings. To assess the reliability of the corrected ERA5 soundings, we have compared the environmental parameters computed from ERA5 soundings and from radiosonde observations retrieved from the University of Wyoming [62] during the study period (figures not shown). The results suggest that there is generally good agreement between the observational soundings and ERA5 soundings. Larger differences are observed for MUCAPE, with the ERA5 soundings showing higher values than the observational soundings. This is understandable, because the calculation of CAPE is very sensitive to the temperature and humidity of the lifted air parcel.
In comparing the environmental parameters of different categories, significance tests are introduced to quantitatively determine if the differences between two categories are statistically significant. Specifically, the samples in each category are first checked for normalized distribution at the 95% confidence level. For two categories that are both normally distributed, a two-tailed t test is then performed to test the null hypothesis that the differences between the two independent sample means are zero. If one category is found to be nonnormal, then the nonparametric Wilcoxon–Mann–Whitney test is applied [63], since this test does not require an assumed normal distribution.

3. Results

3.1. Spatial and Temporal Distributions of the Severe Convective Events

Figure 3 shows the spatial distribution of the occurrence frequencies of hail, THW, and SDHR events with different severities. The distribution reveals the pronounced impact of topography: hail and THWs frequently occur over the mountains (especially hail), whereas SDHR primarily occurs over the plains (Figure 3a,b). The majority of the hail events are observed in the north of Hebei province, the northeast of Shanxi province, and the middle of Inner Mongolia. The maximum hail frequency is located in the northwest of Hebei province. The distribution of THWs features a southwest–northeast oriented high frequency zone extending from the north of Shannxi province to the north of Hebei province. The maximum is located in the northeast of Shannxi. Compared with hail, THWs occur more frequently over the plains of southeast of Hebei. The SDHR events are most frequent in the middle of Shandong province, the south of Liaoning province, the Beijing–Tianjin–northeast Hebei region, and the boundary of Hebei and Shandong provinces. These characteristics agree with the findings of previous studies [3,5,29,64].
The spatial distribution of the ordinary category is similar to that of all severe convective events (Figure 3d–f). For the significant category (Figure 3g–i), significant hail is observed all over the domain with higher frequency mainly in Shannxi and Shanxi provinces. The greatest significant THW events is observed near Mount Tai, middle of Shandong province. The occurrence frequency of the significant SDHR is evidently lower in the western and northern parts of the study area, where high mountains and limited moisture are present. Over the plains, the significant SDHR events show a relatively uniform distribution with less pronounced maxima located in the east section of the boundary between Hebei and Shandong provinces, the southeast of Shanxi province, the south of Liaoning province, and Tianjin–southeast Beijing.
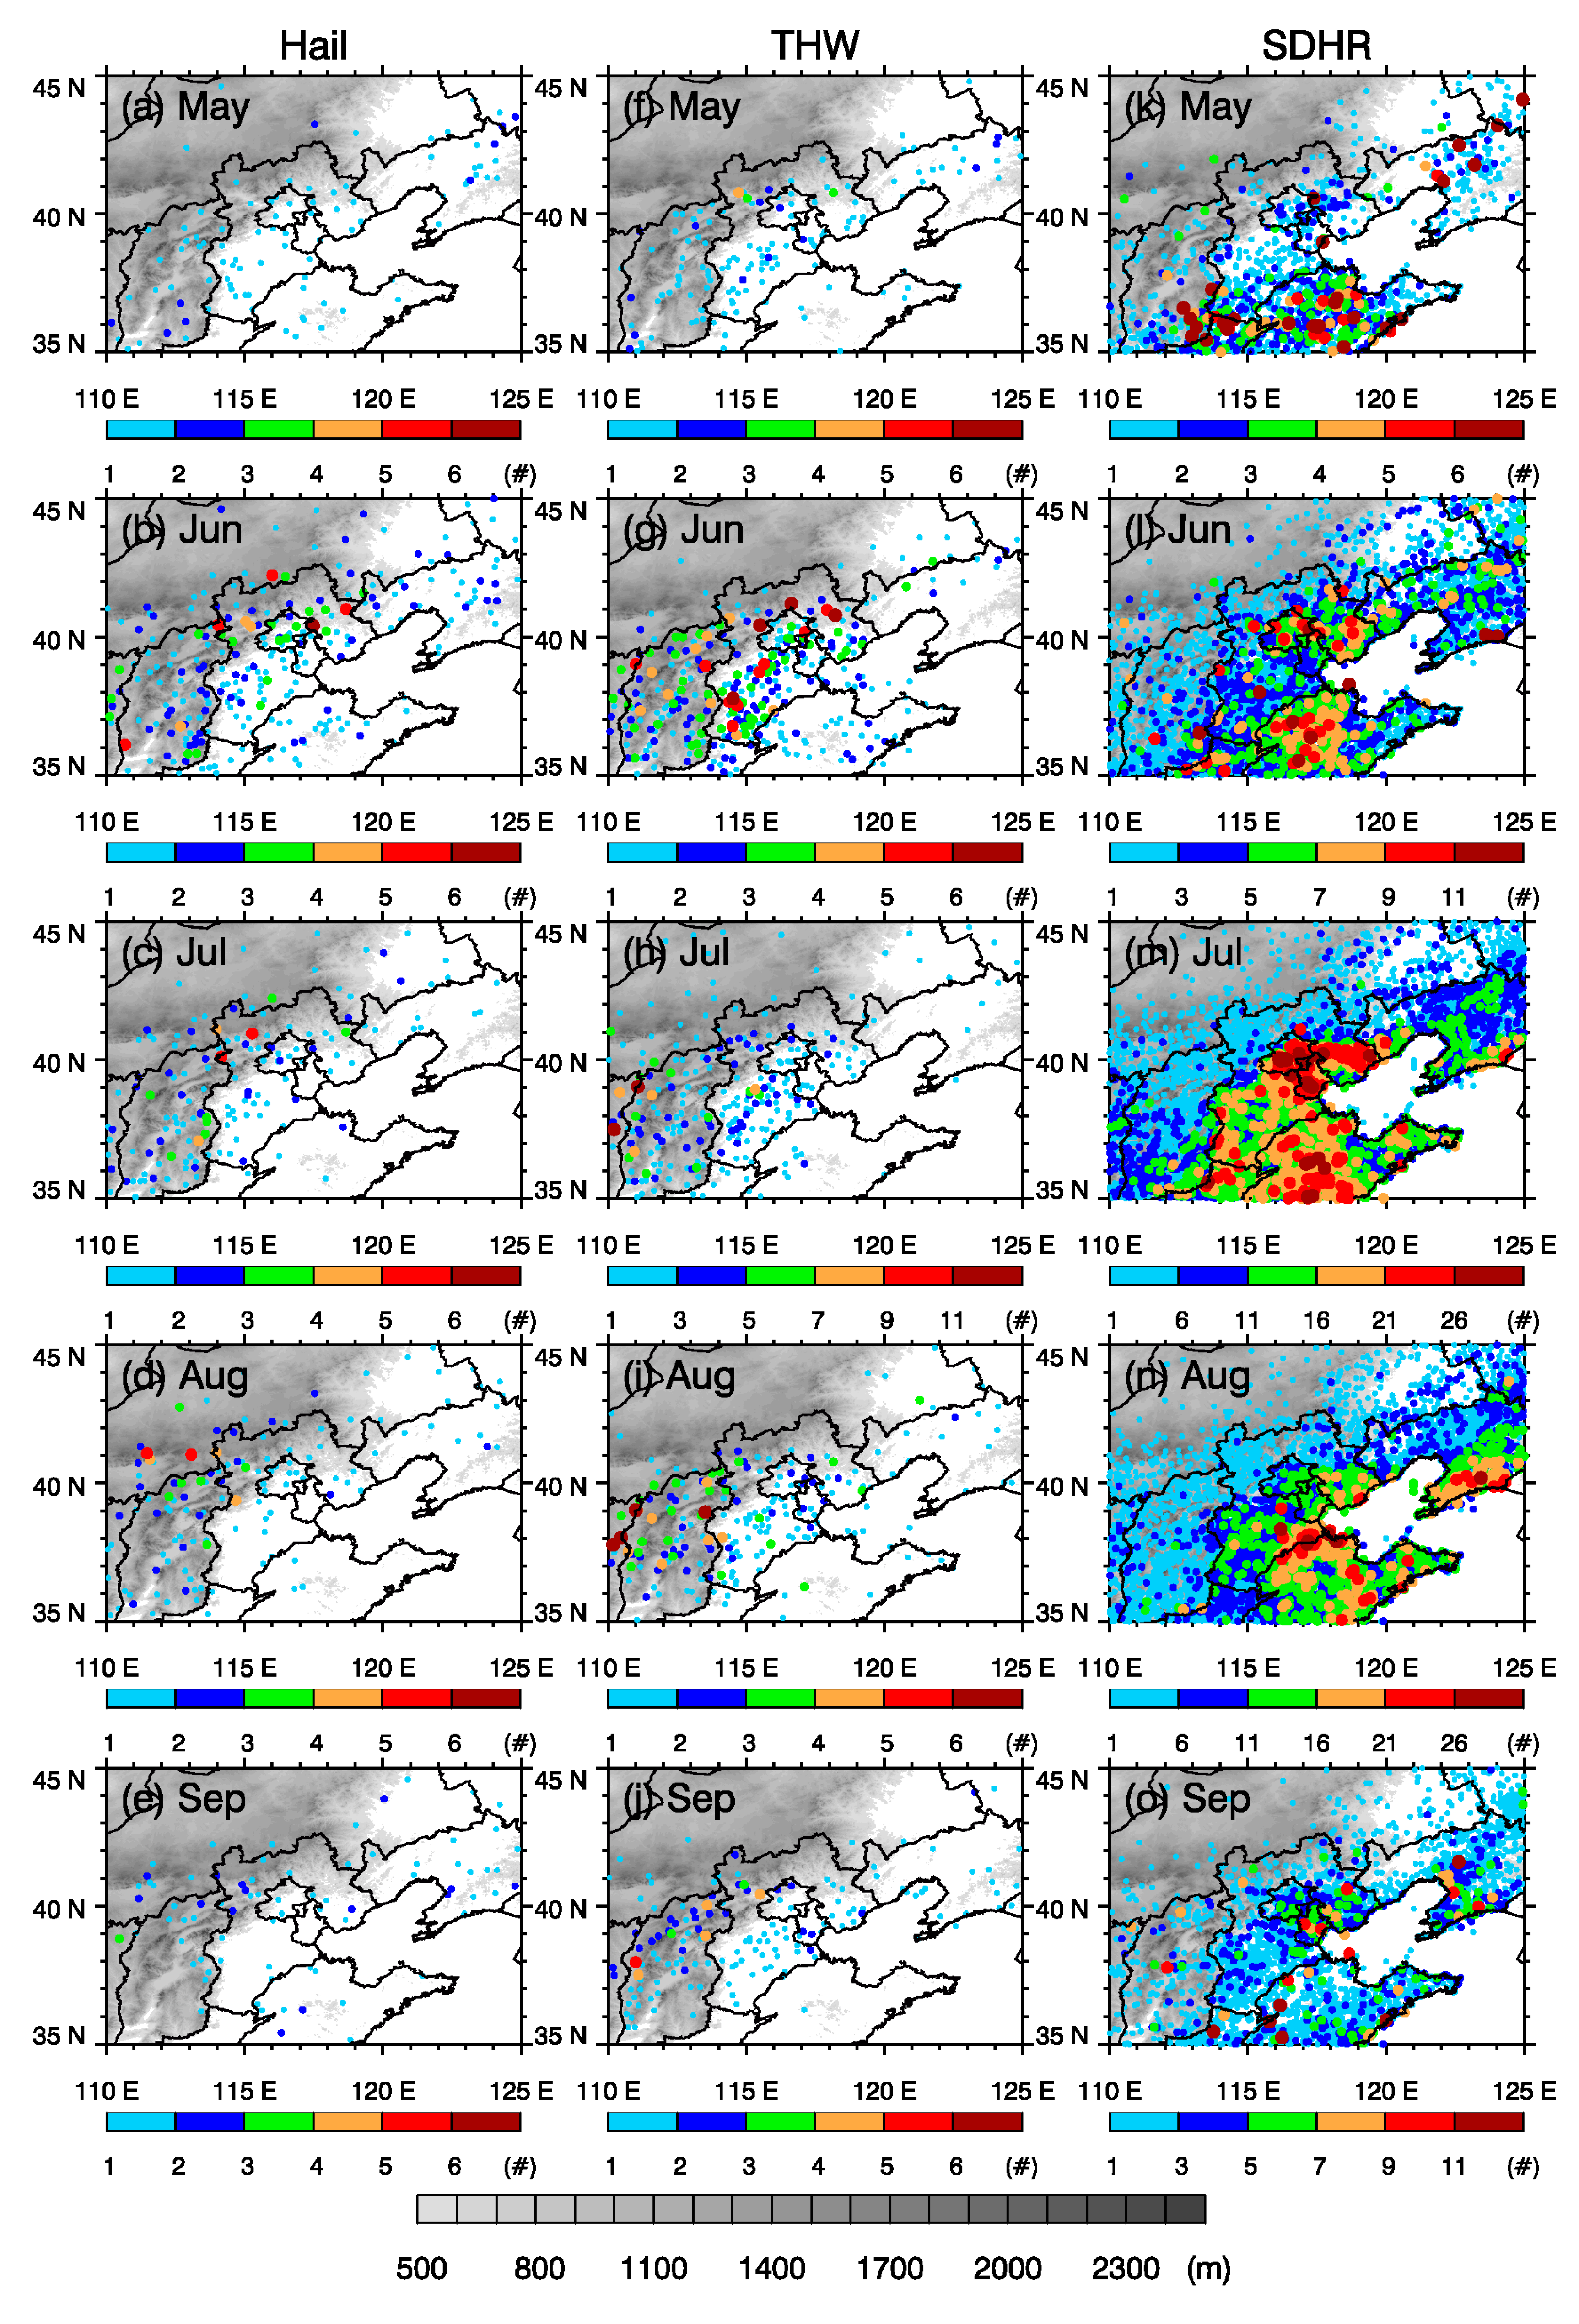
Figure 4 shows the spatial distribution of the occurrence frequencies of hail, THW, and SDHR events in each month. Hail frequency shows a distinct increase in June, especially over the north of Hebei (Figure 4a–e). From early summer to late summer (i.e., June–August), the area that is prone to hail threat shifts towards the northwest. Specifically, the high frequency region goes from the north of Hebei in June to the northwest of Hebei in July and further to Inner Mongolia in August. Hail occurrence decreases significantly in September.
For THW events, the distribution also exhibits a significant increase in June with the maximum occurrence frequency in the north of Hebei (Figure 4f–j). The spatial distribution shows a notable westward displacement from June to July with an increase in the boundary of Shannxi and Shanxi provinces and a sharp decrease in Hebei province. In August, the greatest frequency of THW events is observed in the middle and north of Shanxi province and the northeast of Shannxi province. The distribution pattern in September generally follows that in August with reduced frequency.
The SDHR events mainly occur in the south of the North China region and Liaoning province in May (Figure 4k–o). In June, the SDHR frequency over the study area increases with two maxima located in the middle and western parts of Shandong province and Beijing–Tianjin–northeast Hebei region, respectively. The SDHR events increase significantly in July, with a generally similar pattern as that in June. The distribution in August distinguishes from those in June and July in that the two maxima in June and July weaken greatly and a new maximum appears in the boundary of Hebei and Shandong provinces. Besides, the SDHR frequency in the south of Liaoning province increases considerably in August. In September, the occurrence frequency of SDHR over North China decreases significantly with a different spatial pattern from that of August. Two maxima are present in Tianjin and the northeast of Hebei province and the coastal area of Liaoning province, respectively.
Figure 5 shows the annual and monthly distributions of the occurrence frequencies of hail, THWs, and SDHR. Hail events occur frequently during 2013–2016 with the most in 2016 (Figure 5a). The greatest frequency of THW events occur in 2011, which are nearly four times as those in the year with the fewest THW events (i.e., year 2015; Figure 5b). The SDHR events occur most frequently in 2016. While the frequency of all three types of severe convective events are apparently higher in June–August compared with May and September, the occurrence frequencies of hail and THW events peak in June whereas that of SDHR events shows a later peak in July. Both THW and SDHR events occur least frequently in May, whereas hail events occur least frequently in September.
The monthly variation of the occurrence frequencies of severe convective events with different altitudes and severities is further analyzed (Figure 6). Owing to the large difference in the station number over mountains and plains, the occurrence frequencies are normalized. That is, the number of hail and THW events over the mountains (plains) are divided by the station number in the SWR dataset over the mountains (plains), and the number of SDHR events over the mountains (plains) is divided by the station number in the precipitation data over the mountains (plains). For hail (Figure 6a), both ordinary and significant hail events occur more frequently over the mountains than over the plains in each month, except that the significant hail has a slightly higher frequency over the plains than over the mountains in May. All hail events, regardless of intensity and altitude, peak in June. Similar to hail, both ordinary and significant THWs are more frequent over the mountains than over the plains during the warm season, except that the significant THWs have a slightly higher frequency over the plains than over the mountains in May (Figure 6b). Less uniformity is present regarding the monthly variations of THW events with different altitudes and severities: both the occurrence frequencies of ordinary and significant THWs over the plains peak in June, which is in accordance with the monthly variation of the occurrence frequency of all THW events (Figure 5b). Over the mountains, however, the significant THWs are equally frequent in June and July while the ordinary THWs peak in July. For SDHR (Figure 6c), both ordinary and significant SDHR events occur more frequently over the plains than over the mountains in each month. All SDHR events, regardless of the intensity and altitude, peak in July.
Figure 7 shows the diurnal variation of the occurrence frequencies of hail, THW, and SDHR events with different severities over different altitudes. For all severe convective events (i.e., the grey bars in Figure 7), hail and THWs frequencies increase significantly from 1200 BST and reach peaks at 1500–1600 and 1800–1900 BST, respectively. The diurnal peak of all SDHR events appears at 1600–1700 BST with a secondary peak at 0200–0300 BST. Diurnal variation of the events with different altitudes and severities demonstrates that both the small and significant hail over the mountains peak at 1500–1600 BST, whereas those over the plains peak at 1600–1700 BST (Figure 7a). For THWs (Figure 7b), the greatest frequency of ordinary and significant THW events over the mountains are recorded at 1700–1800 and 1600–1700 BST, respectively, whereas all THW events over the plains occur most frequently at 1800–1900 BST.
As for SDHR (Figure 7c), the distribution of SDHR events over the mountains is characterized by a major peak at afternoon (1700–1800 and 1500–1600 BST for ordinary and significant SDHR events, respectively), whereas that of the SDHR events over the plains exhibits a bimodal pattern with a secondary peak at 0200–0300 BST. Previous studies [7,65] have also found that the storm activity over the North China plain mainly occurs at night, which is attributed to the propagation of convective storms from the mountains on the one hand, and the favorable nocturnal convection mechanisms related with the mountain-plains solenoid [65,66] and nocturnal jet on the other hand. Further examination of the SDHR events over the plains suggests that, compared with the ordinary SDHR events, the significant SDHR events over the plains are more inclined to occur at night as the major peak of the former shows up at 1600–1700 BST, whereas that of the latter appears at 1800–2200 BST. In short, the diurnal peak of the three severe convective events over the plains tends to appear at a later time compared with that over the mountains. This supports the results of previous studies [7,65], which showed that convection usually initiated over the mountains in the early afternoon and subsequently propagated toward the foothills and plains.

3.2. Environmental Parameters Associated with the Severe Convective Events

3.2.1. Severe Convective Events as Functions of Altitude and Severity

Figure 8 shows the box-and-whisker plots of seven environmental parameters associated with the severe convective events with different altitudes and severities. The boxes denote the interquartile ranges with the horizontal lines inside the boxes denoting the median values. The whiskers extend to the 95th and 5th percentiles. The significance test results of various paired categories are given in Tables S1–S3. It is readily seen that the number of pairings with significant differences (at the 95% confidence level) is the most for the comparison between three types of severe convective events (i.e., statistically significant differences are present for 34 paired categories out of 42 pairings), followed by the comparison between mountain and plain groups (22 pairings). Only 13 pairings show significant differences in the comparison between different severity groups of a particular type of severe convective event. This is logical, since the distinction between different severity categories is more challenging than that between different types of severe convective events, and the convective environments over the mountains and plains of North China have been shown to be different, especially in terms of the instability and moisture conditions [37,39].
Most of the parameters show skill in discriminating between the three types of severe convective events (Table S1). PW, thetase500, and SHR3 are discriminatory for all of the six pairings of the three types of severe convective events. SHR6 discriminates between various categories except for the THWs and SDHR pairing over the mountains. The SDHR (hail) events are associated with the highest (lowest) PW and thetase500 and the lowest (highest) vertical wind shear. The importance of abundant moisture in the atmosphere for the occurrence of SDHR has been demonstrated by studies [28,33], and the vertical wind shear has been found to be important for hail formation [54,60,67,68]. Over both mountains and plains, the DCAPE and LR85 of hail and THWs are significantly larger than those of SDHR, which supports the idea that hail and THWs often occur with mid-level cold and dry air invasion, leading to steeper mid-level temperature lapse rate (i.e., larger LR85) and enhanced evaporative cooling and negative buoyancy (i.e., larger DCAPE). However, DCAPE and LR85 are of limited use in discriminating between hail and THWs. MUCAPE, of the seven parameters discussed, shows the poorest discrimination between the three types of severe convective events, as it only distinguishes hail and THW environments from SDHR environments over the plains. It should be noted, however, that although the discrimination skill of various parameters is quantitatively evaluated by the significance tests, the meteorological significance of the results must be considered. For example, the differences of the MUCAPE between hail and SDHR events over the plains are significant at the 95% confidence level, but considerable overlap is observed between the interquartile ranges of the two distributions, which indicates that using MUCAPE as a discriminator for these two categories in operations is hardly feasible. In this sense, it may be concluded that LR85, thetase500, and PW are operationally useful in distinguishing hail and THW environments from SDHR environments, as separation is observed between the upper or lower quartile of one box plot and the median of another for these distributions [55,69,70]. In a similar vein, thetase500 is the only parameter that discriminates between hail and THW environments over both mountains and plains.
A notable characteristic of the comparison between severe convective events over the mountains and plains is that, while all thermodynamic parameters except for DCAPE show discrimination skill for at least some pairings, wind shear parameters show no discrimination ability for almost all paired categories (Table S2). That is to say, although previous studies have demonstrated that the vertical wind shear associated with severe convective storms over the North China plains is larger than that over the mountains [37,39], our findings suggest that the differences are not significant. Of the four thermodynamic parameters that show skill in discriminating between mountain and plain severe convective environments, PW and LR85 appear to be more useful as they show discrimination for all six pairings. The MUCAPE is significantly larger over the plains than over the mountains for all categories except significant hail events. In a meteorologically significant sense, the PW and LR85 are found to characterize the convective environments over mountains and plains, as the PW (LR85) is significantly higher (lower) over the plains than over the mountains.
Although the MUCAPE shows poor discrimination between the three types of severe convective events, it shows the greatest skill in discriminating between severe convective events with different severities (Table S3). The significant hail and significant SDHR events over the mountains, as well as the significant THW and significant SDHR events over the plains, are associated with considerably higher MUCAPE than their ordinary counterparts. No parameters show discrimination between ordinary and significant THWs over the mountains, as well as between ordinary and significant hail over the plains. Although the LR85 is skillful in discriminating between hail and THW events from SDHR events and in differentiating between mountain and plain environments, it is unable to forecast the severity of the convective events, as the LR85 distributions of the ordinary and significant events for all weather categories are very similar. When considering the meteorological significance, the MUCAPE, thetase500, and PW show skill in discriminating between the ordinary and significant SDHR events over the mountains, while no parameter but MUCAPE distinguishes ordinary THWs from significant THWs over the plains.
Figure 9 shows the probability distribution of the occurrence frequency of severe convective events with different altitudes and severities in the MUCAPE–SHR6 space. The distribution of ordinary hail events over the mountains concentrates in the weak to moderate MUCAPE (500–1500 J kg−1) and weak to moderate SHR6 (8–20 m s−1) space, with the maximum appeared at 1000–1500 J kg−1 MUCAPE and 8–12 m s−1 SHR6 (Figure 9a). The distribution of the significant hail events over the mountains shows an evident shift toward larger MUCAPE values with the maximum probability located at 1500–2500 J kg−1 MUCAPE and 12–20 m s−1 SHR6 (Figure 9d). The majority of the ordinary hail events over the plains are distributed in moderate MUCAPE (1000–2000 J kg−1) regime, spanning a wide range of SHR6 values (4–24 m s−1; Figure 9g). Although the maximum probability is located in a weak SHR6 (8–12 m s−1) regime, a second maximum appears in the moderate to high SHR6 (20–24 m s−1) space. For significant hail events over the plains, the maximum probability is observed in high MUCAPE (2000–2500 J kg−1) and strong SHR6 (20–24 m s−1) environments (Figure 9j). These results indicate that the occurrence of significant hail requires the presence of both higher instability and stronger deep-layer shear compared with ordinary hail, regardless of the altitude. The significant hail over the plains is most likely to occur in environments with the highest instability and the strongest deep-layer shear, compared with other hail categories.
In the case of THWs, the majority of the ordinary and significant THWs over the mountains occur in similar MUCAPE environments (i.e., 500–2000 J kg−1). However, the latter (8–20 m s−1) is associated with stronger SHR6 than the former (4–16 m s−1; Figure 9b, e). Over the plains, the majority of the ordinary and significant THWs occur in similar SHR6 environments (i.e., 8–20 m s−1), but the latter (2000–2500 J kg−1) is associated with evidently higher MUCAPE than the former (500–2500 J kg−1; Figure 9h,k). It is, therefore, concluded that, for increased THWs severity, THW events over the mountains show more dependence on the deep-layer shear whereas those over the plains are more dependent on the MUCAPE.
As for SDHR, the majority of the ordinary SDHR events over the mountains occur in weak to moderate MUCAPE (500–2000 J kg−1) and weak to moderate SHR6 (4–20 m s−1) environments, with the maximum appeared at 500–1000 J kg-1 MUCAPE and 8–12 m s−1 SHR6 (Figure 9c). Due to its small sample size, it is hard to reach statistical conclusions for the significant SDHR category over the mountains (Figure 9f). The majority of the ordinary SDHR events over the plains are found in the same MUCAPE (i.e., 500–2000 J kg−1) and a slightly lower SHR6 (4–16 m s−1) regime compared with their mountain counterparts (Figure 9i). However, the maximum probability of the ordinary SDHR events over the plains (1500–2000 J kg−1) is found in a significantly higher MUCAPE space than the ordinary SDHR events over the mountains (500–1000 J kg−1). The distribution of the significant SDHR events over the plains is characterized by a wide range of MUCAPE values (500–3000 J kg−1) in weak to moderate SHR6 (8–16 m s−1) space (Figure 9l), which suggests that these events occur in a variety of instability conditions. Comparison of the distribution of three types of severe events indicates that hail tends to occur in environments with the strongest deep-layer shear over both mountains and plains.

3.2.2. Severe Convective Events as Functions of Altitude and Month

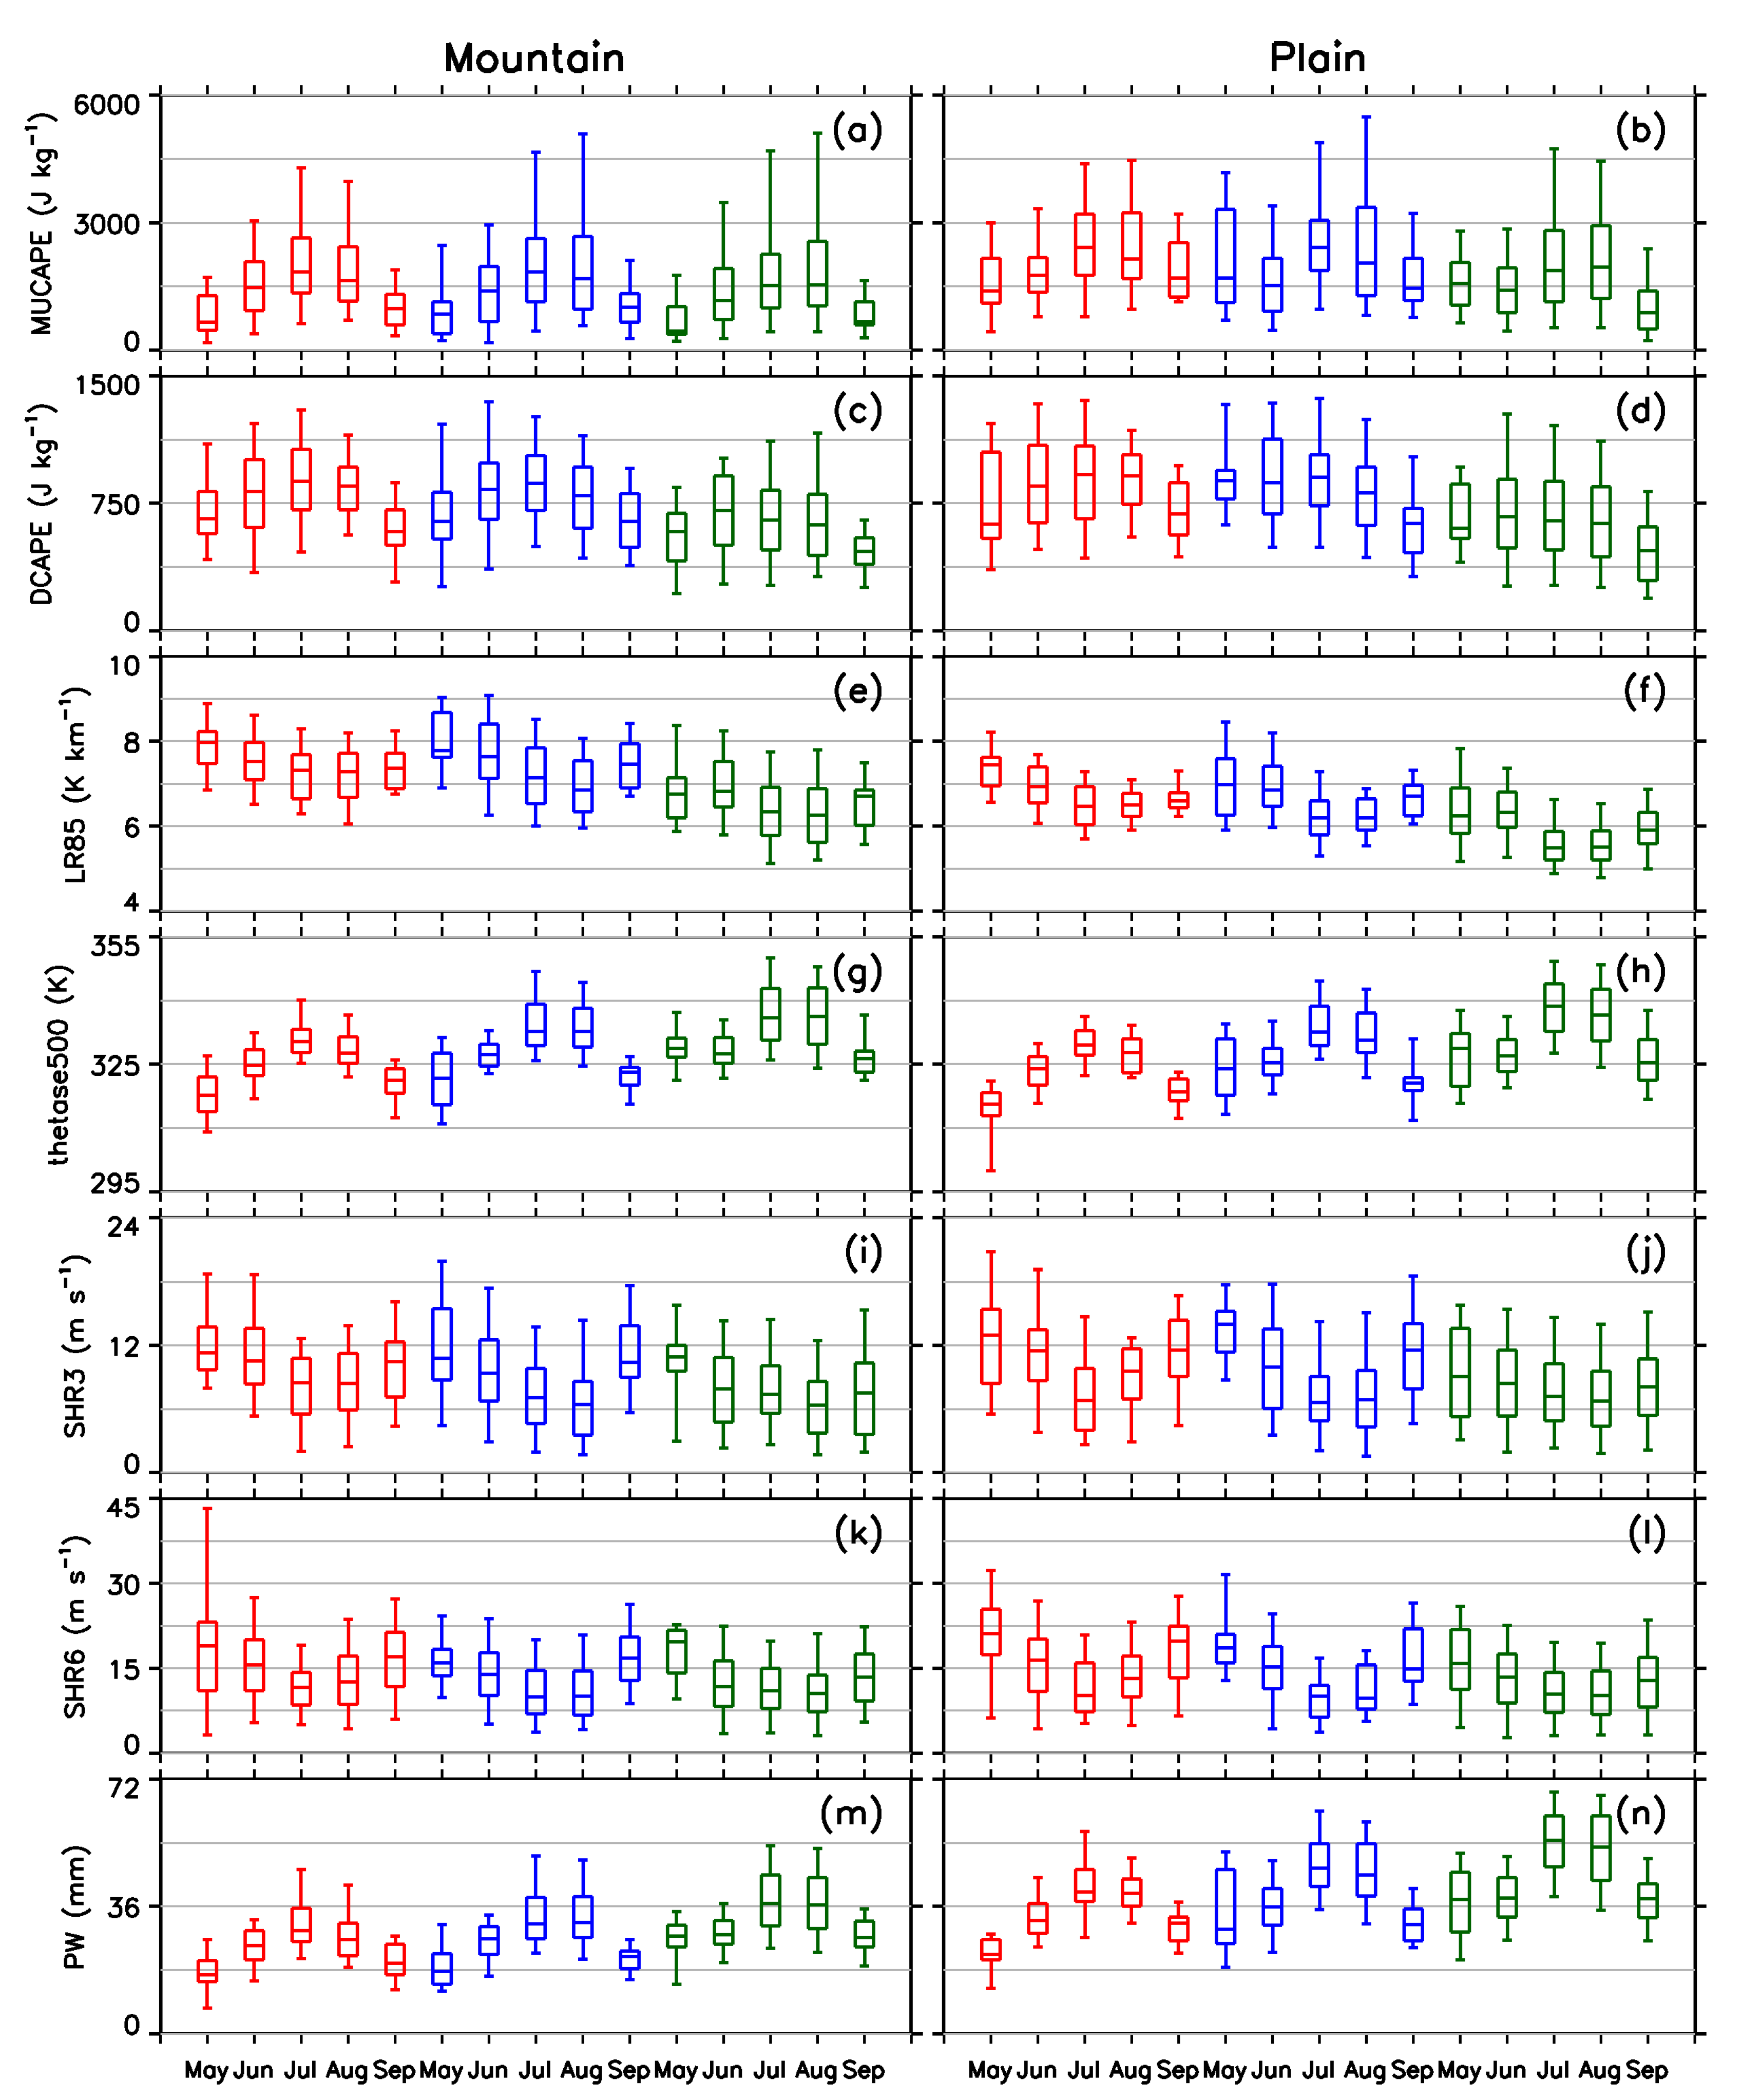
We further analyze the distribution of the environmental parameters associated with the severe convective events with different altitudes and months (Figure 10). The results show the distinct seasonal variations of the environmental conditions. Over both mountains and plains, the thermodynamic parameters (i.e., MUCAPE, thetase500, and DACPE) and water vapor parameter (PW) have significantly larger values in July–August compared with other warm-season months, whereas the LR85 and wind shear parameters (i.e., SHR3 and SHR6) are apparently higher in May, June and September. Similar monthly variations were also reported in [21,25].
Specifically, over both mountains and plains, the MUCAPE for hail and THWs peaks in July whereas that for SDHR is slightly higher in August than in July (Figure 10a,b). The DCAPE for hail and THW events are the highest in July, whereas that for SDHR is the highest in June (Figure 10c,d). The LR85 distributions for hail and THWs feature a decrease from May to August and an increase in September, whereas those for SDHR reaches the highest in June (Figure 10e,f). Except the fact that the thetase500 associated with the SDHR events over the mountains is slightly larger in August than in July, all categories have the greatest thetase500 in July (Figure 10g,h). The greatest SHR3 and SHR6 are found in May for all categories except THWs over the mountains, which are associated with the greatest SHR6 in September (Figure 10i–l). All categories have a July peak of PW, except for THW events over the mountains, which peak in August (Figure 10m,n).
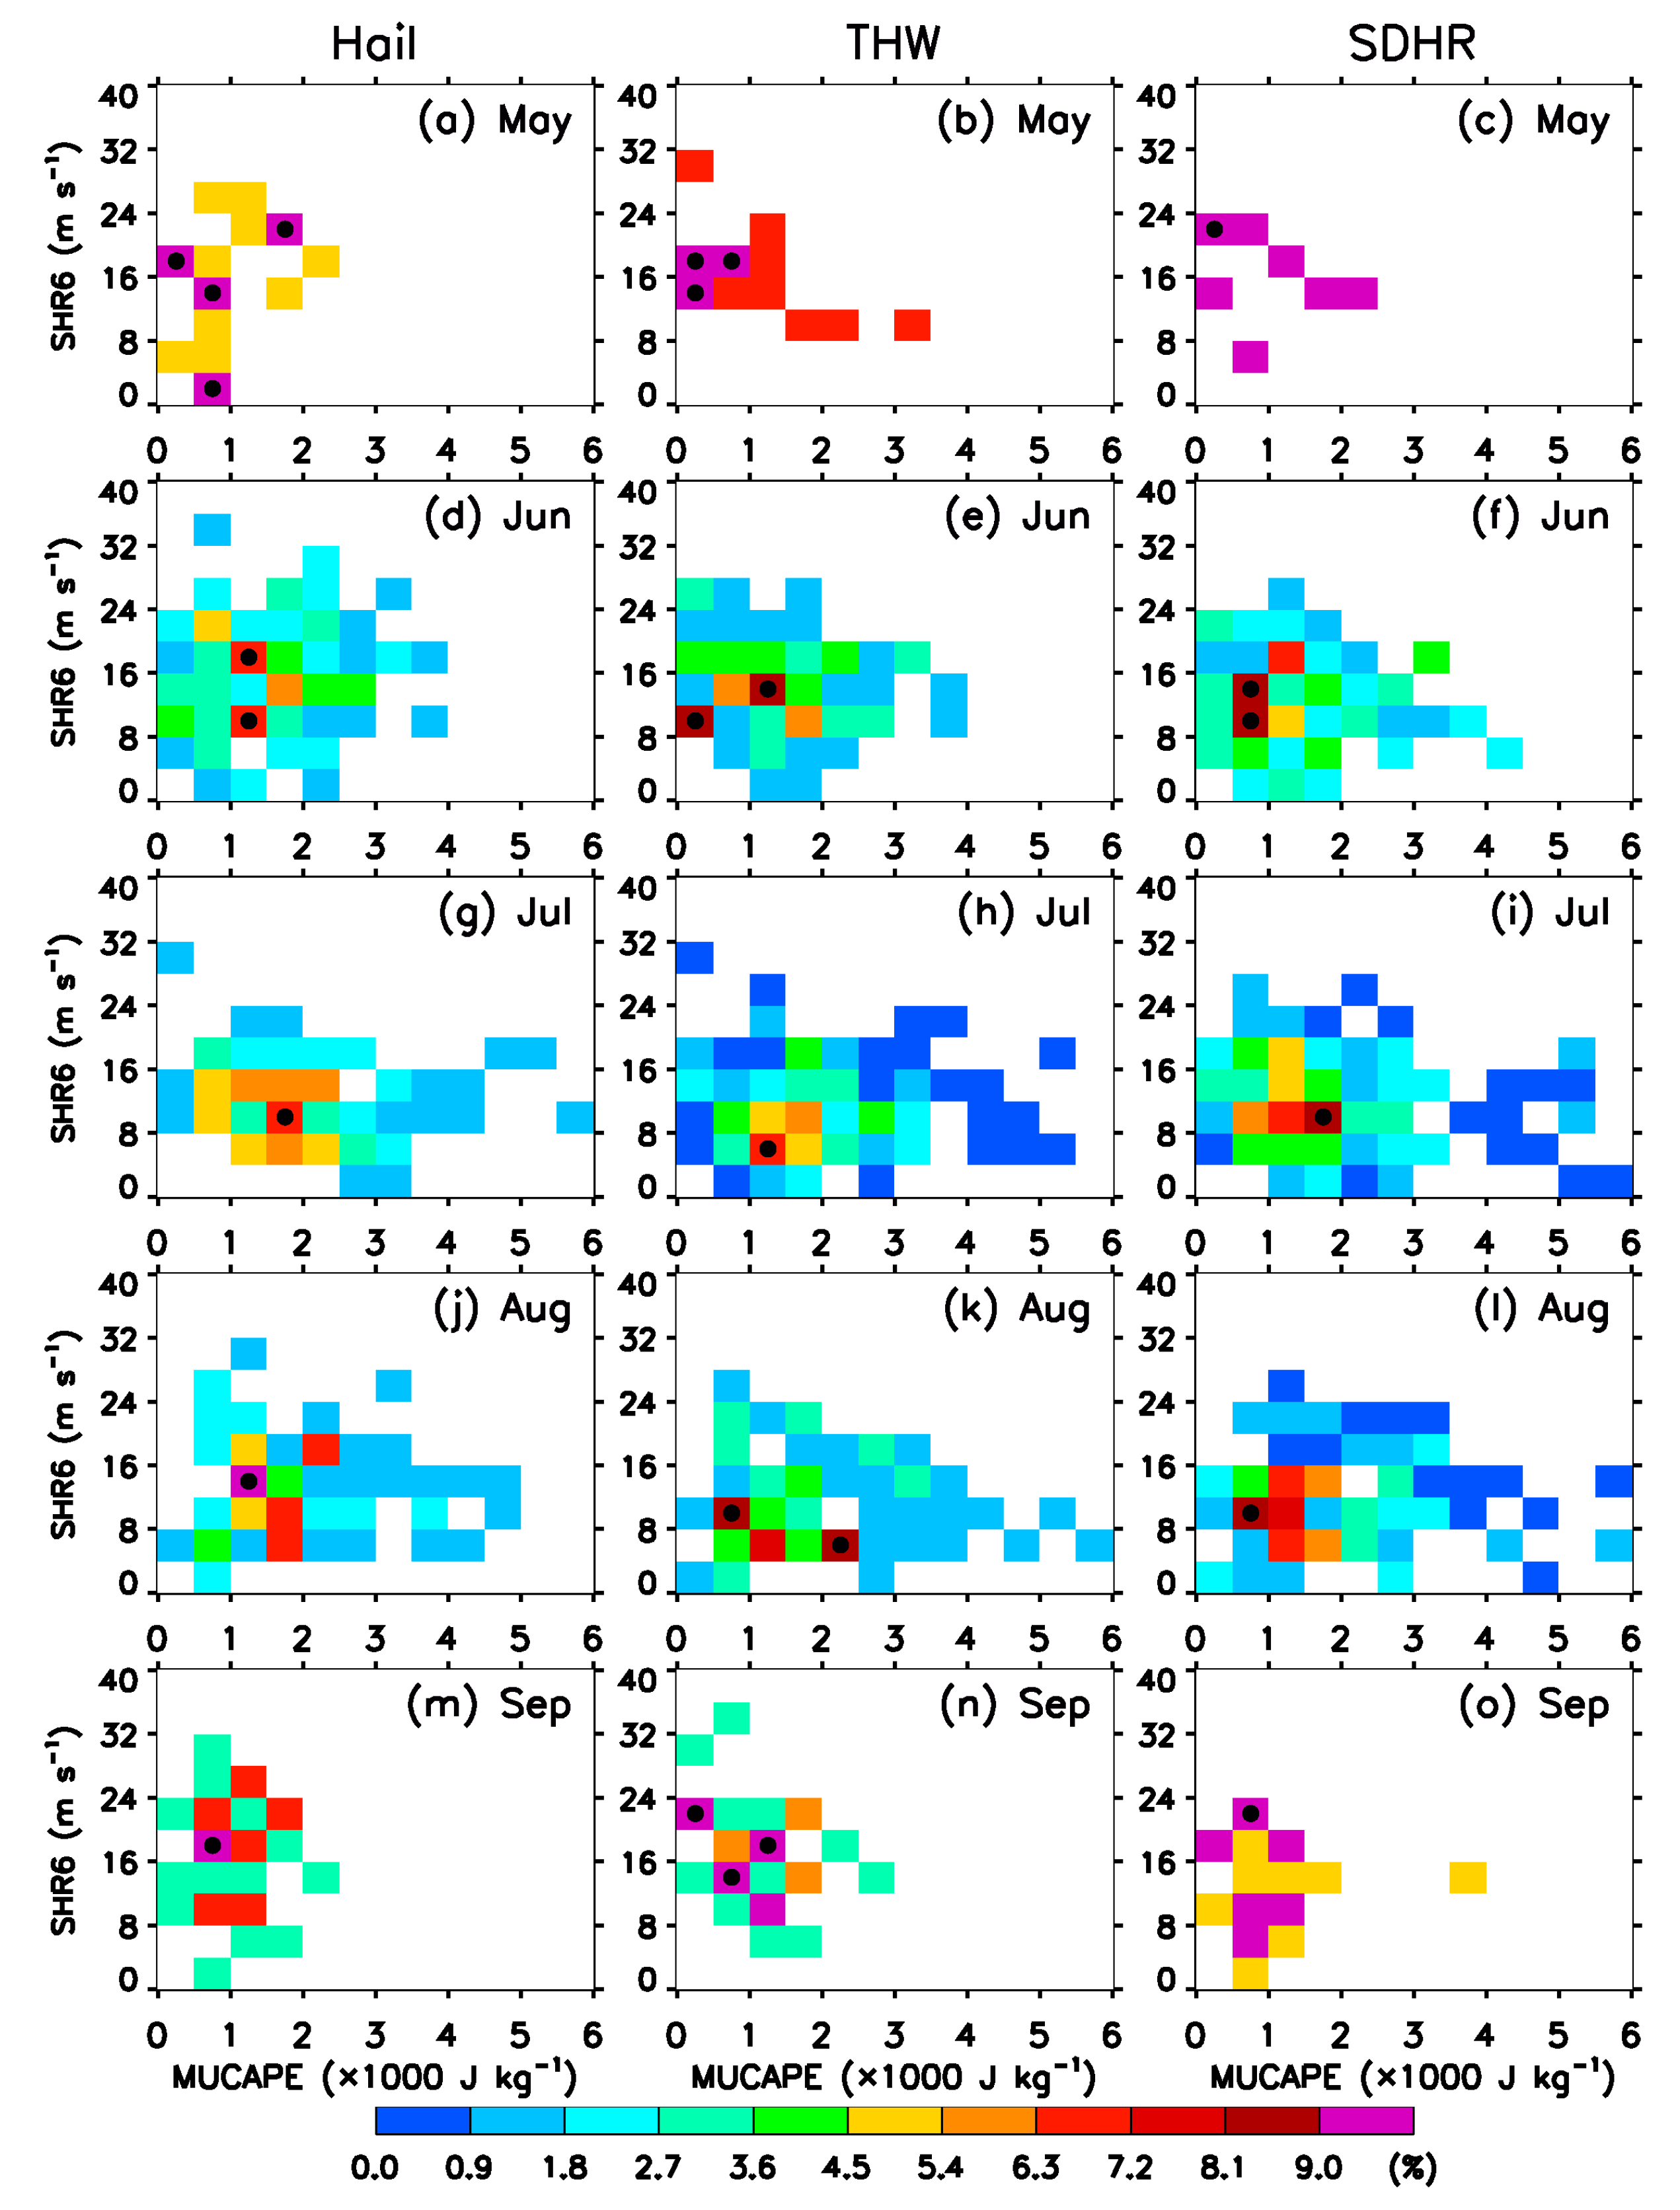
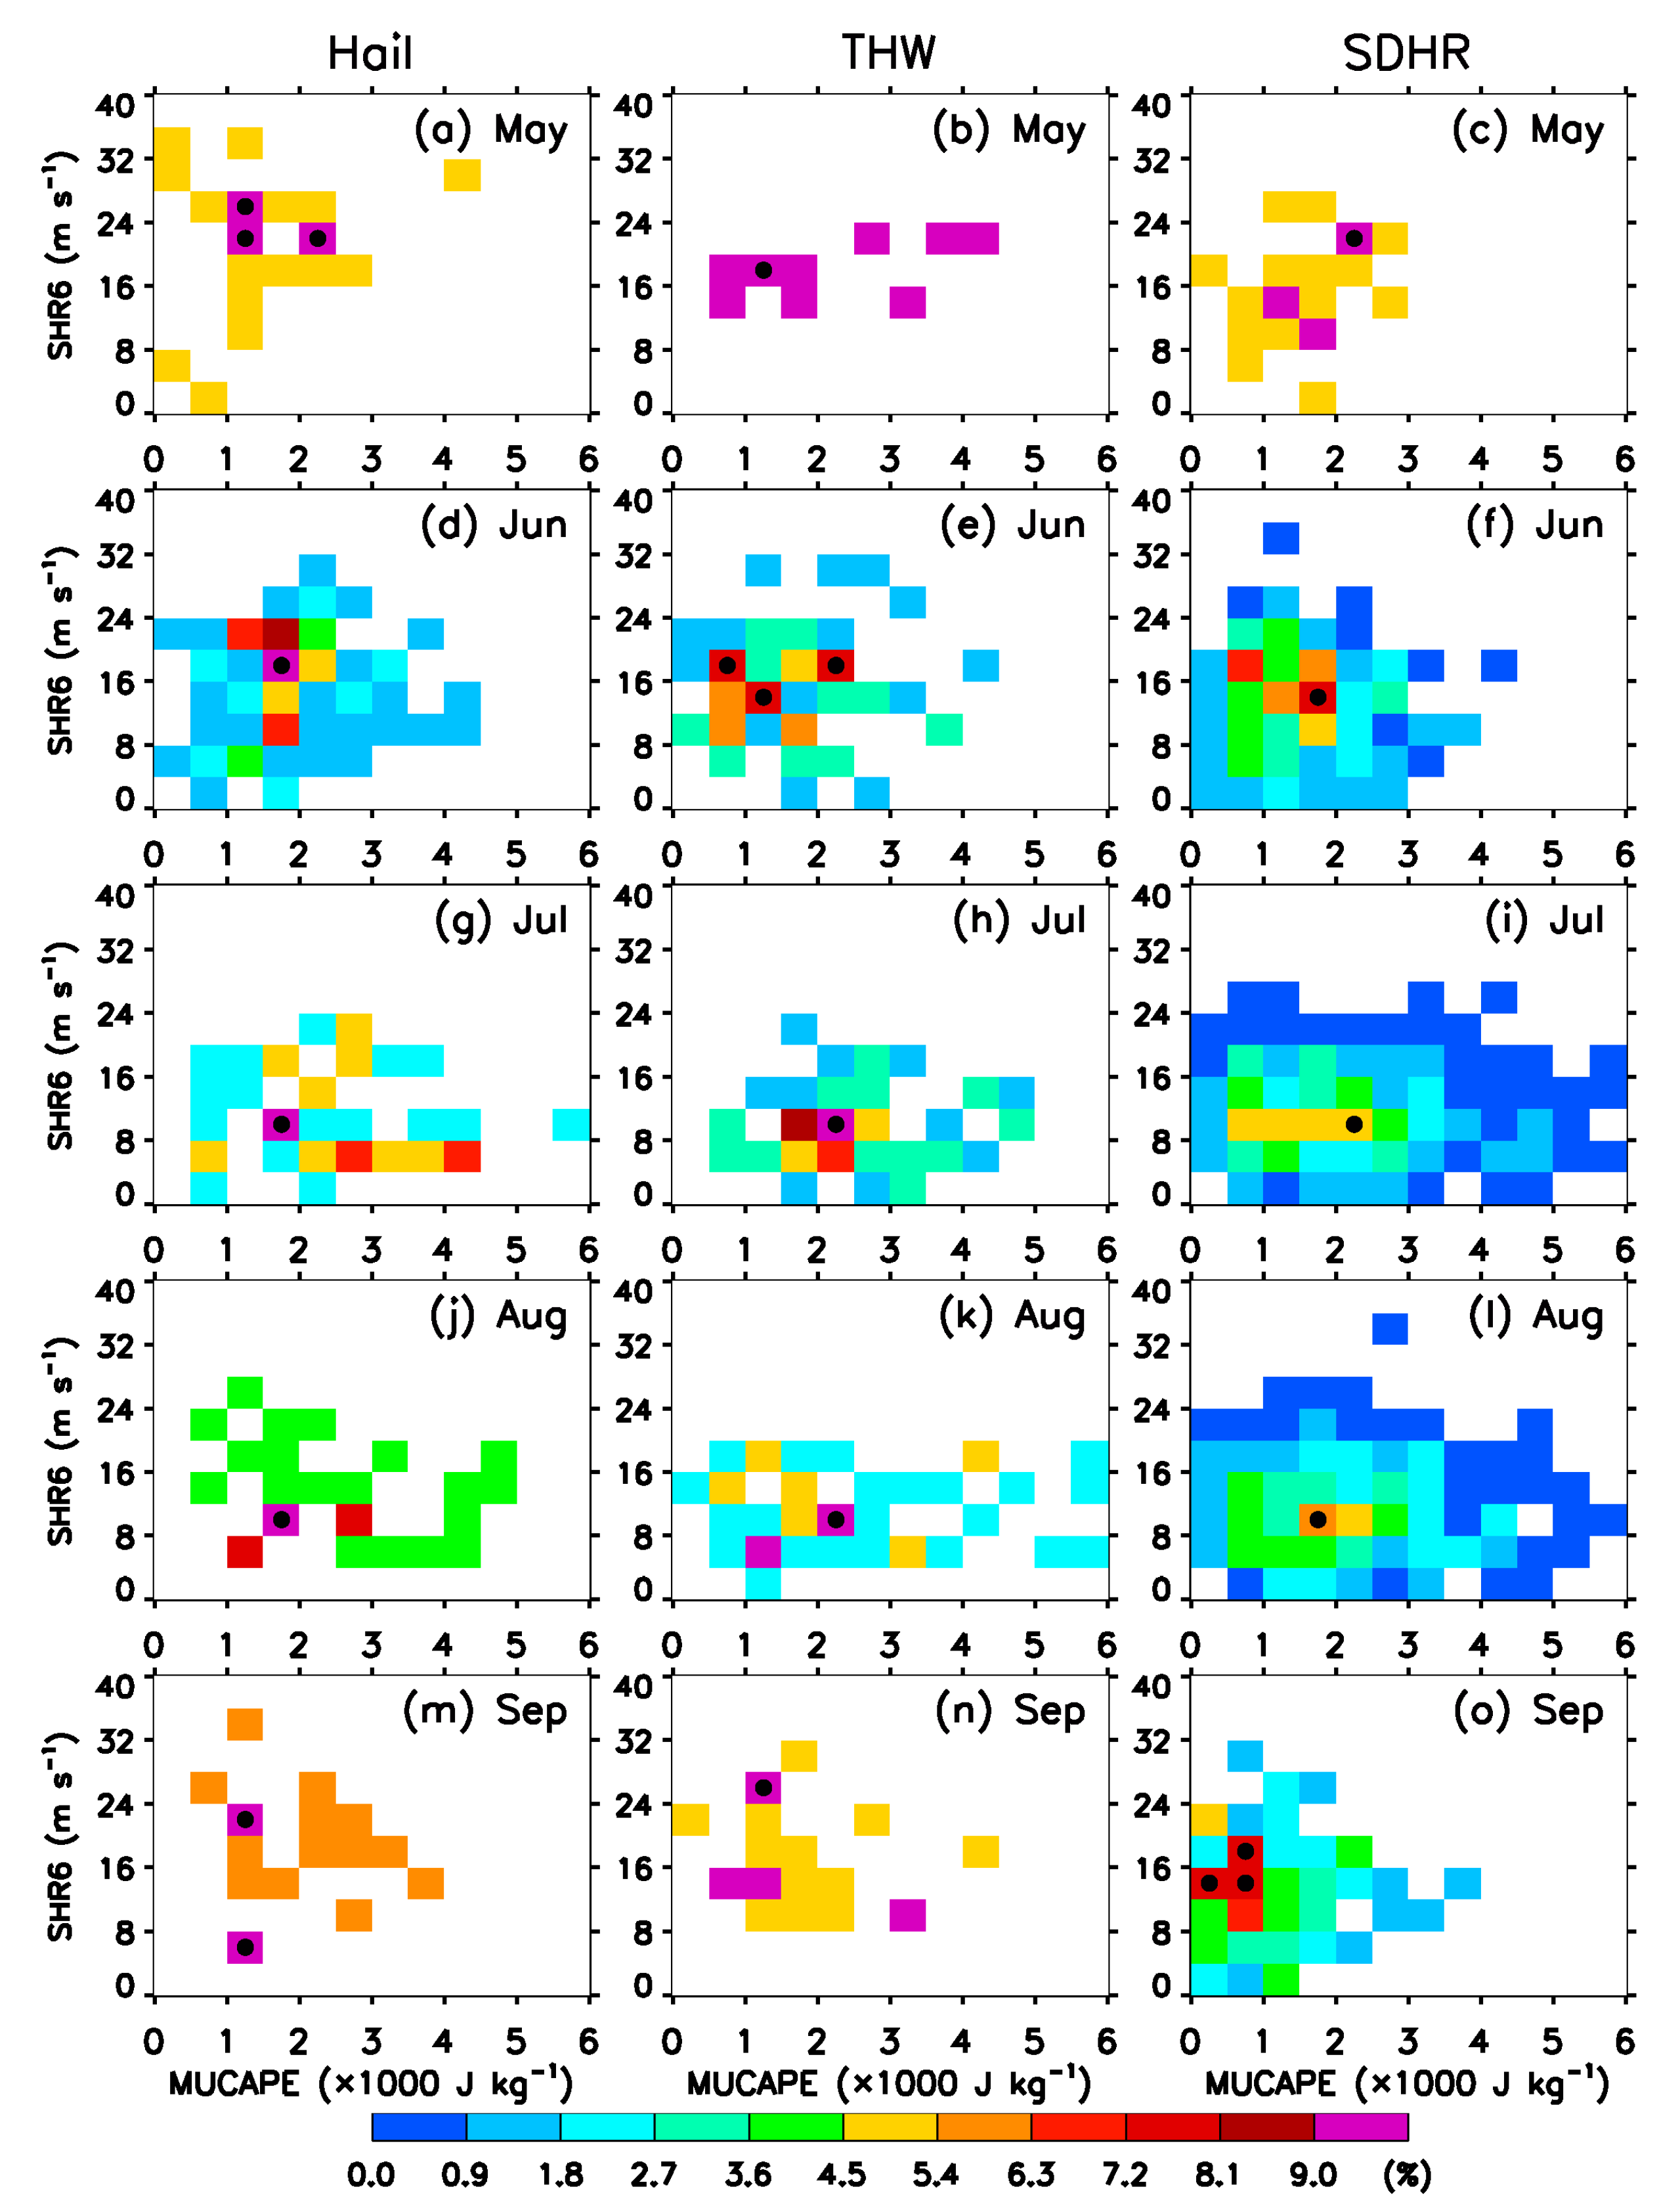
Figure 11 and Figure 12 show the probability distributions of severe convective events in each month in the MUCAPE–SHR6 space over mountains and plains, respectively. Hail events in June tend to occur in environments with larger SHR6 than those in July and August (Figure 11a,d,g,j,m; Figure 12a,d,g,j,m). This is more pronounced over the plains: while the majority of the hail events over the plains in July–August appear in the weak SHR6 (<12 m s−1) space, those in June are concentrated in the moderate to high SHR6 (16–24 m s−1) regime. By contrast, the hail events in July and August are associated with larger MUCAPE than those in June. Again, the characteristic is more distinct over the plains: while the high probability of hail events over the plains is confined in the MUCAPE regime of 1000–2500 J kg−1 in June, those in July and August show MUCAPE values extending from 1000 J kg−1 to large values of 4500 J kg−1 and 3000 J kg−1, respectively. These results indicate that hail events in North China, especially those in the North China plain, tend to occur in environments with notably stronger deep-layer shear in June and apparently higher instability in July–August, respectively.
As for THWs (Figure 11b,e,h,k,n; Figure 12b,e,h,k,n), the majority of the events in July and August over both mountains and plains occur in weak SHR6 (4–12 m s−1) and moderate to strong MUCAPE (>1000 J kg−1) environments (except that the THW events over the mountains in August are also relatively frequent in low MUCAPE environments of 500–1000 J kg−1). In comparison, THW events in June are associated with larger SHR6 but smaller MUCAPE. For example, the THW events in June are concentrated in 8–16 m s-1 and 12–20 m s-1 SHR6 space over the mountains and plains, respectively, and more THW events occur in weak MUCAPE environments (MUCAPE < 1000 J kg−1) in June compared with July and August.
For SDHR (Figure 11c,f,i,l,o; Figure 12c,f,i,l,o), the majority of the events in September over both mountains and plains are observed in small to moderate MUCAPE (<1500 J kg−1) space, whereas those occur in May are associated with larger MUCAPE values. This is more pronounced over the plains, where the majority of the SDHR events in May are observed in moderate and strong MUCAPE space with the maximum appeared at MUCAPE of 2000–2500 J kg−1. Over both mountains and plains, the SDHR events in June are associated with the largest SHR6 and those in July are associated with the greatest MUCAPE.

4. Conclusions

Using SWRs, surface precipitation observations, surface routine observations, and the ECMWF ERA5 reanalysis dataset during the warm seasons of 2011–2018 over North China, this work presents an eight-year climatology of three types of severe convective events (i.e., hail, THWs, and SDHR) over North China and their associated environmental conditions. Severe convective events are classified according to altitude, severity, and month to facilitate comparison of the statistical characteristics and environments between different categories. Our main findings are listed below.
Hail and THWs are more common over the mountains while SDHR events are more frequent over the plains. In June, the greatest frequency of both hail and THW events are found over the north of Hebei province. For hail, the distribution shifts gradually towards northwest during July–August. For THWs, the distribution shows a remarkable displacement toward the west in July and maintains a similar spatial pattern in August–September. The spatial distribution of the SDHR frequency is characterized by a maximum in the south of the North China region in May, two maxima in Shandong province and Beijing–Tianjin–northeast Hebei during July–August, and two maxima in the boundary of Hebei and Shandong and south Liaoning in August. The occurrence frequency of the severe convective events exhibits distinct annual and monthly variations. Both hail and THWs frequencies peak in June whereas SDHR frequency peaks in July. Further classification of the severe convective events reveals that the monthly variations of hail and SDHR events with different altitudes and severities are in line with those of the total events, whereas such an agreement is not found for THW events. The diurnal peaks of hail, THW, and SDHR frequencies appear at 1500–1600, 1800–1900, and 1600–1700 BST, respectively. The SDHR events over the plains also exhibit a secondary peak at 0200–0300 BST.
A total of 563 hail soundings, 572 THW soundings, and 2392 SDHR soundings are obtained to analyze the environmental conditions associated with the severe convective events. When considering both the statistical significance and operational significance, it is concluded that, the LR85, thetase500, and PW are skillful in distinguishing hail and THW environments from SDHR environments, and thetase500 is a useful parameter to discriminate between hail and THW environments. The convective environments over the plains are characterized by significantly higher (lower) PW (LR85) compared with mountains. By contrast, the abilities of the environmental parameters in forecasting the severity of the convective hazards are limited. The probability distributions in the MUCAPE–SHR6 space show that the occurrence of significant hail requires not only higher instability but also stronger deep-layer shear compared with ordinary hail, regardless of the altitude. For increased severity, THW events over the mountains show more dependence on the deep-layer shear whereas the THW events over the plains rely more on the instability. The significant SDHR events over the plains tend to occur in a variety of instability environments.
The thermodynamic parameters (i.e., MUCAPE, thetase500, and DCAPE), water vapor parameter (PW) are significantly higher in July and August compared with other warm-season months, whereas the LR85 and vertical wind shear are apparently higher in May, June and September. Probability distributions in the MUCAPE–SHR6 space suggest that hail events in North China, especially those in the North China plain, tend to occur in environments with evidently stronger deep-layer shear in June and arguably higher instability in July and August, respectively. Over both mountains and plains, THWs in July–August are more dependent on the instability conditions. Compared with other warm-season months, the SDHR events in June are associated with the largest SHR6 and those in July are associated with the greatest MUCAPE.
Undoubtedly, the spatiotemporal distribution of severe convective events as well as their associated environmental conditions are regulated by larger-scale (i.e., planetary and synoptic scale) systems. Further studies are needed to associate the statistical results with the atmospheric circulation pattern and its seasonal variations to better address the scientific issues.

Supplementary Materials

The following are available online at https://www.mdpi.com/2073-4433/12/1/52/s1, Table S1: Significance test results of the environmental parameters for six paired categories at the 0.05 significance level according to the procedure described in Section 2. Categories are paired to test the significance of the differences between three types of severe convective events (i.e., hail, THWs, and SDHR). The letters “T” and “W” represent t tests and Wilcoxon–Mann–Whitney tests, respectively. “95%” (“–”) indicates that the difference of the paired category is significant (not significant) at the 0.05 significance level, Table S2: Same as Table S1, but for the pairings of severe convective events over mountains and plains, Table S3: Same as Table S1, but for the pairings of ordinary and significant severe convective events.

Author Contributions

Conceptualization, J.S., S.F. (Shuanglei Feng), S.J. and S.F. (Shenming Fu); methodology, J.S. and S.F. (Shenming Fu); software, R.M. and S.J.; validation, J.S., S.F. (Shuanglei Feng), S.S., S.F. (Shenming Fu) and R.M.; formal analysis, R.M. and H.H.; investigation, J.S., S.F. (Shuanglei Feng), S.J. and R.M.; resources, J.S., S.S., H.H. and S.F. (Shenming Fu); data curation, S.F. (Shuanglei Feng), S.J. and R.M.; writing—original draft preparation, R.M.; writing—review and editing, J.S., S.F. (Shenming Fu), S.S. and R.M.; visualization, R.M.; supervision, J.S., S.F. (Shuanglei Feng) and S.F. (Shenming Fu); project administration, J.S., S.J. and S.F. (Shenming Fu); funding acquisition, S.F. (Shuanglei Feng), S.J., J.S. and S.F. (Shenming Fu). All authors have read and agreed to the published version of the manuscript.

Funding

This research was funded by the Science and Technology Foundation of State Grid Corporation of China (Grant No. 5200-202016243A-0-0-00).

Institutional Review Board Statement

Not applicable.

Informed Consent Statement

Not applicable.

Data Availability Statement

The ECMWF ERA5 reanalysis dataset presented in this study are openly available in Copernicus Climate Change Service Climate Data Store at https://cds.climate.copernicus.eu/cdsapp#!/home, reference number [44].

Acknowledgments

The authors gratefully acknowledge the NMC, CMA for providing severe weather reports, surface precipitation observations, and surface routine observations used in this study. Thanks are due to Xinlin Yang from the Institute of Atmospheric Physics, Chinese Academy of Sciences for making the thunderstorm high winds dataset available.

Conflicts of Interest

The authors declare no conflict of interest.

References

  1. Zheng, Y.G.; Zhou, K.H.; Sheng, J.; Lin, Y.J.; Tian, F.Y.; Tang, W.Y.; Lan, Y.; Zhu, W.J. Advances in techniques of monitoring, forecasting and warning of severe convective weather. J. Appl. Meteorol. Sci. 2015, 26, 641–657. (In Chinese) [Google Scholar]
  2. Li, M.X.; Zhang, D.-L.; Sun, J.S. A Statistical Analysis of Hail Events and Their Environmental Conditions in China during 2008–15. J. Appl. Meteorol. Climatol. 2018, 57, 2817–2833. [Google Scholar] [CrossRef]
  3. Chen, J.; Zheng, Y.G.; Zhang, X.L.; Zhu, P.J. Distribution and diurnal variation of warm-season short-duration heavy rainfall in relation to the MCSs in China. Acta Meteorol. Sin. 2013, 27, 868–888. [Google Scholar] [CrossRef]
  4. Meng, Z.Y.; Yan, D.; Zhang, Y.J. General features of squall lines in east China. Mon. Weather Rev. 2013, 141, 1629–1647. [Google Scholar] [CrossRef]
  5. Yang, X.L.; Sun, J.H.; Zheng, Y.G. A 5-yr climatology of severe convective wind events over China. Weather Forecast. 2017, 32, 1289–1299. [Google Scholar] [CrossRef]
  6. Sun, J.S.; Yang, B. Meso-β scale torrential rain affected by topography and the urban circulations. Chin. J. Atmos. Sci. 2008, 32, 1352–1364. (In Chinese) [Google Scholar]
  7. Chen, M.X.; Wang, Y.C.; Gao, F.; Xiao, X. Diurnal variations in convective storm activity over contiguous North China during the warm season based on radar mosaic climatology. J. Geophys. Res. 2012, 117, 20115. [Google Scholar] [CrossRef] [Green Version]
  8. Chen, M.X.; Xiao, X.; Gao, F.; Lei, L.; Wang, Y.C.; Sun, J.Z. A case study and batch verification on high resolution numerical simulations of severe convective events using an analysis based on rapid-refresh 4-D variational radar data assimilation. Acta Meteorol. Sin. 2016, 74, 421–441. (In Chinese) [Google Scholar]
  9. Li, H.Q.; Cui, X.P.; Zhang, D.-L. On the initiation of an isolated heavy-rain-producing storm near the central urban area of the Beijing metropolitan region. Mon. Weather Rev. 2017, 145, 181–197. [Google Scholar] [CrossRef]
  10. Doswell, C.A., III. The distinction between large-scale and mesoscale contribution to severe convection: A case study example. Weather Forecast. 1994, 9, 625–629. [Google Scholar] [CrossRef] [Green Version]
  11. Doswell, C.A., III; Brooks, H.E.; Maddox, R.A. Flash-flood forecasting: An ingredients-based methodology. Weather Forecast. 1996, 11, 560–581. [Google Scholar] [CrossRef]
  12. Wetzel, S.W.; Martin, J.E. An operational ingredients-based methodology for forecasting midlatitude winter season precipitation. Weather Forecast. 2000, 16, 156–167. [Google Scholar] [CrossRef]
  13. Zhang, X.L.; Tao, S.Y.; Sun, J.H. Ingredients-based heavy rainfall forecasting. Chin. J. Atmos. Sci. 2010, 34, 754–766. (In Chinese) [Google Scholar]
  14. Brooks, H.E.; Doswell, C.A., III; Cooper, J. On the environments of tornadic and nontornadic mesocyclones. Weather Forecast. 1994, 9, 606–618. [Google Scholar] [CrossRef] [Green Version]
  15. Rasmussen, E.N.; Blanchard, D.O. A baseline climatology of sounding-derived supercell and tornado forecast parameters. Weather Forecast. 1998, 13, 1148–1164. [Google Scholar] [CrossRef] [Green Version]
  16. Brooks, H.E.; Craven, J.P. A database proximity soundings for significant severe thunderstorms, 1957–1993. In Proceedings of the 21st Conference on Severe Local Storms, San Antonio, TX, USA, 11–16 October 2001. [Google Scholar]
  17. Thompson, R.L.; Edwards, R.; Hart, J.A.; Elmore, K.L.; Markowski, P. Close proximity soundings within supercell environments obtained from the Rapid Update Cycle. Weather Forecast. 2003, 18, 1243–1261. [Google Scholar] [CrossRef] [Green Version]
  18. Thompson, R.L.; Mead, C.M.; Edwards, R. Effective storm-relative helicity and bulk shear in supercell thunderstorm environments. Weather Forecast. 2007, 22, 102–115. [Google Scholar] [CrossRef]
  19. Groenemeijer, P.H.; van Delden, A. Sounding-derived parameters associated with large hail and tornadoes in the Netherlands. Atmos. Res. 2007, 83, 473–487. [Google Scholar] [CrossRef]
  20. Taszarek, M.; Kolendowicz, L. Sounding-derived parameters associated with tornado occurrence in Poland and universal tornadic index. Atmos. Res. 2013, 134, 186–197. [Google Scholar] [CrossRef]
  21. Hurlbut, M.M.; Cohen, A.E. Environments of Northeast U.S. severe thunderstorm events from 1999 to 2009. Weather Forecast. 2014, 29, 3–22. [Google Scholar] [CrossRef] [Green Version]
  22. Púčik, T.; Groenemeijer, P.; Rýva, D.; Kolář, M. Proximity soundings of severe and nonsevere thunderstorms in central Europe. Mon. Weather Rev. 2015, 143, 4805–4821. [Google Scholar] [CrossRef]
  23. Tuovinen, J.; Rauhala, J.; Schultz, D.M. Significant-hail-producing storms in Finland: Convective-storm environment and mode. Weather Forecast. 2015, 30, 1064–1076. [Google Scholar] [CrossRef]
  24. Kahraman, A.; Kadioglu, M.; Markowski, P.M. Severe convective storm environments in Turkey. Mon. Weather Rev. 2017, 145, 4711–4725. [Google Scholar] [CrossRef]
  25. Liao, X.N. Analysis on environmental condition for wind gust in Beijing area. Clim. Environ. Res. 2009, 14, 54–62. (In Chinese) [Google Scholar]
  26. Lei, L.; Sun, J.S.; Wei, D. Distinguishing the category of the summer convective weather by sounding data in Beijing. Meteorol. Mon. 2011, 37, 136–141. (In Chinese) [Google Scholar]
  27. Fan, L.M.; Yu, X.D. Characteristic analyses on environmental parameters in short-term severe convective weather in China. Plateau Meteorol. 2013, 32, 156–165. (In Chinese) [Google Scholar]
  28. Chen, Y.Z.; Yu, X.D.; Chen, X.L. Characteristics of short-time severe rainfall events based on weather flow and key environmental parameters in Pearl River Delta. Meteorol. Mon. 2016, 42, 144–155. (In Chinese) [Google Scholar]
  29. Fang, C.; Wang, X.G.; Sheng, J.; Cao, Y.C. Temporal and spatial distribution of North China thunder-gust winds and the statistical analysis of physical characteristics. Plateau Meteorol. 2017, 36, 1368–1385. (In Chinese) [Google Scholar]
  30. Yang, X.L.; Sun, J.H.; Lu, R.; Zhang, X. Environmental characteristics of severe convective wind over South China. Meteorol. Mon. 2017, 43, 769–780. (In Chinese) [Google Scholar]
  31. Cao, Y.C.; Tian, F.Y.; Zheng, Y.G.; Sheng, J. Statistical characteristics of environmental parameters for hail over the two-step terrains of China. Plateau Meteorol. 2018, 37, 185–196. (In Chinese) [Google Scholar]
  32. Gao, X.M.; Yu, X.D.; Wang, L.J.; Wang, W.B.; Wang, S.J.; Wang, X.H.; Han, X. Characteristics of environmental parameters for classified severe convective weather in central area of Shandong province. Acta Meteorol. Sin. 2018, 76, 196–212. (In Chinese) [Google Scholar]
  33. Tian, F.Y.; Zheng, Y.G.; Zhang, T.; Zhang, X.L.; Mao, D.Y.; Sun, J.H.; Zhao, S.X. Statistical characteristics of environmental parameters for warm-season short-duration heavy rainfall over central and eastern China. J. Meteorol. Res. 2015, 29, 370–384. [Google Scholar] [CrossRef]
  34. Qin, L.; Li, Y.D.; Gao, S.T. The synoptic and climatic characteristics studies of thunderstorm winds in Beijing. Clim. Environ. Res. 2006, 11, 754–762. (In Chinese) [Google Scholar]
  35. Yan, S.Y.; Li, Y.Y.; Qi, L.L.; An, J.; Liu, J. Analysis and application of thermo-dynamical and dynamical indexes associated with thunderstorm gale in North China. Torrential Rain Disaster 2013, 32, 17–23. (In Chinese) [Google Scholar]
  36. Chai, D.H.; Yang, X.L.; Wu, Z.Y.; Yan, X.J.; Pei, Y.J.; Li, Z.T.; Zhang, Y.J. The statistical analysis of thunderstorm gales over Beijing-Tianjin-Hebei region. Torrential Rain Disaster 2017, 36, 193–199. (In Chinese) [Google Scholar]
  37. Yang, X.L.; Sun, J.H. Organizational modes of severe wind-producing convective systems over North China. Adv. Atmos. Sci. 2018, 35, 540–549. [Google Scholar] [CrossRef]
  38. Yu, Z.Y.; He, L.F.; Fan, G.Z.; Li, Z.C.; Su, Y.L. The basic features of the severe convection at the background of cold vortex over North China. J. Trop. Meteorol. 2011, 27, 89–94. (In Chinese) [Google Scholar]
  39. Xiao, X.; Sun, J.Z.; Chen, M.X.; Xie, X.S.; Wang, Y.C.; Ying, Z.M. The characteristics of weakly forced mountain-to-plain precipitation systems based on radar observations and high-resolution reanalysis. J. Geophys. Res. Atmos. 2017, 122, 3193–3213. [Google Scholar] [CrossRef]
  40. Craven, J.P.; Brooks, H.E.; Hart, J.A. Baseline climatology of sounding derived parameters associated with deep, moist convection. In Proceedings of the 21st Conference on Severe Local Storms, San Antonio, TX, USA, 11–16 October 2001. [Google Scholar]
  41. Taszarek, M.; Brooks, H.E.; Czernecki, B. Sounding-derived parameters associated with convective hazards in Europe. Mon. Weather Rev. 2017, 145, 1511–1528. [Google Scholar] [CrossRef]
  42. Zheng, L.L.; Sun, J.H.; Zhang, X.L.; Liu, C.H. Organizational Modes of Mesoscale Convective Systems over Central East China. Weather Forecast. 2013, 28, 1081–1098. [Google Scholar] [CrossRef] [Green Version]
  43. Fan, W.J.; Yu, X.D. Characteristics of spatial-temporal distribution of tornadoes in China. Meteorol. Mon. 2015, 41, 793–805. (In Chinese) [Google Scholar]
  44. Copernicus Climate Change Service (C3S). ERA5: Fifth Generation of ECMWF Atmospheric Reanalyses of the Global Climate. Copernicus Climate Change Service Climate Data Store (CDS). 2017. Available online: https://cds.climate.copernicus.eu/cdsapp#!/home (accessed on 22 November 2019).
  45. Brooks, H.E.; Lee, J.W.; Craven, J.P. The spatial distribution of severe thunderstorm and tornado environments from global reanalysis data. Atmos. Res. 2003, 67–68, 73–94. [Google Scholar] [CrossRef]
  46. Brooks, H.E.; Anderson, A.R.; Riemann, K.; Ebbers, I.; Flachs, H. Climatological aspects of convective parameters from the NCAR/NCEP reanalysis. Atmos. Res. 2007, 83, 294–305. [Google Scholar] [CrossRef]
  47. Markowski, P.M.; Hannon, C.; Frame, J.; Lancaster, E.; Pietrycha, A.; Edwards, R.; Thompson, R.L. Characteristics of vertical wind profiles near supercells obtained from the Rapid Update Cycle. Weather Forecast. 2003, 18, 1262–1272. [Google Scholar] [CrossRef]
  48. Allen, J.T.; Karoly, D.J. A climatology of Australian severe thunderstorm environments 1979–2011: Inter-annual variability and ENSO influence. Int. J. Climatol. 2014, 34, 81–97. [Google Scholar] [CrossRef]
  49. Wang, X.M.; Yu, X.D.; Zhu, H. The applicability of NCEP reanalysis data to severe convection environment analysis. J. Appl. Meteorol. Sci. 2012, 23, 139–146. (In Chinese) [Google Scholar]
  50. Gensini, V.A.; Mote, T.L.; Brooks, H.E. Severe-thunderstorm reanalysis environments and collocated radiosonde observations. J. Appl. Meteorol. Climatol. 2014, 53, 742–751. [Google Scholar] [CrossRef]
  51. King, A.T.; Kennedy, A.D. North American supercell environments in atmospheric reanalysis and RUC-2. J. Appl. Meteorol. Climatol. 2019, 58, 71–92. [Google Scholar] [CrossRef]
  52. Johnson, R.H.; Bresch, J.F. Diagnosed characteristics of precipitation systems over Taiwan during the May June 1987 TAMEX. Mon. Weather Rev. 1991, 119, 2540–2557. [Google Scholar] [CrossRef]
  53. Pan, Y.J.; Zhao, K.; Pan, Y.N. Single-Doppler radar observation of a heavy-precipitation supercell on a severe squall line. Acta Meteorol. Sin. 2008, 66, 621–636. (In Chinese) [Google Scholar]
  54. Johnson, A.W.; Sugden, K.E. Evaluation of sounding-derived thermodynamic and wind-related parameters associated with large hail events. Electron. J. Severe Storms Meteorol. 2014, 9, 1–42. [Google Scholar]
  55. Reames, J.L. Diurnal Variations in Severe Weather Forecast Parameters of Rapid Update Cycle-2 Tornado Proximity Environments. Weather Forecast. 2017, 32, 743–761. [Google Scholar] [CrossRef]
  56. Johns, R.H.; Doswell, C.A., III. Severe local storms forecasting. Weather Forecast. 1992, 7, 588–612. [Google Scholar] [CrossRef] [Green Version]
  57. Weisman, M.L.; Klemp, J.B. The dependence of numerically simulated convective storms on vertical wind shear and buoyancy. Mon. Weather Rev. 1982, 110, 504–520. [Google Scholar] [CrossRef]
  58. Gilmore, M.S.; Wicker, L. The influence of midtropospheric dryness on supercell morphology and evolution. Mon. Weather Rev. 1998, 126, 943–958. [Google Scholar] [CrossRef]
  59. Browning, K.A.; Ludlam, F.H. Airflow in convective storms. Q. J. R. Meteorol. Soc. 2010, 88, 117–135. [Google Scholar] [CrossRef]
  60. Berthet, C.; Wesolek, E.; Dessens, J.; Sanches, J.L. Extreme hail day climatology in Southwestern France. Atmos. Res. 2013, 123, 139–150. [Google Scholar] [CrossRef]
  61. Doswell, C.A., III; Rasmussen, E.N. The effect of neglecting the virtual temperature correction on CAPE calculations. Weather Forecast. 1994, 9, 625–629. [Google Scholar] [CrossRef] [Green Version]
  62. University of Wyoming Atmospheric Soundings. Available online: http://weather.uwyo.edu/upperair/sounding.html (accessed on 10 December 2020).
  63. Wilks, D.S. Statistical Methods in the Atmospheric Sciences; Academic Press: Cambridge, MA, USA, 2011; p. 676. [Google Scholar]
  64. Li, X.F.; Zhang, Q.H.; Zou, T.; Lin, J.P.; Kong, H.; Ren, Z.H. Climatology of hail frequency and size in China, 1980–2015. J. Appl. Meteorol. Climatol. 2018, 57, 875–887. [Google Scholar] [CrossRef]
  65. He, H.Z.; Zhang, F.Q. Diurnal variations of warm-season precipitation over northern China. Mon. Weather Rev. 2010, 138, 1017–1025. [Google Scholar] [CrossRef]
  66. Wolyn, P.G.; McKee, T.B. The mountain–plains circulation east of a 2-km-high north–south barrier. Mon. Weather Rev. 1994, 122, 1490–1508. [Google Scholar] [CrossRef] [Green Version]
  67. Das, P. Influence of wind shear on the growth of hail. J. Atmos. Sci. 1962, 19, 407–414. [Google Scholar] [CrossRef] [Green Version]
  68. Dennis, E.J.; Kumjian, M.R. The impact of vertical wind shear on hail growth in simulated supercells. J. Atmos. Sci. 2017, 74, 641–663. [Google Scholar] [CrossRef]
  69. Tukey, J.W. Exploratory Data Analysis; Addison Wesley: Reading, MA, USA, 1977. [Google Scholar]
  70. Krzywinski, M.; Altman, N. Points of significance: Visualizing samples with box plots. Nat. Methods 2014, 11, 119–120. [Google Scholar] [CrossRef]
Figure 1. Topographic map (shading, units: km) with names of major landforms and cities/provinces over North China.
Atmosphere 12 00052 g001
Figure 2. Spatial distribution of the (a) precipitation stations in 2011 over North China in 0.25° × 0.25° grid boxes. (b) stations in the SWRs dataset during the warm seasons of 2011–2018 over North China. In panel (b), red circles (plus signs) indicate stations that have at least one occurrence of hail (THWs) during the study period, and the remaining stations are marked in black dots. Gray shadings represent topography.
Atmosphere 12 00052 g002
Figure 3. Spatial distribution of the occurrence frequencies of (ac) all severe convective events, (df) ordinary (ord.) severe convective events, and (gi) significant (sig.) severe convective events during the warm seasons of 2011–2018 over North China. Panels (a,d,g) represent hail events, (b,e,h) represent THW events, and (c,f,i) represent SDHR events. Gray shadings represent topography.
Atmosphere 12 00052 g003
Figure 4. Spatial distribution of the occurrence frequencies of all (ae) hail, (fj) THW, and (ko) SDHR events in each of the five warm-season months during 2011–2018 over North China. Gray shadings represent topography.
Atmosphere 12 00052 g004
Figure 5. Yearly and monthly distributions of the occurrence frequencies of all (a) hail, (b) THW, and (c) SDHR events during the warm seasons of 2011–2018 over North China.
Atmosphere 12 00052 g005
Figure 6. Monthly variation of the normalized occurrence frequencies of (a) hail, (b) THW, and (c) SDHR events of varying altitudes and severities during the warm seasons of 2011–2018 over North China. Solid (dashed) lines represent severe convective events over the mountains (plains). Blue (red) lines represent ordinary (significant) events.
Atmosphere 12 00052 g006
Figure 7. Same as Figure 6, but for the diurnal variation of the normalized occurrence frequencies of (a) hail, (b) THW, and (c) SDHR events. Grey bars represent the normalized total frequency of a particular type of event in each hour.
Atmosphere 12 00052 g007
Figure 8. Box-and-whisker plots of the environmental parameters associated with three types of severe convective events with different severities over the (a,c,e,g,i,k,m) mountains and (b,d,f,h,j,l,n) plains. Hail, THW, SDHR events are indicated in red, blue, and green, respectively. The box-and-whiskers filled with grey denote all events in this category while those on the left (right) denote ordinary (significant) events. Parameters include: (a,b) MUCAPE, (c,d) DCAPE, (e,f) LR85, (g,h) thetase500, (i,j) SHR3, (k,l) SHR6, and (m,n) PW. The 5th, 25th, 50th, 75th, and 95th percentiles are shown.
Atmosphere 12 00052 g008
Figure 9. Probability distribution of the occurrence frequencies of the (a,d,g,j) hail, (b,e,h,k) THW, and (c,f,i,l) SDHR events with different severities over the (af) mountains, and (gl) plains in the paired MUCAPE–SHR6 space. Panels (ac,gi) represent ordinary (ord.) severe convective events, and (df,jl) represent significant (sig.) severe convective events. Black dots indicate the grid(s) with the maximum probability.
Atmosphere 12 00052 g009
Figure 10. Box-and-whisker plots of the environmental parameters associated with three types of severe convective events in different months over the (a,c,e,g,i,k,m) mountains and (b,d,f,h,j,l,n) plains. Hail, THW, SDHR events are indicated in red, blue, and green, respectively. Parameters include: (a,b) MUCAPE, (c,d) DCAPE, (e,f) LR85, (g,h) thetase500, (i,j) SHR3, (k,l) SHR6, and (m,n) PW.
Atmosphere 12 00052 g010
Figure 11. Probability distribution of the occurrence frequencies of (a,d,g,j,m) hail, (b,e,h,k,n) THW, and (c,f,i,l,o) SDHR events in different months over the mountains in the paired MUCAPE–SHR6 space. Panels (ac), (df), (gi), (jl), and (mo) represent events that occur in May, June, July, August, and September, respectively. Black dots indicate the grid(s) with the maximum probability.
Atmosphere 12 00052 g011
Figure 12. Same as Figure 11, but for severe convective events over the plains. Panels (a,d,g,j,m) represent hail events, (b,e,h,k,n) represent THW events, and (c,f,i,l,o) represent SDHR events. Panels (ac), (df), (gi), (jl), and (mo) represent events that occur in May, June, July, August, and September, respectively.
Atmosphere 12 00052 g012
Table 1. Definition and classification (according to severity) of three types of severe convective events.
CategoryDefinitionCategoryDefinition
HailDiameter ≥ 5 mmOrdinary5 mm ≤ diameter < 10 mm
SignificantDiameter ≥ 10 mm
Thunderstorm high windsWind speeds ≥ 17.2 m s−1Ordinary17.2 m s−1 ≤ wind speeds < 24 m s−1
SignificantWind speeds ≥ 24 m s−1
Short-duration heavy rainfallHourly rain ≥ 20mm h−1Ordinary20 mm h−1 ≤ hourly rain < 50 mm h−1
SignificantHourly rain ≥ 50 mm h−1
Table 2. Parameters computed from proximity soundings in this study.
Parameter DescriptionAbbreviationUnit
Most unstable convective available potential energyMUCAPEJ kg−1
Downdraft convective available potential energyDCAPEJ kg−1
850–500 hPa temperature lapse rateLR85K km−1
Pseudo-equivalent potential temperature at 500 hPathetase500K
0–3 km above ground level bulk wind shearSHR3m s−1
0–6 km above ground level bulk wind shearSHR6m s−1
Precipitable water from the surface to 300 hPaPWmm
Publisher’s Note: MDPI stays neutral with regard to jurisdictional claims in published maps and institutional affiliations.