Article

Spatial Analysis (Measurements at Heights of 10 m and 20 m above Ground Level) of the Concentrations of Particulate Matter (PM10, PM2.5, and PM1.0) and Gaseous Pollutants (H2S) on the University Campus: A Case Study

by
Robert Cichowicz
* and
Maciej Dobrzański
*
Faculty of Architecture, Civil and Environmental Engineering, Lodz University of Technology, 90-924 Lodz, Poland
*
Authors to whom correspondence should be addressed.
Atmosphere 2021, 12(1), 62; https://doi.org/10.3390/atmos12010062
Submission received: 18 November 2020 / Revised: 24 December 2020 / Accepted: 29 December 2020 / Published: 1 January 2021
(This article belongs to the Special Issue Particulate Matters Emission in Poland)

Abstract

:
Spatial analysis of the distribution of particulate matter PM10, PM2.5, PM1.0, and hydrogen sulfide (H2S) gas pollution was performed in the area around a university library building. The reasons for the subject matter were reports related to the perceptible odor characteristic of hydrogen sulfide and a general poor assessment of air quality by employees and students. Due to the area of analysis, it was decided to perform measurements at two heights, 10 m and 20 m above ground level, using measuring equipment attached to a DJI Matrice 600 unmanned aerial vehicle (UAV). The aim of the measurements was air quality assessment and investigate the convergence of the theory of air flow around the building with the spatial distribution of air pollutants. Considerable differences of up to 63% were observed in the concentrations of pollutants measured around the building, especially between opposite sides, depending on the direction of the wind. To explain these differences, the theory of aerodynamics was applied to visualize the probable airflow in the direction of the wind. A strong convergence was observed between the aerodynamic model and the spatial distribution of pollutants. This was evidenced by the high concentrations of dust in the areas of strong turbulence at the edges of the building and on the leeward side. The accumulation of pollutants was also clearly noticeable in these locations. A high concentration of H2S was recorded around the library building on the side of the car park. On the other hand, the air turbulence around the building dispersed the gas pollution, causing the concentration of H2S to drop on the leeward side. It was confirmed that in some analyzed areas the permissible concentration of H2S was exceeded.

1. Introduction

Air quality is one of the key environmental factors influencing the health of living organisms, including humans. Air pollution of anthropogenic origin, in particular, is very harmful to the environment [1]. High concentrations of pollutants generated by human activity occur especially in industrial areas and cities, as well as in other spaces such as agricultural or recreational areas. These pollutants directly and indirectly affect the air quality not only around the source of the pollution, but also in the surrounding area [2,3,4,5,6,7]. The main pollutants according to criteria established for the protection of human health and plant protection are particulate matter (PM10, PM2.5, and increasingly PM1.0) and gaseous pollutants such as benzene, nitrogen dioxide, sulfur dioxide, carbon monoxide, ozone, lead, arsenic, cadmium, nickel, and benzo (a) pyrene in PM10 dust, as well as hydrogen sulfide (H2S) [8,9,10]. There are a number of international organizations working to protect the environment, such as Climate Action Network-International (CAN-INT), the Climate and Clean Air Coalition (CCAC), and the European Environment Agency (EEA).
This article focuses on the analysis of particulate matter and H2S, because these two types of pollutants particularly relevant at the selected location—a university campus where large numbers of young people congregate and there is an extensive parking infrastructure. Researchers have received reports from employees and students related to the perceptible odor characteristic of H2S and a general poor assessment of air quality. Particulate matter can have a negative impact on human health when it penetrates the body, not only directly—causing allergies and lung disease—but also indirectly, carrying heavy metals, microorganisms, and bacteria [11,12]. The permissible particulate matter concentration has been defined for PM10 at 50 μg/m3 (daily average) and 40 μg/m3 (annual average), and for PM2.5 at 25 μg/m3 (annual average). There are no standards for the PM1.0 fractions. Hydrogen sulfide is also a highly poisonous gas [13]. It is released into the atmosphere by oil refineries, natural-gas processing plants, food processing plants, and animal husbandry plants. Small concentrations of hydrogen sulfide in the air cause irritation to the eyes. At concentrations of 1400–2800 mg/m3 it causes paralysis of the respiratory center and, ultimately, respiratory arrest. At concentrations above 7000 mg/m3 death occurs within several seconds [14,15].
As atmospheric air has no physical boundaries, the movement of pollutants and changes in their concentration occur mainly due to the movement, direction, and force of the wind. For this reason, wind is one of the basic climatic factors affecting air quality. Wind can have the beneficial effect of venting the urban space and removing or diluting pollutants. On the other hand, wind may also spread pollutants across a larger area or direct them towards human habitations. To analyze airflow in relation to buildings, the theory of aerodynamics is used. As Hosker (1985) observed, modelling airflow even around a single solid object (such as a building) is a very complex problem (Figure 1). On the windward side, an object that presents an obstacle to moving air causes strong swirls (a horseshoe vortex) and an increase in wind speed at the edges [16]. On the leeward side, the zone of lower pressure causes back swirls (lateral edge and elevated vortex pair and eddy edges) [17].
The situation is even more complicated when there is an uneven spatial location of buildings of different shapes and sizes. These can cause zones of increased wind speed, turbulence, or air stagnation. Pollutants may accumulate in zones of air turbulence and stagnation [18] Research on the flow and spread of pollution in urban settings using models has a number of advantages [17]. Based on such analyses, the movement of pollutants in cities was linked to so-called street canyons, i.e., city streets surrounded by relatively tall buildings. This insight has inspired many numerical studies, which modeled the transport of pollutants in street canyons [19,20,21]. The transport of pollutants in and above a street canyon is influenced by numerous factors, such as the layout and aspect ratio (the street width relative to the height of the building), the building geometry (the height, width, and type of roof), the source of pollution (height and location), and flow conditions (wind direction and speed) [17]. However, numerical models do not allow all the complex processes that take place in the real world to be mapped [22]. For this reason, field studies analyzing airflow and concentrations of individual pollutants are still very important [23,24,25]. The aim of the article is to present the results of air quality analysis in relation to the permissible concentrations and to determine the convergence of the theory of air flow around a building with the spatial distribution of air pollutants.

2. Materials and Methods

2.1. Measuring Apparatus and Sampling Location

Our research was carried out in the city of Łódź, which is the third largest city in Poland (Central-eastern Europe) in terms of the number of inhabitants. We studied the area around the library building on the B campus of Lodz University of Technology. This campus is located in the south-west part of the center of Łódź, near the intersection of Wólczańska Street, Wróblewskiego Street, and Politechniki Avenue (Figure 2). The building consists of two parts: a lower two-story section, 8 m high, and a higher five-story section, 22 m tall. Inside, there are offices, reading rooms, and a library. Around the building, within a 50 m radius, there are green areas and car parks. On the north side, next to the Center for Papermaking and Printing (33 m high), there is a car park with approximately 40 parking spaces. On the north-west side, by the swimming pool building “Zatoka Sportu” (21 m high), there is a car park with 300 parking spaces. Slightly further along Wróblewskiego Street (on the south side), there are residential buildings with heights of 6 m to 10 m. The entire area of campus B has an area of about 16 ha, much of which is occupied by nineteenth-century mansions and revitalized post-factory buildings. The gross construction intensity index for the area ranges from 0.05 to 1.0, which corresponds to the intensity of development of single-family concentrated housing, areas of large housing estates, areas of large industrial plants, and areas of old suburban buildings.
Measurements around the library building were made at two heights, 10 m and 20 m above ground level, using measuring equipment mounted on a DJI Matrice 600 unmanned aerial vehicle (UAV). The heights were selected with consideration for safety. There are pedestrian and car routes as well as technical infrastructure around the building, and the area is located in the CTR zone of an airport, Władysław Reymont, which permits UAV flights only up to heights of 25 m. A grid of 30 points around the building, at which the UAV stopped to take measurements, was established using GPS coordinates in the DJI pilot application, to ensure the repeatability of the analysis (Figure 3).
The measurement apparatus was an eight-sensor module, which enabled the quantification of particulate matter and gaseous pollutants in the atmospheric air. Using a Laser Scattered (LS) sensor, the module measured PM10, PM2.5, and PM1.0 (10,000 particles per second). Metal Oxide Semiconductor (MOS) type sensors measured the concentration of organic solvents (Ethanol, Iso-Butane, H2, 0–500 ppm) and odors (0.5–1000 ppm isobutanol). ElectroChemical (EC) type sensors measured H2S (3 ppb–1 ppm), O2 (0.20–100%), and SO2 (0.5–2000 ppm). The measuring apparatus was equipped with a probe, 1.5 m long, which eliminated the influence of the UAV on air turbulence and therefore any possible impact on the results (Figure 4). The results for parameters with significant changes were selected for analysis. This article presents the measurement data for the concentrations of solid air pollutants PM10, PM2.5, and PM1.0 as well as for H2S as a representative of gaseous pollutants.

2.2. Spatial Method of Analyzing the Results

Spatial analysis of the obtained air quality data was carried out using the QGIS 3.10 program (GNU GPL license). The GPS coordinates of the measurement points obtained from the measuring equipment were added to the program in the form of a vector layer in the EPSG: 2180 system. The attributes of the points were the concentration values for the measured pollutant parameters. Using the software, spatial interpolation of the data was then performed, in order to obtain the spatial distribution of pollutants. Interpolation was performed on the basis of the Inverse Distance Weighting (IDW) method, which is used, inter alia, for the analysis of the distribution of pollutants in soil and groundwater [26,27]. In this way, a graphical visualization was obtained of the distribution of pollutants around the library building at two different heights, 10 m and 20 m above the ground.

2.3. Meteorological Data of Measurements

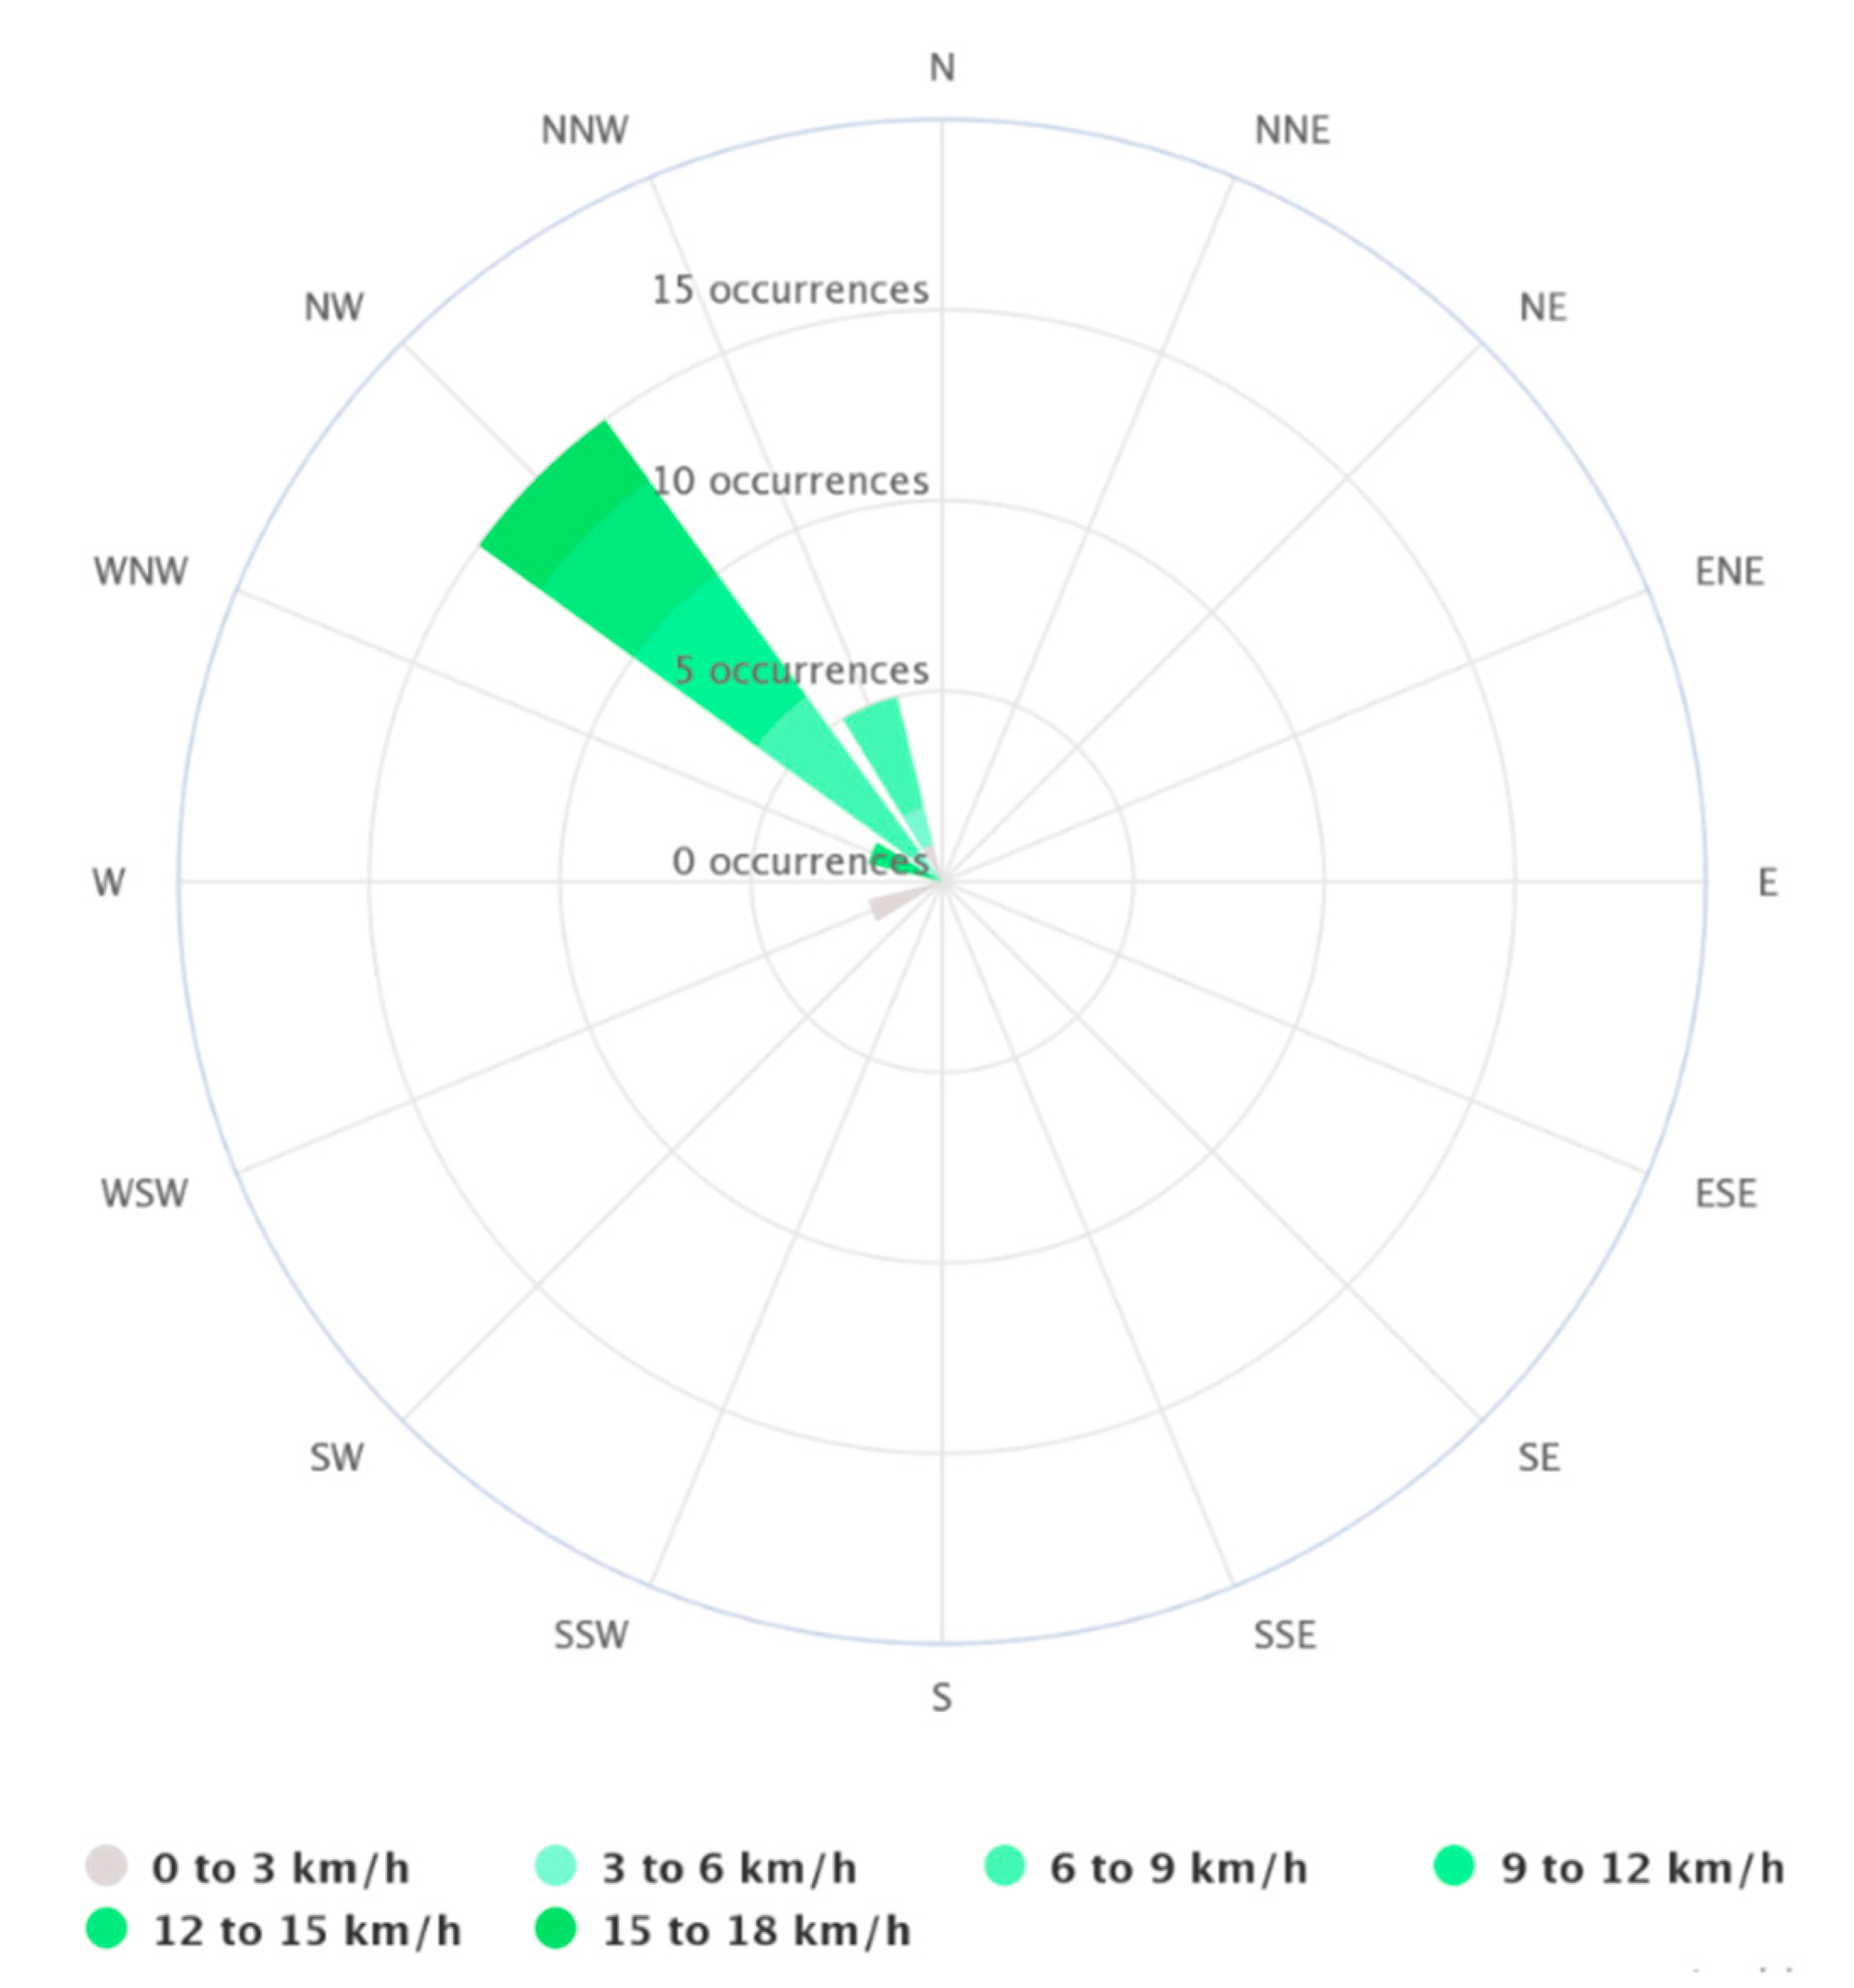
Given that the measurements were temporary, the analysis was based on data collected on the most representative day for this location in the summer period from 1 April 1 to 30 September, i.e., 20 August 2020. The data are typical results for the entire series. At the time of the measurements, from 9:40 a.m. to 11:00 a.m., the weather was sunny with little cloudiness (about 10%) and no rainfall. A weak wind, not exceeding 10.5 km/h, blowing in a south-easterly direction, was dominant (Figure 5). Detailed meteorological data are presented in Table 1. In the winter period, particulate matter air pollution caused by the combustion of coal is one of the most important problems in Polish cities (of the 50 most polluted cities in the EU, 36 are located in Poland). The level of pollution in the winter period is strongly related to the prevailing meteorological conditions (primarily air temperature), and thus instantaneous measurements on a given day are often unrepresentative. Therefore, so that the measurements would not be affected by large variability in external conditions, it was decided to conduct the analysis in the more predictable summer period.

3. Results and Discussions

The use of an unmanned aircraft with measuring equipment attached to it allowed for quick, accurate, and repeatable analysis of a large space around the library building at different heights relative to the terrain. The results made it possible to represent the changes that took place in the concentrations of individual air pollutants not only on a plane, but also with changing altitude. It was observed that, at a height of 10 m, the concentration of the smallest fraction of particulate pollutants, PM1.0, varied in the range from 2.70 μg/m3 to 4.82 μg/m3 (Figure 6A).
The highest concentrations were measured around the higher east and south-east parts of the building, which were on the leeward side in relation to the wind. It is likely that the air turbulence caused by the taller part of the building caused the accumulation and fall of wind-blown dust on the leeward side. This is compatible with the theory of airflow around the building. Interestingly, due to the position of a 21 m high swimming pool hall (Figure 2) close to the lower part of the building on the north-west side, the concentration of PM pollution at a height of 10 m on that side was 38% lower than the concentration on the leeward side of the higher part. Moreover, the concentration of PM1.0 on the north-west side of the building was almost half that on the south-east side. This was due to the roughness of the terrain in front of the building, the formation of a horseshoe vortex, and increased windspeed at the edges of the building.
At a height of 20 m (Figure 6B), concentrations of PM1.0 were 10% lower on the east side of the building compared to those measured at a height of 10 m, where the accumulation of pollutants was stronger. This may also be related to the stronger ventilation at a height of 20 m. It should be noted, however, that at a height of 20 m there was a similar range (2.22–5.06 μg/m3) of PM1.0 concentration to the range at 10 m. The highest concentration, at 5.06 μg/m3, was recorded around the higher part of the building on the south side. The taller part (22 m) of the library building presented a barrier to PM1.0 dust pollution moving with the wind over the surrounding buildings. Strong edge eddies contributed to the high concentrations of particulate matter on the leeward side of the building. Because the lower part (8 m) of the library building did not constitute a dust barrier, at a height of 20 m the concentration of PM1.0 was on average 40% lower than the maximum value. Based on methods described in the literature e.g., [16,29], a visualization (Figure 7) of the probable airflow around the library building was made during the measurements.
Figure 8 shows the concentrations around the building of PM2.5. At a height of 10 m above ground level, the concentration was in the range of 3.70–6.19 μg/m3. High concentrations, above 4.90 μg/m3, occurred on the east and south-east sides of the building, which is similar to the results for the PM1.0 particulate matter fraction. In the remaining areas of the analyzed building, the concentration of PM2.5 was about 27% lower and averaged 4.06 μg/m3. Again, this may have been due to the direction of the wind and severe air turbulence on the leeward wall of the taller part of the library building, which caused particulate matter to accumulate. At an altitude of 20 m, the average concentration of PM2.5 was 7% lower than that at 10 m, because heavier dust pollutants fell on the leeward side and higher concentrations occurred at lower altitudes. Due to the movement of dust over the surrounding buildings with the wind and the accumulation of pollutants, the concentration of PM2.5 on the east side of the building at a height of 20 m was 12% lower than that measured at 10 m. No significant differences were found in the remaining areas. As with the results of the measurements at a height of 10 m, lower concentrations of PM2.5 were measured around the lower part of the library building and on the north (windward) side of the entire facility.
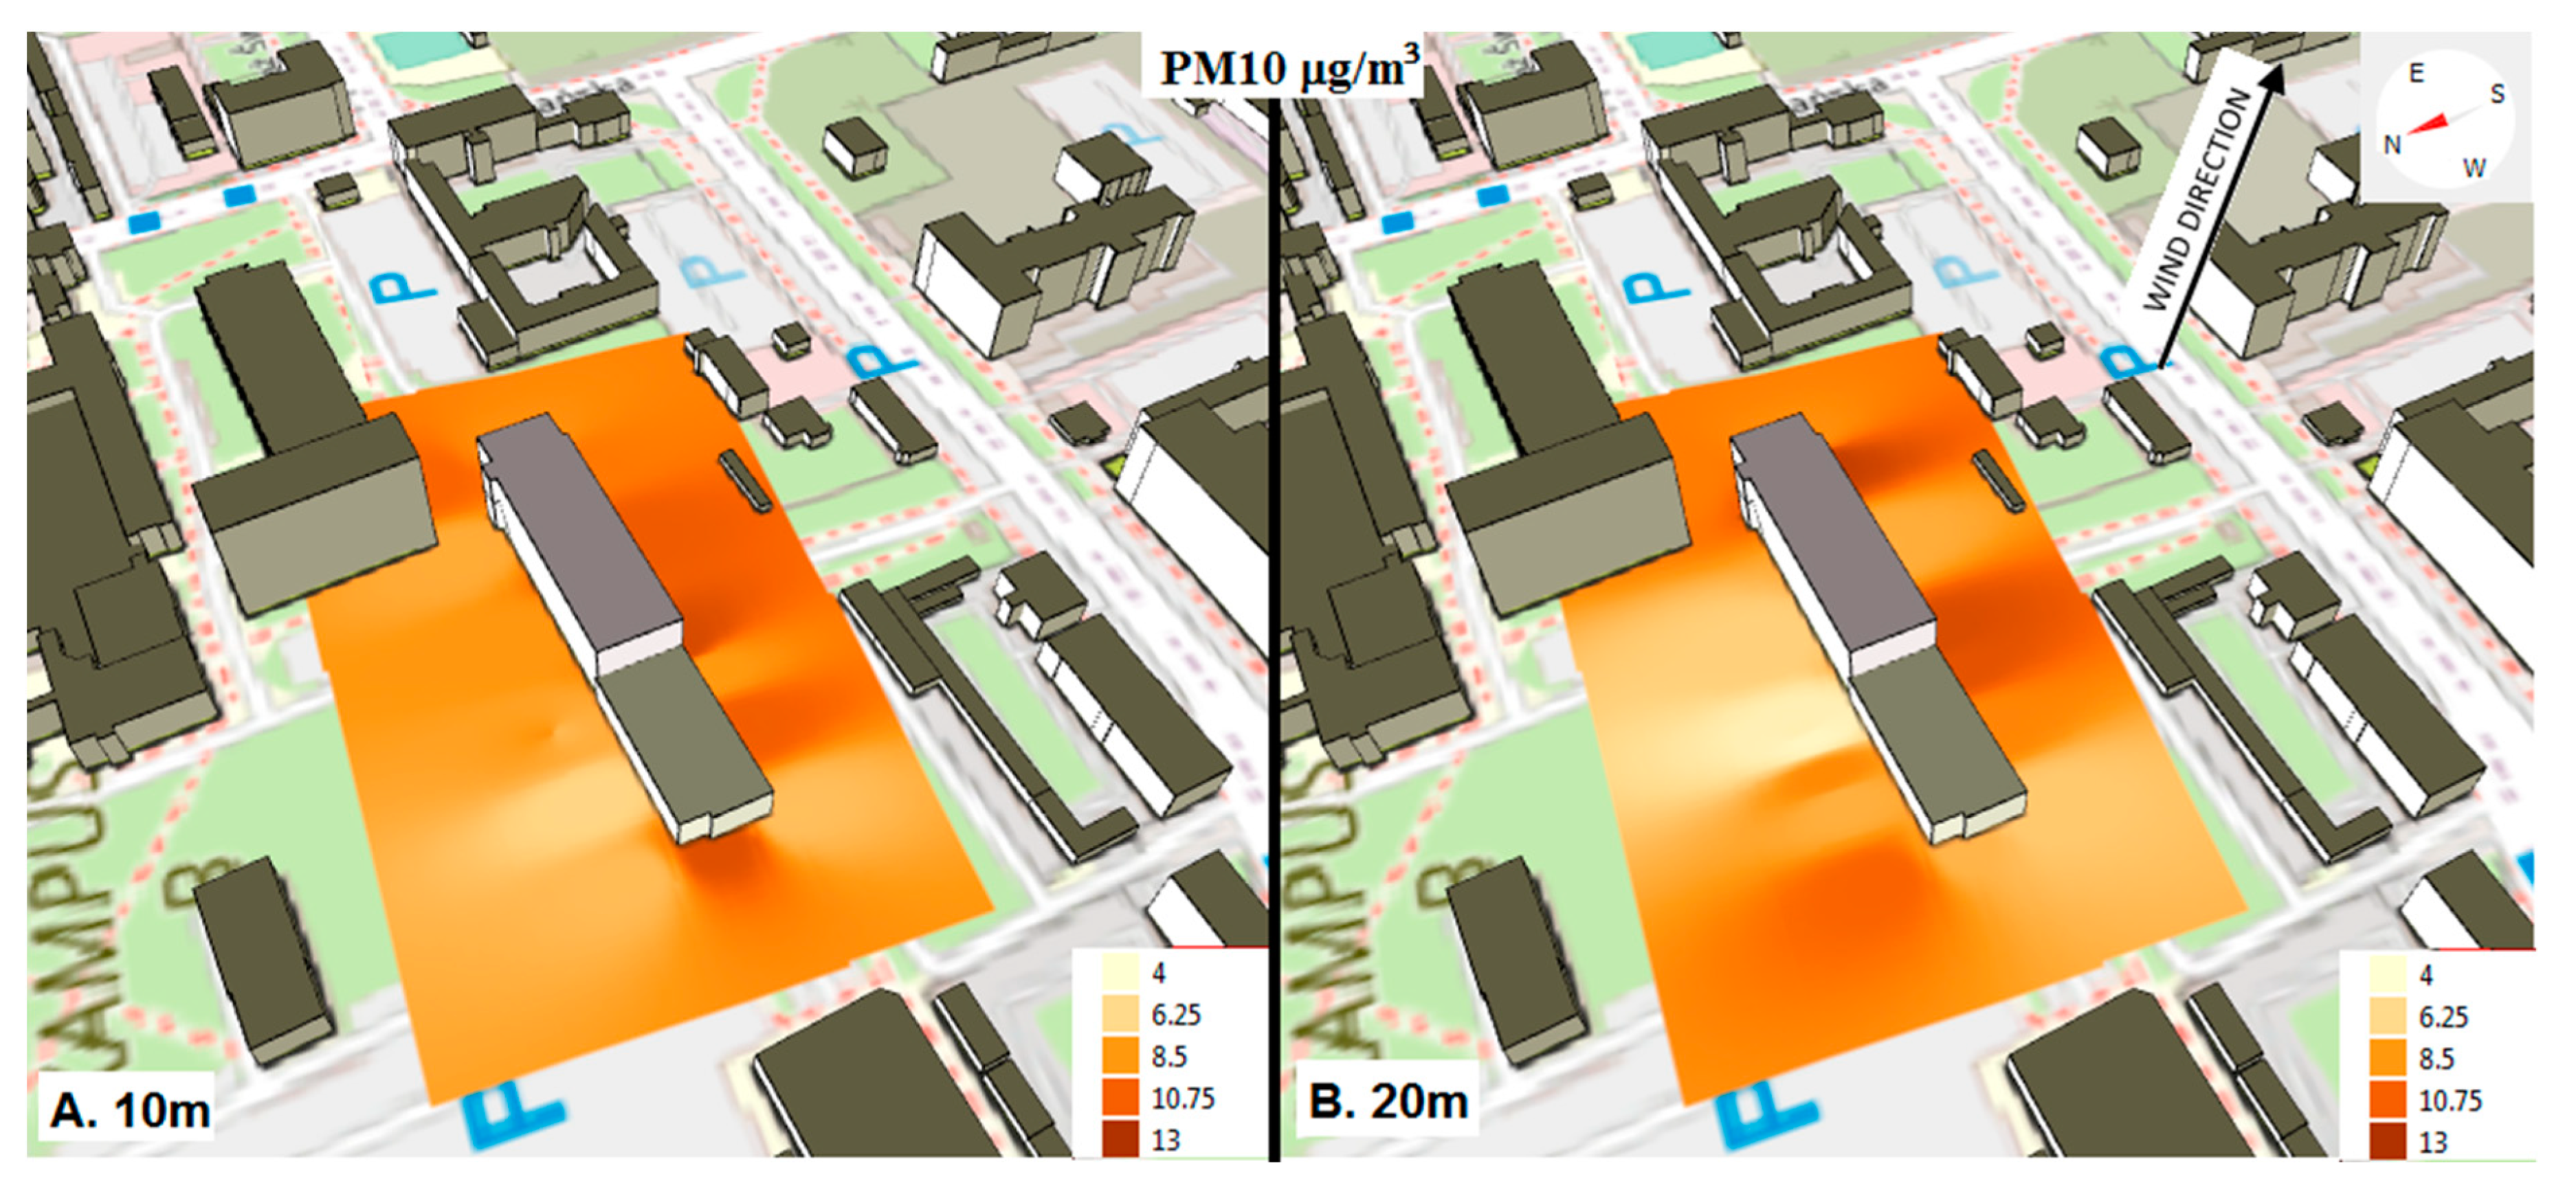
Figure 9 shows the results for the heaviest of the analyzed fractions of particulate matter, PM10. Significant differences in terms of spatial distribution and concentration can be observed in comparison to the results for PM2.5 and PM1.0. The highest concentrations of PM10 (above 10 μg/m3) were recorded in several places around the building, whereas the highest concentrations of the smaller fractions of PM pollutants were mainly on the south-east side. The values for PM10 ranged from 6.39 µg/m3 to 11.80 µg/m3 (Figure 9A). In the north-east corner of the building, at a height of 10 m, where the space between the buildings narrows, the concentration of PM10 (10.60 μg/m3) was 12% higher than at other points on the east side, and as much as 27% higher than the average concentration on the north side. The highest concentration of PM10 in the air was measured, as it was for PM2.5 and PM1.0, along the south wall of the higher part of the library building (the leeward side). However, in the case of PM10 there were very clearly visible places of strong turbulence at the edges of the building, especially at a height of 20 m, and a large accumulation of pollution at a height of 10 m. This is consistent with the theory of airflow around the building. The concentration at the edge of the join between each part of the building reached a maximum of 11.80 μg/m3.
Importantly, a higher content of PM10 was also observed in the air around the south and west walls of the lower part of the building (8 m). This proves that it presented a barrier to heavier PM fractions (unlike PM2.5 and PM1.0). This difference can is most noticeable in the data from the measurements taken at 20 m (Figure 9B), where was a wider range of variation was observed in the concentration of PM10 (4.55–12.42 μg/m3) than at a height of 10 m. In the areas behind the corners of the building in the direction of the wind, a higher concentration of PM10 was recorded than in other places, of up to 11.75 μg/m3. Further, at a height of 20 m, the lower part of the building (8 m) presented a noticeable barrier to the PM10 fraction. In the north-west corner of the building, the concentration of PM10 was 25% higher (10.64 µg/m3) than in the adjacent areas (Figure 9B). This is visible in Figure 8, which shows a visualization of airflow around the building. The same relationship was not observed for the lighter PM2.5 and PM1.0 fractions. This can be explained by a stronger correlation (above 0.90) between the PM2.5 and PM1.0 fractions at the height of both 10 and 20 m (Table 2). However, a relatively weaker correlation (below 0.75) between PM10 and PM2.5; PM1.0.
On the basis of the collected data, it can be concluded that the masses of PM pollutants have an important impact on their spatial distributions and concentrations. The PM10 fraction, being heavier than the others, clearly accumulated in the areas of turbulence. The lighter fractions, PM2.5 and PM1.0, had more even spatial distributions around the building, without clear points of increased concentration.
Figure 10 shows the results for the last of the analyzed pollutants, H2S, which is representative of the group of gaseous air pollutants. The wind direction and the shape of the building can be seen to have had a strong influence on concentration of H2S (Figure 10A,B). At a height of 20 m, areas with a high concentration of H2S were noted on the north side and north-west side of the building, especially around the lower part of the building (Figure 9B). In this area, the average concentration of H2S was 0.125 ppm and the highest concentration was 0.134 ppm. According to Kourtidis et al. (2008), sources of H2S include car catalysts [30]. Pallares et al. (2019) and Zwoździak et al. (2013) also identify cleaning products used in buildings [31,32]. Our results can therefore be explained by the presence of a large car park (300 parking spaces) and a swimming pool hall, from which gaseous pollutants may escape through mechanical ventilation into the vicinity of the library building, Hydrogen sulfide in the wind is mixed with air in the vortices generated at the edges of the library building. This results in a significant reduction in its concentration, of up to 68% (average 0.040 ppm) on the leeward side (south side). The area with the lowest H2S concentration, below 0.040 ppm, was on the south side of the higher part of the building (Figure 10).
Since H2S is heavier than air, it accumulated in the lower regions of the analyzed area due to air turbulence (Figure 7). At a height of 10 m, high concentrations of H2S of over 0.100 ppm occurred mainly on the north side of the building (windward side) of the taller part of the building, and to a lesser extent around the lower part. The highest recorded concentration of H2S in the air was 0.130 ppm, and was measured at the north-east corner of the building. This was probably related to the proximity of the car park and the accumulation of pollution in the narrow space between the buildings. The level of H2S on the leeward side of the building was more than half that on the north-east corner (0.046 ppm on average). The lowest H2S concentrations were recorded in line with the wind direction behind the building corners. This again proves the influence of edge vortices on the concentrations of the pollutants. In this case, the vortices diluted the H2S in the air, and thus reduced its concentration. A negative value of a strong correlation at the level of even −0.83 (Table 2) between H2S and PM is evidence of different observations of the distribution of concentrations of gaseous pollutants in relation to particulate matter pollutants. A summary of the measurement data is presented in Table 3.

4. Conclusions

In this research, we studied the concentrations of particulate matter and gas pollutants in the air around a library building on a university campus. A strongly uneven distribution of the pollutants was found in the space around the building. On the leeward side, the concentrations were up to twice that on the windward side. The intended research objective was achieved. It was found that the theory of aerodynamics of air flow around the building overlaps with places of increased and decreased concentrations of air pollutants. In the case of particulate matter, high concentrations (above the average values for the entire area) were measured on the leeward side, in the zones of lowered pressure and behind the corners of the building, where edge vortices formed. In these areas, there was an accumulation of solid pollutants transported by the wind, analogous to the accumulation of snow on the leeward side of a roof. This can be the reason why students and employees report negative air quality opinions. Figure 11 shows the concentration of pollutants at characteristic points on the leeward wall of the building. As can be seen, high concentrations of dust, in particular PM10, occur mainly at the corners of the higher part of the building, i.e., in places of strong air turbulence, at a height of 20 m. At a height of 10 m, the concentrations of dust pollutants are more evenly spread around the entire building.
The airflow around the building affected the distribution of gaseous pollution differently than in the case of particulate matter pollution. The turbulence caused by the roughness of the building area caused the high content of H2S in the air within the parking lot to be entrained and displaced in the direction of the wind towards the library building. Then, air turbulence within the area of the building contributed to reduce the specific concentration of H2S in the air, via mixing and spatial dilution.
We also analyzed air quality in relation to the permissible concentrations of the individual pollutants. The permissible level for PM10 of 50 µg/m3 was not exceeded at any of the measurement points. The highest measured concentration at 12.42 µg/m3 was more than three times lower than the permissible level. In the case of PM2.5, the values were four times lower than the permissible level of 25 μg/m3. Currently, no limit values have been defined for PM1.0. However, the concentration of PM1.0 in comparison to the other fractions was alarmingly high, given that the WHO (2013) considers this the most harmful of all the particulate matter fractions [1]. The average concentration of PM1.0 was only 14% lower than the concentration of PM2.5. The greatest risk was associated with H2S, the average concentration of which at the height of 10 m was 0.0737 ppm and at 20 m was 0.0968 ppm (0.10 mg/m3 and 0.14 mg/m3, respectively). These concentrations are more than five times higher than the permissible level of 0.02 mg/m3. The maximum measured concentration, of about 0.13 ppm (0.19 mg/m3), was recorded on the side of the parking lot, and approached the upper limit for H2S in the air for humans of 0.20 mg/m3. This applies to the pedestrianized area, therefore reports on perceptible odors characteristic of H2S are justified.

Author Contributions

Conceptualization, R.C. and M.D.; methodology, R.C., M.D.; software, M.D., R.C.; writing–original draft, R.C., M.D., review & editing, R.C. All authors have read and agreed to the published version of the manuscript.

Funding

This study was conducted as part of the research project entitled “Spatial analysis of air pollution changes in the Lodz agglomeration (in Polish: Analiza przestrzenna zmian stanu zanieczyszczenia powietrza w aglomeracji łódzkiej)”, which was co-financed by approx. 80% by the Provincial Fund for Environmental Protection and Water Management in Lodz (in Polish: Wojewódzki Fundusz Ochrony Środowiska i Gospodarki Wodnej w Łodzi).

Institutional Review Board Statement

Not applicable.

Informed Consent Statement

Not applicable.

Data Availability Statement

Data available on request.

Conflicts of Interest

The authors declare no conflict of interest.

References

  1. World Health Organization. Review of Evidence on Health Aspects of Air Pollution—REVIHAAP Project Retrieved from. World Health Organization 309. 2013. Available online: http://www.euro.who.int/en/health-topics/environment-and-health/air-quality/publications/2013/review-of-evidence-on-health-aspects-of-air-pollution-revihaap-project-finaltechnical-report (accessed on 18 November 2020).
  2. Cichowicz, R.; Stelęgowski, A. Average Hourly Concentrations of Air Contaminants in Selected Urban, Town, and Rural Sites. Arch. Environ. Contam. Toxicol. 2019, 77, 197–213. [Google Scholar] [CrossRef] [PubMed] [Green Version]
  3. Cichowicz, R.; Wielgosiński, G. Analysis of Variations in Air Pollution Fields in Selected Cities in Poland and Germany. Ecol. Chem. Eng. 2018, 25, 217–227. [Google Scholar] [CrossRef] [Green Version]
  4. Cichowicz, R.; Wielgosiński, G.; Fetter, W. Effect of wind speed on the level of particulate matter PM10 concentration in atmospheric air during winter season in vicinity of large combustion plant. J. Atmos. Chem. 2020, 77, 35–48. [Google Scholar] [CrossRef]
  5. Gao, J.; Wang, K.; Wang, Y.; Liu, S.; Zhu, C.; Hao, J.; Liu, H.; Hua, S.; Tian, H. Temporal-spatial characteristics and source apportionment of PM2.5 as well as its associated chemical species in the Beijing-Tianjin-Hebei region of China. Environ. Pollut. 2018, 233, 714–724. [Google Scholar] [CrossRef] [PubMed]
  6. Ma, H.; Sun, W.; Wang, S.; Kang, L. Structural contribution and scenario simulation of highway passenger transit carbon emissions in the Beijing-Tianjin-Hebei metropolitan region, China. Resour. Conserv. Recycl. 2019, 140, 209–215. [Google Scholar] [CrossRef]
  7. Meng, M.; Zhou, J. Has air pollution emission level in the Beijing–Tianjin–Hebei region peaked? A panel data analysis. Ecol. Indic. 2020, 119, 106875. [Google Scholar] [CrossRef] [PubMed]
  8. Edginton, S.; O’Sullivan, D.E.; King, W.D.; Lougheed, M.D. The effect of acute outdoor air pollution on peak expiratory flow in individuals with asthma: A systematic review and meta-analysis. Environ. Res. 2021, 192, 110296. [Google Scholar] [CrossRef] [PubMed]
  9. Liu, N.; Liu, X.; Jayaratne, R.; Morawska, L. A study on extending the use of air quality monitor data via deep learning techniques. J. Clean. Prod. 2020, 274, 122956. [Google Scholar] [CrossRef]
  10. Moreno-Silva, C.; Calvo, D.; Torres, N.; Ayala, L.; Gaitán, M.; González, L.; Rincón, P.; Susa, M.R. Hydrogen sulphide emissions and dispersion modelling from a wastewater reservoir using flux chamber measurements and AERMOD® simulations. Atmos. Environ. 2020, 224, 117263. [Google Scholar] [CrossRef]
  11. Dey, S.; Di Girolamo, L.; Van Donkelaar, A.; Tripathi, S.; Gupta, T.; Mohan, M. Variability of outdoor fine particulate (PM2.5) concentration in the Indian Subcontinent: A remote sensing approach. Remote. Sens. Environ. 2012, 127, 153–161. [Google Scholar] [CrossRef]
  12. Pope, C.A.; Burnett, R.; Thun, M.J.; Calle, E.E.; Krewskik, D.; Ito, K.; Thurston, G.D. Lung cancer, cardiopulmonary mortality, and long term exposure to fine particulate air pollution. J. Am. Med. Assoc. 2002, 287, 1132–1141. [Google Scholar] [CrossRef] [PubMed] [Green Version]
  13. Aventaggiato, L.; Colucci, A.P.; Strisciullo, G.; Favalli, F.; Gagliano-Candela, R. Lethal Hydrogen Sulfide poisoning in open space: An atypical case of asphyxiation of two workers. Forensic Sci. Int. 2020, 308, 110122. [Google Scholar] [CrossRef] [PubMed]
  14. Fujita, Y.; Fujino, Y.; Onodera, M.; Kikuchi, S.; Kikkawa, T.; Inoue, Y.; Niitsu, H.; Takahashi, K.; Endo, S. A fatal case of acute hydrogen sulfide poisoning caused by hydrogen sulfide: Hydroxocobalamin therapy for acute hydrogen sulfide poisoning. J. Anal. Toxicol. 2011, 35, 119–123. [Google Scholar] [CrossRef] [PubMed] [Green Version]
  15. Stetkiewicz, J. Siarkowodór. Dokumentacja dopuszczalnych wielkości narażenia zawodowego. Podstawy Metod. Oceny Sr. Pr. 2011, 4, 97–117. [Google Scholar]
  16. Hosker, R.P. Flow around isolated structures and building clusters, a review. ASHRAE Trans. 1985, 91, 1672–1692. [Google Scholar]
  17. Lateb, M.; Meroney, R.N.; Yataghene, M.; Fellouah, H.; Saleh, F.; Boufadel, M.C. On the use of numerical modelling for near-field pollutant dispersion in urban environments—A review. Environ. Pollut. 2016, 208, 271–283. [Google Scholar] [CrossRef] [Green Version]
  18. Pesic, D.; Zigar, D.; Anghel, I.; Glisovic, S. Large Eddy Simulation of wind flow impact on fire-induced indoor and outdoor air pollution in an idealized street canyon. J. Wind. Eng. Ind. Aerodyn. 2016, 155, 89–99. [Google Scholar] [CrossRef]
  19. Jiang, F.; Li, Z.; Zhao, Q.; Tao, Q.; Yuan, Y.; Lu, S. Flow field around a surface-mounted cubic building with louver blinds. Build. Simul. 2018, 12, 141–151. [Google Scholar] [CrossRef]
  20. Kikumoto, H.; Ooka, R. A numerical study of air pollutant dispersion with bimolecular chemical reactions in an urban street canyon using large-eddy simulation. Atmos. Environ. 2012, 54, 456–464. [Google Scholar] [CrossRef]
  21. Murena, F.; Mele, B. Effect of short–time variations of wind velocity on mass transfer rate between street canyons and the atmospheric boundary layer. Atmos. Pollut. Res. 2014, 5, 484–490. [Google Scholar] [CrossRef] [Green Version]
  22. Zhang, Y.; Kwok, K.; Liu, X.-P.; Niu, J.-L. Characteristics of air pollutant dispersion around a high-rise building. Environ. Pollut. 2015, 204, 280–288. [Google Scholar] [CrossRef] [PubMed]
  23. Galatioto, F.; Bell, M. Exploring the processes governing roadside pollutant concentrations in urban street canyon. Environ. Sci. Pollut. Res. 2013, 20, 4750–4765. [Google Scholar] [CrossRef] [PubMed]
  24. Rakowska, A.; Wong, K.C.; Townsend, T.; Chan, K.L.; Westerdahl, D.; Ng, S.; Močnik, G.; Drinovec, L.; Ning, Z. Impact of traffic volume and composition on the air quality and pedestrian exposure in urban street canyon. Atmos. Environ. 2014, 98, 260–270. [Google Scholar] [CrossRef]
  25. Zwack, L.M.; Paciorek, C.J.; Spengler, J.D.; Levy, J.I. Characterizing local traffic contributions to particulate air pollution in street canyons using mobile monitoring techniques. Atmos. Environ. 2011, 45, 2507–2514. [Google Scholar] [CrossRef]
  26. Lima, A.; De Vivo, B.; Cicchella, D.; Cortini, M.; Albanese, S. Multifractal IDW interpolation and fractal filtering method in environmental studies: An application on regional stream sediments of (Italy), Campania region. Appl. Geochem. 2003, 18, 1853–1865. [Google Scholar] [CrossRef]
  27. Singh, P.; Verma, P. A Comparative Study of Spatial Interpolation Technique (IDW and Kriging) for Determining Ground Water Quality. In GIS and Geostatistical Techniques for Groundwater Science; Elsevier: Amsterdam, The Netherlands, 2019; pp. 43–56. [Google Scholar]
  28. Weather Central District. Available online: www.meteoblue.com (accessed on 21 August 2020).
  29. Blocken, B.; Stathopoulos, T.; Carmeliet, J.J.; Hensen, J.L. Application of computational fluid dynamics in building performance simulation for the outdoor environment: An overview. J. Build. Perform. Simul. 2011, 4, 157–184. [Google Scholar] [CrossRef]
  30. Kourtidis, K.; Kelesis, A.; Petrakakis, M. Hydrogen sulfide (H2S) in urban ambient air. Atmos. Environ. 2008, 42, 7476–7482. [Google Scholar] [CrossRef]
  31. Pallarés, S.; Gómez, E.; Martínez, A.; Jordan, M. The relationship between indoor and outdoor levels of PM10 and its chemical composition at schools in a coastal region in Spain. Heliyon 2019, 5, e02270. [Google Scholar] [CrossRef] [Green Version]
  32. Zwoździak, A.; Sówka, I.; Krupińska, B.; Zwoździak, B.; Nych, A. Infiltration or indoor sources as determinants of the elemental composition of particulate matter inside a school in Wroc1aw, Poland? Build. Environ. 2013, 66, 173–180. [Google Scholar] [CrossRef]
Figure 1. Visualization of the theory of airflow around a solid according to Hosker.
Atmosphere 12 00062 g001
Figure 2. Map of the analyzed area and its surroundings: 1—lower part of the building; 2—higher part of the building (photo background source: Google Earth Pro).
Atmosphere 12 00062 g002
Figure 3. Location of measurement points around the analyzed building (photo background source: Google Earth Pro).
Atmosphere 12 00062 g003
Figure 4. Unmanned aerial vehicle (UAV) with measuring equipment: 1—measuring probe; 2—UAV, 3—measuring equipment.
Atmosphere 12 00062 g004
Figure 5. Wind rose on 20 August 2020 (data source: [28]).
Atmosphere 12 00062 g005
Figure 6. The spatial change in PM1.0 concentration around the library building at a height of 10 m (A) and 20 m (B) above ground level.
Atmosphere 12 00062 g006
Figure 7. Visualization of the probable airflow around the library building during measurements.
Atmosphere 12 00062 g007
Figure 8. Spatial changes in PM2.5 concentration around the library building at heights of 10 m (A) and 20 m (B) above ground level.
Atmosphere 12 00062 g008
Figure 9. Spatial changes in PM10 concentration around the library building at heights of 10 m (A) and 20 m (B) above ground level.
Atmosphere 12 00062 g009
Figure 10. Spatial changes in H2S concentration around the library building at heights of 10 m (A) and 20 m (B) above ground level.
Atmosphere 12 00062 g010
Figure 11. Concentration of pollutants on the south side of the building at heights of 10 and 20 m above ground level (photo background source: Google Earth Pro).
Atmosphere 12 00062 g011
Table 1. Statement of meteorological parameters of 20 August 2020 (data source: [28]).
Date: 20 August 202024 h9:00 AM–11:00 AM
ParametersUnitMinMaxAverageMinMaxAverage
Temperature (2 m above gnd)°C15.8226.8822.1020.5123.0421.77
Relative Humidity (2 m above gnd)%298954.42587265
Total Precipitation (high resolution) (sfc)mm000000
Total Cloud Cover%0498.73.9107.97
Wind Speed (10 m above gnd)km/h2.1015.079.3310.1810.8010.50
Wind Direction (10 m above gnd)-295.11343.30318.44306.87321.95314.61
Wind Direction (10 m above gnd)---NW--NW
Table 2. Correlation between measurement data.
AltitudeParametersPM10PM2.5PM1.0H2S
10 mPM1010.710.54−0.48
PM2.50.7110.91−0.72
PM1.00.540.911−0.64
H2S−0.48−0.72−0.641
20 mPM1010.770.72−0.45
PM2.50.7710h97−0.83
PM1.00.720.971−0.81
H2S−0.45−0.83−0.811
Table 3. Detailed summary of measurement data.
AltitudeParametersPM10PM2.5PM1.0 H2S
μg/m3ppm
10 mmin6.393.702.700.0058
5-perc6.983.792.770.0218
average9.134.603.540.0737
95-perc11.656.054.600.1270
max11.806.194.820.1309
20 mmin4.553.142.220.0264
5-perc4.923.192.230.0289
average8.644.303.300.0968
95-perc11.955.854.830.1325
max12.425.915.060.1338
Publisher’s Note: MDPI stays neutral with regard to jurisdictional claims in published maps and institutional affiliations.