Article

Concentration Characteristics and Photochemical Reactivities of VOCs in Shenyang, China

1
Institute of Atmospheric Environment, China Meteorological Administration, Shenyang 110166, China
2
Shenyang Ecological Environment Monitoring Center of Liaoning Province, Shenyang 110169, China
*
Author to whom correspondence should be addressed.
Atmosphere 2021, 12(10), 1240; https://doi.org/10.3390/atmos12101240
Submission received: 12 August 2021 / Revised: 20 September 2021 / Accepted: 20 September 2021 / Published: 23 September 2021
(This article belongs to the Special Issue Air Pollution in China)

Abstract

:
We investigated the seasonal and diurnal characteristics of volatile organic compound (VOC) concentrations in Shenyang, China, using the whole-year hourly data of 52 types of VOC at three sites over the year 2019. The photochemical reactivities of VOCs were also studied by analyzing the influence of VOCs on ozone and secondary organic aerosol (SOA) formation potential and the hydroxyl radical consumption rate. It is shown that the order of VOC concentrations from high to low is alkanes, alkynes, alkenes, and aromatic hydrocarbons. For various types of VOCs, the maximum appeared in the morning and at night, whereas the minimum appeared in the afternoon. The contributions of VOCs to ozone formation potential are highest for aromatic hydrocarbons with a value of 78%, followed by alkenes and alkanes, among which toluene and isoprene contributed the most. The contributions of VOCs to SOA formation potential are also highest for aromatic hydrocarbons with a value of 94%, followed by alkanes and alkenes, among which the contributions of toluene and benzene add up to over 70%. Being the most active type of VOCs in atmospheric chemical reactions, aromatic hydrocarbons are the dominant contributor to the formation of both ozone and SOA, and therefore being able to control of the use of a large number of solvents and vehicle exhaust emissions would be an effective way to regulate the formation of ozone and SOA in Shenyang.

1. Introduction

The significant role of volatile organic compounds (VOCs) in the process of atmospheric photochemical reactions was first recognized by Haagen-Smit [1]. Since then, the formation of photochemical pollutants such as ozone (O3) and secondary organic aerosols (SOAs) by VOCs and NOx via solar radiation has been widely recognized [2,3,4]. Studying the impact of VOCs and their atmospheric chemical reactions on the formation of atmospheric secondary pollutants is of great significance, and is essential for the sake of not only controlling air pollution, but for revealing the mechanism of atmospheric photochemical reactions.
Factors determining the influence of VOCs on ozone formation in the atmosphere include the levels of hydroxyl radical and NOx, the proportions of various reaction processes and the efficiencies of NO transforming into NO2 during these processes, as well as the reaction rates of various VOCs and hydroxyl radicals. The complexity of VOC components results in an uncertain relationship between them and ozone formation. In the early 1990s, the United States Environmental Protection Agency produced a set of standard methods for the analysis of environmental atmospheric VOCs through research, with the intention of not only reducing NOx, but also of controlling the active VOC components in order to effectively solve the problem of ozone pollution [5,6]. Compared with foreign countries, the study of VOC–NOx–ozone in China started late, and the concentration limit and measurement specification of VOCs in the atmosphere have not been clearly defined until now (Ambient Air Quality Standard (GB3095-2012) [7]). Furthermore, the research is mainly focused on the three major polluted areas in China, namely, the Beijing-Tianjin-Hebei region, Pearl River Delta, and Yangtze River Delta, where VOCs play very different roles in the process of ozone formation [8,9,10,11,12,13,14,15,16]. At present, studies of the VOC–NOx–ozone relationship and the interactions of VOCs in atmospheric chemical reactions are still urgently needed.
In the formation of urban haze pollution in China, the secondary generated aerosol components account for 51%–77%, of which organic aerosol is the most significant component [17,18]. Observations from 37 sites around the world show that SOA accounts for more than 90% in remote areas and more than 60% in urban areas, despite a relatively high proportion of primary aerosol [16]. In recent years, a set of aerosol formation coefficients (fractional aerosol coefficients, or FACs) were proposed by Grosjean and Seinfeld [19] based on a large number of smoke chamber experimental data and atmospheric chemical kinetics data. Several studies conducted by scholars inside and outside China on SOA formation potential, combining VOCs’ observation data and FACs, have consistently shown that aromatic hydrocarbons contribute the most to SOA formation potential [19,20,21,22]. Wang et al. [23] studied the SOA formation potential of all aromatic hydrocarbons and isoprene in Shenzhen using the FAC method, and found that toluene contributed the most to SOA formation. In addition, the reactions between VOCs and hydroxyl radicals are the main chemical processes for the transformation of organic compounds, in which the consumption rate of hydroxyl radical is used to evaluate the chemical activity of various VOC species [24].
As the largest city in northeast China, Shenyang’s atmospheric environmental problems have hardly been solved in the recent two decades. Despite strong governance, the urbanization trend, leading to a current population of over 9.1 million and an urban area that has rapidly grown to 3500 km2 (within the total area of Shenyang of 13,000 km2), makes air pollution a continuing and significant problem in this metropolis. Since 2007, most of the original heavy industry enterprises in downtown Shenyang have been relocated to a new economic development zone approximately 20 km away to the west of the urban center; thus, it is not industrial emissions but traffic emissions that directly affect the ambient air quality over the Shenyang urban area with a total of 2.65 million automobiles, which increase at the rate of 800 per day. Although a number of studies have analyzed the mechanism of pollution formation in Shenyang and its ambient areas [25], few of them have focused on VOCs. In this study, using the whole-year hourly data of 52 types of VOC at each of the three sites over the year 2019, photochemical reactivities of VOCs were revealed, and the prior VOC species were further selected to provide theoretical support for local pollution management.

2. Materials and Methods
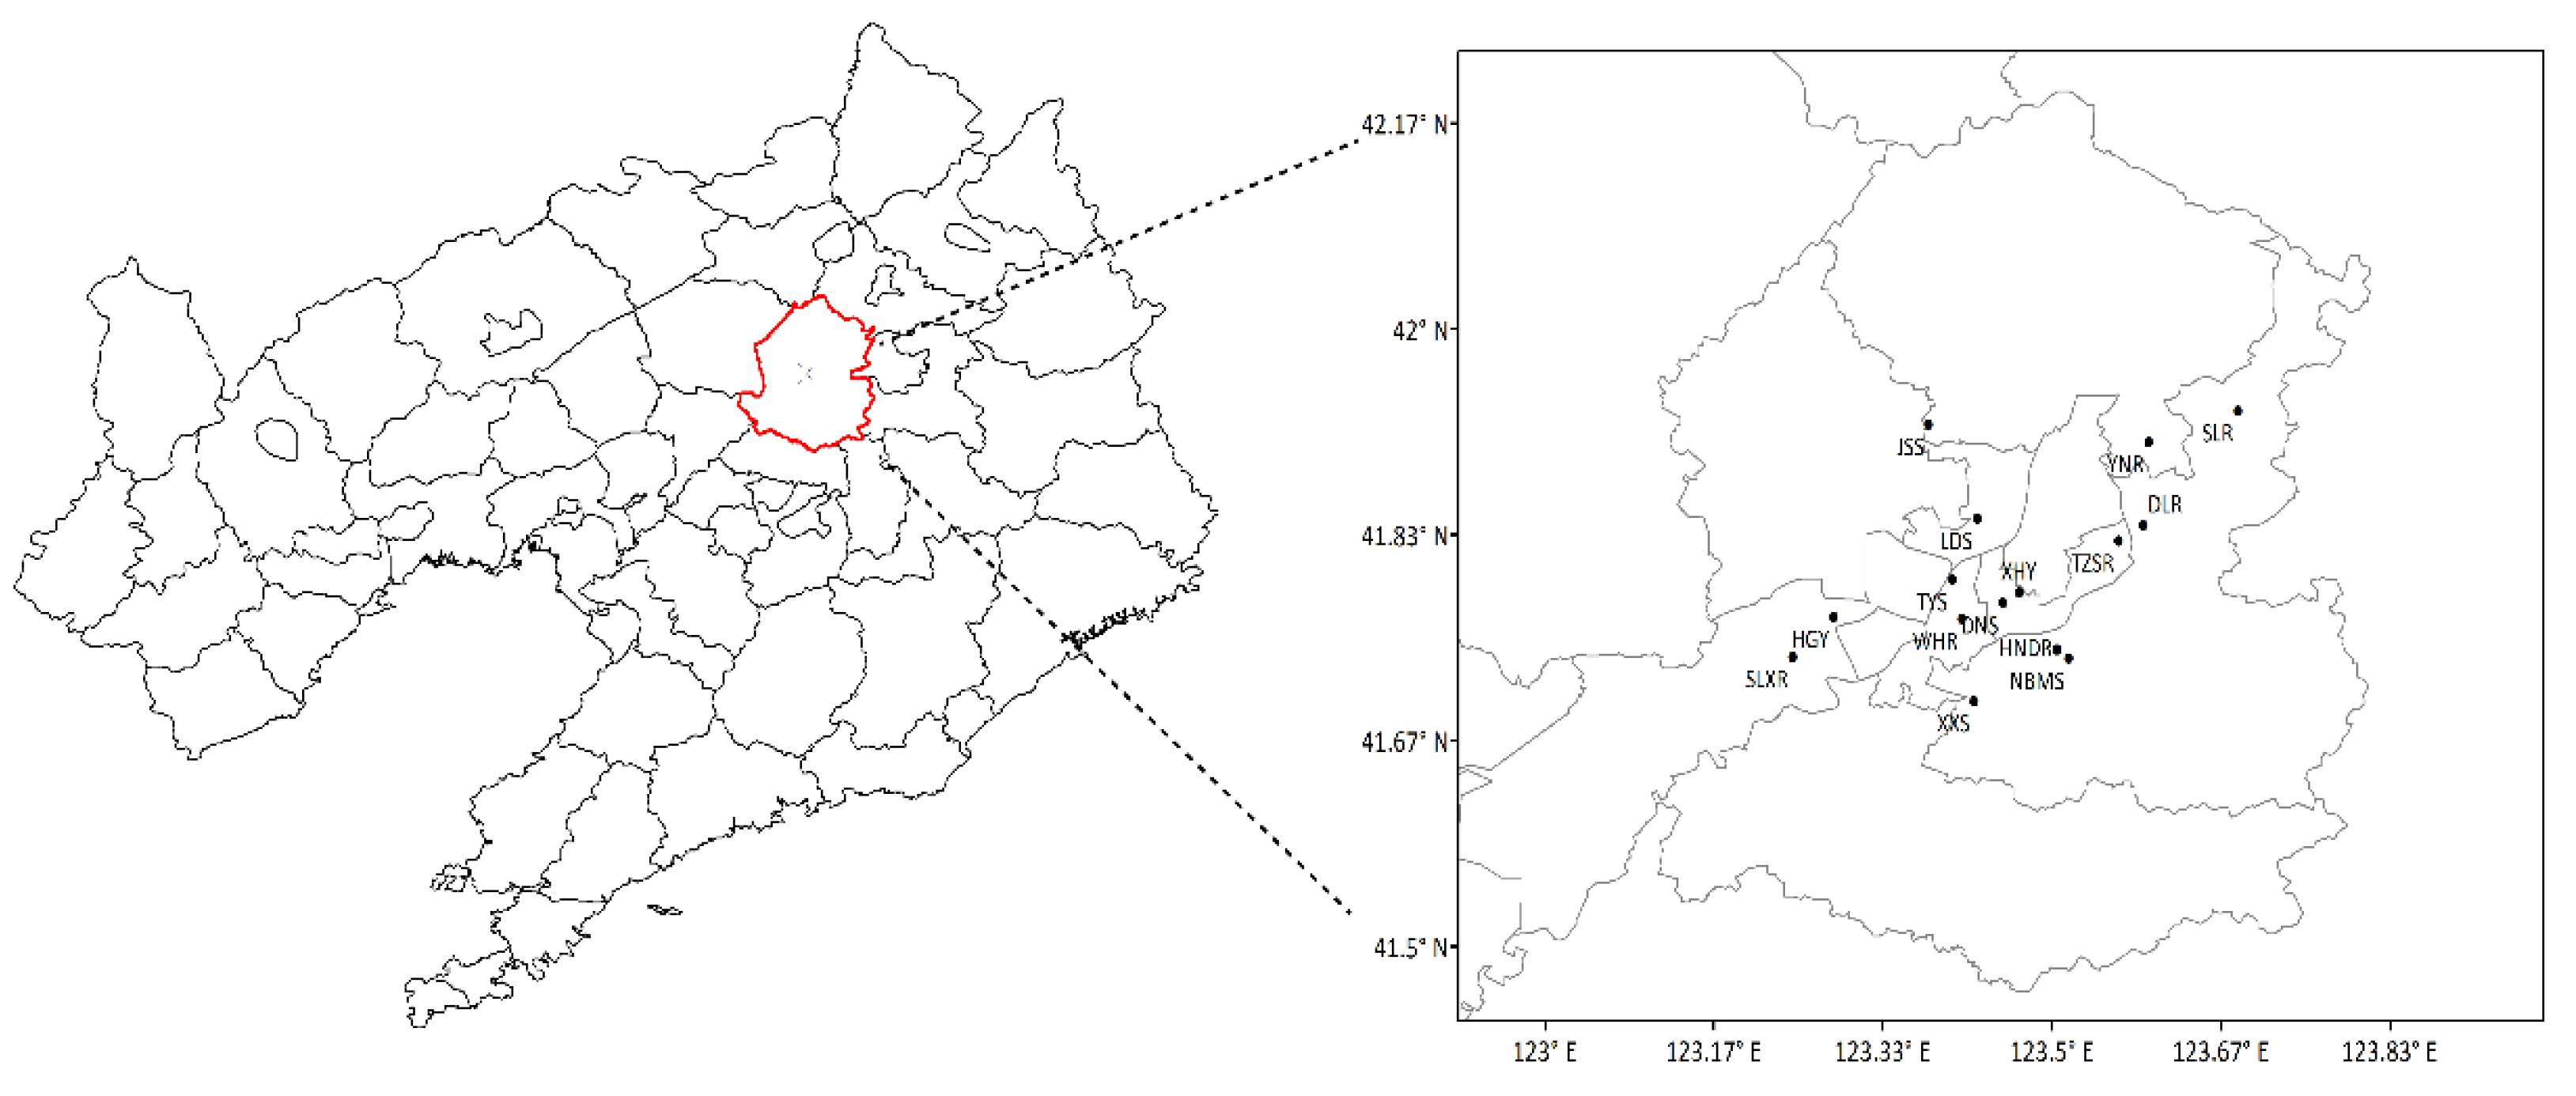
2.1. Data Sources

Hourly VOCs and ozone concentration observation data throughout 2019 were from the Shenyang ecological environment monitoring center of Liaoning Province. VOCs’ monitoring is based on a GC5000 online gas chromatograph produced by the AMA Instrument Company (Ulm, Germany). The instrument consists of two subsystems (a GC5000 VOC analyzer and a GC5000 BTX analyzer), a calibration module (a DIM200 VOC calibration instrument) and other auxiliary equipment. A type 49i ozone analyzer produced by Thermo Fisher China Co., Ltd. (Shanghai, China) was used for ozone monitoring. The monitoring data of wind direction and speed used to analyze the distribution of wind roses in Shenyang are from the Shenyang National Basic Meteorological Station (NBMS).
The three VOC environmental monitoring sites in Shenyang are Huagongyuan (HGY), Danan Street (DNS), and Tianzhushan Road (TZSR), and the 11 state-controlled ambient air quality monitoring sites are Dongling Road (DLR), Hunnan East Road (HNR), Jingshen Street (JSS), Dongling Street (LDS), Senlin Road (SLR), Shenliao West Road (SLXR), Taiyuan Street (TYS), Wenhua Road (WHR), Xiaoheyan (XHY), Xinxiu Street (XXS), and Yunong Road (YNR). The locations of each air quality monitoring site and Shenyang NBMS are shown in Figure 1. The characteristics and levels of ozone, NOx, and PM2.5 are listed in Table 1. HGY, DNS, LDS, TYS, WHR, XHY, and NBMS are urban sites; TZSR, DLR, HNR, XXS, YNR, SLXR, and JSS are suburban sites; and SLR is a rural site due to its remote location. The land-use at the suburban sites is a mixture of city and cropland, whereas the rural site, SLR, is primarily covered by forest and a reservoir. HGY is located in an economic-technical development zone with many enterprises, including chemical, electrical, and pharmaceutical factories, etc., which leads to a large number of industrial source emissions, while the transport of freight vehicles also emits vehicle exhaust. In addition, HNR and XXS are accessible via a highway around the city area of Shenyang.
Regarding the key pollutants, the ozone level at the suburban sites is higher than that at the urban sites in general, among which the maximum appears at YNR, a downwind suburban site located in the direction of the prevailing wind from Shenyang. Spatial variation in Shenyang has been reported based on the observations from 2013 to 2015 as well [25]. However, the levels in NOx and PM2.5 are significantly higher at urban sites than at suburban sites, with a peak level in NOx appearing at HGY and high levels at the other two VOC environmental monitoring sites. Compared to pollutant levels in Beijing in 2016 [26], PM2.5 in Shenyang during 2019 was relatively close, whereas NOx in Shenyang was around 10 ppbv higher, meaning that the current high-level of NOx in Shenyang still cannot be negligible.

2.2. Data Analysis Methods

In 2019, 27 types of alkanes, 14 types of aromatic hydrocarbons, 10 types of alkenes and one type of alkyne were detected at the three VOCs environmental monitoring sites in Shenyang, with a total of 52 VOC species. The original concentration unit of each VOC species was μg/m3. First, according to the method of Liu et al. [25], the VOC concentrations were converted into volume mixture ratios (with the units of ppbv) at a standard temperature and pressure. Then, the diurnal and seasonal variation characteristics of VOC concentrations in Shenyang were analyzed using the mean hourly concentrations of the three monitoring sites.

2.2.1. Aerosol Formation

Based on the smokebox experiment of Grosjean and Seinfeld [19], this study used FAC, the fraction of VOC converted into aerosol, called aerosol yield, whereby the change in the amount of SOA formed is divided by the change of emissions of individual VOCs in order to estimate the SOA formation potential of atmospheric VOCs. According to Grosjean’s hypothesis, the formation of SOA only takes place during the day (from 8 a.m. to 5 p.m. Beijing time), and VOCs only react with hydroxyl radicals to form SOA. The FAC and FVOCr (the fraction of VOC consumed by gas-phase chemical reactions with the unit of %) used in the formula are obtained by the smokebox experiment [27]. According to Grosjean [27], the estimations of FVOCr for each VOC were completed for a number of scenarios that specify the concentrations of the electrophiles, e.g., ozone, hydroxyl radicals, and NO3, as well as the airmass transportation time. The daytime scenario selected here was relevant to southern Californian smog episodes, which was set at O3 = 100 ppbv, OH = 1.0 × 10⁶ molecules cm−3, and NO3 = 0, with a chemical reaction time of 6 h. For this scenario, Grosjean calculated for each alkene the fraction that was consumed by its reaction with ozone and by its reaction with hydroxyl radicals, respectively (these calculations were not necessary for alkanes, aromatics, and saturated oxygenates, which reacted only with hydroxyl radicals). He also assumed that aerosol production from alkene was via their reaction with ozone. The assumption was supported by results from a number of experimental studies on cyclic alkene, which was shown to produce aerosol by reaction with ozone and little or no aerosol by reaction with hydroxyl radicals [19,28].
Components that can form an SOA can be defined as:
FACi = SOAp/VOCs0
In the formula, FACi is the FAC of the ith VOC as a dimensionless quantity. SOAp is the formation potential of SOA with the unit of ppbv. VOCs0 should have been the initial emission amount quantified in mass, moles, or flux units for a given region or for a unit area. However, due to the limited technology, it was almost impossible to obtain flux data for so many VOC components until now. Therefore, here, an "approximate initial concentration" of VOCs0 is used to represent the levels of emission source with the unit of ppbv. The FACs are used to calculate the SOA formation potential:
SOAp = VOCs0 × FAC
Considering that the VOCs measured at the receptor point (VOCst) are usually the concentrations after oxidation, the relationship between VOCst and the initial concentration of VOCs0 can be expressed by the following formula:
VOCst = VOCs0 × (1 − FVOCr/100)

2.2.2. Ozone Formation

The types of VOC in the atmosphere are very complex, with the resulting amount of ozone generated from the reaction dependent on the levels, rates of oxidation, oxidation mechanism, and concentrations of NOx. The MIR method considers the impacts of different reaction mechanisms and VOC/NOx ratios on ozone formation. Incremental reactivity (IR) is the change in ozone divided by the change in the emissions of individual VOCs. It is a quantity term used to calculate the OFP (ozone formation potential) of an individual VOC compound, and MIR explains the maximum reactivity condition of individual VOC species in a high NOx environment, in which ozone formation is most sensitive to VOCs. The calculation formula of OFPi is as follows:
OFPi = VOCs0 × MIRi
In the formula, OFPi is the OFP of the ith VOC with the unit of ppbv. MIRi is the maximum incremental reactivity of the ith VOC in ozone as a dimensionless quantity. Similarly, the relationship between VOCst and VOCs0 can refer to formula (3), which converts measured concentrations into the approximate initial concentrations [29].

2.2.3. Hydroxyl Radical Consumption Rate

Hydroxyl radical is the most significant oxidant in the troposphere. The photooxidation reactions of various VOCs often start with their reaction with hydroxyl radicals, during which new hydroxyl radicals are constantly formed in O2 and NOx, with light degradation leading to chain reactions. All VOC species are compared on the same standard to evaluate the reactivity of hydroxyl radical. The hydroxyl radical consumption rate is often used to measure the ability of VOCs to participate in atmospheric autooxidation reactions to form peroxanoxy radicals, which can also be used to estimate the impact of a specific VOC species on the ozone formation rate in a polluted atmosphere [29]. Its calculation formula is as follows:
LOHi = Ci × KOHi
In the formula, LOHi is the hydroxyl radical consumption rate of the ith VOC with the unit of s–1. Ci is the observed concentration of the ith VOCs with the unit of ppbv. KOHi is the hydroxyl radical consumption rate constant corresponding to the ith VOC at the temperature of 298 K [30]. However, it should be pointed out that their reaction with hydroxyl radical is not the only way VOCs can react in the atmosphere, since many VOCs are also consumed to a significant extent by reaction with ozone or (at night) with NO3, and some also with photolyze.

3. Concentration Characteristics of VOCs

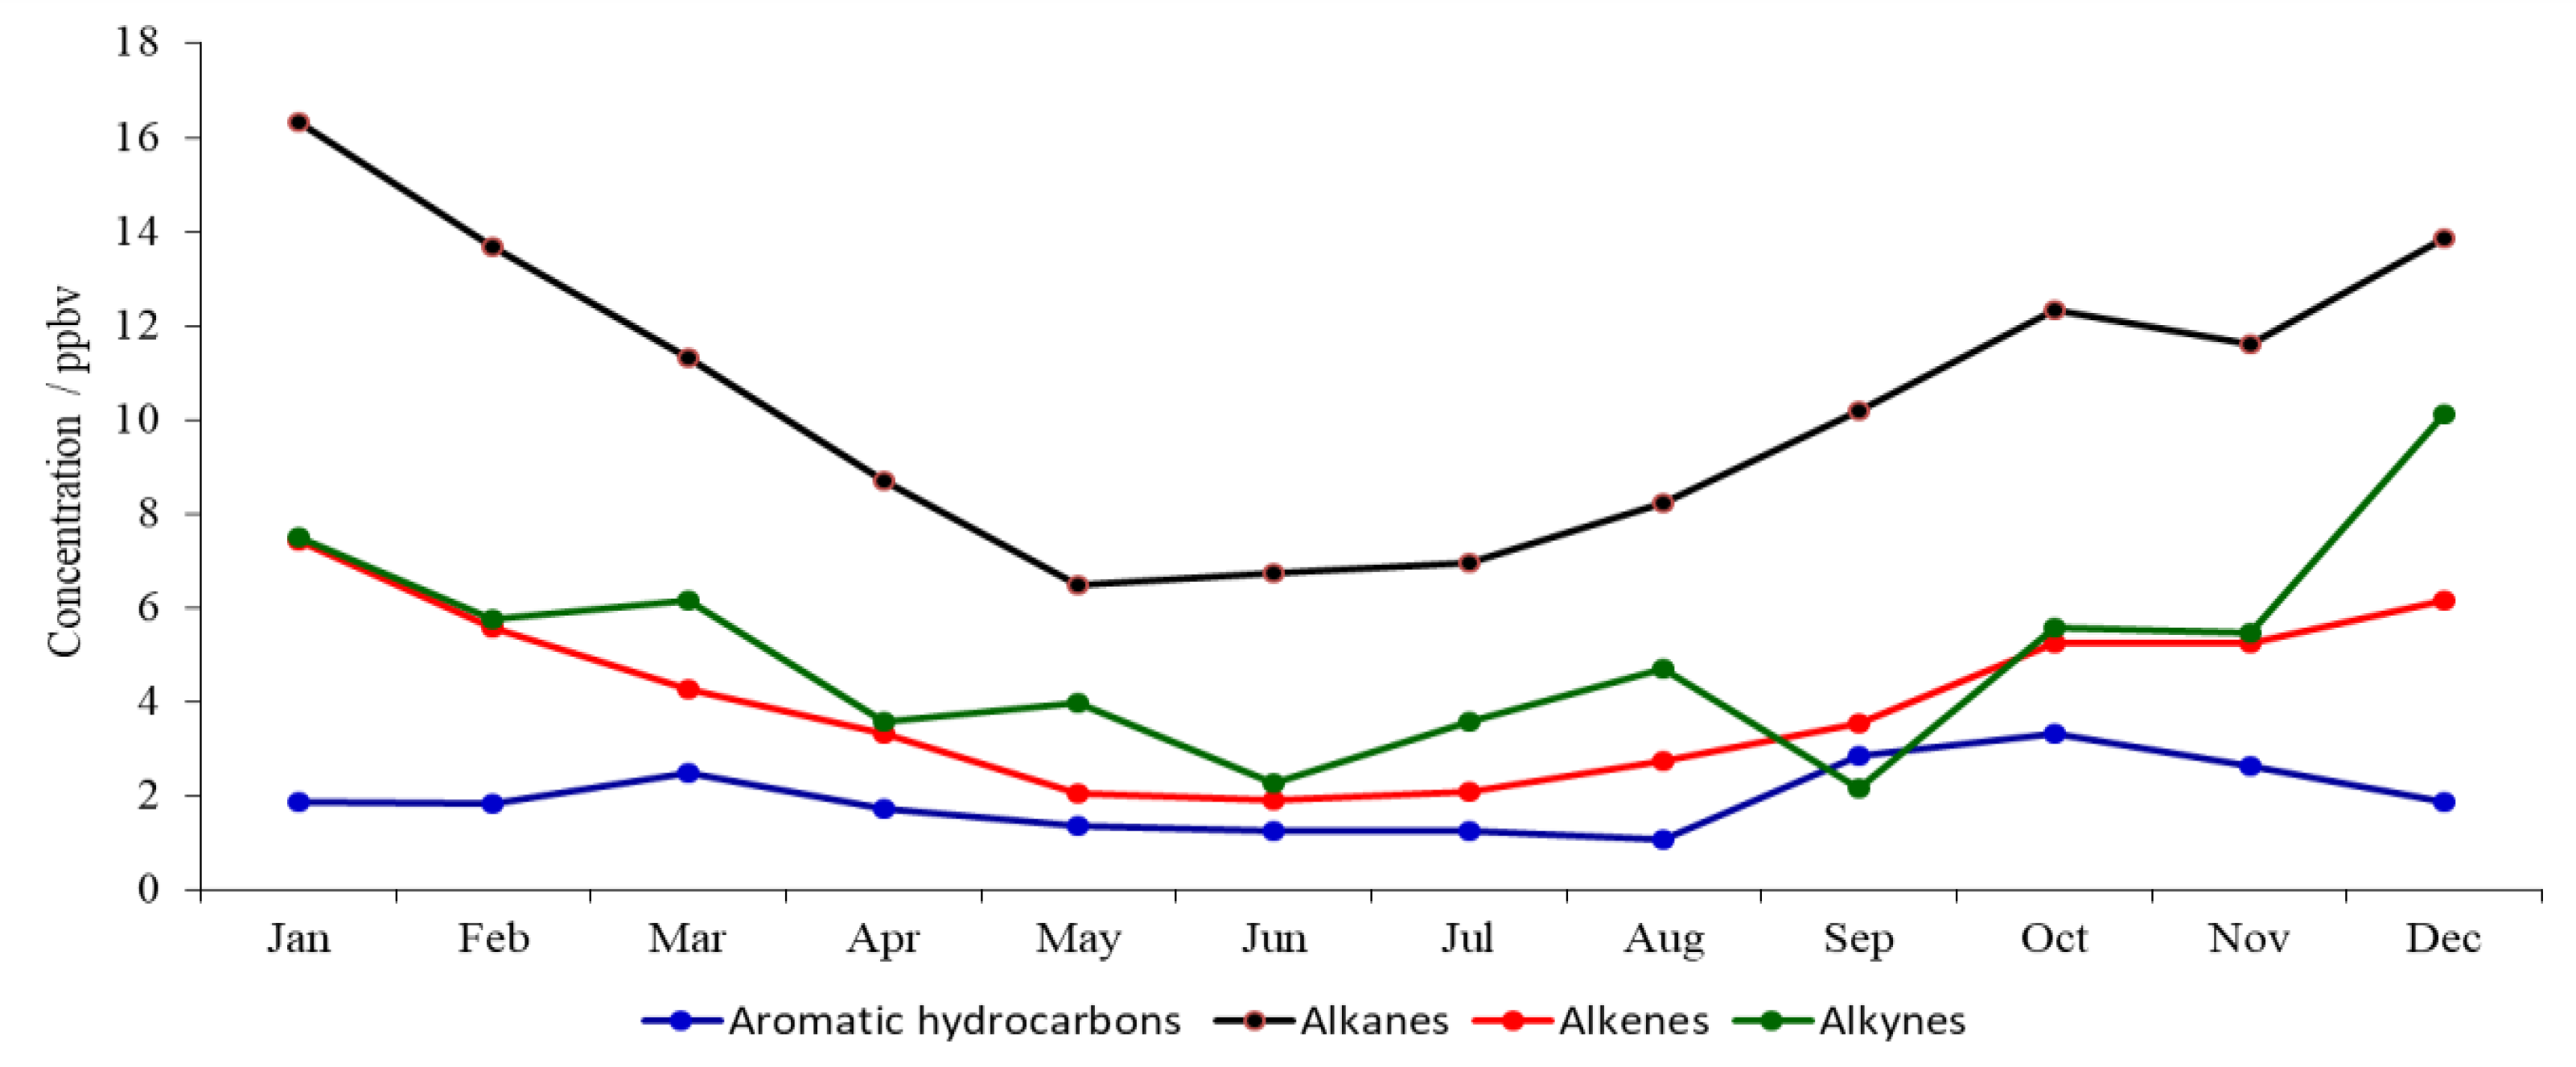
3.1. Seasonal Variations

In Shenyang, the total concentration of the 52 types of VOCs (TVOC) from high to low appears in winter, autumn, spring, and summer, whereas the concentration of ozone from high to low appears in summer, spring, autumn, and winter. The TVOC reaches a maximum in January, with a value of a little more than 33 ppbv, and reaches a minimum in June. The concentration of ozone reaches a maximum in May and July, with a value of near 50 ppbv in July, and a minimum in December (Figure 2). For various types of VOCs, the concentrations of alkanes, alkenes, and alkynes generally appear highest in winter and lowest in summer, but the concentrations of aromatic hydrocarbons were highest in autumn and lowest in summer. Alkanes appear with the highest concentration, followed by alkynes, alkenes, and aromatic hydrocarbons (Figure 3). In general, seasonal variations of VOC concentrations are mainly influenced by three factors, namely, the variations of VOC source strength, the various degrees of photochemical reaction due to the seasonal levels of hydroxyl radical and the variations of the atmospheric mixing state. The higher values of TVOC and its components in autumn and winter over Shenyang are mainly due to the large amount of emission of primary pollutants from heating in autumn and winter, which directly or indirectly influences the source strength of VOCs. In addition, the atmospheric photochemical reaction is hardly active enough to remove VOCs due to the lower temperatures in autumn and winter. Moreover, the relatively stable atmospheric and temperature inversion at night are not conducive to the diffusion and dilution of pollutants [31]. The fact that aromatic hydrocarbons appear higher in autumn than in winter was also found in the study of Baoji, Shanxi, with the process here related to the combustion emissions of petrochemical, pharmaceutical, pesticide, paint, and other industries and fossil fuels [32].
The highest concentration component is acetylene, with a mean annual concentration of a little more than 5 ppbv. Ethane has the highest concentration among alkanes, with a mean annual concentration of just less than 5 ppbv. Ethylene has the highest concentration among alkenes, with a mean annual concentration of somewhat below 3 ppbv. Benzene has the highest concentration among aromatic hydrocarbons, with a mean annual concentration of around 1 ppbv. Compared with the northern suburbs of Nanjing, the concentrations of ethane, ethylene, and benzene are all lower, but the concentration of acetylene is slightly higher in Shenyang [8], which is significantly related to the emissions from traffic sources and industrial sources in both places. During 2019 in Shenyang, industrial emissions of NOx and VOCs are 31,603.05 tons and 6475.59 tons, respectively, whereas town emissions of NOx and VOCs are 3916.15 tons and 1172.63 tons, respectively [33].
For the three VOC environmental monitoring sites in Shenyang, the annual mean VOC concentrations from high to low appear at HGY, DNS, and TZSR, whereas the annual mean ozone concentration from high to low appears at DNS, TZSR (with the same level as DNS), and HGY. The concentration of each VOC component is the highest in HGY, which is located in an industrial area, whereas the concentration of ozone is lower than those at DNS and TZSR, which are located to its east and northeast (Figure 4). The reason is that the dominant wind direction in Shenyang is southwesterly on average throughout the year, while the wind speed is over 3 m/s, which is faster than those of other directions (Figure 5). Driven by the dominant wind, ozone formed locally and VOCs at the site located in the upwind direction (e.g., HGY) are transported to the east and northeast, with the further formation of ozone due to photochemical reaction during this process [25]. Elevated ozone then appears in the downwind direction (e.g., at DNS and TZSR sites).

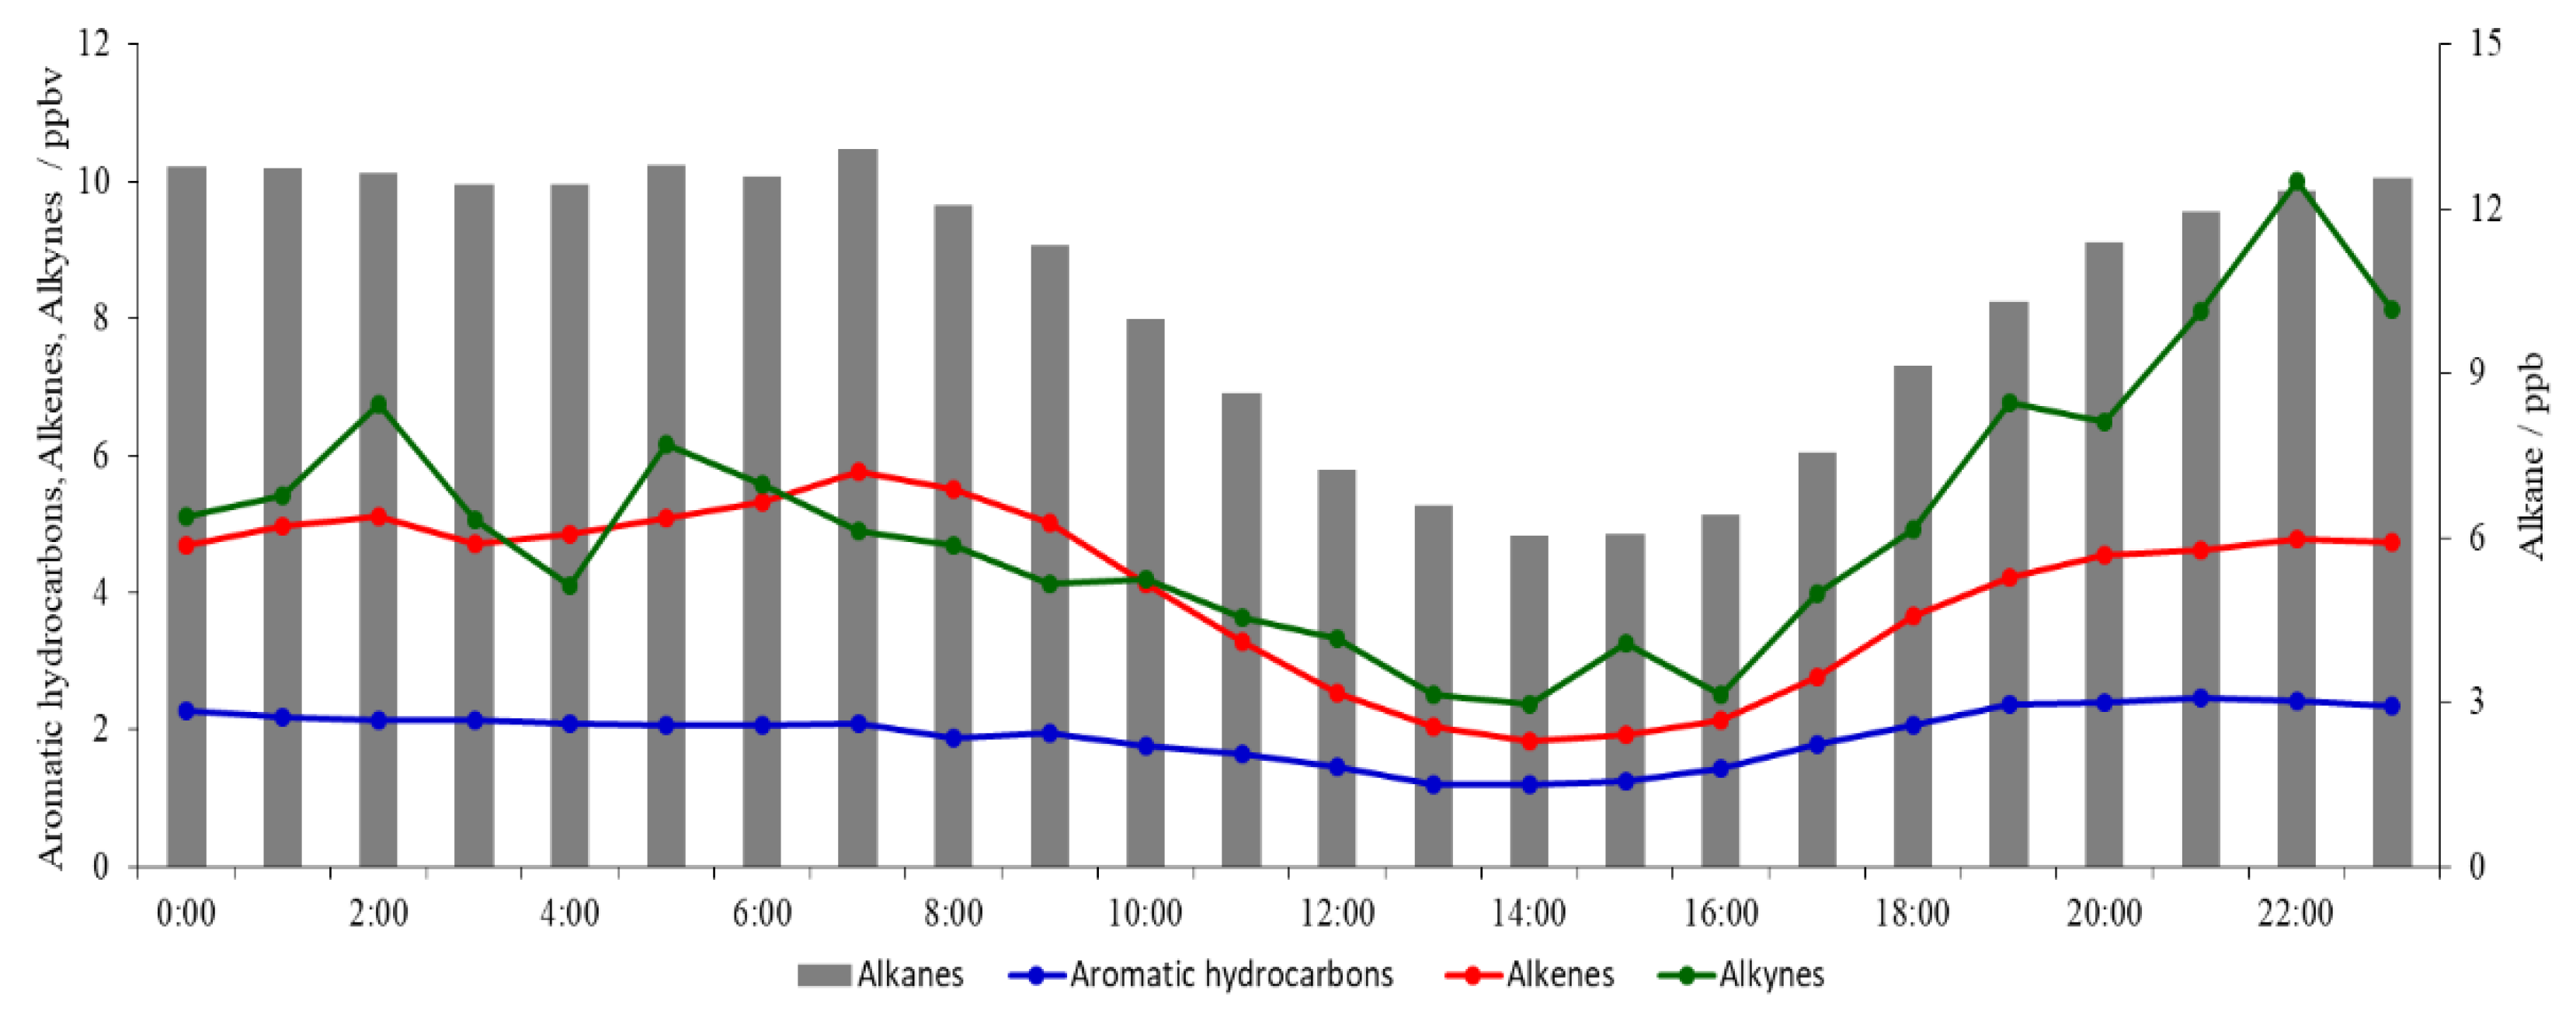
3.2. Diurnal Variation

Diurnal variations in each type of VOC show rather similar bimodal patterns, with the peaks mainly appearing in the morning and evening. Alkanes and alkenes reach their maximum at 7:00 (Beijing time, the same below), whereas alkyne and aromatic hydrocarbons reach their maximum at 22:00 and 21:00, respectively, which is basically consistent with the peak hours of traffic. The concentration of each type of VOC reaches a minimum in the afternoon (13:00–14:00) (Figure 6). In the morning rush hours, human activities, such as traffic and industry, become frequent, rapidly increasing the concentration of VOCs to reach the first peak. Then, with the gradual significance of solar radiation and turbulence, VOC levels keep decreasing until they reach a minimum in the afternoon. At night, the suspension of photochemical reactions due to solar radiation decreases, along with the accumulated contribution of the evening traffic peak, results in the second peak of VOCs. The concentration of each type of VOC is higher at night and lower in the daytime, which is significantly related to the lack of photochemical reaction consumption at night, and the lower atmospheric boundary layer height hardly being conducive to pollutant diffusion.

4. Photochemical Reactivities of VOCs

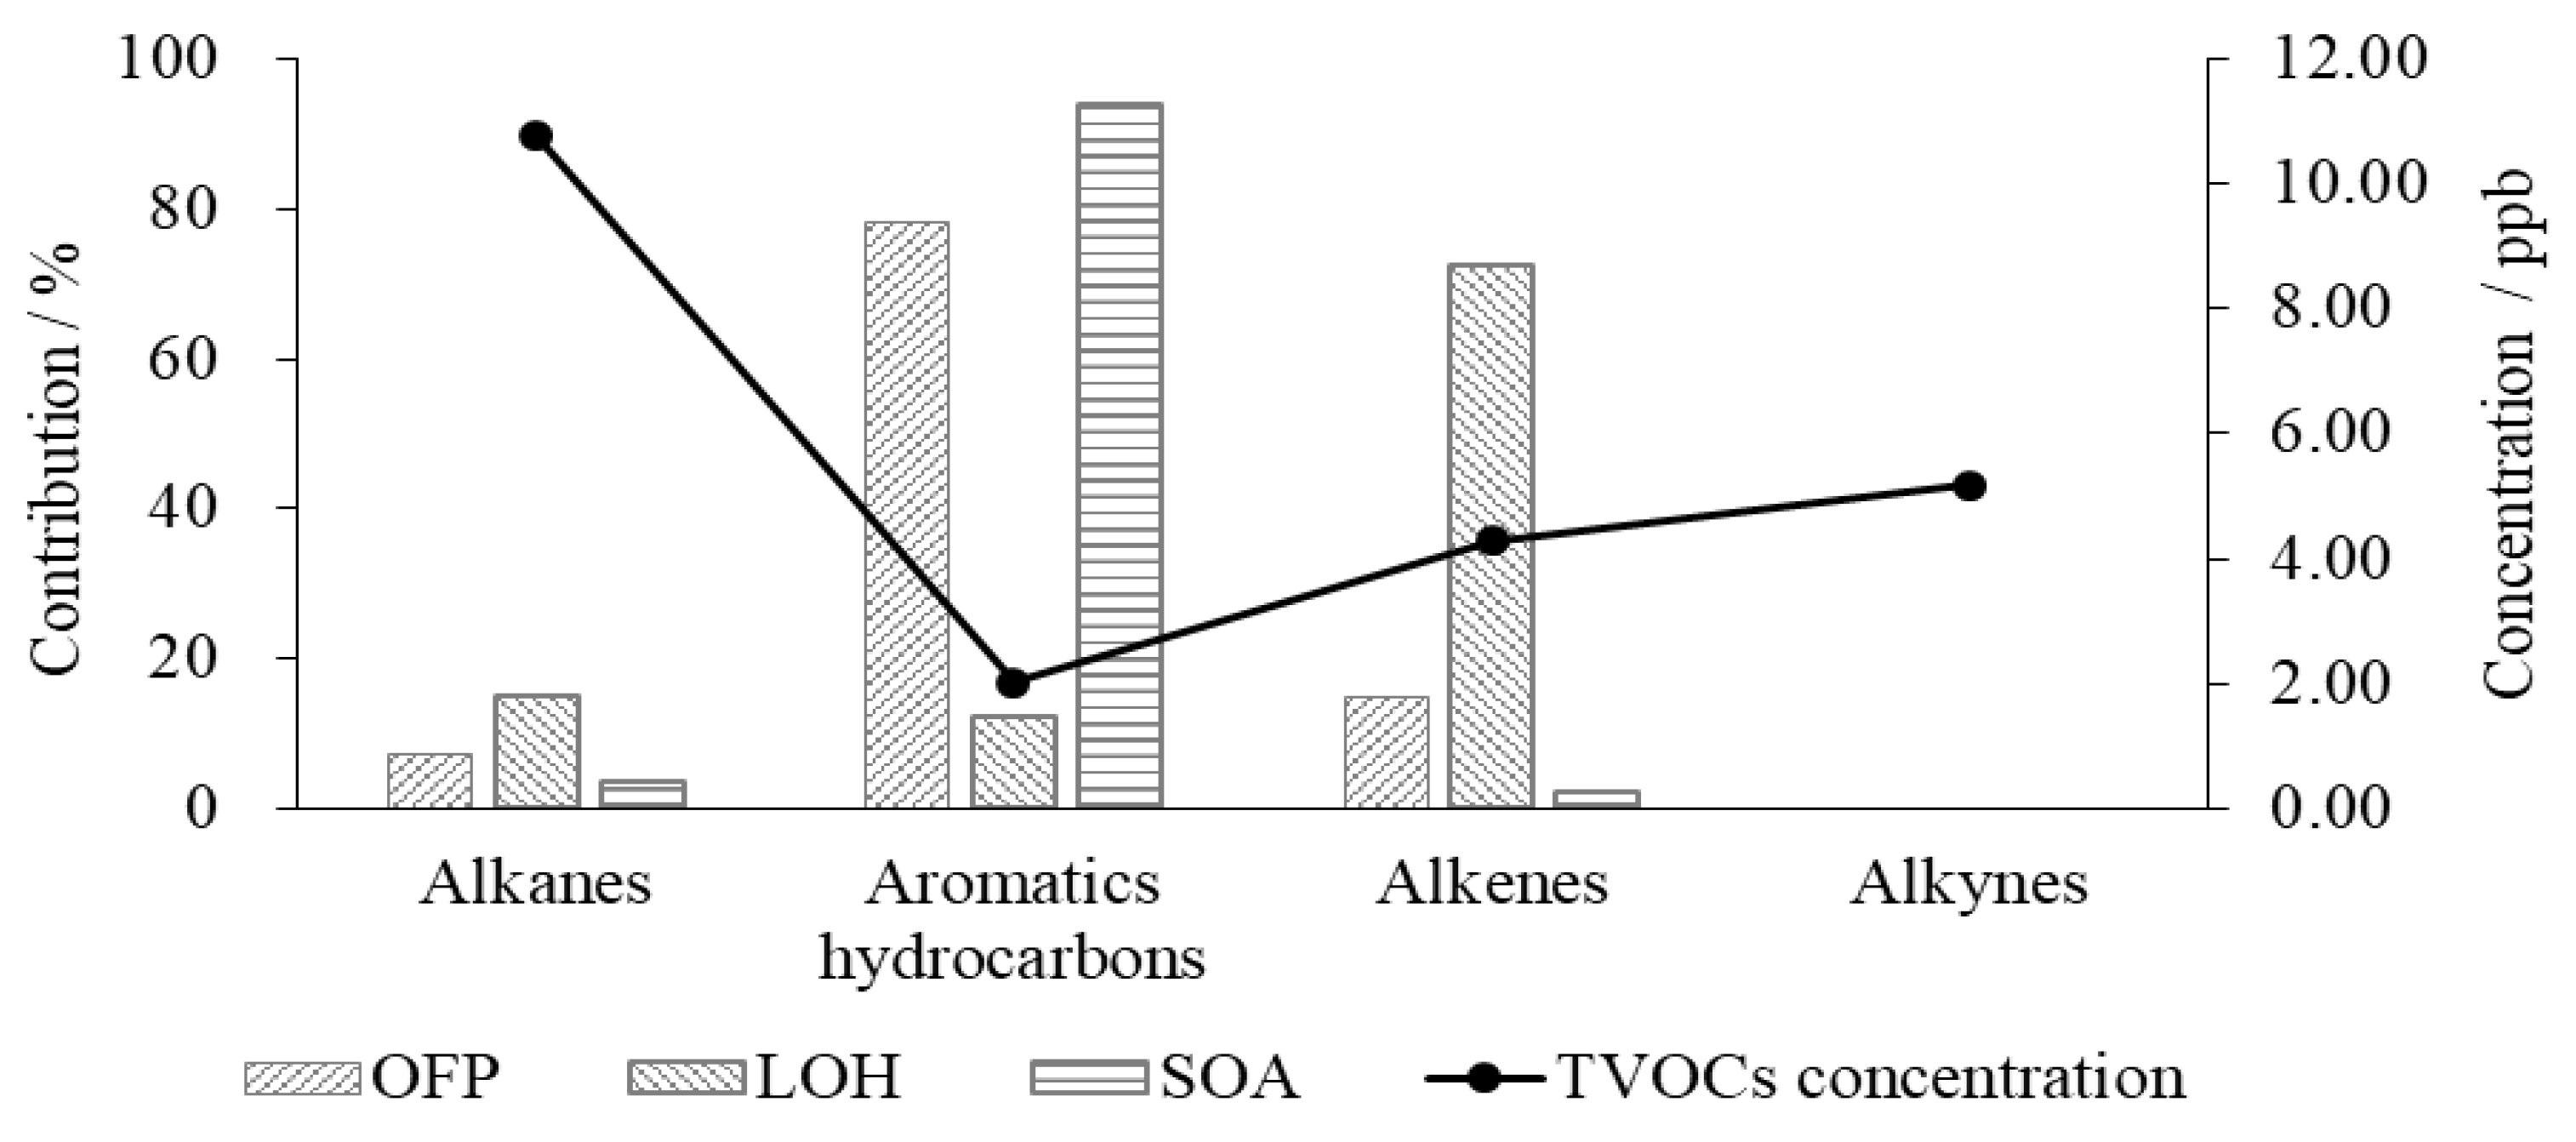
4.1. SOA Formation Potential in VOCs

Figure 7 shows the chemical reactivities of various types of VOCs. Contributions to the formation potential of SOA from large to small are aromatic hydrocarbons (94%), alkanes (4%), and alkenes (2%). Despite the lower level of aromatic hydrocarbons compared with other types of VOCs, they play an absolutely dominant role in the contribution to the formation of SOA, which is demonstrated in the results of the northern suburbs of Nanjing [8,22], which show a similar percentage, indicating that the formation of SOA is significantly influenced by aromatic hydrocarbons. The dominant contributions of aromatic hydrocarbons to the formation potential of SOA appear in various seasons, with the percentage from high to low in autumn, spring, winter, and summer (Table 2).
The total formation potential of SOA in each VOC component is around 8.04 ppbv, while the 10 VOC components with the highest contributions in 2019 were toluene (39.21%), benzene (31.07%), o-xylene (5.93%), ethylbenzene (5.52%), isoprene (2.33%), 1,3,5-trimethylbenzene (2.12%), m-ethyltoluene (2.09%), methylcyclohexane (1.80%), p-diethylbenzene (1.51%), and 1,2,3-trimethylbenzene (1.47%) (Table 3). Similar to the results in the northern suburbs of Nanjing [8], the contribution percentages of toluene appear the highest in Shenyang as well, where the percentage is higher than that in the northern suburbs of Nanjing (27.28%). The contribution of benzene is next, and, along with the contribution of toluene, the total percentage add up to over 70%. Benzene and toluene, including other benzene series which contribute significantly to the formation of SOA, are both key raw materials of the organic chemical industry that can be used as solvents [34]. Furthermore, they are among the important products of flow sources [35]. Therefore, VOC components that contribute more to SOA formation in Shenyang come significantly from solvents and vehicle emissions, meaning that control of the use of a large number of solvents and vehicle emissions is an effective method to suppress SOA formation.

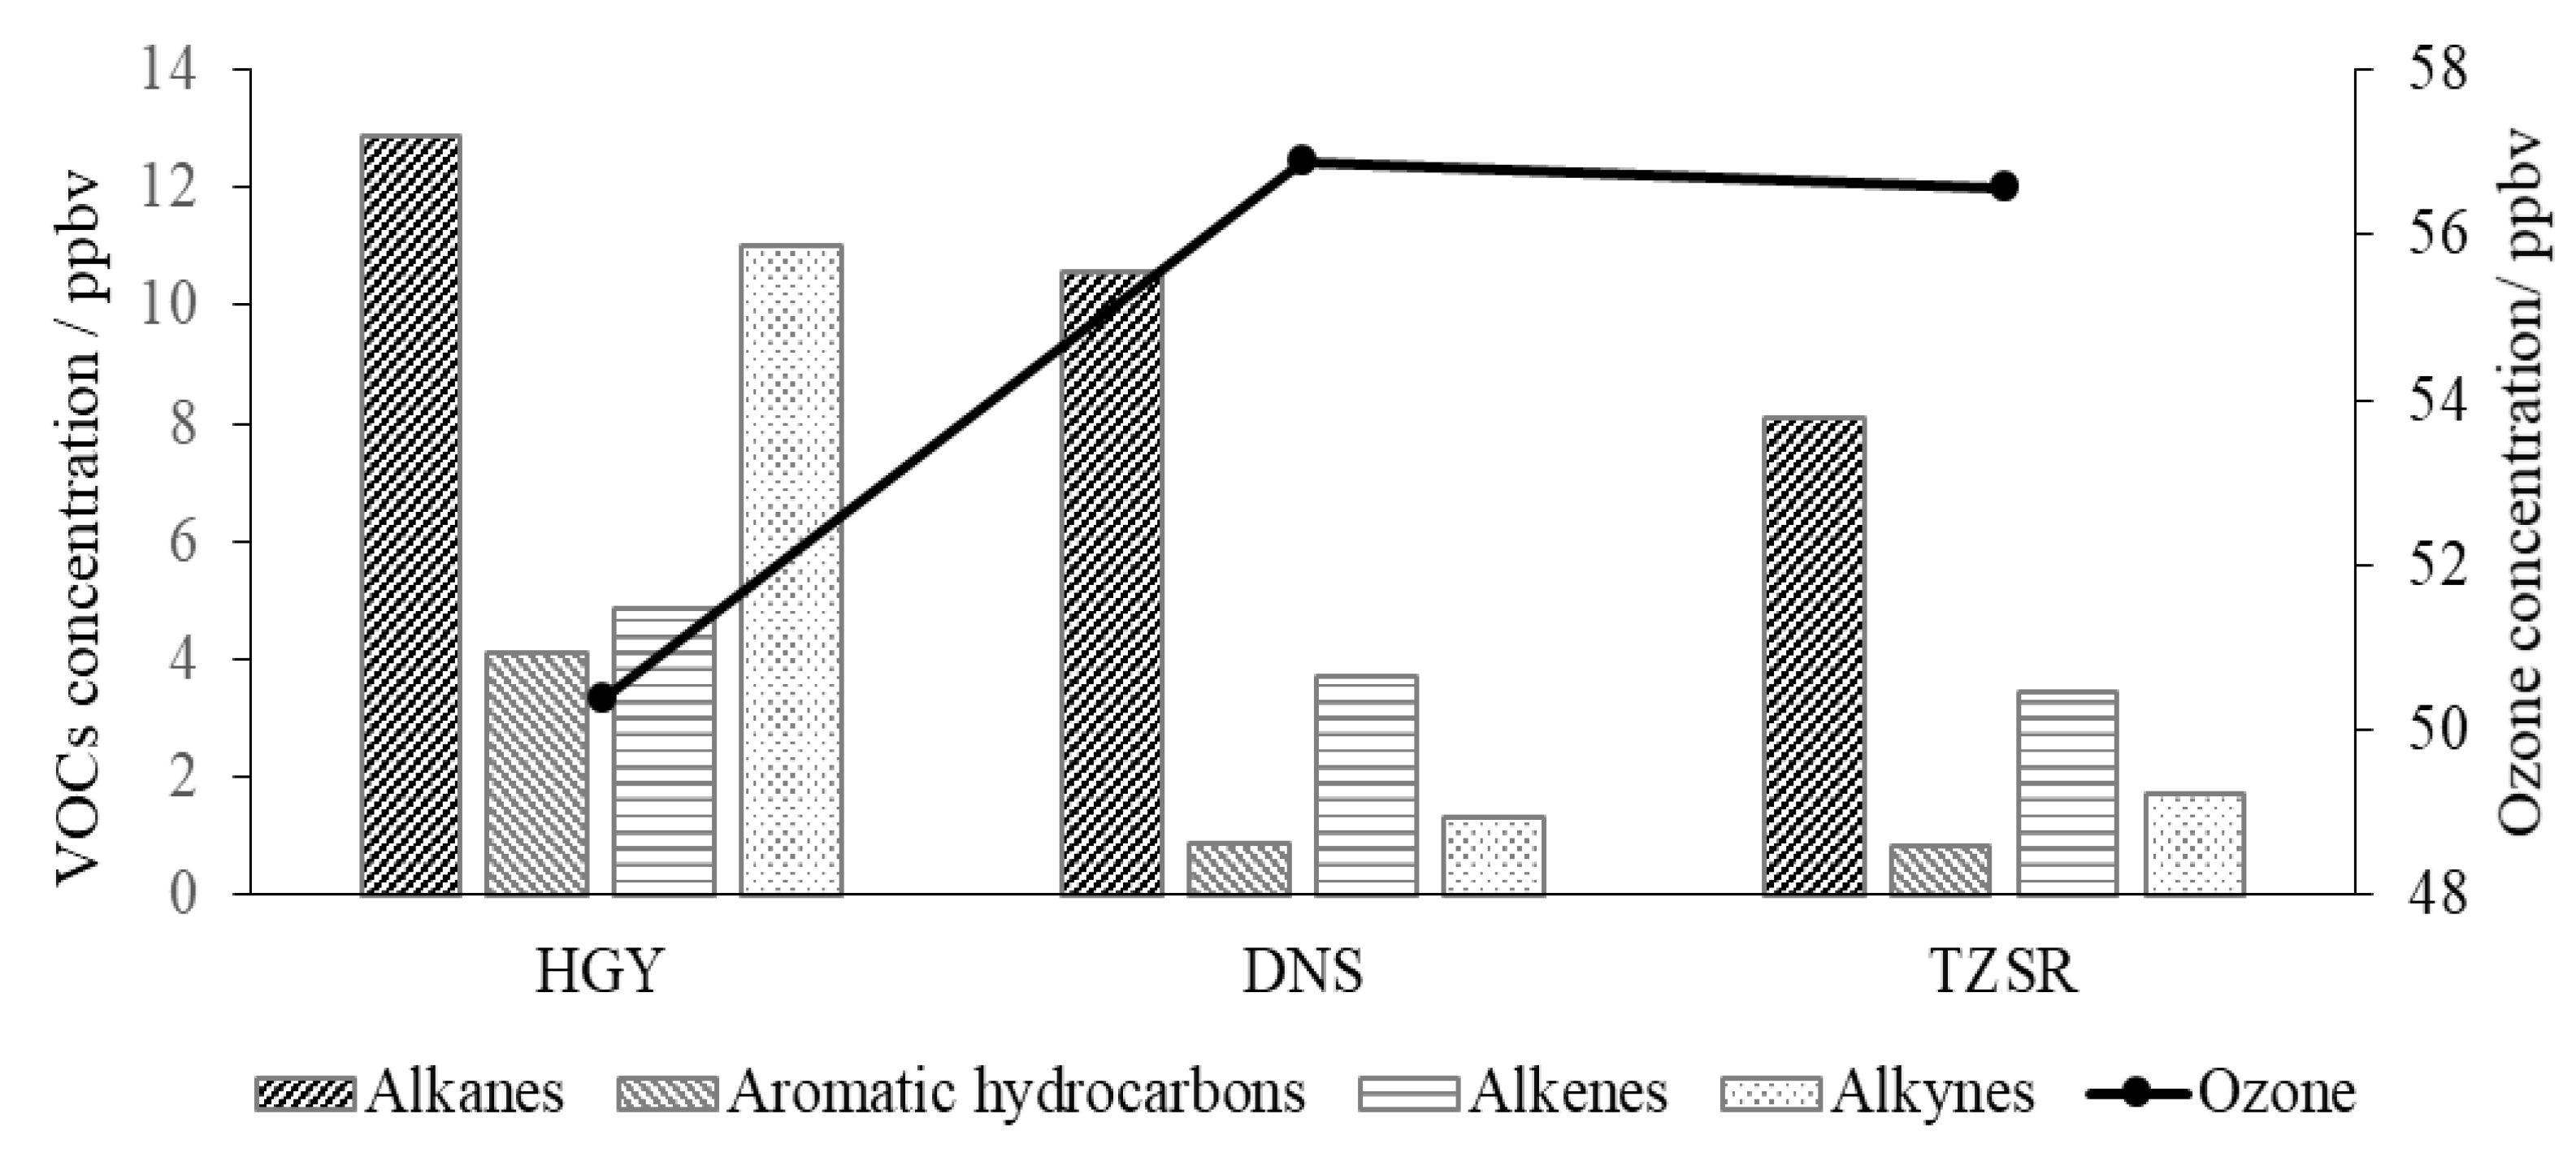
4.2. Ozone Formation Potential in VOCs

Contributions to the formation potential of ozone from large to small are aromatic hydrocarbons (78%), alkene (15%), and alkane (7%). Contributions of aromatic hydrocarbons to the potential of ozone formation are much more significant than those of the three other types of VOCs (Figure 7), meaning that it is the most active type of VOC in atmospheric chemical reactions, in accord with the results from an examination of the urban area of Guangzhou [15]. The main discrepancy between the two regions is that the percentage of alkenes contributing to ozone formation in Shenyang appears two times higher than that in Guangzhou (38%). Thus, it is shown that aromatic hydrocarbons are the dominant contributor to the formation of ozone and SOA, rather than alkanes, although alkanes are the chief VOC component in the atmospheric environment of Shenyang. The contributions of aromatic hydrocarbons to the potential of ozone formation appear the most significant throughout the year, with the percentages from high to low in autumn, winter, spring, and summer (Table 2). In contrast, the results of the northern suburbs of Nanjing [8] show that alkenes contribute the most to ozone formation, which is probably due to the different estimation method.
As is shown in Table 4, the total formation potential of ozone in each VOC component is about 5.74 ppbv, and the 10 VOC components with the highest contributions in 2019 were toluene (29.64%), isoprene (14.83%), o-xylene (10.79%), 1,3,5-trimethylbenzene (10.36%), benzene (9.13%), 1,2,4-trimethylbenzene (8.32%), 1,2,3-trimethylbenzene (5.09%), ethylbenzene (3.87%), methylcyclopentane (2.06%), and methylcyclohexane (1.68%). In accordance with the observations in Guanzhou [15,36], toluene contributes the most to ozone formation, while the contribution of isoprene is not ignorable. In general, isoprene originates not only from biological emissions throughout the year at times other than in winter [37], but also from anthropogenic emissions, especially traffic emissions [38], meaning that control of the use of a large number of solvents and vehicle emissions is also an effective way to control ozone pollution in Shenyang. Moreover, exploring solutions to control isoprene emission from broad-leaved forests and shrubs [37] might also be factors worth considering.

4.3. Influence of VOCs on the Consumption Rate of Hydroxyl Radicals

Contributions to the consumption rate of hydroxyl radicals from large to small are alkenes (73%), alkanes (15%), and aromatic hydrocarbons (12%). Here, the contribution of alkenes is far more significant (Figure 7). The contribution of alkenes to the consumption rate of hydroxyl radicals in Shenyang, which is a bit higher than that in Guangzhou (64%) [15], appears dominant throughout the year with the percentages from high to low in winter, spring, autumn, and summer (Table 2).
As is shown in Table 5, the total consumption rate of VOCs on the consumption rate of hydroxyl radicals is around 99.49 ppbv, and the 10 VOC components with the highest contributions are ethylene (24.64%), propylene (16.16%), 1-hexene (9.93%), 1-butene (5.17%), trans-2-butene (4.98%), cis-2-butene (3.62%), propane (3.47%), toluene (3.32%), cis-2-pentene (3.16%), and styrene (3.15%). It is significantly different from the results in Guangzhou, where the contribution of trans-2-pentene appears the largest with a percentage of 19.14% [15].

5. Conclusions

In Shenyang, the concentrations of TVOCs from high to low appear in winter, autumn, spring, and summer. For various types of VOCs, the concentrations of alkanes, alkenes, and alkynes appear generally the highest in winter and the lowest in summer, whereas the concentrations of aromatic hydrocarbons appear the highest in autumn and the lowest in summer. Alkanes appear with the highest concentration, followed by alkynes, alkenes, and aromatic hydrocarbons. Diurnal variations in each type of VOC experience peaks mainly in the morning and evening, among which alkanes and alkenes reach the maximum at 7:00, whereas alkyne and aromatic hydrocarbons reach a maximum in traffic peak hours of 22:00 and 21:00, respectively. The concentration of each type of VOC reaches a minimum in the afternoon (13:00–14:00).
As they are the most active type of VOC in atmospheric chemical reactions, aromatic hydrocarbons are the dominant contributor to the formation of both ozone and SOA. Contributions to the formation potential of SOA from large to small are aromatic hydrocarbons (94%), alkanes, and alkenes, which is similar with the results of the northern suburbs of Nanjing. The dominant contributions of aromatic hydrocarbons to the formation potential of SOA appear in various seasons, with the percentage from high to low in autumn, spring, winter, and summer. The 10 VOC components with the highest contributions are toluene, benzene, o-xylene, ethylbenzene, isoprene, 1,3,5-trimethylbenzene, m-ethyltoluene, methylcyclohexane, p-diethylbenzene, and 1,2,3-trimethylbenzene, while the contributions of toluene and benzene add up to over 70%, meaning that control of the use of a large number of solvents and vehicle emissions would be an effective method to suppress SOA formation in the Shenyang area.
Contributions to the formation potential of ozone from large to small are aromatic hydrocarbons (78%), alkene, and alkane. The contribution of aromatic hydrocarbons to the potential of ozone formation is much more significant than that of the three other types of VOCs, in accordance with the results of the urban area of Guangzhou. The discrepancy is that the contribution percentage of alkenes to ozone formation in Shenyang appears twice as high. The contributions of aromatic hydrocarbons to the potential of ozone formation appear the most significant throughout the year, with the percentages from high to low in autumn, winter, spring, and summer. In contrast, most likely due to the different estimation method, the results of the northern suburbs of Nanjing show that alkenes contribute the most to ozone formation. The 10 VOC components with the highest contributions are toluene, isoprene, o-xylene, 1,3,5-trimethylbenzene, benzene, 1,2,4-trimethylbenzene, 1,2,3 -trimethylbenzene, ethylbenzene, methylcyclopentane, and methylcyclohexane. Similar to SOA, control of the use of a large number of solvents and vehicle emissions would be an effective way to control ozone pollution in Shenyang. Moreover, exploring solutions to control isoprene emission from broad-leaved forests and shrubs also might be factors worth considering.
Contributions to the consumption rate of hydroxyl radicals from large to small are alkenes (73%), alkanes, and aromatic hydrocarbons, while the contribution of alkenes is far more significant, and is a bit higher than that in Guangzhou. The 10 VOC components with the highest contributions are ethylene, propylene, 1-hexene, 1-butene, trans-2-butene, cis-2-butene, propane, toluene, cis-2-pentene, and styrene.

Author Contributions

Conceptualization, N.L.; methodology, N.L. and X.L.; software, N.L.; validation, L.L. and C.W.; formal analysis, N.L. and L.L.; investigation, N.L.; resources, N.L.; data curation, W.R. and C.S.; writing—original draft preparation, N.L.; writing—review and editing, N.L. and X.L.; visualization, N.L.; project administration, N.L. All authors have read and agreed to the published version of the manuscript.

Funding

This research was funded by the Basic Research Funds of Central Public Welfare Research Institutes, grant number 2020SYIAEZD1, the Science & Technology Project of Liaoning Province, grant number 2019JH8/10300095, and the Key program of science foundation of Liao-ning Meteorological Office, grant number D202101.

Institutional Review Board Statement

Not applicable.

Informed Consent Statement

Not applicable.

Data Availability Statement

Informed consent was obtained from all subjects involved in the study.

Conflicts of Interest

The authors declare no conflict of interest.

References

  1. Haagen-Smit, A.J. Chemistry and physiology of Los Angeles Smog. Ind. Eng. Chem. 1952, 44, 1342–1346. [Google Scholar] [CrossRef]
  2. Seinfeld, J.H. Urban air pollution: State of the science. Science 1989, 243, 745–752. [Google Scholar] [CrossRef] [PubMed]
  3. Seinfeld, J.H.; Pandis, S.N. Atmospheric Chemistry and Physics: From Air Pollution to Climate Change; Wiley Interscience: Hoboken, NJ, USA, 1998. [Google Scholar]
  4. Sillman, S. The relation between ozone, NOx and hydrocarbons in urban and polluted rural environment. Atmos. Environ. 1999, 33, 1821–1845. [Google Scholar] [CrossRef]
  5. Cooper, O.R.; Gao, R.S.; Tarasick, D.; Leblanc, T.; Sweeney, C. Long-term ozone trends at rural ozone monitoring sites across the United States, 1990–2010. J. Geophys. Res. Atmos. 2012, 117, D22307. [Google Scholar] [CrossRef]
  6. Simon, H.; Reff, A.; Wells, B.; Xing, J.; Frank, N. Ozone trends across the United States over a period of decreasing NOx and VOC emissions. Environ. Sci. Technol. 2015, 49, 186–195. [Google Scholar] [CrossRef] [PubMed] [Green Version]
  7. China’s Ministry of Environmental Protection. China’s Ambient Air Quality Standard; Ministry of Environmental Protection: Beijing, China, 2012.
  8. Lin, X.; Zhu, B.; An, J.L.; Yang, H. Potential contribution of secondary organic aerosols and ozone of VOCs in the Northern Suburb of Nanjing. China Environ. Sci. 2015, 35, 976–986. [Google Scholar]
  9. Lyu, X.P.; Chen, N.; Guo, H.; Zhang, W.H.; Wang, N.; Wang, Y.; Liu, M. Ambient volatile organic compounds and their effect on ozone production in Wuhan, central China. Sci. Total. Environ. 2016, 541, 200–209. [Google Scholar] [CrossRef]
  10. Ran, L.; Zhao, C.S.; Xu, W.Y.; Lu, X.Q.; Han, M.; Lin, W.L.; Yan, P.; Xu, X.B.; Deng, Z.Z.; Ma, N.; et al. VOC reactivity and its effect on ozone production during the HaChi summer campaign. Atmos. Chem. Phys. 2011, 11, 4657–4667. [Google Scholar] [CrossRef] [Green Version]
  11. Shao, M.; Zhang, Y.; Zeng, L.; Tang, X.; Zhang, J.; Zhong, L.; Wang, B. Ground-level ozone in the Pearl River Delta and the roles of VOC and NOx in its production. J. Environ. Manag. 2009, 90, 512–518. [Google Scholar] [CrossRef]
  12. Tang, X.Y.; Zhang, Y.H.; Shao, M. Atmospheric Environmental Chemistry, 2nd ed.; Higher Education Press: Beijing, China, 2006. [Google Scholar]
  13. Xue, L.K.; Wang, T.; Gao, J.; Ding, A.J.; Zhou, X.H.; Blake, D.R.; Wang, X.F.; Saunders, S.M.; Fan, S.J.; Zuo, H.C.; et al. Ground-level ozone in four Chinese cities: Precursors, regional transport and heterogeneous processes. Atmos. Chem. Phys. 2014, 14, 13175–13188. [Google Scholar] [CrossRef] [Green Version]
  14. Yang, X.X.; Tang, L.L.; Zhang, Y.J.; Mu, Y.F.; Wang, M.; Chen, W.T.; Zhou, H.C.; Hua, Y.; Jiang, R.X. Correlation analysis between characteristics of VOCs and ozone formation potential in summer in Nanjing urban district. Environ. Sci. 2016, 37, 443–451. [Google Scholar]
  15. Yu, X.F.; Cheng, P.; Gu, Y.G.; Li, M.; Tian, Z. Formation potential of ozone and secondary organic aerosol from VOCs oxidation in summer in Guangzhou, China. China Environ. Sci. 2018, 38, 830–837. [Google Scholar]
  16. Zhang, J.; Wang, T.; Chameides, W.L.; Cardelino, C.; Kwok, J.; Blake, D.R.; Ding, A.; So, K.L. Ozone production and hydrocarbon reactivity in Hongkong, Southern China. Atmos. Chem. Phys. 2007, 7, 557–573. [Google Scholar] [CrossRef] [Green Version]
  17. Huang, R.J.; Zhang, Y.L.; Carlo, B.; Ho, K.F.; Cao, J.J.; Han, Y.; Daellenbach, K.R.; Slowik, J.G.; Platt, S.M.; Canonaco, F.; et al. High secondary aerosol contribution to particulate pollution during haze events in China. Nature 2014, 514, 218–222. [Google Scholar] [CrossRef] [PubMed] [Green Version]
  18. Sun, Y.L.; Wang, Z.F.; Fu, P.Q.; Yang, T.; Jiang, Q.; Dong, H.B.; Li, J.; Jia, J.J. Aerosol composition, sources and processes during wintertime in Beijing, China. Atmos. Chem. Phys. 2013, 13, 4577–4592. [Google Scholar] [CrossRef] [Green Version]
  19. Grosjean, D.; Seinfeld, J.H. Parameterization of the formation potential of secondary organic aerosols. Atmos. Environ. 1989, 23, 1733–1747. [Google Scholar] [CrossRef]
  20. Barthelmie, R.J.; Pryor, S.C. Secondary organic aerosols: Formation potential and ambient data. Sci. Total. Environ. 1997, 205, 167–178. [Google Scholar] [CrossRef]
  21. Lv, Z.F.; Hao, J.M.; Duan, J.C.; Li, J.H. Estimate of the Formation Potential of Secondary Organic Aerosol in Beijing Summertime. Environ. Sci. 2009, 34, 424–433. [Google Scholar]
  22. Wang, Q.; Chen, C.H.; Wang, H.L.; Zhou, M.; Lou, S.R.; Qiao, L.P.; Huang, C.; Li, L.; Su, L.Y.; Mu, Y.Y.; et al. Forming potential of secondary organic aerosols and sources apportionment of VOCs in autumn of Shanghai, China. Environ. Sci. 2013, 30, 969–975. [Google Scholar]
  23. Wang, F.P.; Zhu, Q.; Feng, N.; Liu, R.L.; Huang, X.F.; He, L.Y. The generation potential of secondary organic aerosol of atmospheric VOCs in Shenzhen. China Environ. Sci. 2014, 34, 2449–2457. [Google Scholar]
  24. Qi, A.A.; Zhou, X.P.; Lei, C.N.; Ma, X.; Xie, Y.S.; Pang, W.Q.; Hao, L.L. Key active components and sources of volatile organic compounds in ambient air of Lanzhou city. Environ. Chem. 2020, 39, 3083–3093. [Google Scholar]
  25. Liu, N.W.; Ren, W.H.; Li, X.L.; Ma, X.; Zhang, Y.; Li, B. Distribution and urban–suburban differences in ground-level ozone and its precursors over Shenyang, China. Meteorol. Atmos. Phys. 2019, 131, 669–679. [Google Scholar] [CrossRef]
  26. Shao, M.; Wang, W.J.; Yuan, B.; Parrish, D.D.; Li, X.; Lu, K.; Wu, L.; Wang, X.; Mo, Z.; Yang, S.; et al. Quantifying the role of PM2.5 dropping in variations of ground-level ozone: Inter-comparison between Beijing and Los Angeles. Sci. Total. Environ. 2021, 788, 147712. [Google Scholar] [CrossRef]
  27. Grosjean, D. In situ organic aerosol formation during a smog episode: Estimated production and chemical functionality. Atmos. Environ. 1992, 24A, 953–963. [Google Scholar] [CrossRef]
  28. Izumi, K.; Fukuyama, T. Photochemical aerosol formation from aromatic hydrocarbons in the presence of NOx. Atmos. Environ. 1990, 24A, 1433–1441. [Google Scholar] [CrossRef]
  29. Carter, W.P.L. Development of ozone reactivity scales for volatile Organic compounds. Air Waste 1994, 44, 881–899. [Google Scholar] [CrossRef] [Green Version]
  30. Atkinson, R.; Arey, J. Atmospheric degradation of volatile organic compounds. Chem. Rev. 2003, 103, 4605–4638. [Google Scholar] [CrossRef]
  31. Liu, N.; Ma, J.Z. Seasonal relationships between tropospheric ozone and its precursors over East Asia. J. Appl. Meteorol. Sci. 2017, 28, 427–435. [Google Scholar]
  32. Zhang, R.X.; Liu, H.W.; Deng, S.X. Characteristics of VOCs and formation potential of O3 and SOA in autumn and winter in Baoji, China. China Environ. Sci. 2020, 40, 983–996. [Google Scholar]
  33. Shenyang Ecological Environment Bureau. Shenyang Ecological Environment Quality Report in 2016 to 2020; Shenyang Ecological Environment Bureau: Shenyang, China, 2021.
  34. Guo, H.; Wang, T.; Louie, P.K.K. Source apportionment of ambient non-methane hydrocarbons in Hong Kong: Application of a principal component analysis (PCA)/absolute principal component scores (APCS) receptor model. Environ. Pollut. 2004, 129, 489–498. [Google Scholar] [CrossRef]
  35. Ye, W.H.; Sun, X.H.; Liu, J.S.; Pan, H.F.; Pang, X.L. Study on air pollution of VOC in arterial traffic. Environ. Monit. China 2009, 25, 85–89. [Google Scholar]
  36. Zou, Y.; Deng, X.J.; Zhu, D.; Gong, D.C.; Wang, H.; Li, F.; Tan, H.B.; Deng, T.; Mai, B.R.; Liu, X.T.; et al. Characteristics of 1year of observational data of VOCs, NOx and O3 at a suburban site in Guangzhou, China. Atmos. Chem. Phys. 2015, 15, 6625–6636. [Google Scholar] [CrossRef] [Green Version]
  37. Xu, Z.N. Observation Based Study of VOCs and Their Influence on Ozone and Secondary Organic Formation in the Western YRD Region, China; Nanjing University: Nanjing, China, 2019. [Google Scholar]
  38. Liu, Y.; Shao, M.; Lu, S. Volatile organic compound (VOC) measurements in the Pearl River Delta (PRD) region, China. Atmos. Chem. Phys. 2008, 8, 1531–1545. [Google Scholar] [CrossRef] [Green Version]
Figure 1. Map of Liaoning Province and locations of the ambient air quality monitoring sites in Shenyang.
Atmosphere 12 01240 g001
Figure 2. Monthly variation of concentrations for total VOCs and ozone in Shenyang.
Atmosphere 12 01240 g002
Figure 3. Monthly variation of concentrations for various types of VOCs in Shenyang.
Atmosphere 12 01240 g003
Figure 4. Concentrations for various types of VOCs and ozone at each site in Shenyang.
Atmosphere 12 01240 g004
Figure 5. Wind frequency (%) and wind speed (m/s) roses in Shenyang.
Atmosphere 12 01240 g005
Figure 6. Diurnal variations of concentrations for various types of VOCs in Shenyang.
Atmosphere 12 01240 g006
Figure 7. Photochemical reactivities for various types of VOCs in Shenyang.
Atmosphere 12 01240 g007
Table 1. Characteristics and levels of ozone, NOx (ppbv) and PM2.5 (µg/m3).
Information of Each SiteVOCs’ Environmental Monitoring SiteState-Controlled Ambient Air Quality Monitoring SiteNBMS
SiteHGYDNSTZSRLDSTYSWHRXHYDLRHNRXXSYNRSLXRJSSSLRNBMS
Latitude41.77° N 41.78° N 41.83° N 41.85° N 41.80° N 41.77° N 41.79° N 41.84° N 41.74° N 41.70° N 41.91° N 41.73° N 41.92° N 41.93° N 41.73
Longitude123.29° E 123.45° E 123.57° E 123.43° E 123.40° E 123.41° E 123.47° E 123.59° E 123.51° E 123.42° E 123.60° E 123.24° E 123.38° E 123.68° E 123.52
LocationUrbanUrbanSuburbsUrbanUrbanUrbanUrbanSuburbsSuburbsSuburbsSuburbsSuburbsSuburbsRuralUrban
Land-useCityCityCity/
cropland
CityCityCityCityCity/
cropland
City/
cropland
City/
cropland
City/
cropland
City/
cropland
City/
cropland
Forest / reservoirCity
Ozone—mean26292929 28 30 27 29 27 30 32 31 31 31
Ozone—max479545252 52 53 48 50 47 52 51 51 52 47
Ozone—min9101112 10 12 10 12 10 13 14 13 14 16
NOx—mean51342537 33 30 30 22 31 36 20 30 28 15
NOx—max78492860 53 52 49 35 53 55 33 46 44 21
NOx—min26191416 15 11 14 12 17 19 13 12 15 10
PM2.5—mean48504440 44 44 42 41 49 45 37 47 39 41
PM2.5—max76827063 70 73 71 71 83 78 59 81 68 66
PM2.5—min22222218 21 2117 16 20 18 17 20 19 20
Table 2. Seasonal variations of the contribution of VOCs to ozone and SOA formation potential and hydroxyl radical consumption rate.
SeasonPhotochemical ReactivitiesVOC
(ppbv)
Alkanes
(%)
Aromatic Hydrocarbons
(%)
Alkenes
(%)
SpringOFP5.0977914
LOH82.68151273
SOAp7.463952
SummerOFP4.9966133
LOH64.42181369
SOAp5.404897
AutumnOFP6.467867
LOH114.67151471
SOAp10.403961
WinterOFP6.8488210
LOH136.13131176
SOAp8.794942
Table 3. 10 VOC components with the highest contributions to SOA formation potential.
Units/ppbv.Mean Level (ppbv)FAC (%)FVOCr (%)SOAp (ppbv)SOAp (%)
toluene0.555.4012.003.1539.21
benzene1.122.0010.002.5031.07
o-xylene0.075.0026.000.485.93
ethylbenzene0.075.4015.000.445.52
isoprene0.092.000.000.192.33
1,3,5-trimethylbenzene0.022.9074.000.172.12
m-ethyltoluene0.026.3031.000.172.09
methylcyclohexane0.042.7020.000.141.80
p-diethylbenzene0.016.3047.000.121.51
1,2,3-trimethylbenzene0.023.6051.000.121.47
Table 4. 10 VOC components with the highest contributions to ozone formation potential.
Units/ppbv.Mean Level (ppbv)MIRFVOCr (%)OFP (ppbv)OFP (%)
toluene0.552.7012.001.7029.64
isoprene0.099.100.000.8514.83
o-xylene0.076.5026.000.6210.79
1,3,5-trimethylbenzene0.0210.1074.000.5910.36
benzene1.120.4210.000.529.13
1,2,4-trimethylbenzene0.028.8058.000.488.32
1,2,3-trimethylbenzene0.028.9051.000.295.09
ethylbenzene0.072.7015.000.223.87
methylcyclopentane0.042.8010.000.122.06
methylcyclohexane0.041.8020.000.101.68
Table 5. 10 VOC components with the highest contributions to the consumption rate of hydroxyl radical.
Units/ppbv.Mean Level (ppbv)KOHLOH (ppbv)LOH (%)
ethylene2.888.52 24.51 24.64
propylene0.6126.30 16.07 16.16
1-hexene0.2737.00 9.88 9.93
1-butene0.1631.40 5.14 5.17
trans-2-butene0.0864.00 4.95 4.98
cis-2-butene0.0656.40 3.60 3.62
propane3.171.09 3.46 3.47
toluene0.555.96 3.31 3.32
trans-2-pentene0.0565.00 3.14 3.16
styrene0.0558.00 3.13 3.15
Publisher’s Note: MDPI stays neutral with regard to jurisdictional claims in published maps and institutional affiliations.

