1. Introduction
The ionospheric total electron content (TEC) is a notable source of error that significantly affects the radio wave propagation, which disrupts the accuracy of the global positioning system (GPS) signals from the satellite to the receiver, causing the delay by changing the velocity of the propagated signals [
1,
2]. The TEC varies according to different geographical locations, such as high-latitude, mid-latitude, low-latitude, and equatorial regions [
3]. Due to the low solar radiation, these variations occur frequently in low-latitude and equatorial regions such as Malaysia. In these regions, the plasma density in the ionosphere has shown significant variations in TEC based on various factors such as seasons, latitudes, longitudes, time of the day, solar cycles, and geomagnetic activity. Thus, the ionospheric TEC in equatorial regions is subject to day-to-day variability and represents a challenging problem for ionospheric modellers [
4]. Therefore, the study and evaluation the performance of ionospheric models in equatorial regions are crucial to provide a representative model error for further improvement of the IRI models.
A number of empirical models have been developed to effectively predict ionospheric TEC variability at various regions worldwide. These empirical models can be divided into coefficient and time-series models [
5,
6]. Empirical coefficient models such as the broadcast model are commonly used for single-frequency GPS receivers, with accuracy ranging from 50% to 60% [
7]. However, its accuracy is rarely satisfactory even for absolute positioning, particularly in the case of enhanced solar activity [
8]. Other common examples of the empirical coefficient ionospheric model are the NeQuick model and the global Neustrelitz Total Electron Content Model (NTCM) [
3,
9,
10]. In addition, the International Reference Ionosphere (IRI) model [
11] is widely used and continuously updated. The IRI model relies on the availability of ionospheric observations, whereby the discrepancies between the actual and predicted trends are inevitable. The IRI model has been steadily improving from IRI-78 [
12], IRI-85 [
13], IRI-1990 [
14], IRI-2000 [
11], IRI-2007 [
15], IRI-2012 [
16] to IRI-2016 [
17], which is the latest model currently used. Ezquer showed that IRI-95 TEC generally overestimates observed TEC values during the daily minimum and underestimates these values in the remaining hours of the day [
18]. Bhuyan and Borah compared the GPS-measured TEC with the IRI-2000 model TEC and showed that the model TEC overestimated the observed TEC values in low-latitude areas [
19]. The IRI-2000 contained a topside formulation based on Booker’s approach of the skeleton profile [
20]. One disadvantage of this approach is that the density of the upper part of the electron density profile (800 km) becomes nearly constant, thus causing discrepancies between the experimental and proposed model TEC values [
21]. Subsequently, IRI-2007 was released with many enhanced features and showed a good agreement with the observed data in the anomaly crest station [
22]. Likewise, IRI-2012 incorporated significant enhancements in the representation of the electron density, description of electron temperature, ion composition, and bottom-side thickness [
23]. The latest release of the IRI model, IRI-2016, is enriched with several additional improvements.
Several pieces of research studied the variability of the VTEC and investigated the performance of the IRI-2007 and IRI-2012 models over equatorial and low-latitude regions. Leong compared the performance of the NeQuick, IRI-2012, and IRI-2007 models at Banting, Malaysia [
24]. The modelled VTEC values were compared with the measured VTEC derived from a dual-frequency GPS receiver during 2011. The ionospheric TEC generated by the IRI and the NeQuick models was in good agreement with the measured VTEC. For diurnal variation, the NeQuick and the IRI-2007 models exhibited a good agreement during the post-midnight and post-noon periods, respectively. However, the IRI-2012 model provided a better result as compared to the NeQuick and IRI-2007 models in monthly variation. However, Nigussie showed that the IRI-2007 model overestimates the VTEC trend in East African equatorial regions [
25]. Sethi reported that the IRI-2001 highly overestimates the VTEC values over low-latitude and equatorial regions [
26]. Kumar on the other hand, showed that the IRI-2012 model overestimates the measured VTEC during low and high solar activity phases in equatorial regions [
4]. However, in the Ethiopian region, Tariku stated that the model performed better during low solar activity when compared to high solar activity [
27,
28]. Elmunim investigated the performance of the IRI-2012 model in Langkawi, Malaysia [
29]. They found that IRI01-corr and NeQuick had petter predictions compared to IRI-2001. Recently, some researchers investigated the performance of the IRI-2016 over high and low latitudes [
30,
31].
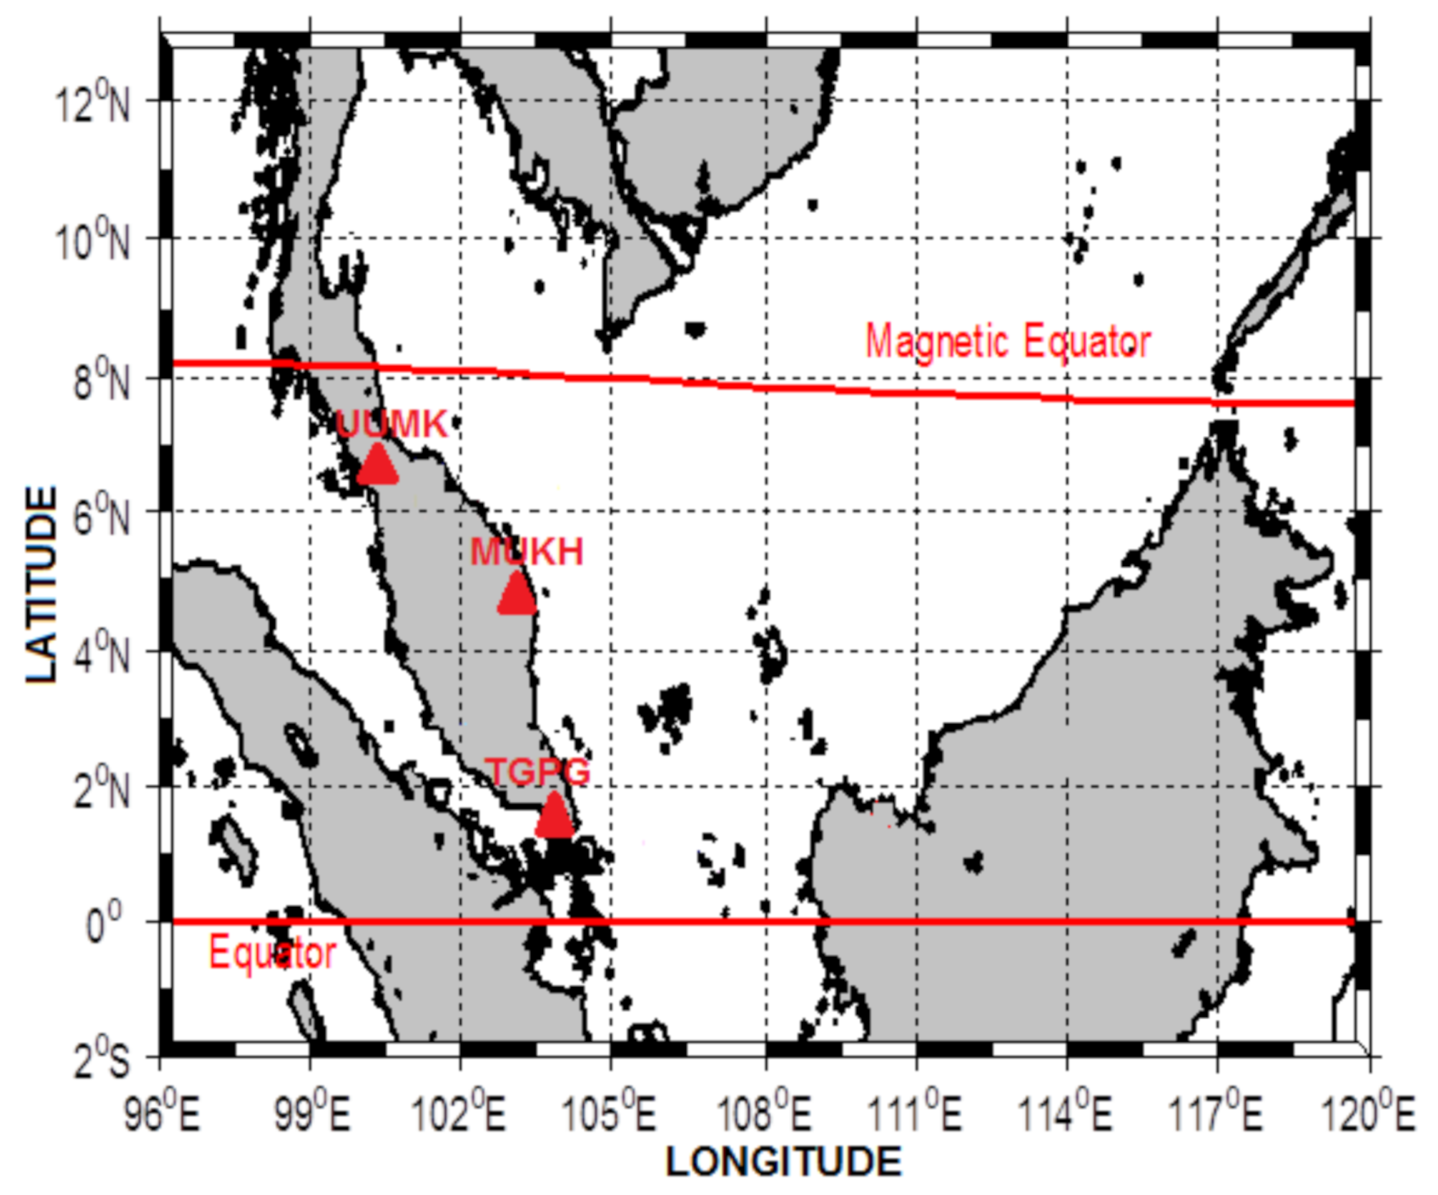
Since the difference between the measured and modelled VTEC values changes according to time and location, it is crucial to compare the measured and modelled VTEC data from different stations at different geomagnetical locations. In addition, the geomagnetic disturbance is one of the largest effects on the VTEC data. Owing to the latest release of the IRI model (IRI-2016) that is enriched with several new improvements for better performance, this study aims to evaluate the performance of the IRI-2016 model with the IRI-2012 model using IRI-2001, IRI01-corr, and NeQuick topside options. Furthermore, the VTEC compared with the IRI models (IRI-2001, IRI01-corr, and NeQuick) during geomagnetic quiet and disturbed periods in ascending and high solar activity phases for the period 2011–2013. The data obtained from different stations, namely Universiti Utara Malaysia Kedah (UUMK) (geographic coordinates 4.62° N–103.21° E, geomagnetic coordinates 5.64° N–174.98° E), Mukhtafibillah (MUKH) (geographic coordinates 6.46° N–100.50° E, geomagnetic coordinates 3.32° S–172.99° E), and Tanjung Pengerang (TGPG) (geographic coordinates 1.36° N–104.10° E, geomagnetic coordinates 8.43° S–176.53° E) are compared and the diurnal (day-to-day) variability of the measured and modelled VTEC data is investigated. However, some studies have demonstrated the improved performance of the IRI model from 2007 to 2016 IRI versions over low-latitude and equatorial regions as the ionospheric dynamics are rather complex in these areas. Nevertheless, there are very limited studies on ionospheric VTEC data over Malaysia and none have been performed to test and compare the performance of the IRI-2016 model with IRI-2012 over the region of Malaysia.
4. Results and Discussion
The quiet day’s diurnal variation in equatorial regions normally varies according to photoionisation production and the recombination losses associated with local solar radiation. A typical quiet day (Kp ≤ 1) on 7 March 2013 was chosen to represent the diurnal variation of VTEC. The hourly median local time (Malaysia local time = universal time + 8 h) was plotted on the horizontal axis against VTEC that was represented by the vertical axis (TEC units) as shown in
Figure 2. The diurnal pattern of VTEC was observed as an obvious single peak. The overall VTEC data over UUMK, MUKH, and TGPG stations indicated that the minimum value of VTEC was during sunrise (between 4:00 and 6:00 LT), and then gradually increased to attain its maximum value (between 13:00 and 17:00 LT) during the post-noon time. The gradual increase in VTEC was due to variations in the solar EUV, in which the EUV increases led to the enhancement of the ionisation which subsequently increases VTEC and vice versa [
39].
The diurnal variation of VTEC was observed to be higher in the UUMK station for most of the daily hours. When comparing the VTEC values across all the stations under consideration, the VTEC values in UUMK during 03:00–12:00 LT and 17:00–19:00 LT were higher than MUKH and TGPG stations, while the VTEC values were higher at 15:00, 21:00, and 22:00 LT in the TGPG station. During peak hours (12:00–16:00 LT), VTEC was comparatively lesser in the MUKH station. The variability of VTEC at these stations was particularly observed during peak hours at the post-noon time. The UUMK station is located near the magnetic equator as shown previously in
Figure 1. Hence, the abnormally recorded, slightly higher values of VTEC in the UUMK station can be explained according to Bittencourt research who indicated that the ionospheric VTEC increases with the increase in solar activity [
40]. The VTEC data were recorded during high solar activity in 2013 and are regarded as the maximum phase of Solar Cycle 24. During this period, the global vertical F-region drifts became large. Furthermore, the influence of the enhanced E × B vertical drift on the equator leads to the rise in the F-region plasma [
41]. Consequently, this may delay the decay time of the plasma, thus resulting in the abnormally slightly higher VTEC values recorded at the UUMK station. Similarly, Oryema observed the variations in VTEC data obtained in 2012 at different stations over African regions [
42]. They found that the Addis Ababa station located near the magnetic equator recorded the highest VTEC values as compared to other stations. However, in this study, the VTEC values obtained during 8:00–10:00 LT had comparatively similar values in the UUMK, MUKH, and TGPG stations. Asmare investigated the diurnal variation of TEC over Ethiopia during the solar maximum phase in 2013 [
43]. They observed peaks from 13:00 to 16:00 LT, with minimum values obtained at 6:00 LT. The diurnal variation in Bangkok, Thailand was also investigated by Arunpold, in which the trending peak occurred in the post-noon period between 14:00 and 18:00 LT during 2011 [
44]. Therefore, these observations indicate that the peak values of VTEC are associated with the smaller chemical losses in higher altitudes and the production of solar radiation during the post-noon periods [
45].
In order to evaluate the performance of the IRI-2016 model, the model was compared with IRI-2012 using IRI-2001, IRI01-corr, and NeQuick topside options according to the diurnal local time in different geomagnetic latitudes. The quiet day was selected during high solar activity for 2013, which was regarded as the maximum of Solar Cycle 24. During this period, the global vertical F-region drifts were large, besides the influence of the enhanced E×B vertical drift on the equator [
46]. The hourly diurnal variations during the quiet day (7 March 2013) in the UUMK, MUKH, and TGPG stations are shown in
Figure 3, with the first row representing the hourly variation in UUMK, MUKH, and TGPG stations. The VTEC values (TECU) are displayed on the vertical axis and the hours are represented by the horizontal axis. The IRI-2016 topside options are denoted in a solid line; green (IRI-2001), black (IRI01-corr), and pink (NeQuick), while the dotted line; green (IRI-2001), black (IRI01-corr), and pink (NeQuick) represents the IRI-2012 topside options. The second row in
Figure 3 represents the difference between the corresponding values of GPS-TEC and IRI models (DVTEC). Based on
Figure 3, it can be observed that the IRI01-corr and NeQuick topside options for both IRI-2016 and IRI-2012 models overestimated the GPS-TEC at all times of the day except during the peak hours from 11:00 to 18:00 LT in all the stations under consideration. However, the IRI-2001 option overestimated GPS-TEC in almost all the periods in TGPG stations and most of the time in UUMK and MUKH stations. From 00:00–06:00 LT, the VTEC values observed from all topside options (IRI-2001, IRI01-corr, and NeQuick) had almost similar prediction values as the IRI-2016 and IRI-2012 models. During the time from 06:00 to 17:00 LT, IRI-2016 (IRI-2001, NeQuick) had a better prediction compared with IRI-2012 (IRI-2001, NeQuick), while IRI-2012 (IRI01-corr) had a slightly better prediction as compared to IRI-2016 (IRI01-corr). The IRI-2001 and IRI01-corr for both IRI-2012 and IRI-2016 models displayed a similar prediction value from 18:00 to 23:00 LT, while IRI-2016 (NeQuick) had a better prediction as compared to IRI-2012 (NeQuick). Patel investigated the performance of the IRI-2016 model and compared it with IRI-2012 using IRI01-corr and NeQuick topside options over three stations (Bangalore, Hyderabad, Surat) in India [
47]. They found that IRI-2016 (IRI01-corr and NeQuick) had similar prediction values with the IRI-2012 model at all stations except for the morning hours, and the effect of the updated version (IRI-2016) was only observed from 05:00 to 10:00 LT. Tariku discussed the improved performance of the IRI-2016 model in the equatorial region over different regions of Ethiopia. His study showed that the IRI-2012 generally performs better in capturing the diurnal GPS-TEC values as compared to that of the IRI-2016 version [
28]. In this study, the highest DVTEC values for both IRI models were observed in the morning (06:00–07:00 LT), where they were found to be 23, 23, and 26 TECU (IRI-2001), 17, 15, and 20 TECU (IRI01-corr), 15, 15, and 20 TECU (NeQuick), observed in IRI-2016 for each of the UUMK, MUKH, and TGPG stations, respectively, while 23, 23, and 27 TECU (IRI-2001), 17, 16, and 20 TECU (IRI01-corr), 15, 19, and 20 TECU (NeQuick) for IRI-2012 were observed for each of the UUMK, MUKH, and TGPG stations, respectively. In general, DVTEC values derived from the IRI0-corr model were lower as compared to NeQuick and IRI-2001 for both IRI-2016 and IRI-2012 models.
The daily diurnal variations of VTEC during the quiet periods with ascending and high solar activity in 2011, 2012, and 2013 were selected to investigate the performance of the ionospheric models in the UUMK station. The quiet days were selected during 14–18 October 2011, 17–21 March 2012, and 7–11 March 2013. However, October and March are regarded as equinox months that have the highest range of VTEC values, with the equinox meridional wind blowing from the equator to the polar regions and subsequently causing a high ionisation crest value. The diurnal variations of the measured and modelled VTEC using IRI-2016 (IRI-2001, IRI01-corr, NeQuick), and IRI-2012 (IRI-2001, IRI01-corr, NeQuick) model over the five quiet days is shown in
Figure 4. The GPS-TEC attained its maximum peak during the post-noon period and was at its minimum level during sunrise in each of the ascending and high solar activity periods in 2011, 2012, and 2013. The overall measured and modelled VTEC displayed similar behaviour with the minimum values at sunrise, gradually increasing until it reached its maximum at post-noon, followed by a decrease at night. The minimum values for both IRI-2016 and IRI-2012 (IRI-2001, IRI01-corr, and NeQuick) models were attained at 04:00 LT and the maximum values were attained between 08:00 and 16:00 LT. Tariku compared the VTEC values obtained using the IRI-2016 topside options in 2013 over Ethiopia [
43]. The minimum value was observed at predawn, and the maximum was observed at post-noon, with the trend declining again at night. During peak hours between 11:00 to 17:00 LT, IRI-2016 and IRI-2012 (IRI-2001, IR01-corr, and NeQuick) models exhibited an underestimated agreement with the GPS-TEC. The underestimation was obvious in all the models during the low solar activity period in 2011. For the remaining periods, the IRI-2001 overestimated GPS-TEC, while IRI01-corr and NeQuick options had a better agreement with GPS-TEC in all the periods for 2011, 2012, and 2013 as compared to the IRI-2001 topside option.
In the 2011 period, the IRI-2016 (IRI-2001, IRI01-corr, and NeQuick) model had mostly better prediction values as compared to IRI-2012. Similarly in the 2012 period, the IRI-2016 (IRI-2001, NeQuick) model displayed better prediction values. During 20 and 21 March, the IRI-2012 (IRI-2001) model showed a marginally better prediction than IRI-2016. For 2013, IRI-2016 (NeQuick) showed a better prediction than the IRI-2012 model. However, during the period of 2011, 2012, and 2013 from 20:00 to 23:00 LT, the IRI-2012 (IRI-2001, IRI01-corr) model displayed better prediction values as compared to IRI-2016. Tariq et al. (2019) compared the performance of IRI-2012 and IRI-2016 over Pakistan and showed similar results, whereby IRI-2016 performed better than IRI-2012. However, Patel compared the performance of IRI-2016 and IRI-2012 over India and showed that the modelled VTEC from both IRI models were similar [
4]. Additionally, Tariku investigated the improvements of the IRI model over Ethiopia and reported that IRI-2012 generally performed better as compared to the IRI-2016 version [
43].
The IRI-2012 NeQuick model displayed maximum underestimation for GPS-TEC for the periods of 2011, 2012 and 2013, while in the IRI-2016 model, both NeQuick and IRI01-corr had almost a similar trend with the maximum underestimated values as compared to the IRI-2001 model. IRI-2001 showed maximum overestimation in both IRI-2012 and IRI-2016 models in the years under consideration. Asmare reported that the IRI-2012 model with the IRI-2001 showed the highest overestimation as compared to NeQuick and IRI01-corr options [
28]. Chauhan revealed that the GPS-TEC data were in close agreement with the NeQuick and the IRI01-corr models during the daytime, while the respective night-time values correlated well with the IRI-2001 model [
22]. In contrast, Sethi revealed that the agreement between the TEC observations and the IRI01-corr model in equatorial stations was better in the daytime, while the NeQuick model showed a better agreement [
26]. Adewale on the other hand, revealed that the agreement between the measured GPS-TEC and NeQuick model was better in both the night-time and daytime periods over the equatorial African region [
48]. The equatorial plasma bubble appears primarily during March and October, which are equinoctial months where the pre-reversal enhancement of the eastward electric field is strong [
49]. In quiet periods, the equatorial plasma bubble is generated almost exclusively at post-sunset and sometimes continues into post-midnight hours. This could explain the slight underestimation of the measured VTEC, and it is shown in
Figure 4.
The differences between the GPS-TEC and modelled values using IRI-2016 and IRI-2012 models during the selected quiet days in 2011, 2012, and 2013 is illustrated in
Figure 5. The hourly median local time is plotted on the horizontal axis against the DVTEC, which is represented by the vertical axis. The overestimation of the modelled VTEC is indicated by the positive difference in DVTEC values, while the negative DVTEC values are acquired when the modelled VTEC showed an underestimation as compared to GPS-TEC. The maximum DVTEC values of IRI-2001, IRI01-corr, and NeQuick options from IRI-2016 and IRI-2012 models are presented in
Table 1. The highest DVTEC values in both models were observed during the low solar activity period in 2011. The IRI01-corr had a better prediction and lower DVTEC as compared to IRI-2001 and NeQuick for both the IRI-2016 and IRI-2012 models. Comparatively, the IRI-2016 had lower DVTEC values. The improvement of the model was observed clearly in the low solar activity period during 2011. The improvement was around 5 TECU for all topside options. However, during 2012 and 2013, the IRI-2016 showed a slight improvement of around 2 TECU.
In order to investigate and compare IRI-2016 and IRI-2012 models’ performance during the disturbance of a geomagnetic storm, the VTEC has been estimated over three different geomagnetic storm events occurring in October 2011, March 2012, and March 2013. During these intense geomagnetic storms, the Dst value sharply decreased and attained its minimum value during the main phase of the storm at approximately −134, −131, and −132 nT in each of the events occurring on 25 October 2011, 9 March 2012, and 18 March 2013, respectively.
Figure 6 depicts the daily variation of the Dst values during October 2011, March 2012, and March 2013, as well as indicating how the Dst values were affected by the disturbance of the storm for these three different years, with Dst values displayed on the vertical axis and the days of the month represented by the horizontal axis. In October 2011, the storm started with the sudden storm commencement on 25 October 2011 at 8:00 LT (24 October 2011, 24:00 UT) and it was followed by the initial phase of the storm. The main phase of the storm occurred at 10:00 LT (2:00 UT) on 25 October, where the Dst dropped rapidly to −134 nT. In March 2012, the storm had a two-step gradual storm commencement which started on 7 March and the main phase started on 8 March and had a minimum Dst value of around −95 nT and this was followed by the short-lived recovery phase. The second main phase occurred on 9 March with a minimum Dst of −131 nT and the recovery phase commenced on 10 March. In March 2013, the storm appeared to consist of two phases where the Dst decreased to −89 nT at 18:00 LT (10:30 UT) during the main phase and remained at the same level for a few hours before dropping rapidly again down to −132 nT on 18 March at 4:30 LT (20:30 UT, 17 March). The recovery phase started thereafter on 20 March.
The sudden decrease in the Dst value enhances the GPS-TEC trend. The VTEC values were measured for seven days, which included the day the storm occurred and three days before and after the storm. The maximum value of GPS-TEC was observed during the geomagnetic storm day, which was approximately 80 TECU on 25 October 2011, 67 TECU on 9 March 2012, and 63 TECU on 18 March 2013. As illustrated in
Figure 6, the effects of the geomagnetic storm on the measured GPS-TEC began one day before the storm (initial phase), whereby there was a slight increase followed by a steady decrease until the next day after the storm (recovery phase). During this disturbed period, the GPS-TEC compared with the IRI-2016 and the IRI-2016 (IRI-2001, IRI01-corr, and NeQuick) topside options as shown in
Figure 7. However, for the modelling of VTEC with IRI-2016 and IRI-2012 (IRI-2001, IRI01-corr, and NeQuick) topside options during the geomagnetic storm event, the VTEC data had been estimated when the IRI storm model was switched ON and OFF. It was observed that the modelled VTEC data from both IRI-2016 and IRI-2012 models were not influenced by, or reflected any effects from, the ON or OFF switching of the storm model during geomagnetic storm conditions. Consequently, the IRI-2012 (IRI-2001, IRI01-corr, and NeQuick) topside options did not show any response during the disturbed period and were not affected by the enhancement of VTEC during the geomagnetic storm in all the considered periods.
Similar results were reported over Singapore by Kumar; they studied the impact of the geomagnetic storm on 25 October 2011 using measured GPS-TEC and the IRI-2012 model NeQuick options [
50]. During the storm day, they found that the IRI-2012 model displayed a similar trend with those during the quiet days. Tariku investigated the effects of the geomagnetic storm on the measured VTEC during March 2012 over Uganda and compared the measured GPS-TEC data with the IRI-2012 model NeQuick options [
41]. It was observed that the IRI-2012 NeQuick model did not respond to the effects of the geomagnetic storm. In this study, however, the IRI-2016 (IRI-2001, IRI01-corr, and NeQuick) topside options had an insignificant response during the geomagnetic storm in 2011, 2012, and 2013. This observation is similar to the results reported by Mengistu who investigated the performance of the IRI-2016 model in the African region during the geomagnetic storm in March 2013 [
31]. They reported that the IRI-2016 had a slight response during the geomagnetic storm event. In this study, the IRI-2001 model showed a slight response during the geomagnetic storm at 02:00–20:00 LT in October 2011 as compared with a geomagnetically quiet day. In contrast, the IRI01-corr and NeQuick models showed a response at 02:00–05:00 LT and then at 11:00–17:00 LT. During the geomagnetic storm in March 2012, all topside options displayed a slight enhancement at 08:00–17:00 LT, while the geomagnetic storm in March 2013 resulted in slight enhancements shown in all of the days for all the topside options.
Figure 8 depicts the diurnal variation of the DVTEC during the disturbed periods under consideration. In general, there were no significant differences in the DVTEC values during the quiet and disturbed periods. During the low solar activity period in October 2011, the DVTEC values were observed to be high as compared to 2012 and 2013, similar to those observed during the quiet periods. The maximum DVTEC from the modelled VTEC is shown in
Table 2. The highest DVTEC was observed during 2011. Compared with the IRI-2012 model, IRI-2016 (IRI-2001, IRI01-corr, and NeQuick) showed improvement around 3 TECU. The ratio of the improvement during the disturbed period was almost similar in all 2011, 2012, and 2013 periods. Generally, the DVTEC increased during disturbed periods compared with the quiet periods.
The RMSE values of IRI-2001, IRI01-corr, and NeQuick options in both IRI-2016 and IRI-2012 models during the quiet and disturbed periods in 2011, 2012, and 2013 are shown in
Figure 9. Generally, the IRI-2016 had lesser RMSE than the IRI-2012 model during both quiet and disturbed periods. Nevertheless, the IRI-2001 option showed a slightly higher RMSE in some days during the quiet and disturbed periods than IRI-2001 (IRI-2012 model). The differences of the RMSE values in the IRI-2001 option were close to each other during quiet and disturbed periods; approximately 1 TECU. However, during the disturbed periods, the RMSE values increased compared with the quiet periods in both IRI01-corr and NeQuick options; approximately 1–5 TECU.
To investigate and evaluate the performance of the IRI-2016 and IRI-2012 (IRI-2001, IRI01-corr, and NeQuick) models, the measured and modelled VTEC during the geomagnetic storm event on 18 March 2013 was tested in UUMK, MUKH, and TGPG stations. In
Figure 10, the top panel corresponds to the diurnal variation of the measured and modelled VTEC in UUKM, MUKH, and TGPG stations, while the two bottom panels correspond to the percentage deviations (%Dev) and the DVTEC values of the corresponding models, respectively. By looking at the diurnal VTEC trend in the UUMK, MUKH, and TGPG stations, the measured GPS-TEC in UUMK was comparatively high during the early mornings and in post-noon time. Comparatively, minimum VTEC values were observed in the MUKH station. During the early morning period between 00:00 and 04:00 LT, the IRI01-corr and NeQuick values for both IRI-2016 and IRI-2012 models showed an underestimation with the GPS-TEC in the UUMK and TGPG stations. Likewise, in the MUKH station, the IRI01-corr and NeQuick models overestimate GPS-TEC. The IRI-2001 model showed a slight underestimation in UUMK and overestimation in MUKH and TGPG stations. In all stations, the IRI topside options overestimate the GPS-TEC data from 04:00 to 08:00 LT and then underestimates the GPS-TEC from 08:00 to 18:00 LT, followed by another overestimation with GPS-TEC. The maximum underestimation in all models was observed in the UUMK station.
Generally, the hourly %Dev trend during the disturbed period at the UUMK, MUKH, and TGPG stations was almost the same. Based on the %Dev in
Figure 10, it can be clearly observed that the IRI topside options displayed the highest %Dev in the morning time between 03:00 and 07:00 LT. The IRI-2001 model had higher %Dev values, followed by the IRI01-corr and NeQuick models, which showed a similar pattern to each other. The %Dev in the MUKH station was slightly lower compared to the UUMK and TGPG stations. However, the variation of the %Dev in
Figure 10 did not clearly depict the differences in the performance between the IRI-2016 and IRI-2012 topside options.
In general, by looking at the hourly variation of the modelled VTEC with the IRI models during the geomagnetic storm day at the UUMK, MUKH, and TGPG stations, the IRI-2016 (NeQuick) model displayed lower DVTEC and a better prediction capability as compared to the IRI-2012 (NeQuick) model. The IRI-2016 (IRI01-corr) had a slightly better prediction and low DVTEC as compared to the IRI-2012 (IRI01-corr) model in the UUMK station. The IRI01-corr model, however, did not show a significant difference in the IRI-2016 and IRI-2012 models in the MUKH station, while IRI-2012 (IRI01-corr) in the TGPG station showed slightly less than IRI-2016 (IRI01-corr). The maximum DVTEC was found in NeQuick, while the minimum was displayed in the IRI01-corr model. The IRI-2012 (IRI01-corr and NeQuick) model showed an obvious increase in the DVTEC values in UUMK, MUKH, and TGPG stations. Comparatively, the IRI-2016 model had a slightly better prediction as compared to IRI-2012 during the disturbed period in all considered stations.


