Article

Spatial-Temporal Characteristics of Agricultural Greenhouse Gases Emissions of the Main Stream Area of the Yellow River Basin in Gansu, China

1
College of Earth and Environmental Sciences, Lanzhou University, Lanzhou 730000, China
2
Institute of County Economic Development & Rural Revitalization Strategy, Lanzhou University, Lanzhou 730000, China
3
Tourism College, Qinghai Normal University, Xining 810000, China
4
Tourism College, Northwest Normal University, Lanzhou 730000, China
*
Author to whom correspondence should be addressed.
Atmosphere 2021, 12(10), 1296; https://doi.org/10.3390/atmos12101296
Submission received: 6 September 2021 / Revised: 23 September 2021 / Accepted: 2 October 2021 / Published: 5 October 2021
(This article belongs to the Special Issue Agricultural Greenhouse Gas Emissions)

Abstract

:
In 2021, The People’s Republic of China proposed goals for peaking carbon dioxide emissions before 2030 and carbon neutrality before 2060, in the 15 counties (districts) of the Main Stream Area of the Yellow River Basin in Gansu that plays an important role in ecological protection and green development. Next the CO2 equivalents were converted according to the IPCC2 standard, the total agricultural GHG emissions was calculated, the relationship with the agricultural output value was analyzed, and the discretization of the space was analyzed by the coefficient of variation and standard deviation. Firstly, the total agricultural GHG emissions in 15 counties (districts) of the Main Stream Area of the Yellow River Basin increased 55.54% in 2000–2019, and 2.35% annually, roughly divided into three stages: the rapid growth period (2000–2008), the slow decline period (2009–2014) and the rapid decline period (2015–2019). The economic efficiency is significantly improved, with an average annual decline of 6.49%, roughly divided into three stages: the slow-descent stage (2000–2004), the period of slow-growth stage (2005–2008) and the period of fast-decline (2009–2019). Secondly, based on the characteristics of the total GHG emissions, Maqu County has the largest GHG emissions increase, from 26.8842 kt in 2000 to 38.9603 kt, in 2019, an increase of 44.92%, while the smallest GHG emissions, in Anning District, decreased 87.33% from 111 t in 2000 to 14.1 t in 2019; In the rate of increase in the total GHG emissions, Dongxiang County had the largest rate of increase from 2000 to 2019, an increase of 160.28% and an average annual increase of 4.90%. The smallest rate of decrease in GHG emissions was seen in Chengguan District, where they decreased 92.11% from 2000 to 2019, an average annual decrease of 11.93%. The characteristics of agricultural GHG emissions intensity is a significant declining trending and agricultural production efficiency has been significantly improved. Finally, to provide a basis for the formulation of differentiated agricultural energy conservation and emissions reduction policies, reduce agricultural GHG emissions intensity and reduce the use efficiency of resources by formulating differentiated emission targets, tasks and incentive measures.

1. Introduction

Agricultural production is the world’s second-largest greenhouse gas (collectively referred to in this article simply as GHG) emissions source [1]. In 2021, The People’s Republic of China proposed the goals for peaking carbon dioxide emissions before 2030 and carbon neutrality before 2060. China is a traditional agricultural country, still in the stage of extensive development. The GHG produced by agricultural activities account for 17% of the total GHG [2], Agricultural GHG have always been a difficult problem for agricultural development and a hot topic of research.
Currently, agricultural GHG are studied in the United States [3], China [4], the European Union [5], Spain [6], Germany [7] and so on from different perspectives. For example, CH4, N2O, CO2 production rates from six forest and agricultural soil types in the Koteshwar hydropower reservoir catchments located in the Uttarakhand region of India, were estimated and their relations with physico-chemical characteristics of soils were examined [8], mainly focused on the influencing factors [9], spatial emissions characteristics [10], emissions measurement [11], carbon trading [12], and emissions reduction countermeasures [13]. The temporal and spatial characteristics of agricultural carbon emissions across regions are also constantly explored, such as The Yangtze River Economic Belt [14] or the factors of China using the Kaya identity and LMDI index decomposition method [15], Also research on emission estimation for China’s Fujian Province [16], and the characteristics of agricultural source GHG emissions in Anhui Province [17], Empirical study on the influence factors of carbon emissions transaction price [18] and research on carbon emissions from the planting industry [19] in Hubei Province, GHG emissions and SOC stocks of the crop-farm animal production system in Heilongjiang Land Reclamation Area [20], comprehensive evaluation of ecological environment on the anniversary of wheat-corn double-cooked farmland in Henan Province [21], study on the potential estimation of GHG emissions reduction in the “breeding-biogas” ecological model in Shanxi Province [22], research on agricultural GHG emissions reduction in Xinjiang Uygur Autonomous Region and Sichuan Province [23]. However, these studies on the spatial and temporal characteristics, efficiency evaluation, drivers and other aspects of agricultural carbon emissions at the provincial and regional levels, the temporal and spatial characteristics of the total agricultural carbon emissions and the carbon emission intensity of 62 counties in Jiangsu Province [24], and the agricultural GHG emissions in Chongming County [25]. At present, agricultural carbon emissions are mainly studied from a relatively macro perspective, and there are relatively few studies on county-level agricultural carbon emissions.
The Yellow River basin is China’s most important river basin, which has an important role in the country’s agricultural production. In this work we calculate the Yellow River basin of Gansu agricultural carbon emissions, especially in the upstream region how determine to handle the problem of sustainable agricultural development which has become a key problem, to ensure the sustainable development of agriculture, realize the upper Yellow River agricultural efficiency and provide a win-win ecological case.

2. The Study Area and the Data Resources

This paper studied 15 counties in four cities within the Main Stream Area of the Yellow River Basin in Gansu, including Maqu County, Gannan Tibetan Autonomous Prefecture; Linxia County, Yongjing County, Dongxiang County, Jishishan County, Linxia Hui Autonomous Prefecture; Gaolan County, Yuzhong County, Chengguan District, Qilihe District, Xigu District, Anning District, Lanzhou City; Jingtai County, Pingchuan District, Baiyin District, Jingyuan County and Baiyin City (see Figure 1). As of 2019, the land area was 36,149.36 km2, the permanent resident population is 542,530, the total value of GDP in 2019 was 32,703.27 million U.S. dollars (see Table 1).
The population and GDP data of this article are from the Compilation of the second national agricultural census data in Gansu Province, Compilation of the third national agricultural census data in Gansu Province and the Gansu Development Yearbook (2001–2020).

3. Materials and Methods

3.1. Emission Quantity and Intensity Measurement Method

This paper refers to the calculation and research results of Zhang et al. [26], Chen et al. [24], Shang et al. [27], Li et al. [28], Kang et al. [25] and West [29]. Kumar et al. [30] in particular reviewed GHG measurements from Chinese freshwater bodies and the GHG emissions calculation methods and factors of emissions in the 2011 Provincial GHG List Preparation Guide (Trial) and calculated the agricultural GHG emissions in the 15 counties (districts), mainly including the CO2, CH4, N2O:
(1) The calculation of agricultural GHG CO2 is primarily the CO2 emissions from fertilizer use, agricultural machinery and electricity during agricultural production in the region:
CO 2 = ( F × k 1 + Area × k 2 + Machine × k 3 + Electric × k 4 ) × 44 / 12000
where CO2 is the total GHG emissions of agricultural CO 2, F is chemical fertilizer use, Area is agricultural planting area, Machine is the total agricultural machinery power, Electric is agricultural production electricity consumption, formula is k1 = 857.54, k2 = 16.47, k3 = 0.18, k4 = 0.18.
(2) Agricultural GHG CH4, which mainly includes emissions of CH4 from paddy fields and CH4 from storage animals:
CH 4 paddy   fields = EF paddy   fields × Area paddy   fields
CH 4 animals = i n T i × α 1 + i n T i × β 1
where   CH 4 paddy   fields is the CH4 emissions of rice field, which is mainly single-season rice in northwest China, while EF paddy   fields is 231.2 kg/hm2, Area paddy   fields is the annual rice planting area. CH 4 animals is the CH4 emissions of animals, and α 1 , β 1 is the CH4 emissions coefficient of animal gut and fecal fermentation respectively. The coefficient of GHG emissions is mainly calculated according to the correlation coefficient of the provincial level.
(3) Agricultural GHG N2O emissions are primarily N2O emissions managed by storage animals in the area and N2O emissions from agricultural cultivation:
N 2 0 animals = i n T i × γ i
N 2 0 agricultural   cultivation = i n T i × S i × δ i
N2Oanimals animals are the animal N2O emissions coefficient, T i is the feeding amount of class i, and γ i is the N2O coefficient of fecal fermentation of class i. Due to the difficulty of nitrogen application and the large area of fertilizer use, this paper calculates the N2O calculation excluding farmland soil.
N2Oagricultural cultivation is the N2O emissions of farmland cultivation, T i is the yield of Class i agriculture, S i is the straw coefficient of Class i agricultural crops, Straw conversion coefficient was determined according to the United Nations Food and Agricultural Organization (FAO); assuming that all straw is returned to the field through agricultural production and livestock breeding.
(4) G is the total CO2 emissions of CO2, mainly the total overall regional carbon emissions:
G = i n CO 2 ( i ) + 25 × i n CH 4 ( i ) + 298 × i n N 2 O ( i )
According to the IPCC’s National GHG Inventory Guide 2006, a global warming submersible meter radiation forces a ton of GHG on a ton of carbon dioxide for some time. Therefore, were all used, 1 t CH4 = 25 t CO2, 1 t N2O = 298 t CO2.
Based on the basis of relevant research results, in order to further measure the relationship between agricultural GHG emissions and agricultural economic development in the main stream region of the Yellow River Basin and 15 counties, the relationship between the emissions and the agricultural economic level is measured by the way of GHG emissions intensity. Agricultural GHG emissions intensity was calculated as:
C I = G / A
where G is the agricultural GHG emissions (10,000 t); A is the total agricultural output value (10,000 yuan).

3.2. Standard Deviation and Coefficient of Variation

To illustrate the differences seen in the counties of agricultural GHG emissions in 15 counties of the Main Stream region of the Yellow River Basin, the standard deviation (S) and coefficient of variation (V) usually measure relative and absolute differences, with larger values indicating greater difference:
S = i = 1 n ( G i G ¯ ) 2 / n
V = S / G ¯
where G i is the emissions (or emissions intensity) of the i county/district unit in the main stream of the Yellow River Basin; n is the number of county units; and G ¯ is the average of discharge of n county units.

3.3. Spatial Variability Analysis

The Moran’ I statistic is a very widely used spatial autocorrelation statistic, in its specific form as follows:
I = n S 0 i n j = 1 n w i j ( x i x ¯ ) ( x j x ¯ ) i n ( x i x ¯ ) 2
where, xi represents the observant i at the i-th spatial position, x ¯ = 1 n i = 1 n x i , wij is the element of the spatial weight matrix W (n × n) representing the topological relationship between spatial units and S0 is the sum of all elements of the spatial weight matrix W. Reflecting is the degree of similarity of emissions regional cell attribute values in spatial or spatial proximity. This article mainly uses the global Moran ‘I and spatial distribution characteristics of total agricultural GHG emissions and GHG emissions intensity in the main stream of 15 counties in the Main Stream of the Yellow River Basin in the Gansu section.

4. Result

4.1. Analysis of Total Agricultural GHG Emissions

4.1.1. The Analysis of Time Series

The total amount of agricultural GHG emissions in 15 areas of the main stream of the Yellow River Basin increased significantly, from 62.57730 kt to 97.3355 kt in 2019, an 55.54% during the study period, and 2.35% annually, which can be roughly divided into three stages (Figure 2):
(1)
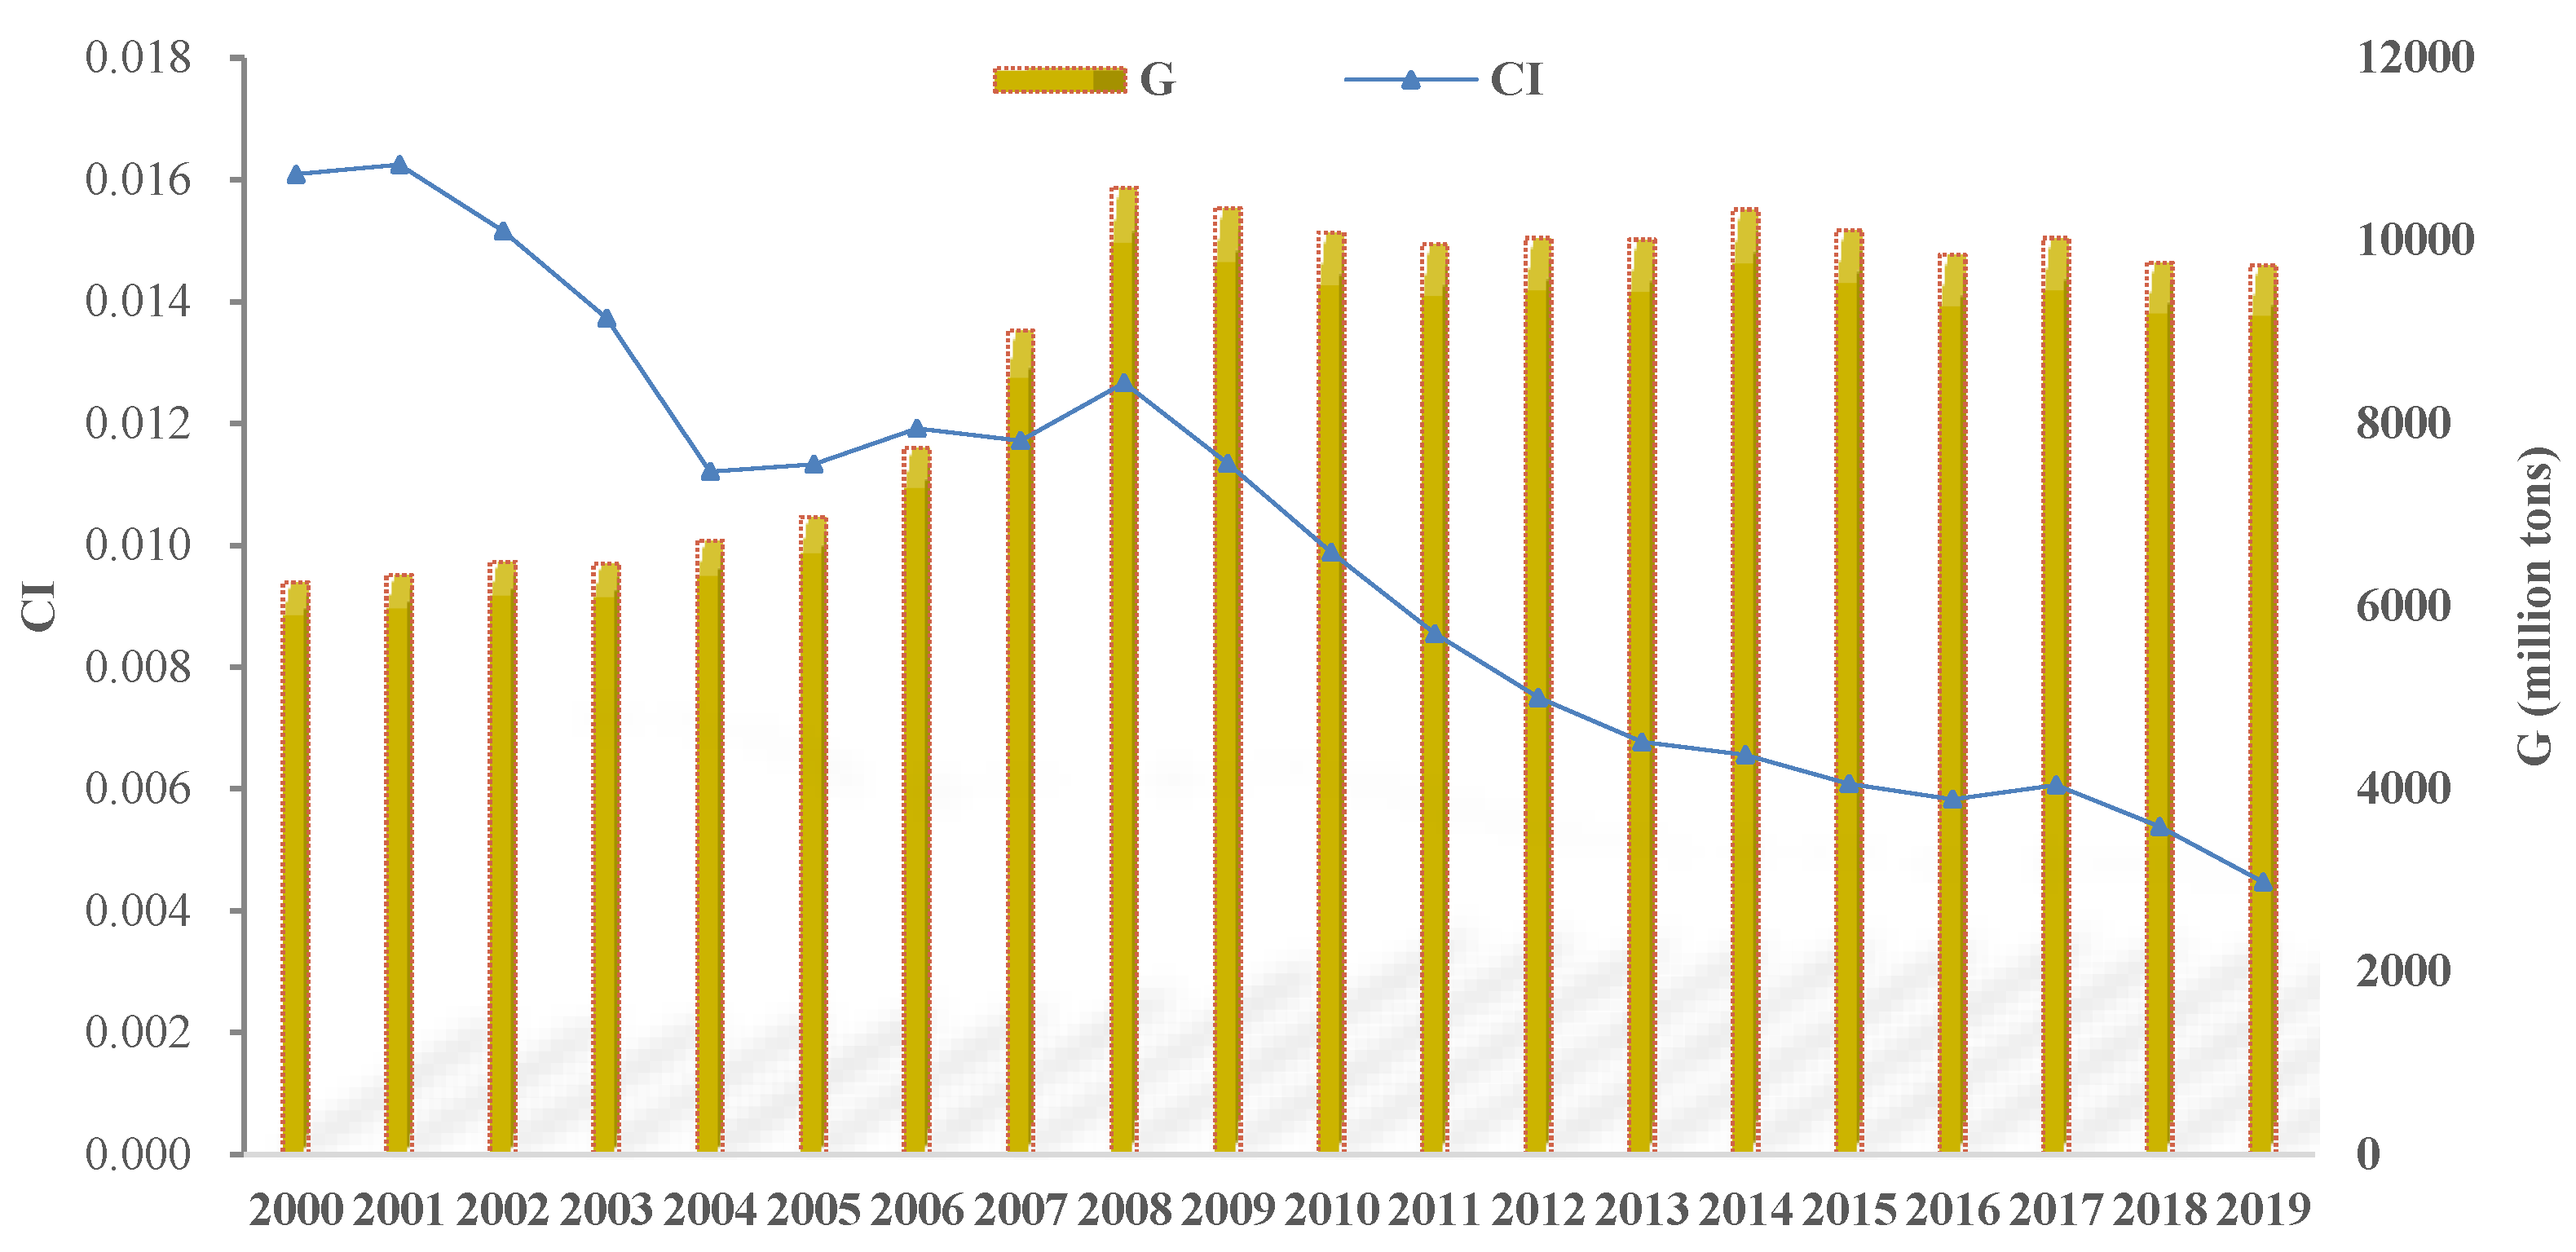
During the period of fast-growth (2000–2008), agricultural GHG emissions increased from 62.577 kt to 105.795 kt, and GHG emissions reached the highest value in the study phase.
(2)
During the period of slow-decline (2009–2014), a downward trend appeared, and overall, GHG emissions fell 1.55% from 103.5624 kt to 103.4023 kt.
(3)
During the period of fast-decline (2015–2019), agricultural GHG emissions decreased by 3.76% from 101.1393 kt to 97.3355 kt, with an average annual decline of 1.88%.
Due to the continuous growth of agricultural output value over the years, from the added value of 3.8898 billion yuan (0.60223 billion U.S. dollar) in 2000, 21.7689 billion yuan (3.37038 billion U.S. dollar) in 2019, the agricultural GHG emissions intensity shows an inter significant downward trend in the 15 counties in the Main Stream area of the Yellow River Basin. With an average annual decline of 6.49%, indicating that its economic efficiency is significantly improved. It can mainly be divided into the following three stages (Figure 2):
(1)
During the period of slow-descent stage (2000–2004), agricultural GHG emissions intensity from 0.016 to 0.011, down by 31.25% in this period, with an average annual decline of 9%. It shows that the agricultural production efficiency shows a higher growth trend.
(2)
During the period of slow-growth slow decline (2005–2008), agricultural GHG emissions intensity from 0.011 to 0.013, down for 18.02 percent in this period, with an average annual increase of 5.72%. Agricultural production efficiency declined in this stage.
(3)
During the period of fast-decline (2009–2019), agricultural GHG emissions intensity from 0.011 to 0.004, down by 63.64% in this period, with an average annual decline of 9.62%.

4.1.2. Different Types of Agricultural GHG Analysis

The total emissions in different types of agricultural GHG gas analysis, it’s mainly presents the following characteristics:
(1)
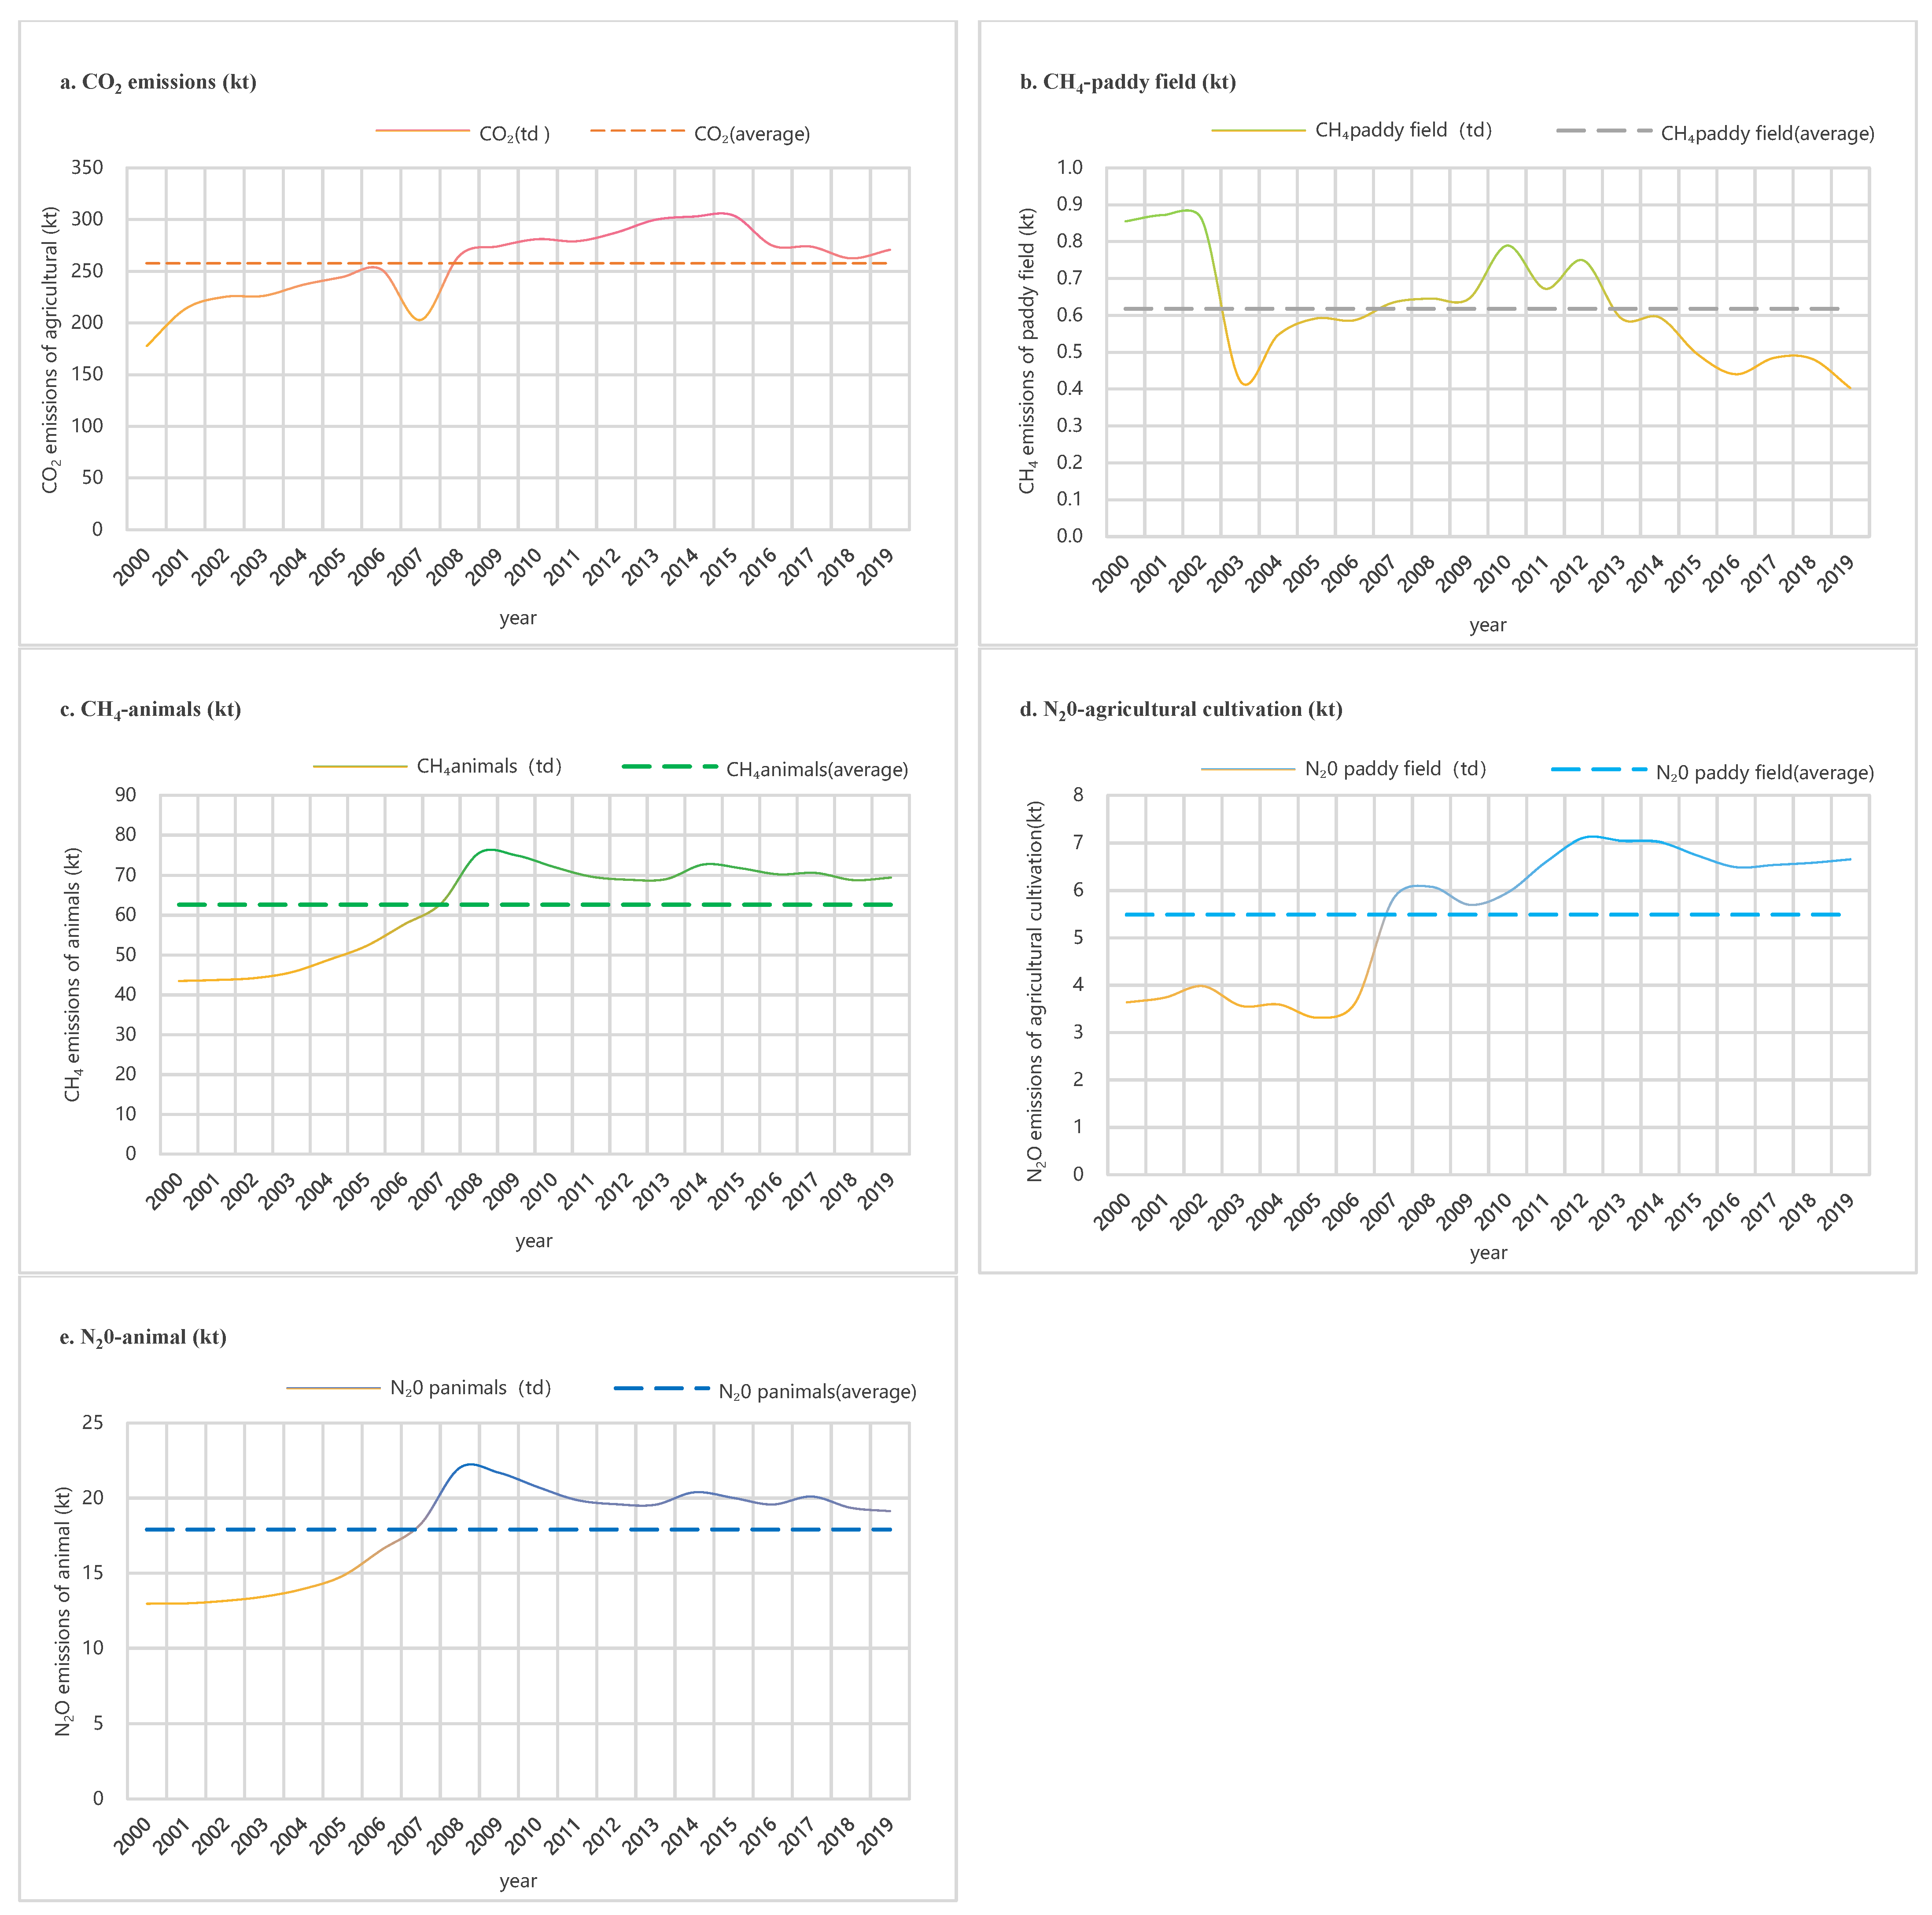
Agricultural emissions of CO2 are the largest in agricultural GHG, increasing from 177.57 kt in 2000 to 270.83 kt in 2019, an increase of 52.52 percent, an average annual increase of 2.25%, the trend shows a smaller increase.
(2)
Emissions of CO2/CH4 in paddy fields (agricultural cultivation) are the smallest in agricultural GHG, from 0.86 kt in 2000 to 0.40 kt in 2019, a drop of 53.49 percent, and an average annual decline of 3.95%, so the trend shows a smaller decline. The emission of N2O in agricultural cultivation is also relatively smaller among agricultural greenhouse gases, increasing from 3.64 kt in 2000 to 6.66 kt in 2019, increase for 82.97%, an average annual increase of 5.28%, so the trend shows a smaller increase.
(3)
Emissions of CO2/CH4 in livestock: the emissions of CH4 and N2O maintain a basically consistent change trend, but the average annual growth rate of the emissions of CH4 is higher than that of N2O. The emissions of CH4 increased from 43.49 kt in 2000 to 68.82 kt in 2019, increase for 58.24 percent, an average annual increase of 5.28%, the trend shows a smaller increase. The emissions of N2O increased from 12.97 kt in 2000 to 19.14 kt in 2019, increase for 47.57 percent, an average annual increase of 2.07%, the trend shows a smaller increase.

4.1.3. Spatial Sequence Analysis

From the changes of the Moran index and Z(I) of the total agricultural GHG emissions from 2000 to 2019, the overall fluctuation trend can be shown, and the change trends are basically consistent and relatively stable. The Moran index remains between 0.077 and 0.112, showing a positive correlation; the mean Z value is about 1.909, both positive and significant, indicating a positive spatial self-correlation of the total carbon emissions in the Main Stream part of the Yellow River Basin(see Figure 3). Except for Maqu County, the total carbon emissions in the remaining 15 counties tend to spatial agglomeration.
From the changes of the global Moran index and Z (I) of total agricultural GHG emissions intensity from 2000 to 2019, the overall fluctuation trend is shown, and the change trends are basically consistent and relatively stable. The Moran index remains between 1.739 and 2.837, showing positive correlation; the mean Z value is about 2.686, which is positive and significant, indicating a positive spatial autocorrelation in the main stream of the Yellow River Basin(see Figure 4). Except for Maqu County, the other 15 counties tend to gather in space.

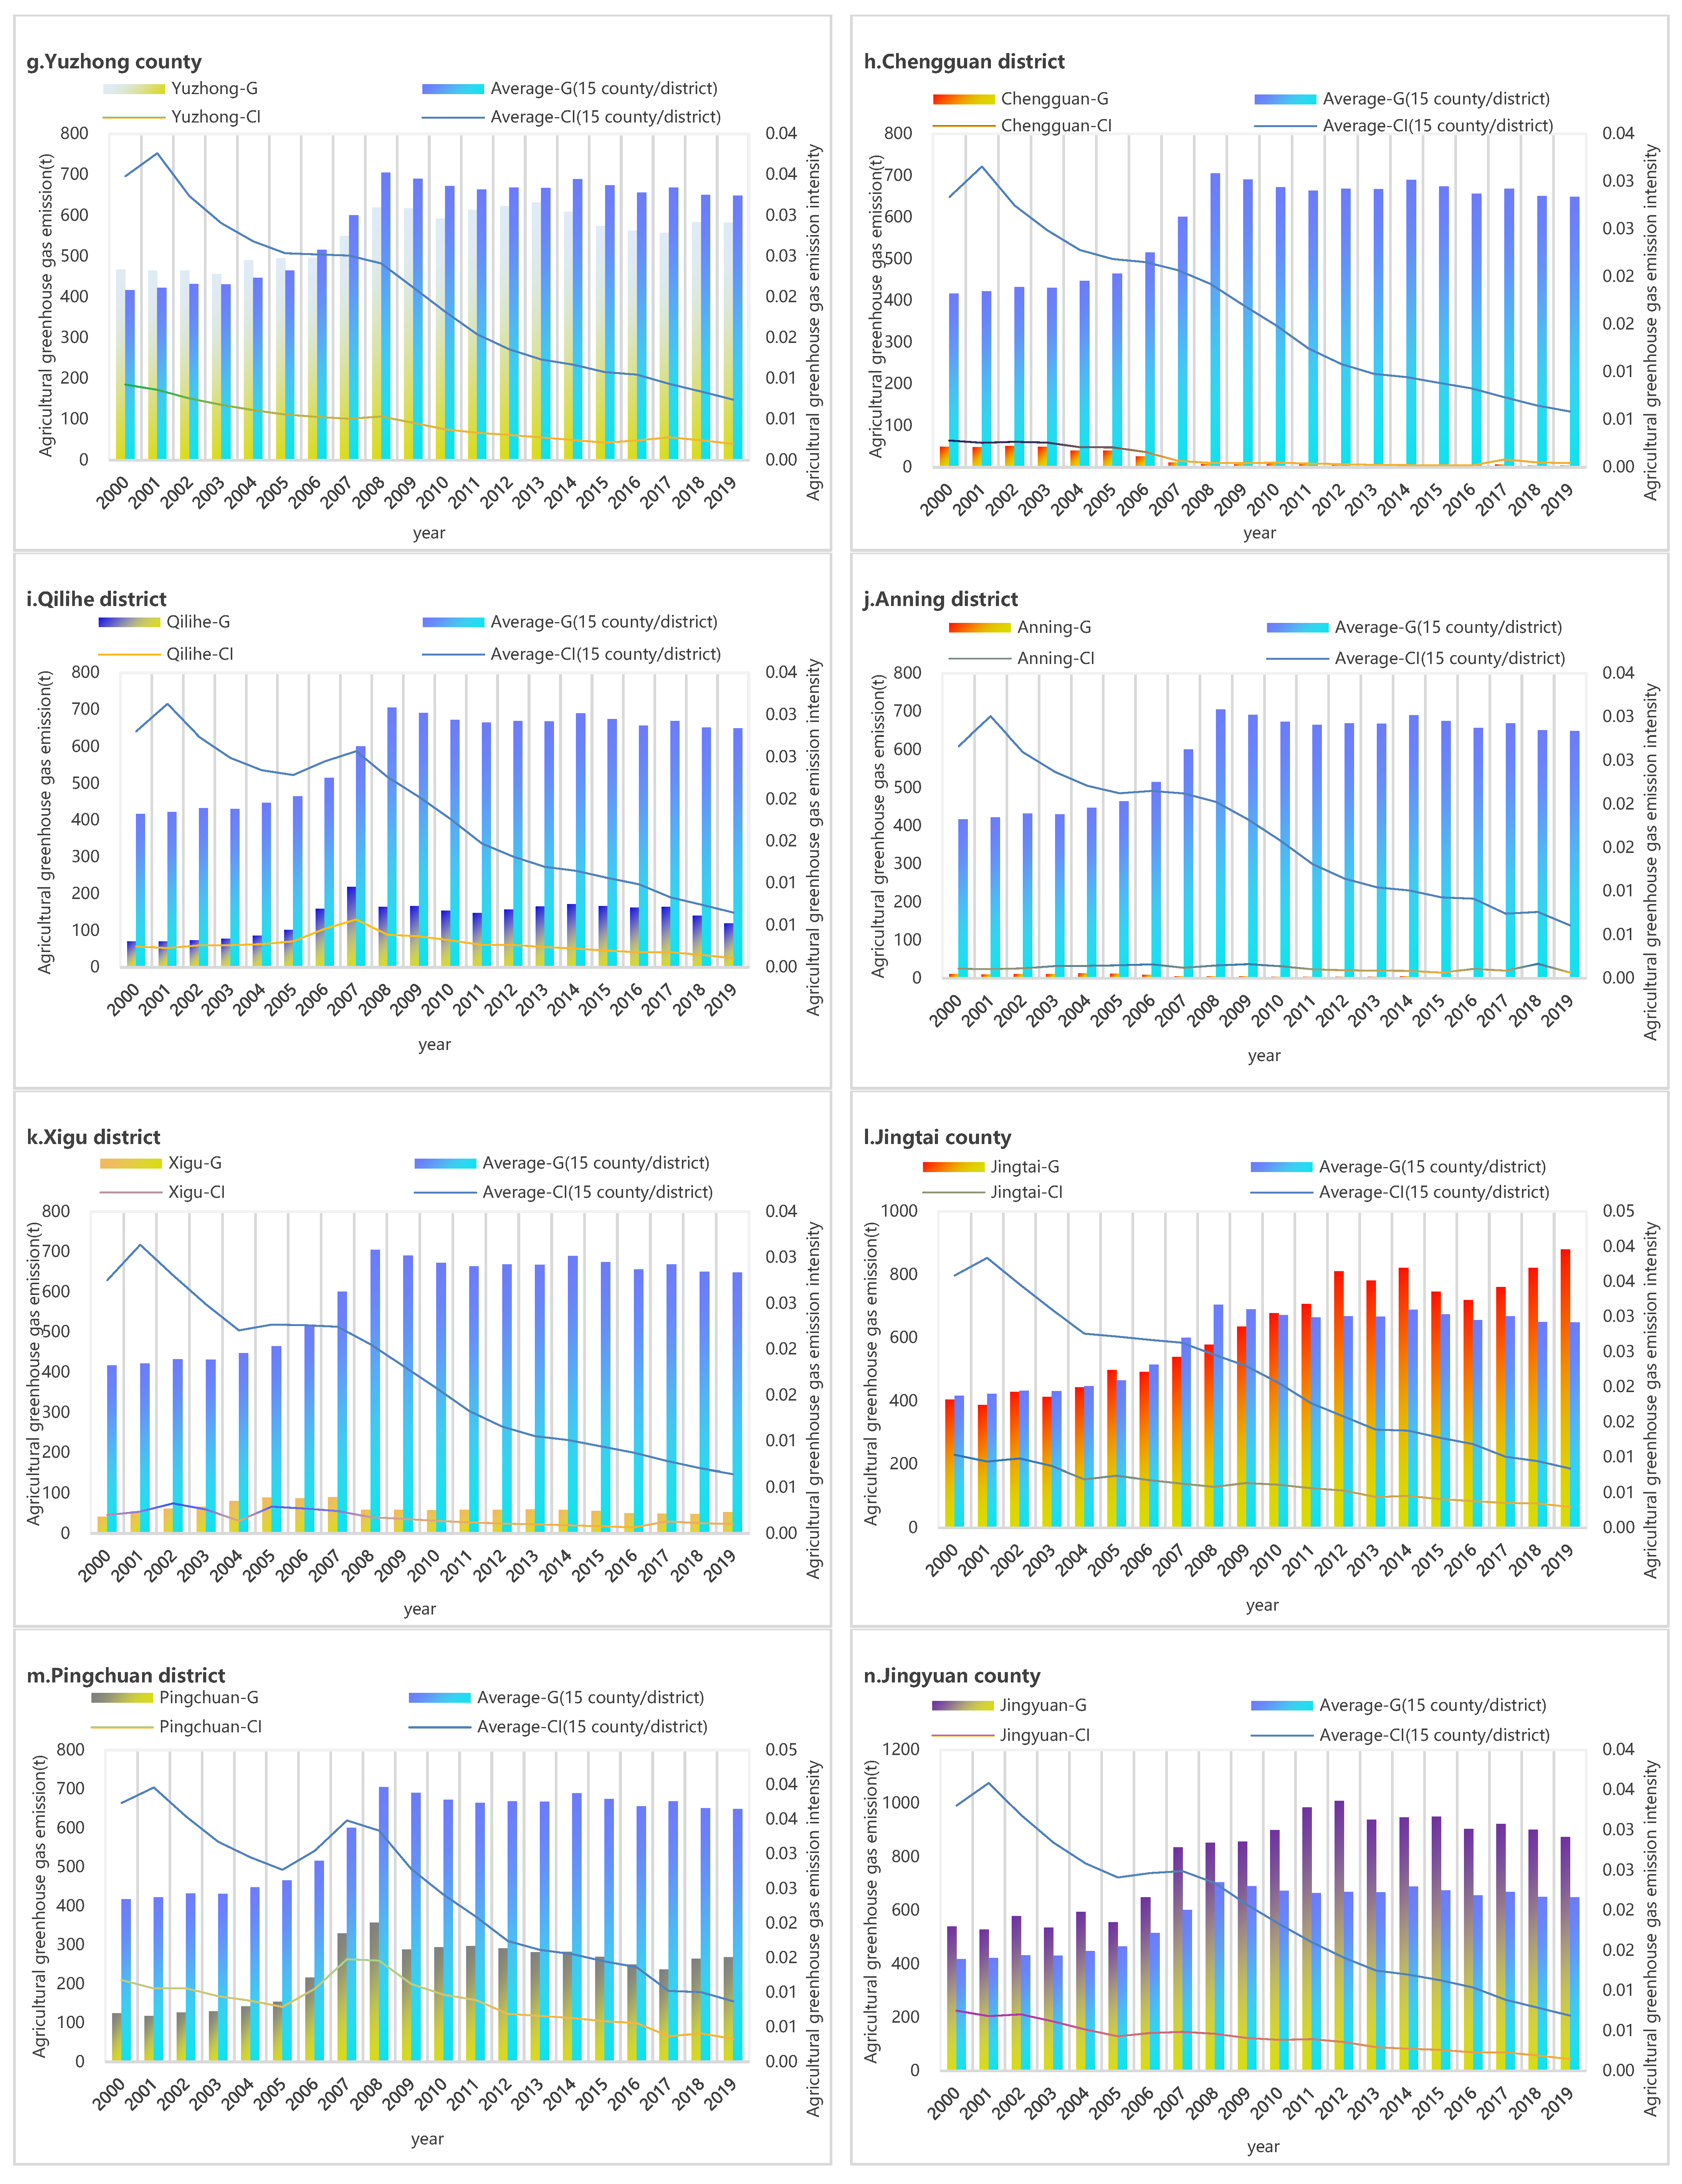
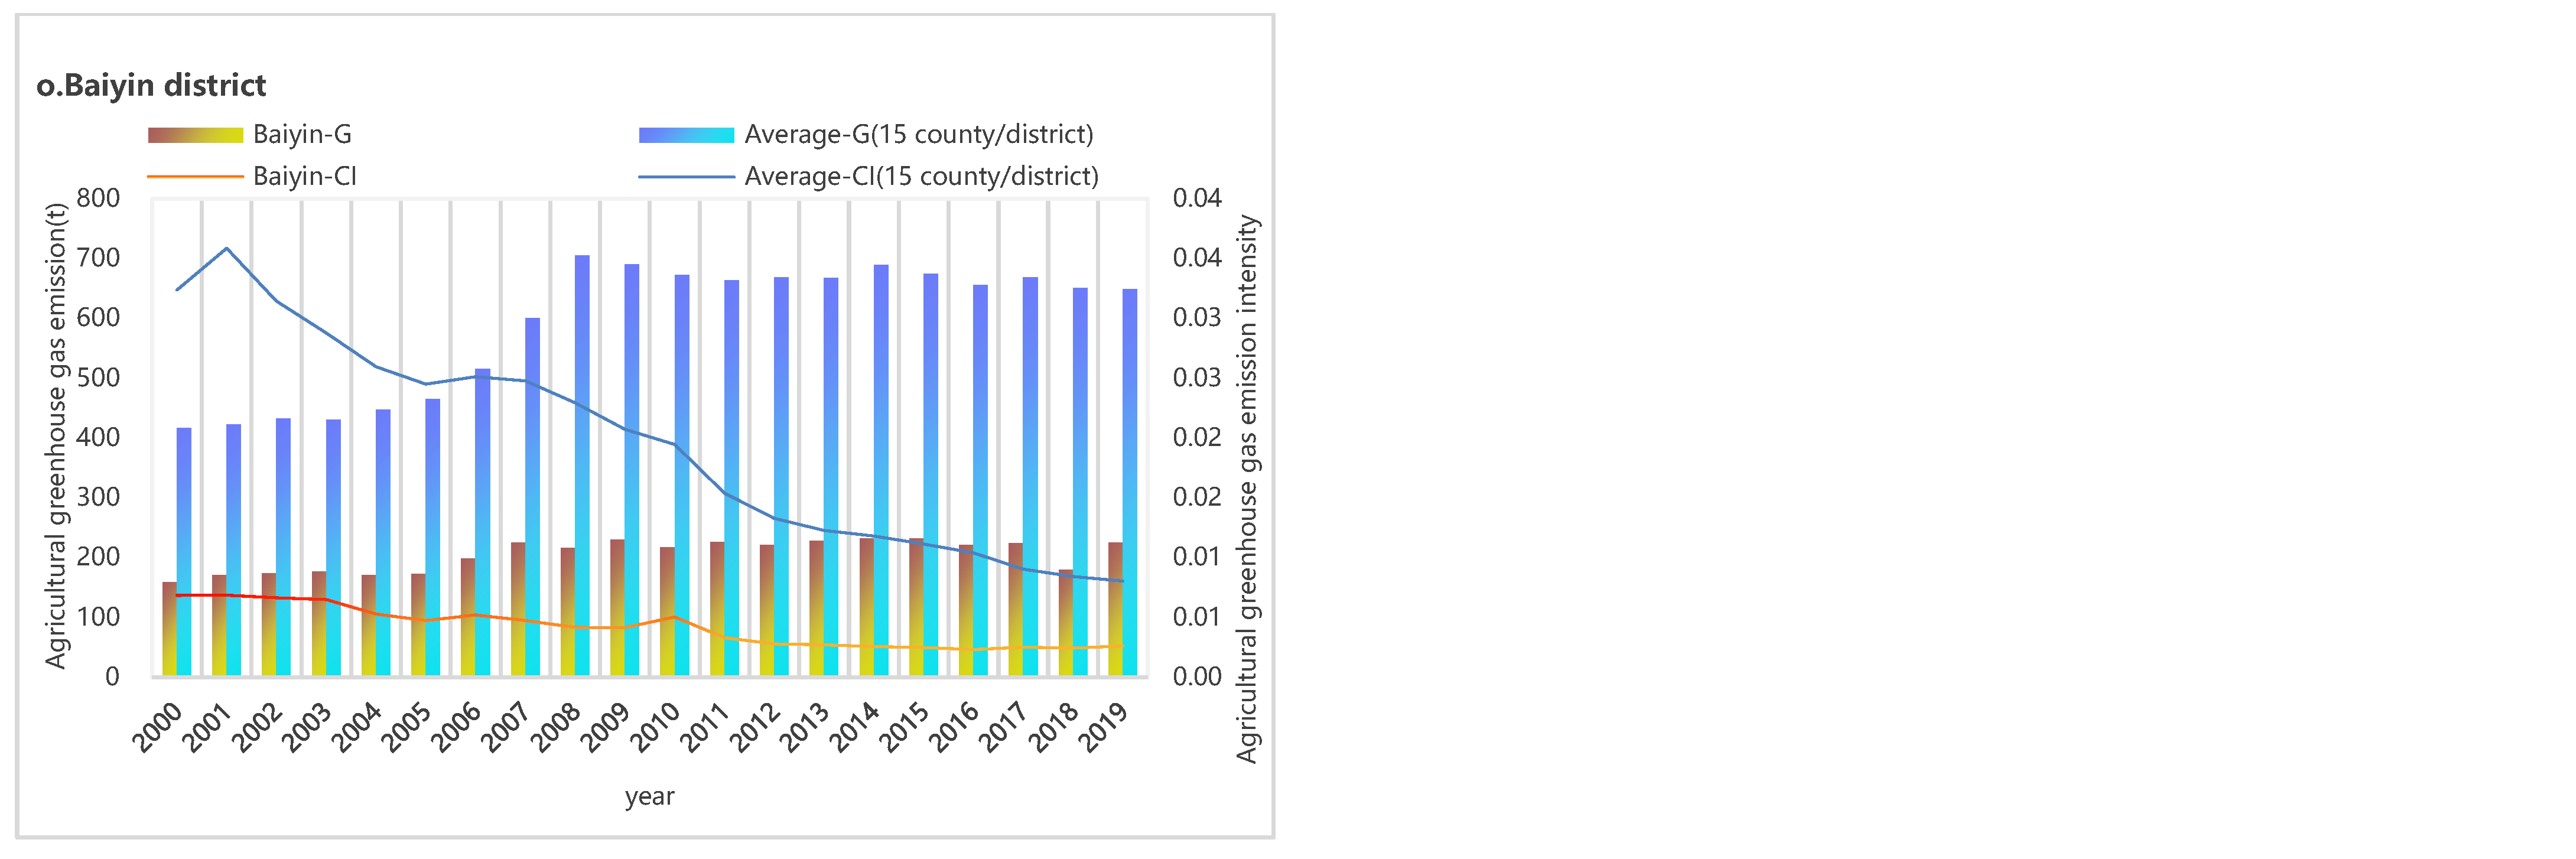
4.2. The Spatial Characteristics of Carbon Emissions in Counties and Districts

4.2.1. Analysis of Total GHG Emissions

From the characteristics of the total GHG emissions in the Main Stream part of the Gansu section of the Yellow River Basin, Maqu County had the largest total carbon emissions, Anning District was the smallest in the total carbon emissions, Dongxiang County had the largest increase in the total GHG emissions, and Chengguan District decreased the most in the total GHG emissions. Details are shown below:
In the total GHG emissions, Maqu County has the largest GHG emissions increase, from 26.8842 kt in 2000 to 38.9603 kt, in 2019, an increased by 44.92%, and an average annual increase of 1.87%, far below the average growth rate of 15 counties/districts (55.54%), and a growth rate of 2.23% in 15 counties/districts. The smallest GHG emissions in Anning District decreased 87.33% from 111 t in 2000 to 14.1 t in 2019, and an average annual decrease of 9.81%, far below the average growth rate of 15 counties/districts, and a growth rate of 2.23% in 15 counties/districts.
In rate of increase in the total GHG emissions, Dongxiang County has the largest rate of increase in GHG emissions from 3.4106 kt in 2000 to 8.8771 kt, in 2019, increased by 160.28%, and an average annual increase of 4.90%, far over the average growth rate of 15 counties/districts, and a growth rate of 2.23% in 15 counties/districts. The smallest rate of decrease in GHG emissions in Chengguan District decreased 92.11% from 0.4893 kt in 2000 to 0.0390 kt in 2019, and an average annual decrease of 11.93%, far below the average growth rate of 15 counties/districts, and a growth rate of 2.23% in 15 counties/districts.
The total amount of increase in GHG emissions in Jingtai County, Pingchuan District, Yongjing County, Qilihe District, Jingyuan County, Linxia County, Baiyin District, Xigu District, Yuzhong County and Jishishan County was relatively large, from 4.0421 kt, 1.2474 kt, 1.8118 kt, 0.7055 kt, 5.3965 kt, 6.1740 kt, 1.5864 kt, 0.4124 kt, 4.6828 kt, 4.0714 kt, in 2000 to 8.7928 kt, 2.6818 kt, 3.7405 kt, 1.1951 kt, 8.7408 kt, 9.9183 kt, 2.2493 kt, 0.5295 kt, 5.8299 kt, 4.2235 kt in 2019, respectively, representing increases by 117.53%, 114.99%, 106.45%, 69.41%, 61.97%, 60.64%, 41.78%, 28.40%, 24.50%, 3.74% and an average annual decrease of 3.96%, 3.90%, 3.69%, 2.67%, 2.44%, 2.40%, 1.76%, 1.26%, 1.10%, 0.18%. The increase was relatively small in Baiyin District, Xigu District, Yuzhong District, and Jishishan County. However, the agricultural GHG emissions in Gaolan County were the smallest, from 1.5467 kt in 2000 to 1.5434 kt, a decrease by 0.22%, with an annual decline of 0.01%. (Table 2 and Figure 5).

4.2.2. Analysis of GHG Emissions Intensity

The characteristics of agricultural GHG emissions intensity in the Main Stream of the Yellow River Basin in Gansu section is a significant decline trending, agricultural production efficiency has been significantly improved. Maqu County was the largest in the agricultural GHG emissions intensity, Anning District was the smallest in the agricultural GHG emissions intensity, Chengguan District had the largest decrease in the agricultural GHG emissions intensity, and Anning District decreased the least in the agricultural GHG emissions intensity. See below for details:
In the agricultural GHG emissions intensity, Maqu County has the largest agricultural GHG emissions intensity decrease, from 0.2391 in 2000 to 0.0403 in 2019, a decreased by 83.15%, and an average annual decrease of 8.52%. The smallest agricultural GHG emissions intensity in Chengguan District decreased 84.25% from 2.8 in 2000 to 0.4 in 2019, and an average annual decrease of 8.83%. The corresponding agricultural production efficiency was the highest among the 15 counties/districts. Similarly, in the rate of increase in the agricultural GHG emissions intensity, the largest growth rate of agricultural GHG emissions intensity is seen in Chengguan District, while the least growth rate of agricultural GHG emissions intensity occurred in Anning District, where it decreased by 40.40%, with an average annual decrease of 2.55%.
Additionally, the agricultural GHG emissions intensity decrease in Jingyuan County, Jishishan County, Yuzhong County, Gaolan County, Linxia County, Pingchuan District, Jingtai County, Dongxiang County, Baiyin District, Qilihe District, Yongjing County and Xigu District was relatively large, from 0.0075, 0.0299, 0.0093, 0.0049, 0.0237, 0.0118, 0.0103, 0.0219, 0.0068, 0.0025, 0.0094, 0.0020, in 2000 to 0.0015, 0.0064, 0.0020, 0.0012, 0.0063, 0.0033, 0.0030, 0.0067, 0.0026, 0.0011, 0.0048, 0.0010, in 2019, respectively, representing decreases by 80.51%, 78.59%, 78.36%, 74.91%, 73.22%, 71.90%, 71.36%, 69.59%, 61.61%, 56.03%, 48.66%, 47.85%, and an average annual decrease of 7.85%, 7.42%, 7.37%, 6.68%, 6.37%, 6.15%, 6.05%, 5.78%, 4.67%, 4.03%, 3.28%, 3.20%. The increase was relatively small in Baiyin District, Xigu District, Yuzhong District, and Jishishan County, but the agricultural GHG emissions in Gaolan County were the smallest, from 1.5467 thousand tons in 2000 to 1.5434 thousand tons, a decrease by 0.22%, with an annual decline of 0.01%. (Table 3 and Figure 5).
Further analysis of the growth rate finds that the agricultural production efficiency has improved significantly, and total GHG emissions have been greatly improved. From the growth rate of total agricultural GHG in the Main Stream area of the Yellow River Basin in the Gansu section from 2000 to 2019, the growth rate is above the average rate in Linxia County, Yongjing County, Dongxiang County, Qilihe District, Jingtai County, Pingchuan District and Jingyuan County. These counties (districts) averaged a 98.75% increase, while other counties (districts) are below the average growth rate of 55.54%. From the growth rate of the agricultural GHG emissions intensity in the Main Stream region of the Yellow River Basin in the Gansu section from 2000 to 2019, the growth rate is above the average rate in Yongjing County, Dongxiang County, Qilihe District, Anning District, Xigu District, Jingtai County, Pingchuan District, Baiyin District. These counties (districts) averaged a −58.43% increase, Other counties (districts) are below the average growth rate of −72.71% (Figure 6).

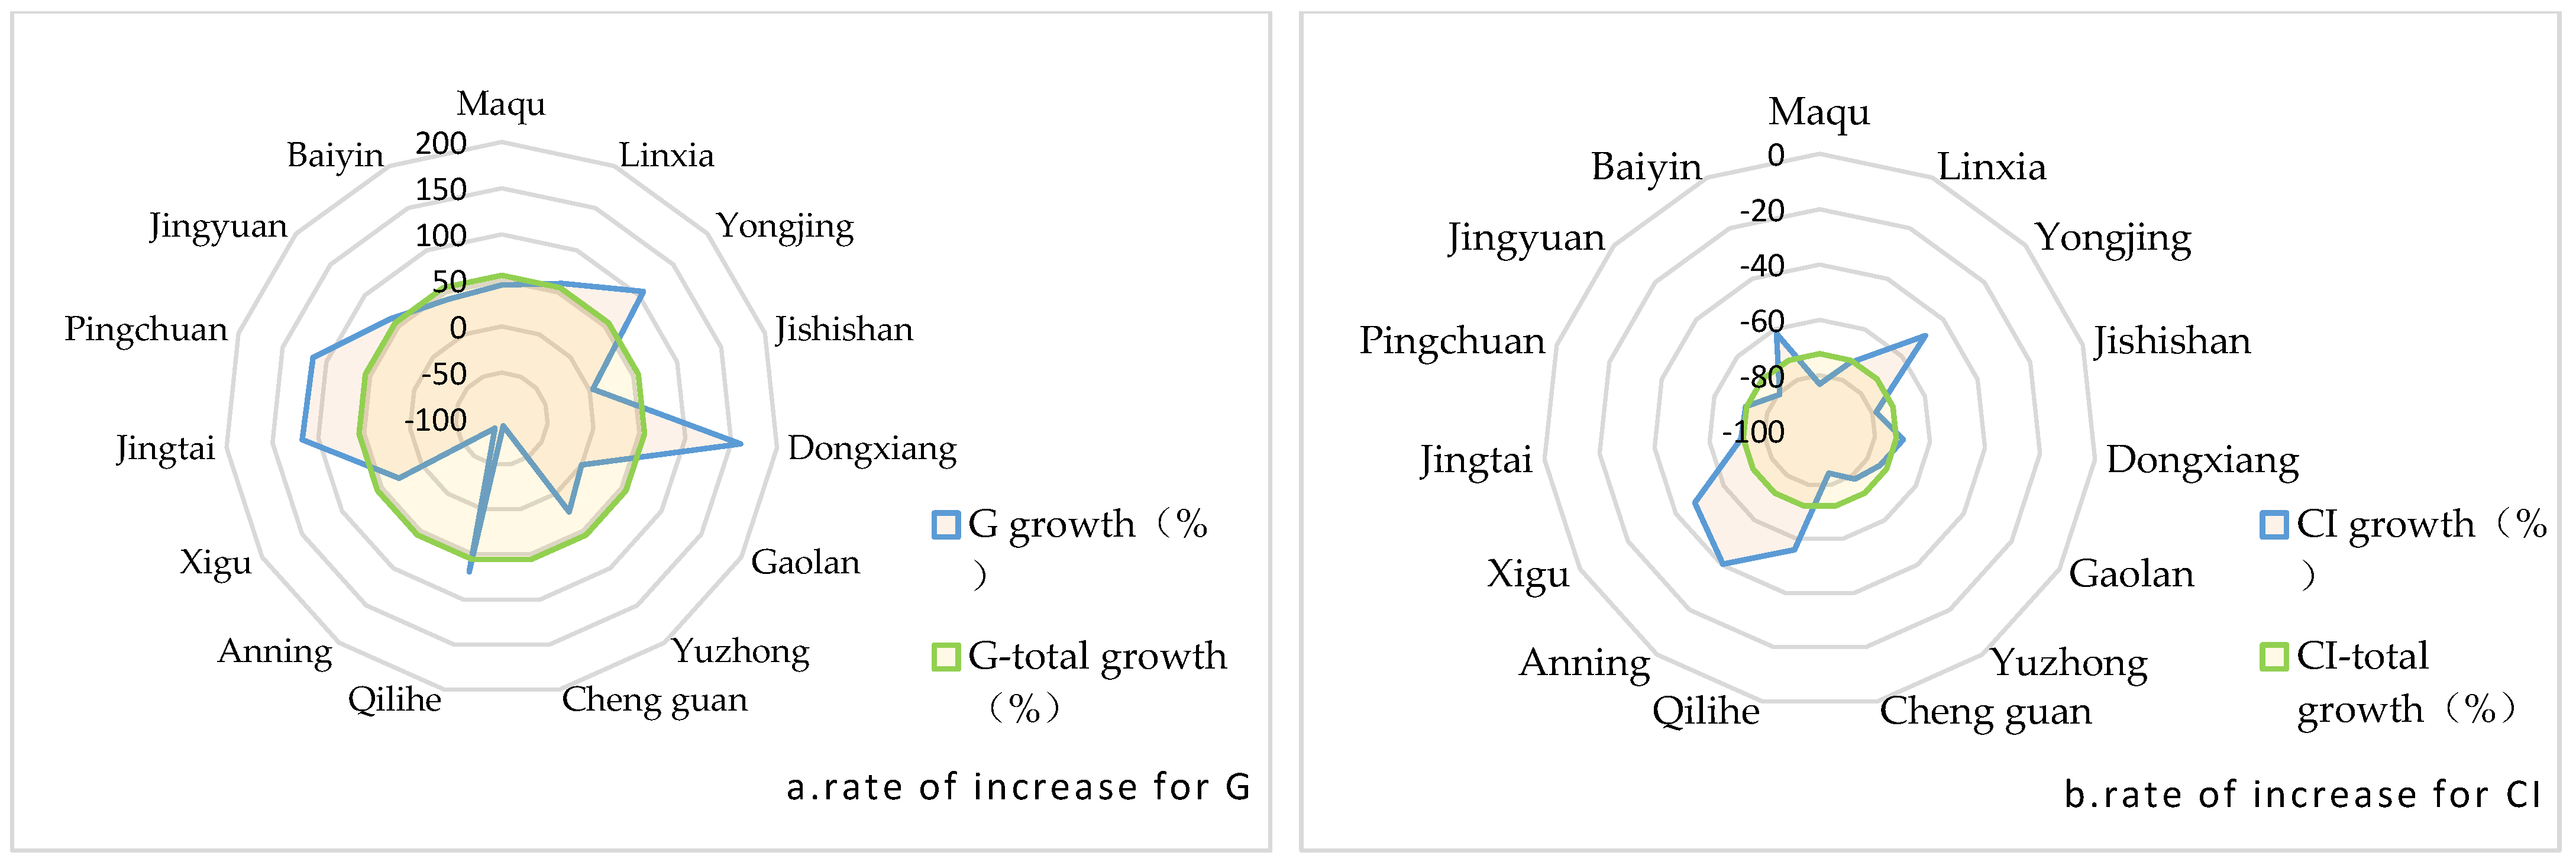
4.2.3. Spatial Difference Analysis of Total GHG Emissions and GHG Emissions Intensity

The relative gap in total GHG emissions gradually widened, while the absolute gap gradually narrowed and basically stable. From 2000 to 2019, the emission standard deviation between county units increased from 657.97 to 963.38, up 46.42% and an annual increase of 3.89%; the coefficient of variation (absolute) decreased from 1.58 to 1.48 with an annual increase of 1.70%. It can be divided into five stages (Figure 7):
(1)
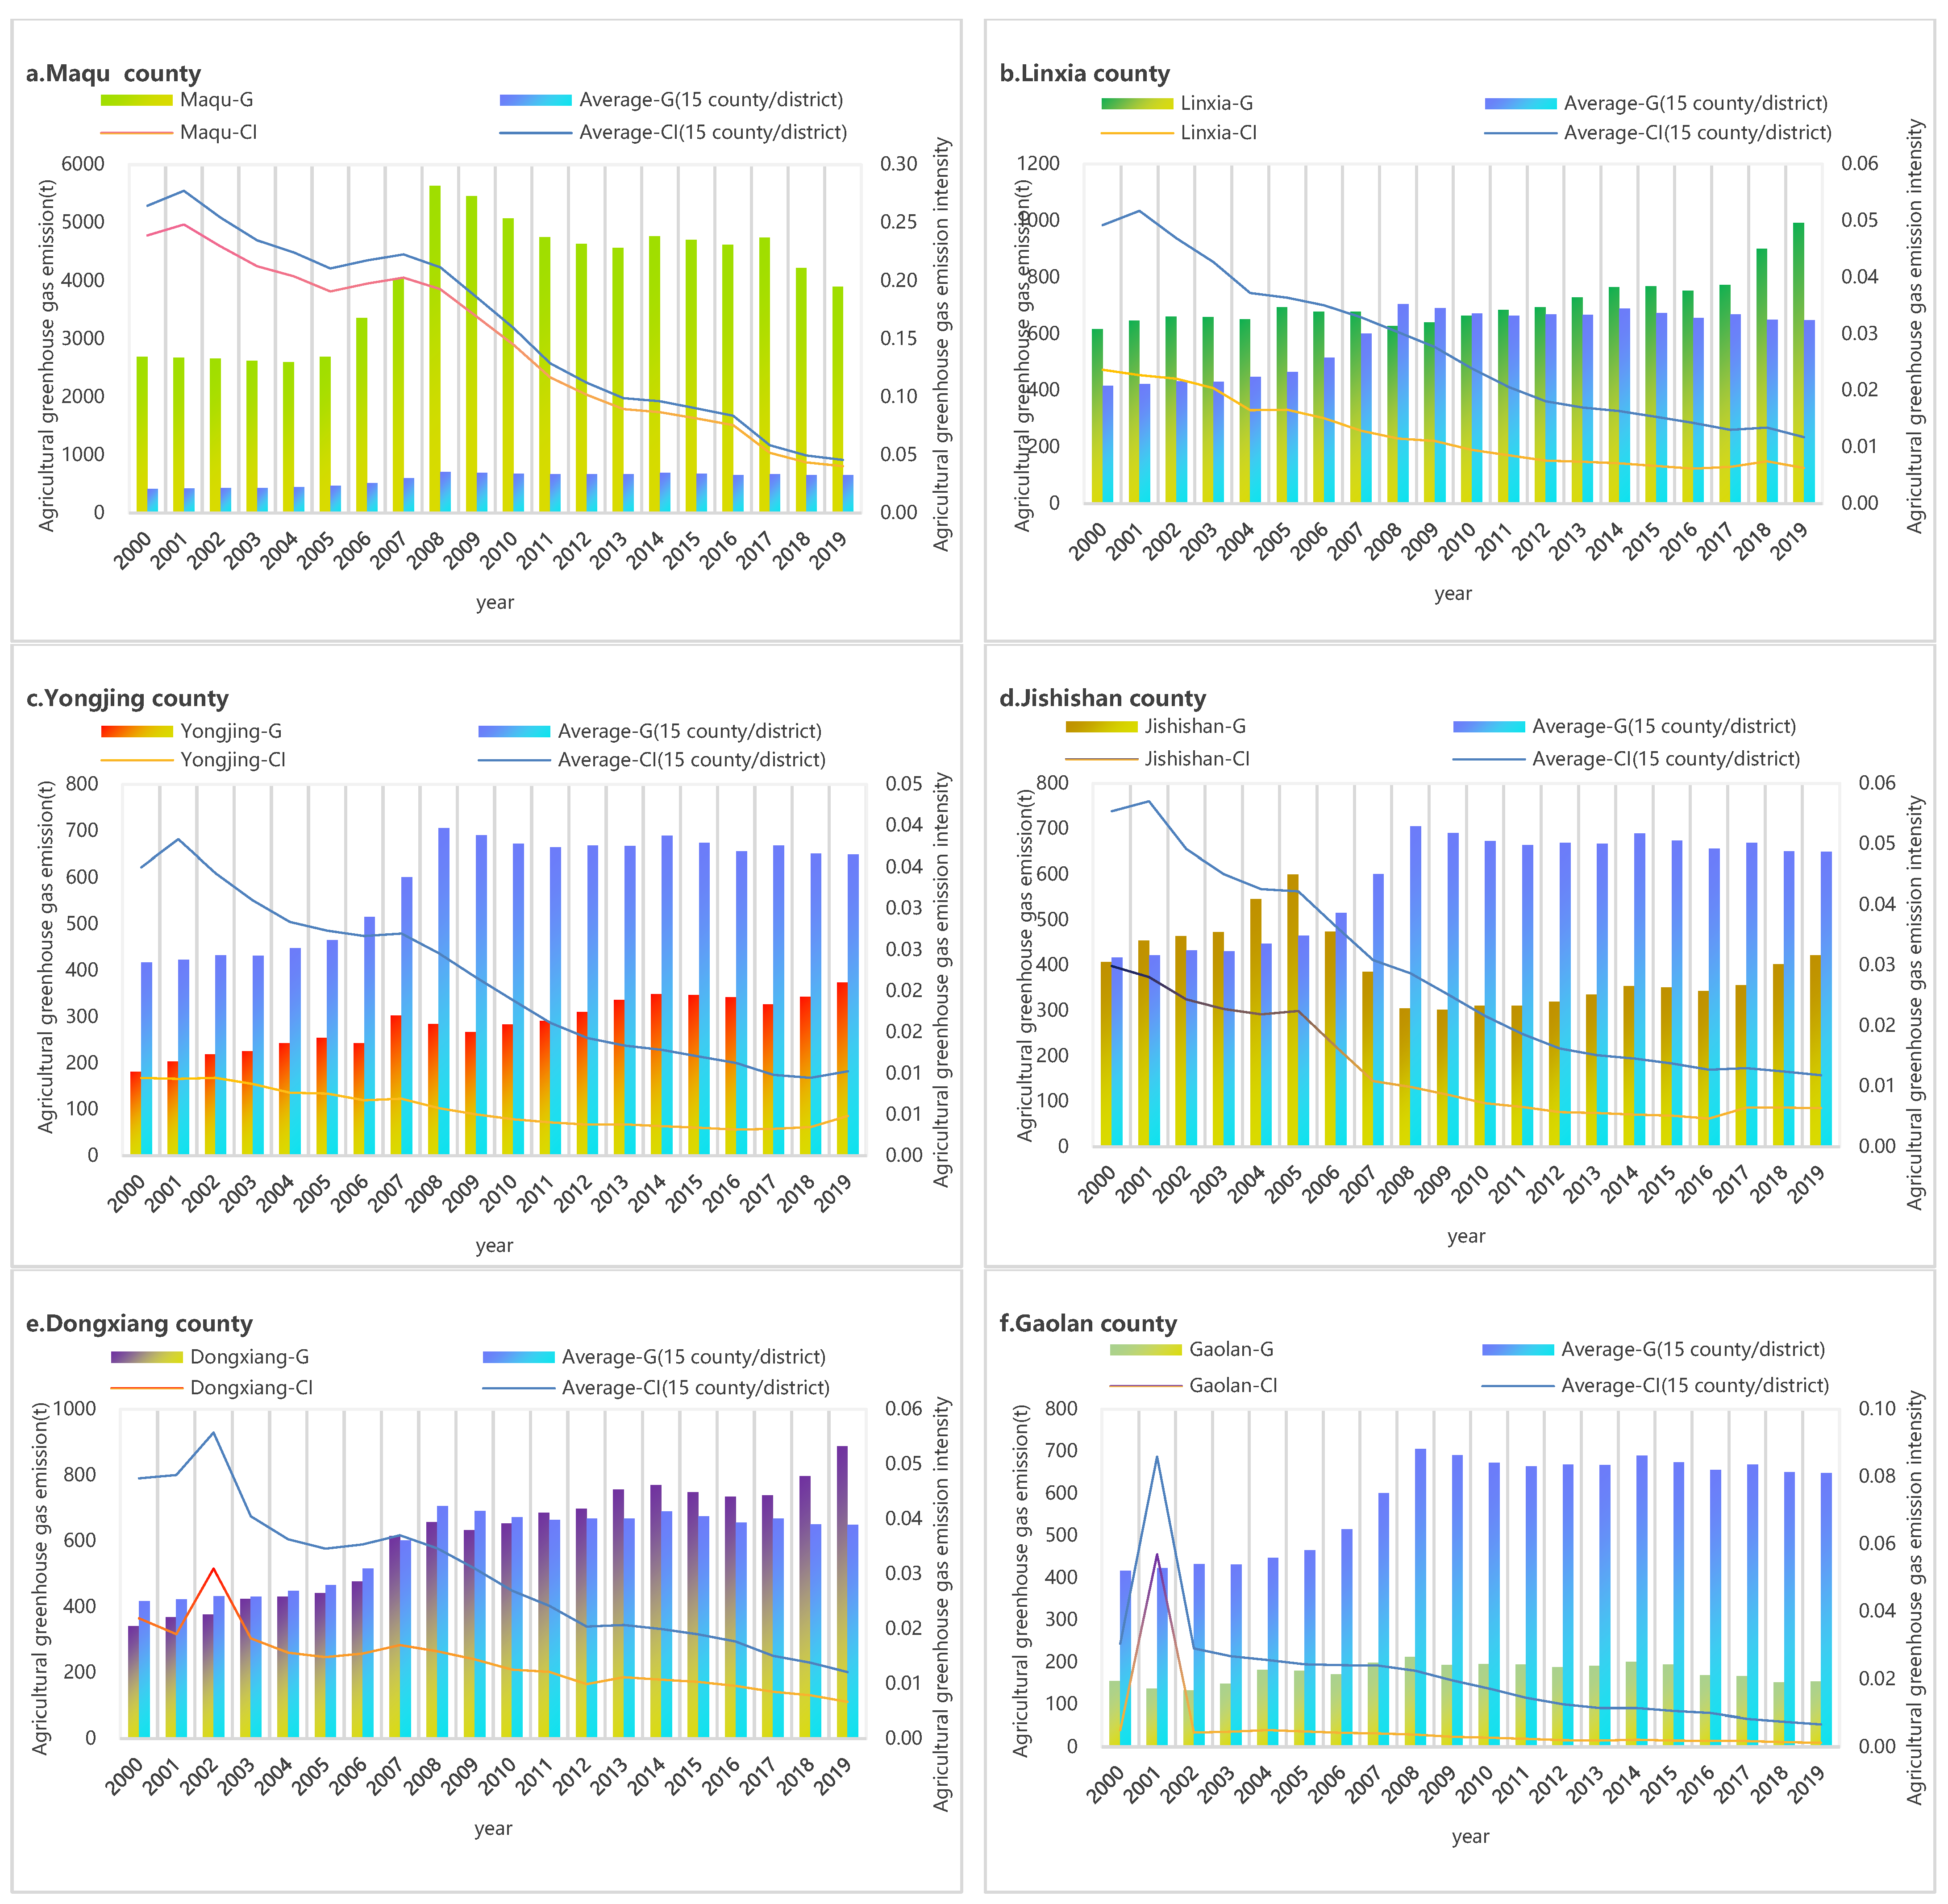
From 2000 to 2005, this stage was the first decline phase. The standard deviation was 633.24 in 2004, reaching the lowest level in the study period. The coefficient of variation was 1.41 in 2005, at the lowest level in 2000–2019, both relative and absolute gap in the process of narrowing.
(2)
From 2006 to 2008, as a period of rapid growth, both peaked in 2008 and increased by 70.09% and 24.35%, respectively, with a relative gap exceeding the absolute gap.
(3)
From 2009 to 2013 was the second decline phase, with the standard deviation and coefficient of variation falling 16.68% and 13.81%, respectively, both above the mean of the study period, indicating a further expansion of the relative and absolute gap between counties.
(4)
From 2014 to 2017 was a stable transition period, and the standard deviation and coefficient of variation remained basically unchanged, indicating that the relative and absolute gap between counties remained basically stable.
(5)
From 2018 to 2019 was a rapid decline period, with the standard deviation and coefficient of variation decreasing 7.40% and 7.14%, respectively, indicating a gradual narrowing of the relative and absolute gap between counties.
The trend of GHG emissions intensity and absolute gap between counties showed a narrowing trend, but the absolute gap is relatively stable (Figure 7).The emission standard deviation between counties decreased from 2000–2019 to 83.45% from 0.0597 to 0.0099 and the coefficient of variation to 22.8217 from 2.3374 to 22.06%.It can be divided into four stages: from 2000–2007, for the fluctuation period, the standard deviation reached the highest value in 2001, at 0.0624; from 2008–2019, the gap between the two gradually expanded, indicating that the relative gap and absolute gap between counties are getting smaller and smaller, the relative gap is smaller than the absolute gap, but the absolute gap shows a relatively stable change trend.

5. Discussion

Taking 15 counties in the Main Stream area of the Yellow River Basin in Gansu as the research subject, we analyze the spatial and temporal differences of agricultural GHG emissions by calculating the total GHG emissions, emissions intensity, Moran index, standard deviation and coefficient of variation. The total agricultural GHG emissions in the region are constantly increasing, while the intensity of agricultural GHG emissions continues to decline, and the agricultural production efficiency is significantly improved, the absolute gap gradually narrowed and basically stable. The trend of GHG emissions intensity and absolute gap between counties showed a narrowing trend, but the absolute gap is relatively stable. The main research conclusions are as follows:
Firstly, from the perspective of the total agricultural GHG emissions in the study area, it occupies a small proportion in Gansu Province and represents a very small proportion in western China. The total agricultural GHG emissions in 15 counties in the Main Stream area of the Yellow River Basin increased significantly from 62.5773 kt in 2000 to 97.3355 kt, in 2019, and an average annual increase of 2.35%, for example, in 2017, the total agricultural GHG emissions in the study area was 100.2805 kt was 3.34% of 300.17 × 10⁴ t [31] in Gansu Province, representing only 0.12% of the 8108.65 × 104 t [32] in Western China. Similarly, compared with Jiangsu Province in eastern China, the values were far lower than the average annual growth rate of Jiangsu Province (4.37%) [24], which can be roughly divided into three stages: rapid growth period (2000–2008), slow decline period (2009–2014) and rapid decline period (2015–2019). The interannual change of emission intensity in Gansu section of the Yellow River Basin showed a significant downward trend, with an average annual decline of 6.49%, higher than an average annual decline of 4.26% in Jiangsu Province [24], it is also highly coupled to the fact that “western regions show a trend of increase before gradient reduction” [33], indicating that its economic efficiency is significantly improved. This has a similar trend to the single peak change of “the GHG footprint of chemical fertilizer application in China presents a single peak change of ‘first increasing and then decreasing’ in 2013” [34]. However, the total increase of agricultural GHG emissions from Gansu section in the Main Stream of the Yellow River Basin has decreased since 2008, and did not show an obvious trend of hump development. Considering the total emissions in the different types of agricultural GHG analysis, they mainly present the following characteristics: firstly, agricultural emissions of CO2 show a smaller increase; secondly, emissions of CO2/CH4 in paddy fields are the smallest in agricultural GHG, drop for 53.49 percent, the trend shows a smaller decline. The emissions of N2O in agricultural cultivation shows a smaller increase; thirdly, the emissions of CH4 and N2O maintain a basically consistent change trend, but the average annual growth rate of the emissions of CH4 is higher than that of N2O.
Secondly, the spatial differences and characteristics of the Gansu section of the Yellow River Basin are obvious. Maqu County was the largest in the total GHG emissions, from 26.8842 kt in 2000 to 38.9603 kt, in 2019, an increase by 44.92%, and an average annual increase of 1.87%. Anning District was the smallest in the total GHG emissions, with a 87.33%decrease from 111.0 t in 2000 to 14.1 t in 2019, and an average annual decrease of 9.81%. Dongxiang County has the largest rate of increase in GHG emissions from 3.4106 kt in 2000 to 8.8771 kt, in 2019, increased by 160.28%, and an average annual increase of 4.90%. The smallest rate of decrease in GHG emissions in Chengguan District decreased 92.11% from 0.4893 kt in 2000 to 0.0390 kt in 2019, and an average annual decrease of 11.93%. The total amount of increase in GHG emissions in Dongxiang County, Jingtai County, Pingchuan District and Yongjing County was relatively large (increases by 160.28%, 117.53%, 114.99% and 106.45%). The agricultural GHG emissions in Gaolan County were the smallest, with an increase by 0.22%, and an annual decline of 0.01%. This is mainly related to the agricultural production conditions in Gansu Province [35]. The characteristics of agricultural GHG emissions intensity in the Main Stream of the Yellow River Basin in Gansu section showed an overall decline by 68.29%. The most occurred in Chengguan District, down by 84.25%. The least was in the Anning District, a decline by 40.40%. The agricultural production efficiency of 12 counties/districts (such as Maqu, Linxia, and others) has been significantly improved, but the improvement of agricultural production efficiency is only obvious in Qilihe District, Xigu Districts and Baiyin District. This is mainly related to agricultural land use efficiency level of around 0.7 and other factors have important relations [36].
Thirdly, from the perspective of regional GHG emissions intensity characteristics, the GHG emissions intensity in 15 counties (districts) of the Yellow River Basin, with an average decrease of 68.29%, and the relative gap in total GHG emissions gradually widened, while the absolute gap gradually narrowed and basically stable. Agricultural GHG emissions and agricultural economic development present three different types of elastic characteristics of negative, weak and strong decoupling [37], the path of decoupling between economic and social development and agricultural GHG emissions should be further considered, and the change of “the critical period of transformation from traditional farming mode to green and low-carbon farming mode should be properly handled” [38], and the GHG emissions intensity in Chengguan District decreased the most, by 84.25%; the GHG emissions intensity in Maqu County declined by 83.15%. Anning District’s GHG emissions intensity fell the least, down 40.40%. The relative gap in total GHG emissions gradually widened, while the absolute gap gradually narrowed and was basically stable. The GHG emissions standard deviation increased from 657.97 to 963.38, up 46.42% and an annual increase of 3.89%; the coefficient of variation (absolute) decreased from 1.58 to 1.48, with an annual increase of 1.70%. It can be divided in five phases: first decline (2000−2005), rapid growth (2006−2008), second decline (2009−2013), smooth transition (2014−2017), and rapid decline (2018−2019). The relative GHG emissions intensity and absolute gap between counties all show a narrowing trend, but the absolute gap is relatively stable. The emission standard deviation between counties decreased from 2000−2019 to 83.45% from 0.0597 to 0.0099 and the coefficient of variation to 22.8217 from 2.3374 to 22.06%. It can be divided in emission to two phases: fluctuation period (2000−2007) and decline period (2008−2019).
Fourthly, on the basis of analyzing the total emissions, emissions intensity and spatial differences of agricultural GHG emissions in 15 counties in the Main Stream area of the Yellow River Basin. It will provide a basis for the formulation of differentiated agricultural energy conservation and emission reduction policies. Firstly, the reduction of total GHG emissions is effectively realized through the adjustment of agricultural structure [39]. We can formulate different emission targets, tasks and incentive measures, determine different carbon reduction tasks and economic development indicators through GHG emissions intensity, explore regional agricultural carbon trading policies, and increase financial support and policy preference. To formulate differentiated ideas for modern agricultural development, Maqu County, mainly a single animal husbandry region, can enhance the agricultural production value and reduce the agricultural GHG emissions intensity by enhancing the attached value of animal husbandry production, Urban areas such as Chengguan District and Anning District can explore the “zero emission” mode of agricultural GHG emissions in the process of urbanization, The region combining urban areas and agricultural areas, mainly in Xigu and Baiyin District, will explore the balanced development mode of “carbon source-carbon sink” of agricultural GHG emissions and economic decoupling in the process of urbanization, Yuzhong County, Gaolan County and other planting counties mainly enhance the added value of planting industry, adjust the emissions reduction of agricultural machinery [40] and reduce the intensity of agricultural GHG emissions, improving the use of resources and reducing total GHG emissions.

6. Conclusions

This paper aims to research the GHG emissions and GHG emissions intensity in the Main Stream Area of the Yellow River Basin in Gansu, which includes CH4, CO2, and N2O emissions. Our results show that the total GHG emissions in this region increased between 2000−2019, but showed significant agricultural production efficiency and spatial differences. The study area represents a small proportion in Gansu Province and a very small proportion in Western China. The total agricultural GHG emissions in 15 counties in the Main Stream Area of the Yellow River Basin increased significantly from 62.5773 kt in 2000 to 97.3355 kt, in 2019, and an average annual increase of 2.35%. The relative gap in total GHG emissions gradually widened, while the absolute gap gradually narrowed and was basically stable. The spatial differences and characteristics of the Gansu section of the Yellow River Basin are obvious, Maqu County was the largest in the total GHG emissions, Anning District was the smallest in the total GHG emissions, Dongxiang County had the largest increase in the total GHG emissions, and Chengguan District decreased the largest in the total GHG emissions. However, the characteristics of agricultural GHG emissions intensity is a significant decline trending, agricultural production efficiency has been significantly improved. Maqu County was the largest in the agricultural GHG emissions intensity, Anning District was the smallest in the agricultural GHG emissions intensity, Chengguan District had the largest decrease in the agricultural GHG emissions intensity, and Anning District decreased the leaest in the agricultural GHG emissions intensity.
Calculated mainly based on IPCC’s National GHG Inventory Guide 2006 and the 2011 Provincial GHG List Preparation Guide (Trial) to provide a typical case area for research in this field, and to propose countermeasures and suggestions for agricultural low-carbon emissions and economic sustainable development. However, in the process of research, statistical data are mainly used. If one needs to do more in-depth research, new technical means such as field research data should be used to ensure the accuracy and scientific nature of the results.

Author Contributions

Conceptualization, L.P. and X.C.; methodology, L.P., C.L. and X.Y.; formal analysis, L.P., B.M. and L.J.; data curation, L.P., B.M. and L.J.; writing—original draft preparation, L.P.; writing—review and editing, L.P., C.L. and X.C. All authors have read and agreed to the published version of the manuscript.

Funding

This research was funded by the National Key R&D Program of China (2018YFC0704702), Fundamental Research Funds for the Central Universities (2020jbkyjc002).

Institutional Review Board Statement

Not applicable.

Informed Consent Statement

Not applicable.

Data Availability Statement

The data used to support the findings of this study are available from the corresponding author upon reasonable request.

Conflicts of Interest

The authors declare no conflict of interest.

References

  1. Food and Agriculture Organization (FAO). Food security and agricultural mitigation in developing countries: Options for capturing synergies; Rome FAO: Roma, Italy, 2009. [Google Scholar]
  2. Zhang, J.X.; Hu, W.L.; Wang, H.L. Analysis of the timing characteristics and influencing factors of agricultural carbon emission in Hubei Province. Hubei Agric. Sci. 2020, 59, 67–74. [Google Scholar]
  3. Qin, Z.C.; Deng, S.Y.; Dunn, J.; Smith, P.; Sun, W.J. Animal waste use and implications to agricultural greenhouse gas emissions in the United States. Environ. Res. Lett. 2021, 16. [Google Scholar] [CrossRef]
  4. Deng, C.X.; Li, R.R.; Xie, B.G.; Wan, Y.L.; Li, Z.W.; Liu, C.C. Impacts of the integrated pattern of water and land resources use on agricultural greenhouse gas emissions in China during 2006–2017: A water-land-energy-emissions nexus analysis. J. Clean. Prod. 2021, 308. [Google Scholar] [CrossRef]
  5. Isbasoiu, A.; Jayet, P.A.; Stéphane, D.C. Increasing food production and mitigating agricultural greenhouse gas emissions in the European Union: Impacts of carbon pricing and calorie production targeting. Environ. Econ. Policy Stud. 2020, 23, 409–440. [Google Scholar] [CrossRef]
  6. Vanesa, Z.M.; Marc, P.; María, S.A. GARCH model to estimate the impact of agricultural greenhouse gas emissions per sociodemographic factors and CAP in Spain. Environ. Dev. Sustain. 2020, 23, 4675–4697. [Google Scholar]
  7. Jantke, K.; Hartmann, M.J.; Rasche, L.; Blanz, B.; Schneider, U.A. Agricultural Greenhouse Gas Emissions: Knowledge and Positions of German Farmers. Land 2020, 9, 130. [Google Scholar] [CrossRef]
  8. Kumar, A.; Sharma, M.P. Estimation of green house gas emissions from Koteshwar hydropower reservoir, India. Environ. Monit. Assess. 2017, 189, 189–240. [Google Scholar] [CrossRef]
  9. Jin, J.K. Documenthiometric analysis of Agricultural greenhouse gas emission research in China. Anhui Agric. Not. 2019, 25, 116–118+136. [Google Scholar]
  10. He, Y.Q.; Cheng, X.Y.; Wang, F.; Cheng, Y. Spatial correlation of China’s agricultural greenhouse gas emissions: A technology spillover perspective. Nat. Hazards 2020, 104, 2561–2590. [Google Scholar] [CrossRef]
  11. Zhang, J.M.; Zhang, B. Accounting method of agricultural greenhouse gas emission in Heilongjiang Province. Stat. Consult. 2017, 2, 14–16. [Google Scholar]
  12. Jin, S.T.; Han, D.M.; Lin, Y.; Hu, J.Z. Prospect analysis and policy suggestions for agricultural carbon trading under the carbon peak target. Rural Financ. Res. 2021, 6, 3–8. [Google Scholar]
  13. Deng, X.Z.; Dan, L.; Ye, Q.; Wang, Z.H.; Liu, Y.; Zhang, X.Y.; Zhang, F.; Qi, W.; Wang, G.F.; Wang, P.; et al. Progress and methods of socio-economic cost of carbon emission and carbon reduction. J. Earth Inf. Sci. 2018, 20, 405–413. [Google Scholar]
  14. Li, Y.; Chen, M.P. Spatiotemporal characteristics of agricultural source non-carbon dioxide greenhouse gas emissions in the Yangtze River Economic Belt. Chin. Environ. Sci. 2020, 40, 2030–2039. [Google Scholar]
  15. Zhang, S.X. Analysis of agricultural carbon emissions measurement and influencing factors in China-Research based on provincial panel data. Hubei Agric. Sci. 2021, 60, 60–64+95. [Google Scholar]
  16. Zhu, S.M.; Wu, Q.; Mao, Y.L.; Zhang, L.M.; Long, J. Research on Agricultural Methane Emission Estimation in Fujian Province in 1980–2011. J. Henan Agric. Univ. 2017, 51, 250–257. [Google Scholar]
  17. Xie, L.Y.; Yang, S.Y.; Zhang, C.L.; Yang, W. Characteristics of Agricultural Source Greenhouse Gas emission in Anhui Province. China Agric. Sci. Bull. 2020, 36, 88–91. [Google Scholar]
  18. Zhao, P.F.; Tan, Y.; Yang, Y. Empirical study on the influencing factors of carbon emission trading price-Take the greenhouse gas emission quota in Hubei Province as an example. J. Wuhan Shipbuild. Vocat. Tech. Coll. 2020, 19, 118–123. [Google Scholar]
  19. Wang, L. Research on planting industry carbon emission in Hubei Province; Wuhan University Light Industry: Wuhan, China, 2019. [Google Scholar]
  20. Chu, T.S.; Lai, S.X.; Yang, Z.L. Accounting of greenhouse gas emission and soil carbon fixation in Heilongjiang Agricultural Reclamation Production System. J. China Agric. Univ. 2021, 26, 143–156. [Google Scholar]
  21. Luo, T.T. Study on comprehensive evaluation of wheat-maize in different ecological zones in Henan; Henan Normal University: Kaifeng, China, 2020. [Google Scholar]
  22. Fan, X.K.; Zheng, A.Q. Estimation of greenhouse gas emission reduction potential of "breeding-biogas" ecological model in Shaanxi Province. Shaanxi Agric. Sci. 2019, 65, 36–42. [Google Scholar]
  23. Sun, F. Study on Market Mechanism of Agricultural Greenhouse Gas Reduction in China; Chinese Academy of Agricultural Sciences: Beijing, China, 2012. [Google Scholar]
  24. Chen, H.; Fu, G.H.; Liu, Y.Z. Agricultural greenhouse gas emissions in Jiangsu Province: Spatial and temporal differences and trend evolution. Resour. Sci. 2018, 40, 1084–1094. [Google Scholar]
  25. Kang, T.; Yang, H.Z.; Guo, R. Agricultural greenhouse gas emission accounting in Chongming. Resour. Environ. Yangtze Basin 2012, 21, 102–108. [Google Scholar]
  26. Zhang, X.Z.; Wang, J.Y.; Zhang, T.L.; Li, B.L.; Yan, L. Assessment of methane emissions and low carbon measures in China. Environ. Sci. Technol. 2021, 44, 200–208. [Google Scholar]
  27. Shang, J.; Yang, G.; Yu, F.W. Agricultural greenhouse gases emissions and influencing factors in China. Chin. J. Eco-Agric. 2015, 23, 354–364. [Google Scholar]
  28. Li, R. Estimate and characteristics of agricultural greenhouse gas emissions in Anhui Province. J. Henan Agric. Sci. 2014, 43, 77–82. [Google Scholar]
  29. West, T.O.; Marland, G. A synthesis of carbon sequestration, carbon emissions, and net carbon flux in agriculture: Comparing tillage practices in the United States. Agric. Ecosyst. Environ. 2002, 91, 217–232. [Google Scholar] [CrossRef]
  30. Kumar, A.; Yang, T.; Sharma, M.P. Greenhouse gas measurement from Chinese freshwater bodies:A review. J. Clean. Prod. 2019, 233, 56–62. [Google Scholar] [CrossRef]
  31. Zhou, R.J.; Yan, Z.G. Based on the comparison and analysis of agricultural carbon emissions and carbon absorption in Gansu Province for nearly 10 years. Product. Res. 2020, 7, 61–64. [Google Scholar]
  32. Liao, W.D.; Liu, M. Spatiotemporal evolution of agricultural carbon emissions in western regions and the EKC hypothesis test-Empirical analysis of dynamic panel data model in 12 provinces in western China. World Agric. 2020, 6, 62–70. [Google Scholar]
  33. Wang, L.X.; Hong, M.Y. Empirical Analysis of the Relationship between Agricultural Production Performance and Carbon emission Strength in China. J. Shihezi Univ. (Philos. Soc. Sci. Ed.) 2018, 32, 56–62. [Google Scholar]
  34. Tian, P.P.; Lu, H.W.; Li, D.; Yin, C.; Xia, J. Spatial-temporal evolution pattern of carbon footprint of fertilizer application in China in 2008–2017. Chin. Environ. Sci. 2021, 41, 967–973. [Google Scholar]
  35. Tang, Y.F.; Li, H.X.; Liu, J.H.; Wang, J.L.; Ma, L.R. Study on Grain Production Situation and Grain Security Countermeasures in Gansu Province. Gansu Agric. Sci. Technol. 2021, 52, 63–71. [Google Scholar]
  36. Chen, B.P.; Liu, Y.; He, L.L. Research on agricultural land use efficiency based on the DEA and Malmquist Index-Take Gansu as an example. Sci. Technol. Econ. 2021, 34, 51–55. [Google Scholar]
  37. Cao, L.; Wang, Y.; Lei, S.J. Study on spatial and temporal characteristics and decoupling elasticity of Agricultural carbon emission in Shandong Province. Jiangsu Agric. Sci. 2020, 48, 250–256. [Google Scholar]
  38. Li, B.; Du, J.G.; Liu, X.Q. Space and temporal characteristics and economic correlation of agricultural carbon emissions in Hubei Province. Chin. Agric. Sci. 2019, 52, 4309–4319. [Google Scholar]
  39. Li, G.Z.; Li, Z.Z. Empirical analysis of carbon emission factor decomposition of agricultural energy consumption in China. Agric. Tech. Econ. 2010, 10, 66–72. [Google Scholar]
  40. Ma, L.J.; Zhong, N.N.; Zou, Z.R.; Li, Y.H.; Yao, N.; Gao, W.; Liu, B.S. Current situation of energy conservation and emission reduction in China. Agric. Eng. 2016, 6, 12–13. [Google Scholar]
Figure 1. The location of 15 counties within The Main Stream Area Yellow River Basin in Gansu Province.
Atmosphere 12 01296 g001
Figure 2. Changes of the total agricultural carbon emissions and agricultural GHG emissions intensity in the Main Stream of the Yellow River Basin in Gansu section from 2000 to 2019. “G” represents the total GHG emissions and “CI” represents the intensity of agricultural GHG in Figure 2. It shows the relationship of change between total carbon emissions and economic development.
Atmosphere 12 01296 g002
Figure 3. Variations in (a) CO2 emissions, (b) CH4 emissions of paddy field, (c) CH4 emissions of animals, (d) N2O emissions of paddy field, (e) N2O emissions of animals. Different types of agricultural GHG analysis. The Changes of the total of different types of agricultural GHG in The Main Stream of the Yellow River Basin in Gansu section from 2000 to 2019.” kt” stands for “thousand tons”.
Atmosphere 12 01296 g003
Figure 4. Variations in (a) Moran index, (b) Z value, the main expression is the relationship between total agricultural GHG emissions and GHG emissions intensity in The Main Stream of the Yellow River Basin in Gansu section from 2000 to 2019.
Atmosphere 12 01296 g004
Figure 5. Variations in (a) Maqu county, (b)Linxia county, (c) Yongjing county, (d) Jishishan county, (e) Dongxiang county, (f) Gaolan county, (g) Yuzhong county, (h) Chengguan district, (i) Qilihe district, (j) Anning districty, (k) Xigu district, (l) Jingtai district, (m) Pingchuan district, (n) Jingyuan county, (o) Baiyin district, include: the total GHG emissions (county/district-G) and the intensity of agricultural GHG (county/district-CI) in the main stream of Gansu section of the Yellow River Basin from 2000 to 2019.The average is the county (district) average of total agricultural GHG (Average-G) and GHG emissions intensity(Average-CI), in The Main Stream of the Yellow River Basin in Gansu section from 2000 to 2019.
Atmosphere 12 01296 g005aAtmosphere 12 01296 g005bAtmosphere 12 01296 g005c
Figure 6. Variations in (a) rate of increase for G (the total emissions of agricultural GHG), (b) rate of increase for CI (agricultural GHG emissions intensity) in the Main Stream region of the Yellow River Basin in the Gansu section. It shows the change in 2019 over 2000.
Atmosphere 12 01296 g006
Figure 7. Variations in (a) SD/CV(G), representing the standard deviation (coefficient of variation) of the total agricultural GHG emissions”, (b) Standard deviation (coefficient of variation) of the agricultural GHG emissions intensity in the Main Stream area of the Yellow River Basin in the Gansu section.
Atmosphere 12 01296 g007
Table 1. Brief profiles of studied counties (districts).
Case CitiesCase Counties
(Districts)
Main Agricultural
Products a
Population
(104)
Area
(km2)
GDP b
(104 U.S. dollar)
Gannan Tibetan Autonomous PrefectureMaquCattles (455.5 th)
Sheep (367.4 th)
5.9963736,925.99
Linxia Hui Autonomous PrefectureLinxiaCorn (79.524 kt)
Wheat (30.8 kt)
Tubers (20.301 kt)
29.561212.4140,083.51
YongjingCorn (62.300 kt)
Tubers (15.200 kt)
Wheat (5.800 kt)
18.79186479,492.51
JishishanCorn (41.90 kt)
Tubers (8.80 kt)
Wheat (7.28 kt)
24.7691037,087.40
DongxiangCorn (68.02 kt)
Tubers (50.89 kt)
Wheat (3.35 kt)
30.81126850,663.45
Lanzhou cityGaolanCorn (9.65 kt)
Tubers (7.15 kt)
Wheat (4.33 kt)
11.062180117,369.12
YuzhongCorn (69.03 kt)
Tubers (27.04 kt)
Wheat (15.77 kt)
44.73302241,192.62
ChengguanVegetables (5.94 kt)133.07207.84160,319.02
QiliheCorn (3.04 kt)
Vegetables (227.69 kt)
58.34394.47781,753.66
AnningVegetables (0.94 kt)28.7682.33348,620.26
XiguVegetables (122.36 kt)37.27358.32637,621.69
Baiyin cityBaiyinCorn (18.66 kt)
Wheat (2.30 kt)
30.471352338,740.59
PingchuanCorn (24.63 kt)
Tubers (10.17 kt)
Wheat (6.93 kt)
19.82106108,263.95
JingtaiCorn (134.83 kt)
Legumes (26.06 kt)
Wheat (39.85 kt)
Paddy (3.25 kt)
22.56548386,540.62
JingyuanSheep (409.30 kh)
Paddy (9.82 kt)
Tubers (43.27 kt)
Legumes (10.30 kt)
Corn (112.51 kt)
Wheat (27.90 kt)
46.685792108,751.11
Notes: Data for 2019; a th = thousand head, kt = kiloton; b Exchange rate: 1 U.S. dollar = 6.4573 RMB.
Table 2. The total GHG emissions in the 15 county (district) of Gansu section of the Yellow River Basin from 2000 to 2019.
Year2000200120022003200420052006200720082009
C(D)
Maqu26.884226.729726.617426.213226.007226.880333.576340.272256.316454.5594
Linxia6.17406.47316.60796.58846.51056.94336.78196.78296.27386.4073
Yongjing1.81182.02942.19232.25992.43252.54012.43183.02362.84702.6731
Jishishan4.07144.54574.64094.73045.46116.00464.74623.85693.05143.0157
Dongxiang3.41063.68723.76694.24154.31094.41034.75976.15136.56956.3237
Gaolan1.54671.36881.33081.48471.81431.79361.70921.98662.12641.9280
Yuzhong4.68284.65164.64844.56224.90894.95014.96415.50156.19306.1748
Chengguan0.49440.48070.50840.48930.39930.40140.26560.11920.08220.0803
Qilihe0.70550.70630.74100.77890.85731.02291.59292.18661.64651.6698
Anning0.11100.10550.10990.11180.13120.12720.08860.05190.05360.0513
Xigu0.41240.55280.61320.66870.80660.89760.87500.90390.58800.5850
Jingtai4.04213.88184.29154.12754.43174.97794.92275.39085.78796.3526
Pingchuan1.24741.17891.26181.29151.42061.53912.15833.29953.56892.8796
Jingyuan5.39655.27525.78235.35175.94235.54866.48638.34538.52698.5646
Baiyin1.58641.70611.74321.77201.70781.72991.98412.25562.16332.2971
Average4.17184.22494.32374.31144.47614.65115.15626.00857.05306.9042
Year2010201120122013201420152016201720182019
C(D)
Maqu50.737647.474046.347645.643047.693947.025446.196047.405242.195438.9603
Linxia6.64846.84816.93837.29227.64547.67617.53077.73679.00419.9183
Yongjing2.83172.90633.09903.36183.48603.46343.41773.26833.43273.7405
Jishishan3.11193.10713.19763.35283.53783.51023.43053.55934.02624.2235
Dongxiang6.52706.85846.97927.56177.69307.47597.34647.38707.96678.8771
Gaolan1.95051.94061.87581.90892.00521.94391.68751.66881.52171.5434
Yuzhong5.91906.13956.23446.31656.09565.74385.63415.57565.83355.8299
Chengguan0.09600.08840.08700.07710.07340.07150.06920.06780.04330.0390
Qilihe1.53551.48071.57421.65181.72201.66781.62751.64611.40701.1951
Anning0.04700.04420.04410.04680.04820.03670.03470.03320.02280.0141
Xigu0.58170.59120.59030.60190.58360.55680.50100.49600.48700.5295
Jingtai6.78227.07438.10267.81148.21337.45707.18927.60438.21118.7928
Pingchuan2.93982.97402.91602.81132.82052.69512.49982.36502.64482.6818
Jingyuan8.99239.845210.08689.38279.46719.49459.04199.22809.00888.7408
Baiyin2.16942.25912.20902.28112.31732.32112.21482.23921.79782.2493
Average50.737647.474046.347645.643047.693947.025446.196047.405242.195438.9603
Note: Variations in Maqu county, Linxia county, Yongjing county, Jishishan county, Dongxiang county, Gaolan county, Yuzhong county, Chengguan district, Qilihe district, Anning district, Xigu district, Jingtai district, Pingchuan district, Jingyuan county, Baiyin district, include: the total GHG emission in the main stream of Gansu section of the Yellow River Basin from 2000 to 2019.The average is the county (district) average of total agricultural GHG emissions, in The Main Stream of the Yellow River Basin in Gansu section from 2000 to 2019. “C/D” represent “county (district)”. The units in the table is “kt”, it represents “kiloton”.
Table 3. The total GHG emissions intensity in the 15 county (district) of Gansu section of the Yellow River Basin from 2000 to 2019.
Year2000200120022003200420052006200720082009
C(D)
Maqu0.23910.24850.22970.21250.20380.19080.19760.20270.19280.1690
Linxia0.02370.02270.02210.02040.01650.01660.01510.01290.01150.0111
Yongjing0.00940.00940.00950.00870.00770.00760.00670.00690.00580.0051
Jishishan0.02990.02800.02430.02280.02190.02240.01660.01080.00990.0086
Dongxiang0.02190.01900.03100.01820.01560.01480.01550.01700.01590.0144
Gaolan0.00490.05690.00430.00450.00500.00460.00420.00400.00370.0030
Yuzhong0.00930.00860.00760.00680.00610.00560.00530.00510.00540.0046
Chengguan0.00280.00260.00270.00260.00210.00210.00160.00070.00050.0004
Qilihe0.00250.00230.00260.00260.00270.00310.00460.00570.00390.0037
Anning0.00110.00110.00120.00140.00140.00150.00160.00120.00150.0016
Xigu0.00200.00240.00330.00260.00140.00290.00270.00240.00180.0016
Jingtai0.01030.00940.00980.00880.00690.00740.00680.00630.00580.0064
Pingchuan0.01180.01060.01060.00950.00880.00790.01050.01480.01460.0112
Jingyuan0.00750.00680.00710.00620.00520.00430.00470.00490.00460.0041
Baiyin0.00680.00690.00660.00650.00530.00470.00520.00480.00420.0041
Average0.02550.02900.02480.02230.02070.01980.01990.02000.01880.0166
Year2010201120122013201420152016201720182019
C(D)
Maqu0.14490.11680.10180.08940.08690.08150.07560.05190.04350.0403
Linxia0.00950.00860.00760.00740.00710.00670.00620.00650.00750.0063
Yongjing0.00450.00410.00380.00380.00360.00340.00320.00330.00350.0048
Jishishan0.00720.00660.00570.00560.00530.00510.00470.00640.00650.0064
Dongxiang0.01250.01210.00990.01110.01070.01030.00960.00850.00780.0067
Gaolan0.00270.00240.00200.00190.00220.00190.00180.00170.00140.0012
Yuzhong0.00380.00340.00310.00280.00250.00220.00240.00280.00240.0020
Chengguan0.00050.00040.00030.00030.00020.00020.00020.00080.00050.0004
Qilihe0.00320.00270.00270.00240.00220.00200.00180.00180.00150.0011
Anning0.00140.00100.00090.00090.00090.00070.00110.00090.00170.0007
Xigu0.00140.00120.00110.00100.00090.00080.00070.00130.00110.0010
Jingtai0.00610.00560.00530.00440.00450.00410.00380.00350.00350.0030
Pingchuan0.00970.00890.00690.00660.00630.00590.00560.00370.00410.0033
Jingyuan0.00390.00400.00360.00300.00280.00260.00230.00230.00190.0015
Baiyin0.00500.00330.00280.00270.00260.00250.00230.00250.00250.0026
Average0.01440.01210.01050.00960.00920.00870.00810.00650.00600.0054
Note: Variations in Maqu county, Linxia county, Yongjing county, Jishishan county, Dongxiang county, Gaolan county, Yuzhong county, Chengguan district, Qilihe district, Anning district, Xigu district, Jingtai district, Pingchuan district, Jingyuan county, Baiyin district, include: the total GHG emissions intensity in the main stream of Gansu section of the Yellow River Basin from 2000 to 2019.The average is the county (district) average of total agricultural GHG emissions intensity, in The Main Stream of the Yellow River Basin in Gansu section from 2000 to 2019. “C/D” represent “county (district)”.
Publisher’s Note: MDPI stays neutral with regard to jurisdictional claims in published maps and institutional affiliations.

