Article

Aerosol Properties within and above the Planetary Boundary Layer across the Korean Peninsula during December 2016

1
Department of Advanced Science and Technology Convergence, Kyungpook National University, Sangju 37224, Korea
2
DigiQuay Co., Ltd., Anyang 14058, Gyeonggi-do, Korea
3
National Institute of Meteorological Sciences, Jeju 63568, Korea
4
Department of Atmospheric Sciences, Yonsei University, Seoul 03722, Korea
5
Korea Meteorological Administration, Seoul 07062, Korea
*
Author to whom correspondence should be addressed.
Atmosphere 2021, 12(10), 1299; https://doi.org/10.3390/atmos12101299
Submission received: 16 August 2021 / Revised: 10 September 2021 / Accepted: 1 October 2021 / Published: 5 October 2021
(This article belongs to the Section Aerosols)

Abstract

:
During December 2016, airborne aerosol measurements were taken at multiple heights across the Korean Peninsula to examine the vertical properties of aerosols. This study showed that aerosols above the planetary boundary layer (PBL) show similar concentrations and particle size distributions (PSDs), regardless of the relative locations in Korea. On the other hand, aerosols within the PBL differ depending on the geographical location, origin and path of the air mass. The concentrations are the highest in Seoul, followed by Gangneung, East Sea and the Yellow Sea. The known east–west aerosol gradient did not appear and the reasons are discussed in this paper. The study further shows that the aerosols of upwind regions affect the aerosols above the PBL, whereas aerosols in the PBL are affected by local sources and atmospheric conditions in addition to aerosols of upwind areas.

1. Introduction

Aerosols considerably affect human health, air quality and climate systems through the radiative budget by directly scattering and absorbing aerosols and indirectly interacting with clouds [1,2,3,4,5,6,7]. Tremendous efforts have been made to monitor surface aerosol concentrations through committed long-term measurements at a location [8], the AERosol Robotic NETwork (AERONET) [9] and dedicated field campaigns [10,11,12]. However, it is challenging for ground-based point observations to cover the global distribution of aerosols. Satellite measurements provide a global view of aerosols but suffer from retrieval biases [13]. Besides, the vertical distribution of aerosols, an essential component of the aerosol indirect effect, is usually unknown. Lidar measurements provide an excellent tool to illustrate the vertical structure of aerosol concentrations at a location [14]. However, lidars cannot always define the vertical structure of aerosols if clouds and aerosols coexist. Aerosols decrease with heights and are homogeneous horizontally, but the vertical and horizontal distribution can be complicated when the aerosols are advected from remote locations [15,16]. Accordingly, in situ measurements of aerosols, showing the horizontal and vertical distributions, are needed to validate the retrieved aerosol products from remote sensors.
Korea is in the continental outflow regions and is affected by various kinds of aerosols. Aerosol studies in and around the Korean Peninsula have been conducted using ground- and ship-based measurements [10,17,18,19,20], satellite-based aerosol optical depth (AOD) [21], lidar retrieval of aerosol mass concentrations [22] and aircraft measurements [19,23,24]. In contrast to the remote sensor, an aircraft can directly probe aerosol properties using in situ instruments. Previously, aerosols were sampled at a constant height of ~3 km over the inland of the Korean Peninsula and aerosols were obtained from sounding measurements over the ocean [19]. Here, sounding measurements indicate an aircraft probing the atmosphere spiral up or down and a level-leg flight measures aerosols at a constant height. Aerosol data obtained from one constant height hardly represent the overall atmospheric aerosols, especially if the measurements were made higher than the planetary boundary layer (PBL), because sub-cloud layer aerosols are ingested into the clouds, affecting the cloud formation and precipitation processes. Further, sounding measurements have difficulty in representing aerosol values when horizontal variations in aerosols exist. The horizontal variations of aerosols are common when aerosols are transported from remote locations [16]. Therefore, in this study, multiple level-leg flights and sounding measurements were combined to take advantage of both strategies. Airborne aerosol measurements in and around South Korea were recorded [18,19,23]. However, none of them has sampled aerosols at more than a single-level height across the Korean Peninsula. This study provides the first vertical structure of aerosols (concentration and size distribution of aerosols) over the inland of the Korean Peninsula using in situ aircraft measurement.
In situ aerosol airborne measurements were recorded in and around the Korean Peninsula from 1 December to 11 December 2016, to better understand the aerosol properties over the Korean Peninsula, which corresponds to the continental outflow regions. This study provides in situ aerosol measurements over the Korean Peninsula, obtained in and above the PBL, and the results can be used to validate the aerosol retrievals from remote sensors. Although East Asia is a region where a diverse and extensive source of aerosols exists, limited data on aerosol properties are available, especially as a function of height above the surface. As this is the first vertical measurements made over the inland of Korean Peninsula, this study focuses on analyzing the vertical structure of aerosols measured over the Yellow Sea, Seoul, Gangneung and East Sea by the aircraft transects from east to west in the Korean Peninsula. Previous studies [19,21] have shown the east–west aerosol gradients across the Korean Peninsula; thus, this study further verifies the east–west gradients of the total aerosol number concentrations (Ncn).

2. Data and Methods

For this study, we used a Cessna206. The aircraft was equipped with a condensation particle counter (CPC, TSI CPC3010) and an aerosol spectrometer called Sky-OPC (GRIMM Aerosol Technik). The CPC measures all aerosols larger than 0.01 μm, whereas the Sky-OPC measures aerosols between 0.25 μm and 32 μm at 32 bins. The total aerosol number concentrations (Ncn) measured using the CPC during the flights were corrected for pressure using the method described in [18]. The particle size distribution (PSD) and particulate matter (PM) with a diameter of 10 μm or less (PM10) shown in this study were obtained from the Sky-OPC.
The 24 h back trajectory arriving at 500 m and 2000 m above the ground level (AGL) over the Yellow Sea, Seoul, Gangneung and East Sea were calculated using the Hysplit model (http://ready.arl.noaa.gov/HYSPLIT_traj.php, accessed on 4 October 2021) to represent the heights of airmass arriving within and above the PBL, respectively. The PBL height can be referred to by the vertical structure of potential temperature where the upper-air sounding data were downloaded from http://weather.uwyo.edu/upperair/sounding.html (accessed on 4 October 2021). PBL defines the interface between a well-mixed layer and the free atmosphere, where the mixed layer is a zone having nearly constant potential temperature and specific humidity with height [25].
The Korean Peninsula is in the continental outflow regions, between China and Japan (Figure 1a) and is heavily affected by aerosols from China. In December 2016, nine research flights (RFs) were made to characterize the background aerosols over the Korean Peninsula, including the Yellow Sea, Seoul, Gangneung and East Sea. Seoul is the capital of South Korea and is a typical large urban area in East Asia. Gangneung is in the east part of the Korean Peninsula and is considered a clean environment, less populated and less polluted than Seoul. Table 1 summarizes the details of the nine individual flights.
Figure 1b shows two flight patterns in blue and magenta as an example. The blue lines indicate the flight patterns that sampled aerosols over the Yellow Sea and Seoul on 6 December (RF04). Seoul is a densely populated area and, because of the unique military situation on the Korean Peninsula, flying over Seoul at low altitudes is prohibited. Consequently, for Seoul, flying along the Han River was adopted. Here, the Han River flows across Seoul. The measurements over the Yellow Sea were made 80–90 km away from the Gimpo airport, Seoul. The magenta shows the Gangneung area flight pattern, measuring aerosols over the region along the coast on 11 December (RF09). For the Gangneung area, two flight patterns were adopted to see whether the differences in aerosols exist on landside and oceanside; one was to fly parallel to the coastline (Figure 1b, magenta) and another was to fly across the coast (not shown here). The aircraft measurements over the East Sea were made ~5 km off the coastline and the distance between the level-legs (land-leg and ocean-leg) was ~10 km.

3. Results

3.1. Back Trajectory

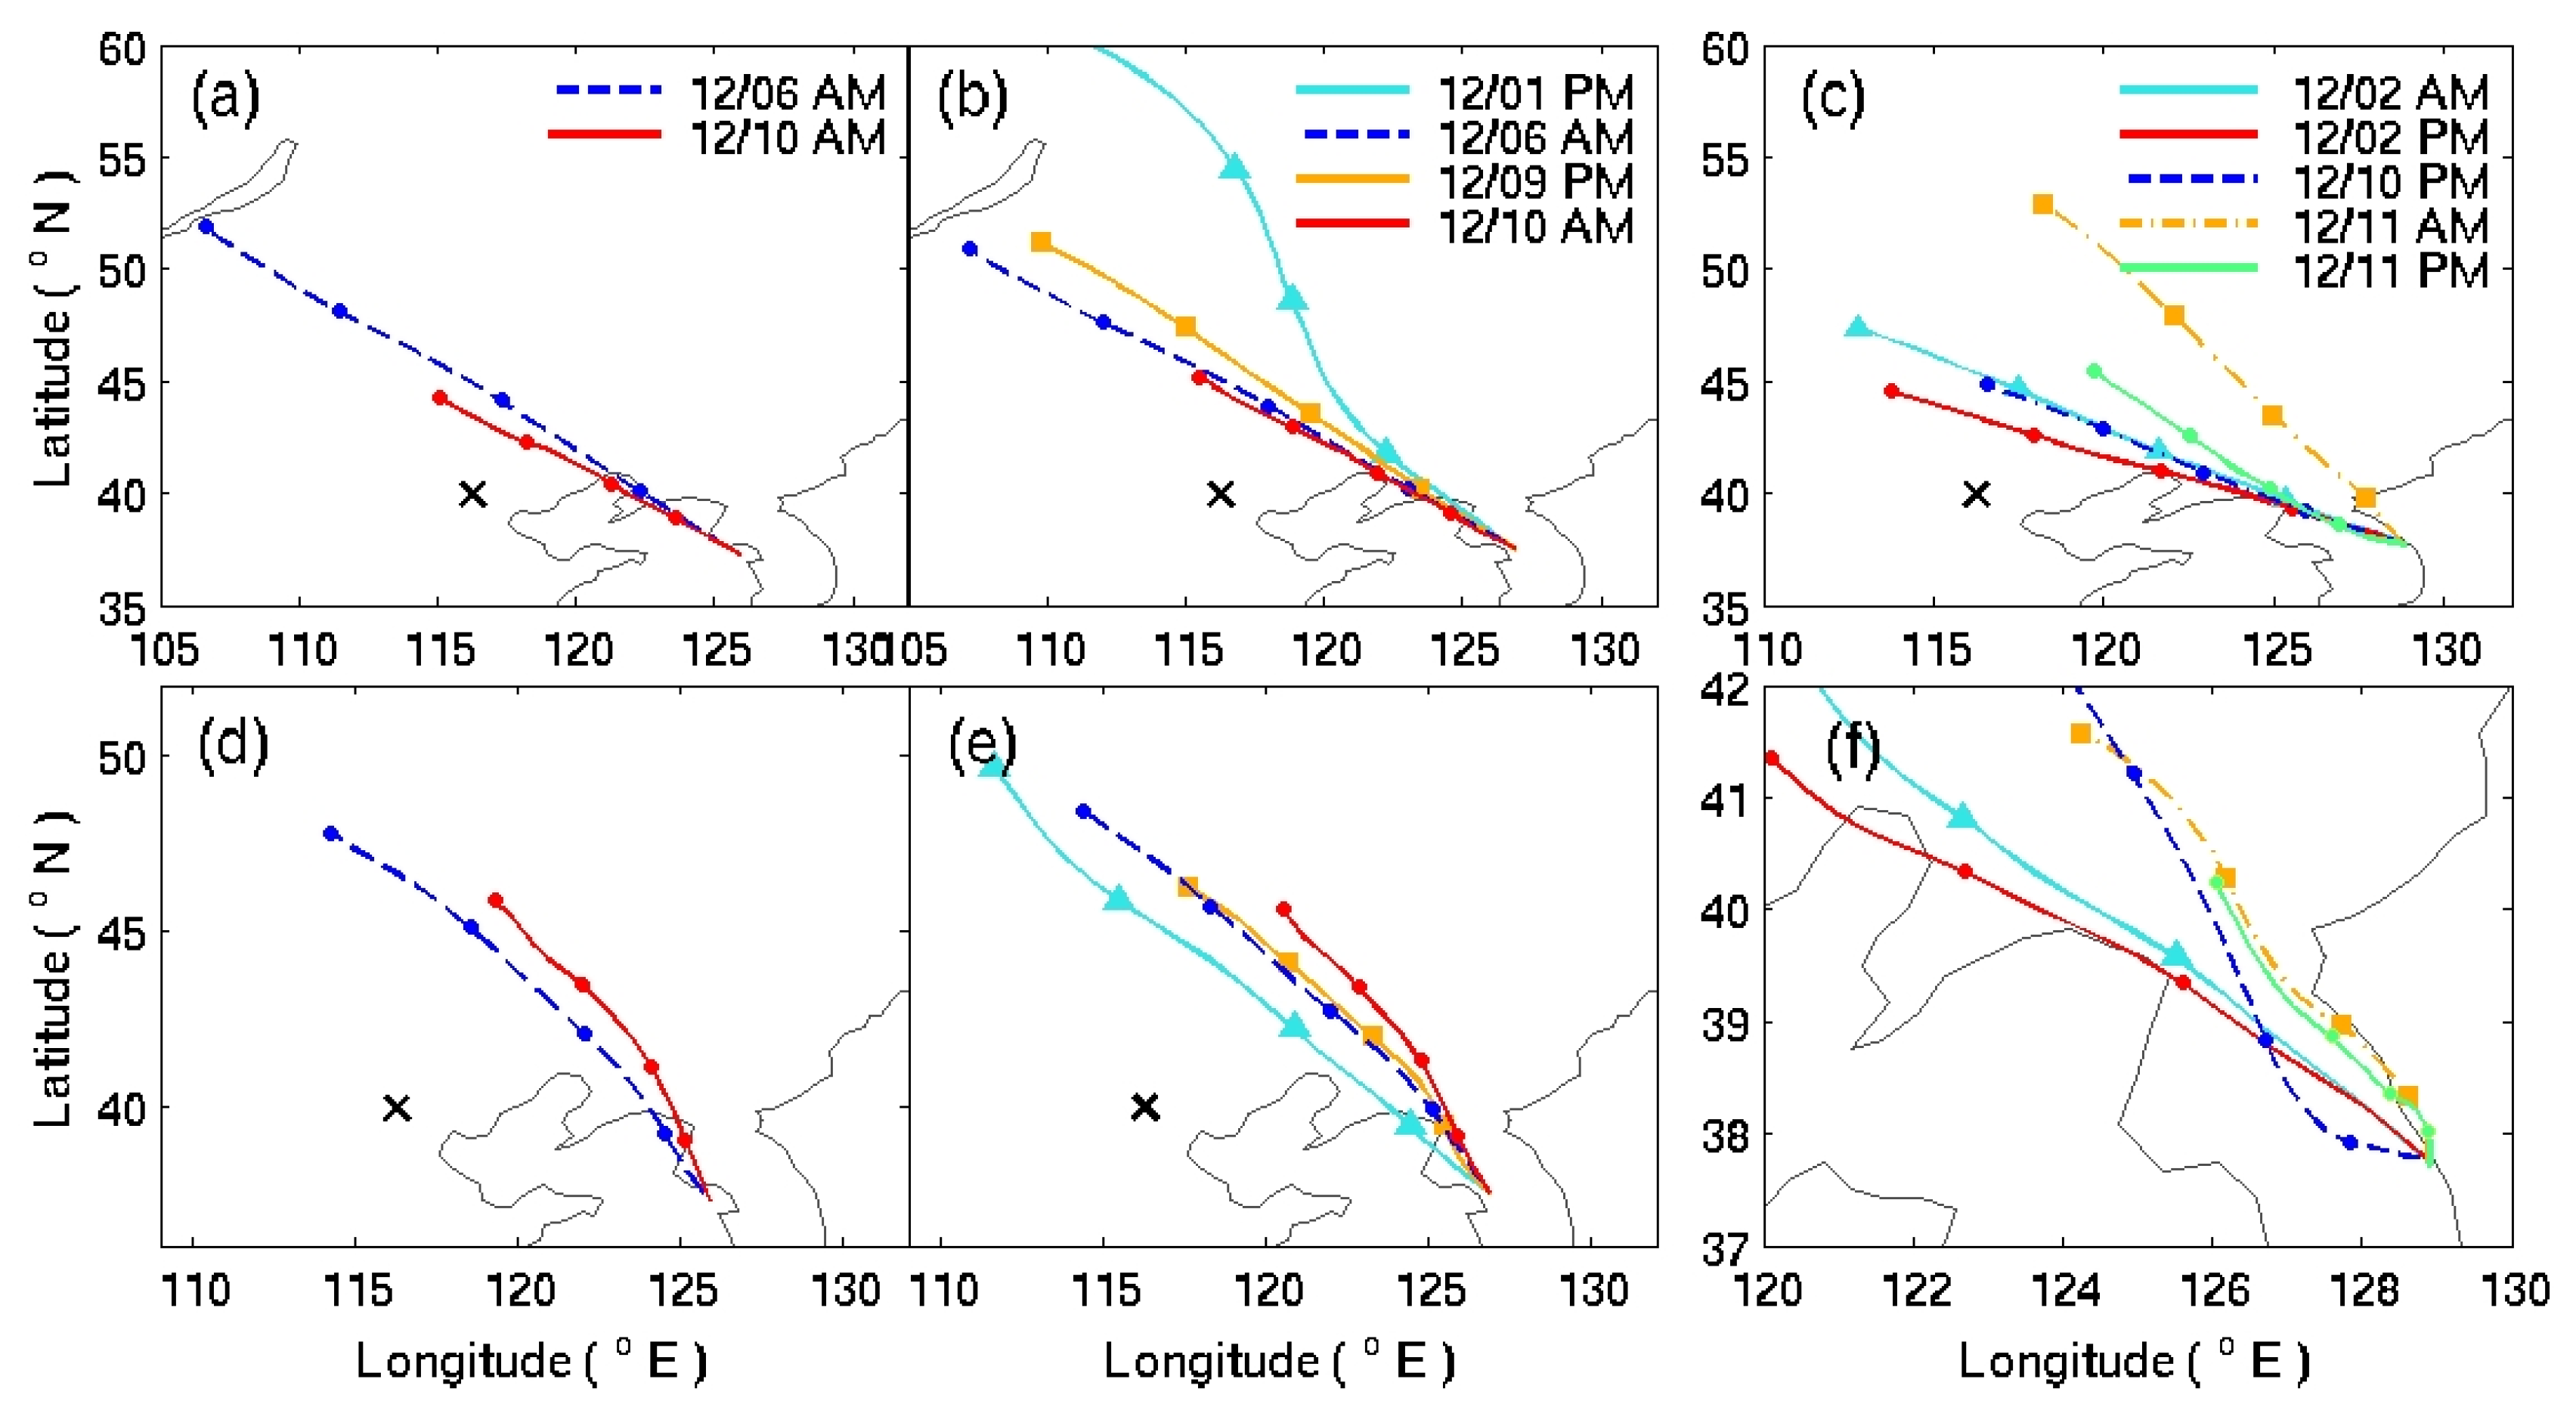
The 24 h back trajectories arriving at 500 m and 2000 m (AGL) over the Yellow Sea, Seoul and Gangneung are shown in Figure 2. Here, 500 m and 2000 m are the heights within and above the PBL, respectively. The average location (latitude and longitude) of level-leg flights at a given area was used as the ending points of the back trajectory. Korea is in the continental outflow regions and the prevailing winds during the wintertime are northerly or northwesterly. The result shows that the airmass that arrived at the Korean Peninsula originated from Lake Baikal or northeast China as a whole, regardless of the relative geographical locations in Korea (Yellow Sea, Seoul and Gangneung). Note that the airmass that arrived at Gangneung at 500 m on 11 December (Figure 2f) stayed over the ocean for at least 12 h before being sampled at Gangneung.
Vertical profiles of potential temperature at Osan and Bukgangneung are shown in Figure 3 to examine the PBL height. Here, Osan and Bukgangneung are the nearest upper-air sounding locations to Seoul and Gangneung. The locations of Osan and Bukgangneung are overlaid in Figure 1 as dot symbols. Figure 3 shows that the overall PBL heights are at ~1 km and are lower than 2 km, which is used as the height representing the above PBL. The PBL heights for Seoul and Gangneung are ~1 km in [13] and are consistent with the PBL heights in Figure 3. Referring to Figure 3b,c, as seen from the back trajectory in Figure 2, during the observation period, the northwest wind blew mainly in Seoul and Gangneung and the east wind blew 1.5 km below Gangneung on 10 and 11 December.

3.2. Vertical Structure of Aerosols

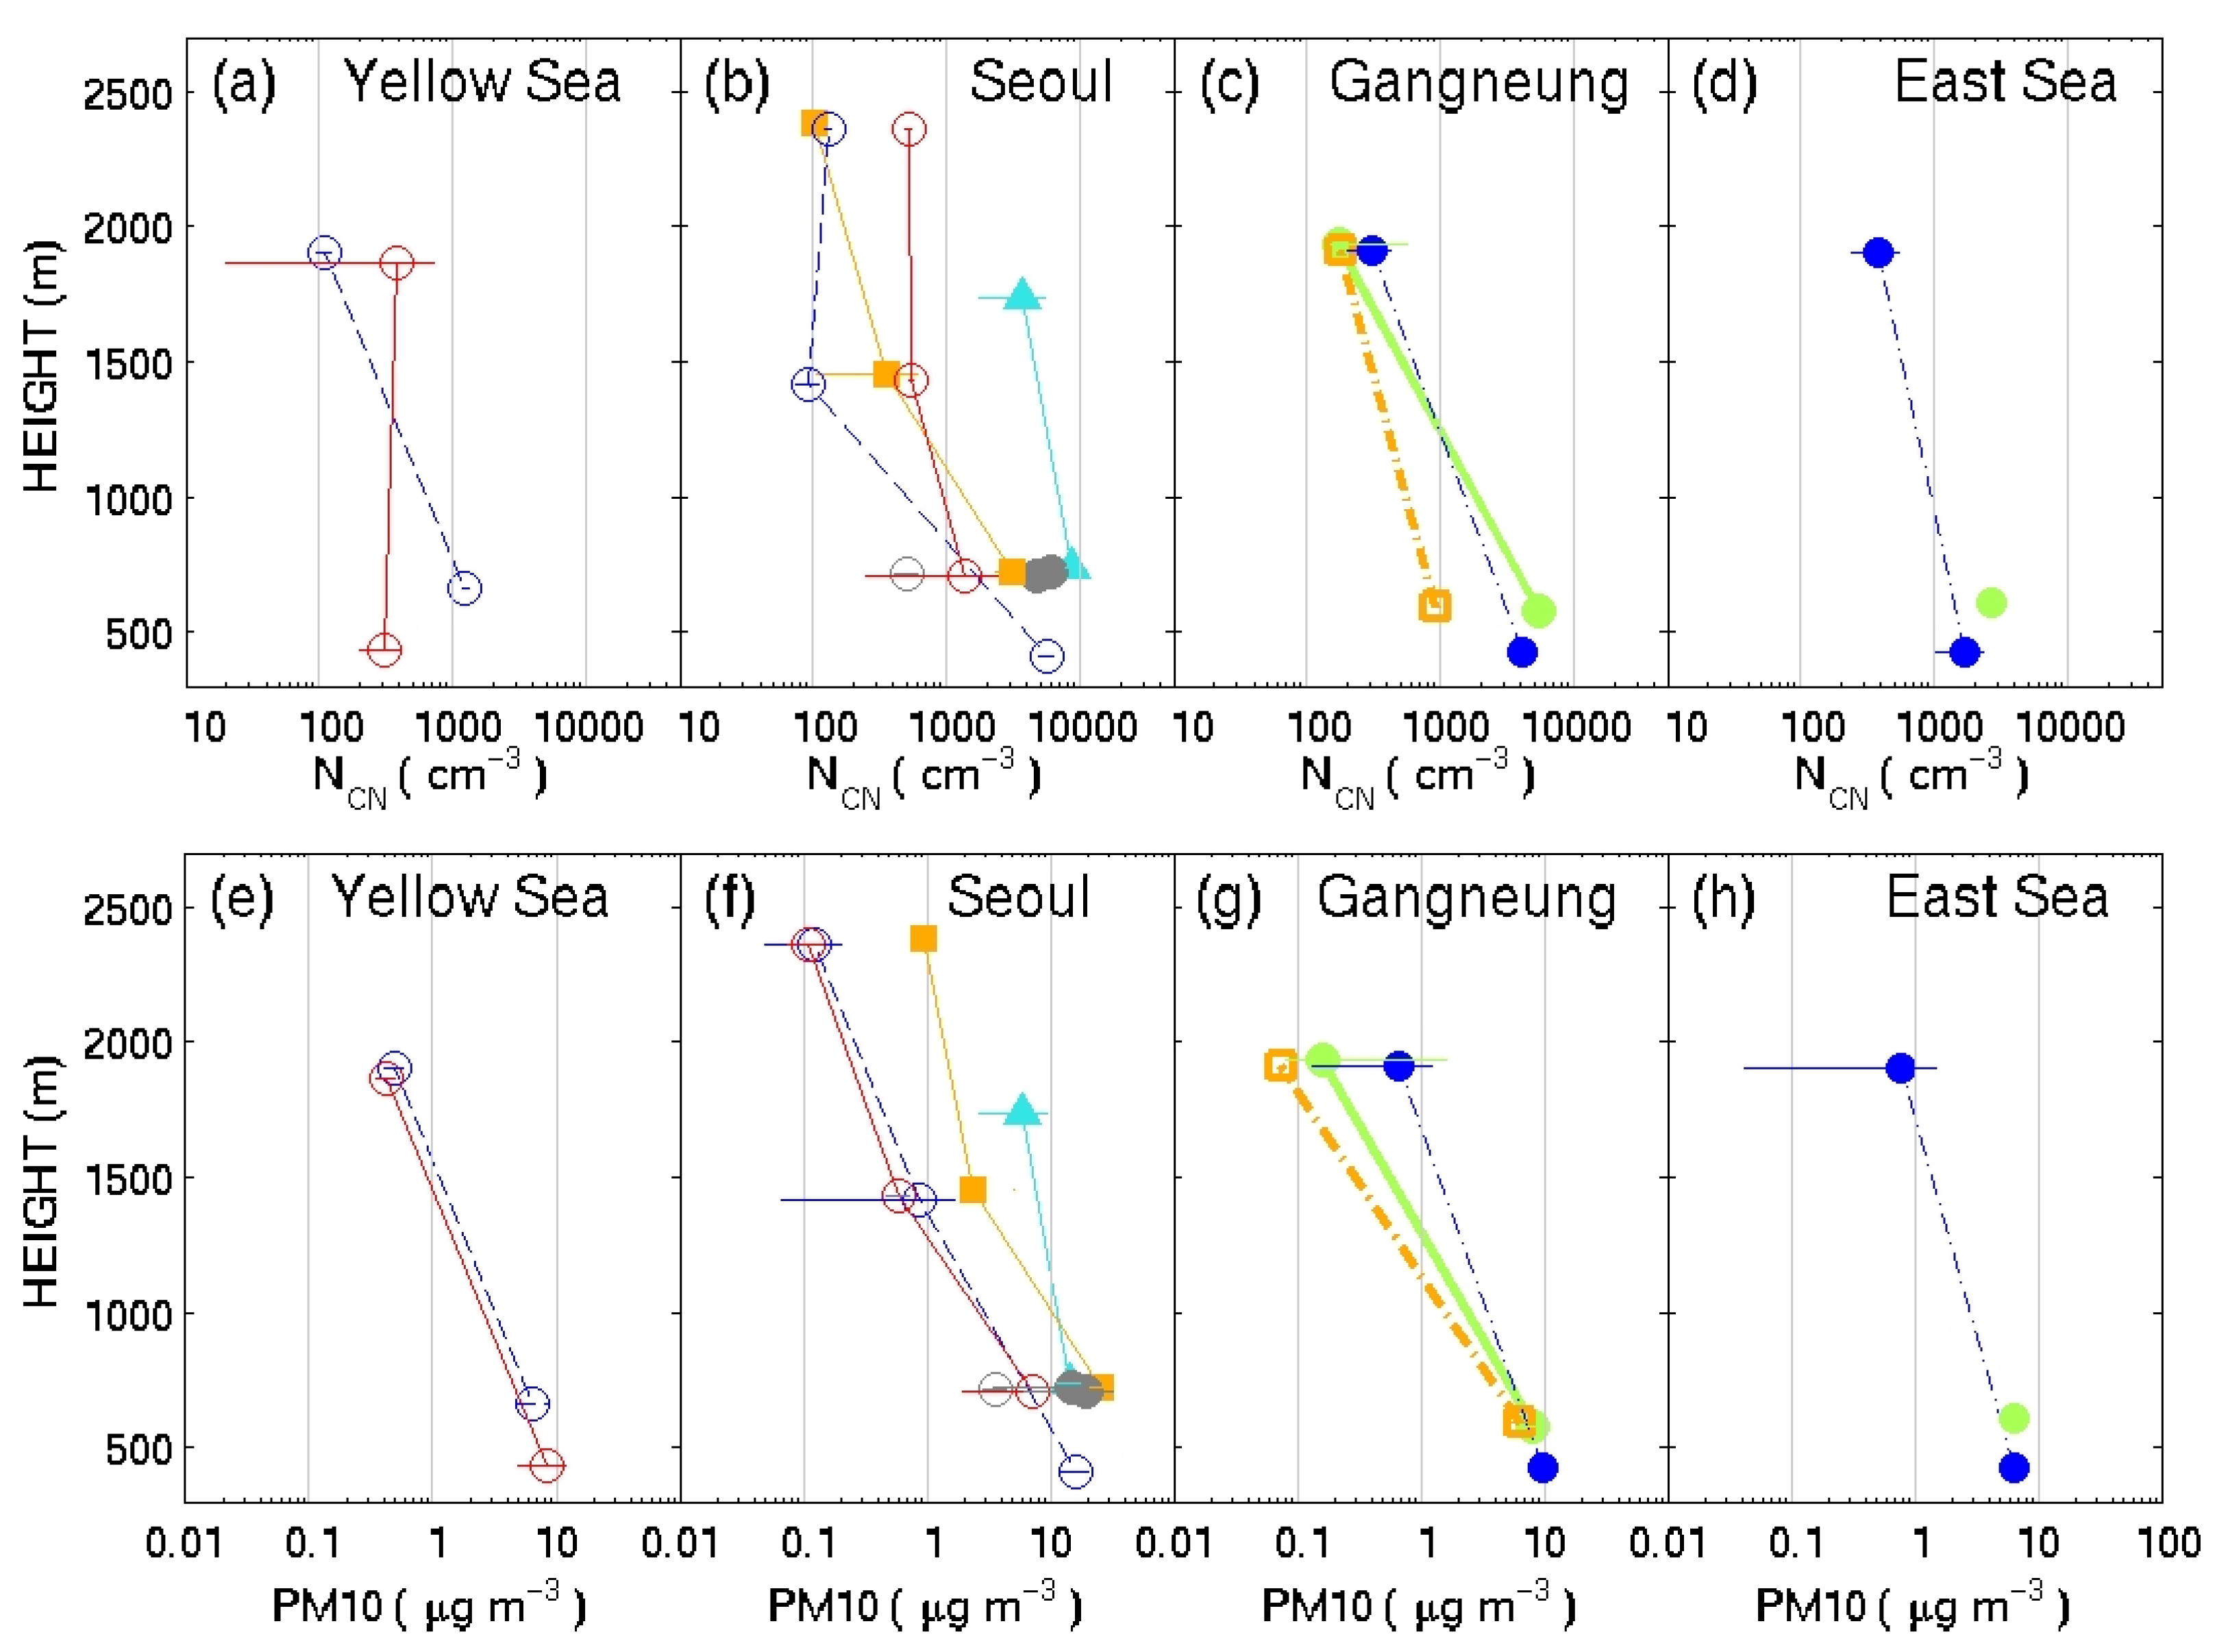
The vertical profiles of aerosols measured by an aircraft flying across the Korean Peninsula are shown in Figure 4. The figure shows the mean aerosol Ncn and PM10 obtained from the level-leg flights over the Yellow Sea along the Han River (Seoul), Gangneung (continental side) and East Sea during the experiment. In Figure 4, the Ncn decreases with height, in general. The most distinct feature of the Ncn (Figure 4a–d) is that the concentrations measured at Seoul are higher than the aerosols measured in other areas within the PBL, which is expected, because Seoul is one of the megacities in East Asia. The Ncn was measured using a CPC, measuring all particles larger than 10 nm. The PBL aerosols at Seoul ranged from 400 to 10,000 cm−3, but mostly appeared around 4000 cm−3 (mean and median), except for 1 December (blue triangle), showing a higher Ncn than other days. It is not shown here, but a weak yellow-dust passed by the Korean Peninsula on 1 December, confirmed from nearby ground-based lidar and surface PM10 measurements. The airmass on 1 December originated further northeast (east of Lake Baikal; see the blue-filled triangle in Figure 2) than on other days. The Ncn at Gangneung (Figure 4c) are higher than those obtained from the East Sea (Figure 4d), although the geographical distance between the two locations is ~10 km. The Ncn at Gangneung in the PBL (Figure 4c) ranged from 800 to 6000 cm−3. According to [26], aerosol concentrations for maritime air and continental air are in the order of 102 and 103 cm−3, respectively. Gangneung is located close to the sea and is less developed and less populated. So, we presumed that Gangneung would have a low aerosol concentration with the characteristics of being close to an oceanic air mass rather than inland. However, the Ncn at Gangneung in the PBL was not much different from aerosols measured at Seoul, in which the Ncn ranged from 400 to 10,000 cm−3. Aerosols sampled over the East Sea along the coastline near Gangneung (Figure 4d) in the PBL ranged around 1000–3000 cm−3, which are on the same order of the Ncn observed over the East Sea in [19,24]. The mean aerosol concentrations (Ncn and PM10) shown in Figure 4 are summarized in Table 2.
In previous studies, the Ncn observed over the Yellow Sea within the PBL ranged from 1000 to 30,000 cm−3 (Figure 11 in [19]). In this study, aerosols over the Yellow Sea ranged from 200 to 1000 cm−3, which lies on the smaller side of the Ncn shown in previous studies [19]. Interestingly, in this study, aerosols over the Yellow Sea showed the lowest Ncn among all locations. However, it is not necessarily implied that the Ncn over the Yellow Sea are always the smallest among all aerosols over the Korean Peninsula, as many other factors can contribute to the result. For example, aerosol concentrations measured in the afternoon (PM aerosol) were higher than aerosols measured in the morning (AM aerosol). Coincidently, all level-leg flights over the Yellow Sea were conducted in the morning, whereas the aerosols from other locations were sampled in the mornings and afternoons, indicating that the smallest Ncn over the Yellow Sea can be sample bias. However, the Ncn over the Yellow Sea was less than the Ncn in Seoul on 6 and 10 December, when the aircraft sampled the aerosols at both locations with the same flights, indicating that the lower Ncn recorded over the Yellow Sea is not a simple sample bias. The aerosols measured over the Yellow Sea above the PBL are also smaller than or similar to those in Seoul. The smallest Ncn over the Yellow Sea within and above the PBL could be related to the airmass origin and path. Figure 2 shows that the airmass observed over the Yellow Sea (Figure 2a,d) originated near Lake Baikal or northeast China (a relatively clean environment). Furthermore, the airmass stayed over the ocean for at least 6 h before the aerosols were sampled over the Yellow Sea.
Previously, [27] analyzed the airmass origin associated with haze events in Seoul from 2009 to 2010. They showed that the high concentrations of aerosols observed over the Korean Peninsula were linked to the airmass originating from highly populated polluted areas (northern and southern China, such as Beijing and Shanghai) and transported to Korea through the westerly. On none of the days during the experiment, airmasses were not originated from near Beijing nor Shanghai.
Figure 4a–d further shows that PM aerosols (filled symbols) within the PBL are higher than morning aerosols (open symbols) as a whole. Specifically, on 11 December, the flight paths were similar in the morning and afternoon flights and the back trajectories were similar too (orange for AM, green for PM in Figure 2f and Figure 4c). On 11 December, the high concentration of aerosols in the afternoon is more evident. The higher Ncn in the afternoon (Figure 4a–d) could be related to a photochemical reaction and agrees with previous studies [28], indicating the roles of a local source of aerosols associated with the new particle formation and growth, as indicated in [12,19]. In contrast, the aerosols obtained from above the PBL (above ~1 km) do not show distinct differences according to location (land or ocean) or time of the day (morning or afternoon), which is probably due to the dominant influence of the aerosols from the continental outflows above the PBL.
Airborne PM is a well-known cause of respiratory diseases and lung cancer, among many other diseases or causes of death. PM10, similarly to the Ncn, decreases with height (Figure 4e–h). Furthermore, PM10 concentrations within the PBL show similar patterns as the Ncn, registering higher concentrations over the land (Figure 4f,g) than those over the ocean (Figure 4e,h). Figure 4e–h shows that afternoon PM10 in Seoul (Figure 4f, filled symbols) was distinctly higher than PM10 in all places and dates. For instance, PM10 in Seoul at ~700 m in the afternoon was 10–30 μg m−3, compared to 3–10 μg m−3 recorded in other places and times. However, the PBL PM10 over the Yellow Sea in the morning (RF06; 10 December; red in Figure 4e) was higher than the PBL PM10 over the East Sea in the afternoon (RF07; 10 December, blue in Figure 4f), indicating higher PM10 over the Yellow Sea than over the East Sea.
The Ncn and PM10 decrease rate with heights is more prominent over the land than over the ocean, indicating close links between the surface and the source of PM10 and Ncn. The PM10 at Seoul in the PBL (Figure 4f) was 3–30 μg m−3 and 0.1–1 μg m−3 at around 2300 m (above PBL), whereas PM10 over the East Sea in the PBL (Figure 4h) was ~6 μg m−3 and 0.7–0.8 μg m−3 at around 2000 m. Besides, PM10 varied widely over the land, compared with that over the ocean (Figure 4f,g versus Figure 4e,h) and in the afternoon (filled versus open symbols).
The higher afternoon aerosol concentrations are more evident in the total number of aerosols (Ncn, Figure 4a–d) than PM10 (Figure 4e–h). The Ncn measures all particles larger than 10 nm (D > 0.01 μm), whereas PM10 measures particles between 0.25 μm and 10 μm. Therefore, higher afternoon aerosol concentrations indicate that particle growth in the afternoon was in the regime of either D > 10 μm, 0.01 μm < D < 0.25 μm or in both regimes. A previous study shows the formation and growth of new particles in the regime of D ~0.01–0.1 μm in the afternoon [19] through photochemical reactions. In summary, aerosol concentrations were higher over the land than those over the ocean (Seoul > Gangneung > East Sea > Yellow Sea), not showing the east–west gradients.

3.3. Particle Size Distribution

The aerosol particle size distributions (PSDs) obtained from the level-leg flights are shown in Figure 5. The PSDs of the same day are shown with the same colors; each corresponds to the PSD obtained within and above the PBL, respectively. The most outstanding feature in Figure 5 is that the PSDs obtained from above the PBL show remarkably similar shapes, regardless of the locations and dates of sampling, monotonically decreasing to D ~1.5 μm. PSDs obtained within the PBL also show similar shapes as a whole, monotonically decreasing to D ~1.5 μm, then showing a convex upward shape with a maximum value at D ~2–3 μm. However, differences among the PSDs exist depending on the atmospheric conditions and aerosol origin or path. For example, PBL PSDs obtained from the Yellow Sea, Seoul, Gangneung and East Sea show similar patterns with the first peaks at D < 0.3 μm and the second peaks at 2–3 μm. However, PSD shapes are slightly different from the locations regarding the maximum concentrations and size observed. For instance, PSDs obtained from Seoul (Figure 5b) show slightly higher aerosol concentrations than those obtained from Gangneung (Figure 5c), although both aerosols were obtained over the land. However, the overall shape is similar. The effect of aerosol origin and path on the PSD shape and the maximum size is discussed in Section 4.
PSDs obtained from RF04 (6 December; blue) and RF06 (10 December; red) are compared in Figure 5a,b to show the effects of atmospheric conditions (meteorology, such as clouds and precipitation) on the changes of PSDs. On both days, aerosols were sampled along the Han River (Seoul) and over the Yellow Sea. In Figure 5a, considerable differences among the PSDs exist, especially in the larger particle size regimes (D > 0.8 μm). In the PBL, PSDs on 6 December (blue) show plenty of larger-sized particles with slightly fewer smaller-sized particles than PSDs on 10 December (red). The weather system with precipitation passed by the Korean Peninsula between 6 and 9 December, resulting in no flights between those days. Figure 5a,b shows that larger particles were removed by precipitation (the scavenge effects); thus, fewer larger particles were observed on 10 December (RF06; red) than on 6 December (RF04; blue). The washout of large particles by precipitation was also shown in the PSDs observed at Seoul in Figure 5b (refer to changes from blue to orange to red). In summary, PSDs obtained from the Korean Peninsula show similar shapes, regardless of the geographical locations of the sampled aerosols. The main differences in PSDs come from whether PSDs are obtained within or above the PBL. Aerosols above the PBL are likely to be affected by continental outflows. By contrast, the characteristics of aerosols within the PBL are influenced by local aerosol sources [19], boundary layer processes [16], atmospheric conditions (Figure 5a,b; e.g., scavenging effect [29]) and the origin of the airmass in addition to continental outflows.

4. Discussion

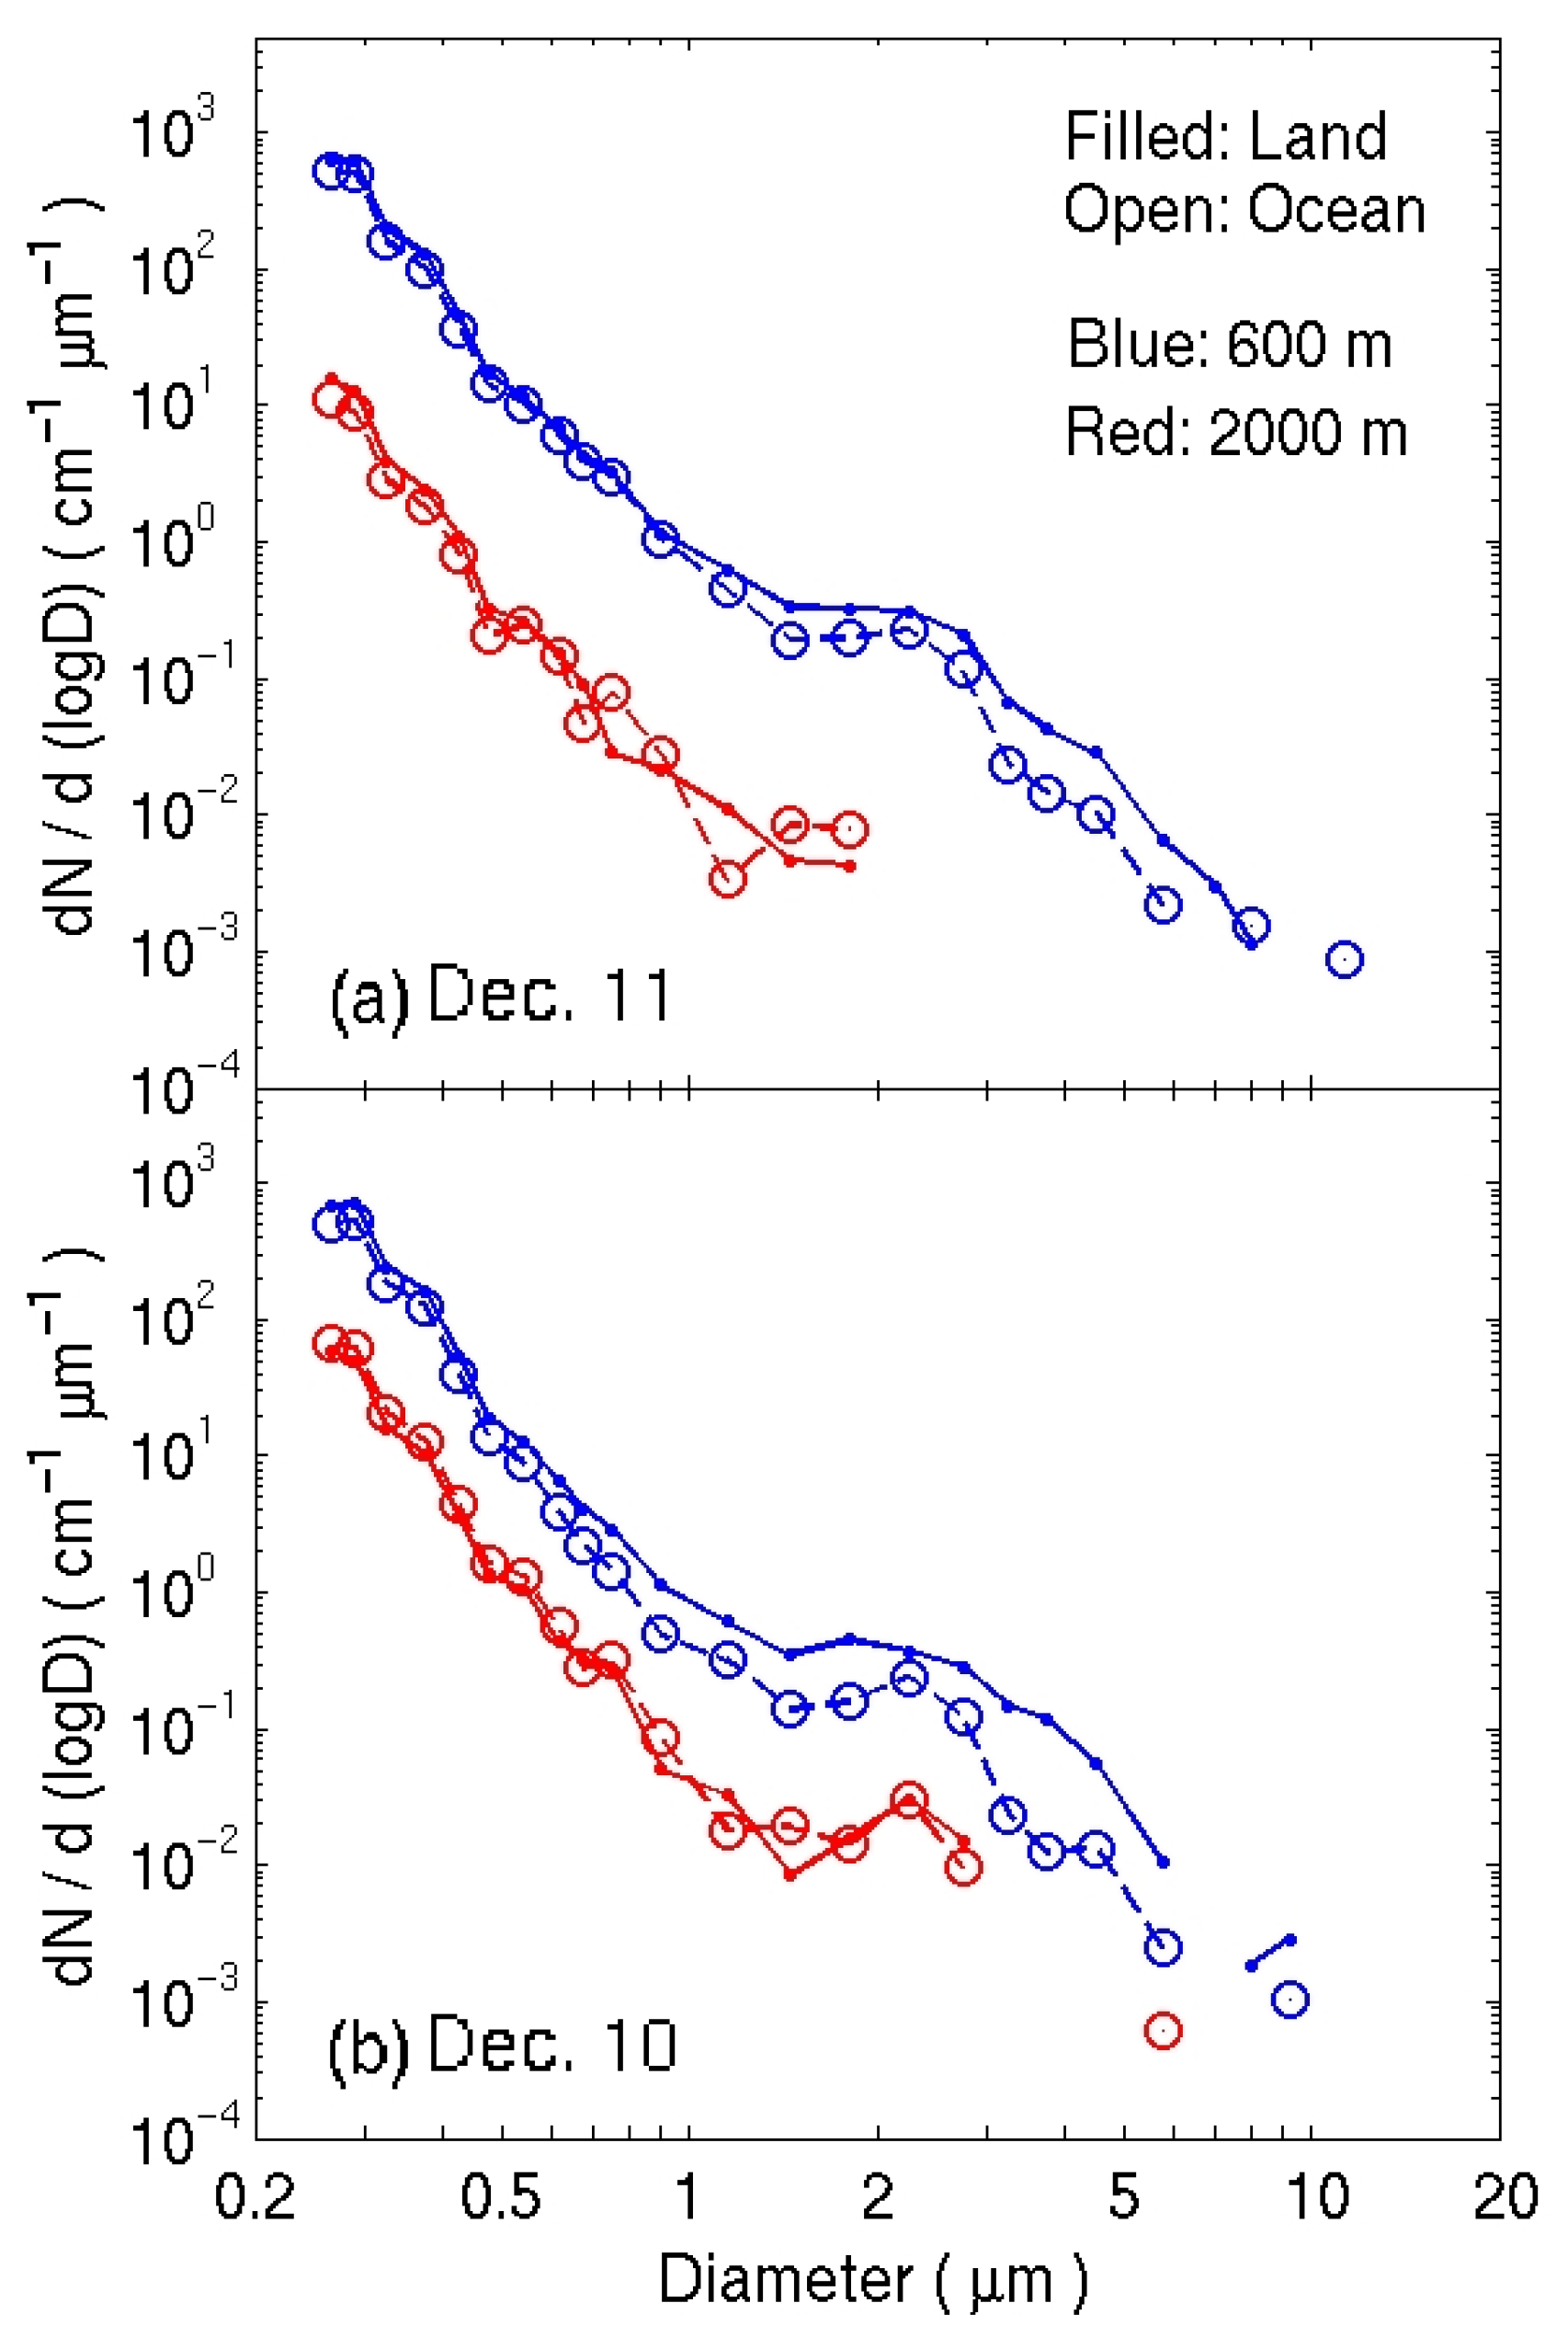
In Section 3, the overall PSD shape remains robust, except for the cases associated with the precipitation system. This section further discusses aerosol concentration and PSD differences concerning the origin and path of the airmass (over the ocean or land). Figure 6 shows PSDs on 10 and 11 December (RF07 and RF09 in Table 1). On 10 and 11 December, an aircraft undertook similar flight paths. The aircraft took off at Gimpo airport, then flew out to the Gangneung area. Over the Gangneung area, the aircraft made two sets of level-leg flights along the coastline, one over the land (Gangneung) and another over the ocean (East Sea) at the heights of 600 m and 2000 m for each side of the coastline. The flight patterns on the days are shown as magenta lines in Figure 1. The PSDs in Figure 6 were obtained from the level-leg flights near 600 m and 2000 m in the afternoon.
The 24 h back trajectories show that the airmass observed within the PBL on 11 December (Figure 2f; green solid line) originated from North Korea and stayed over the ocean for more than 12 h before arriving at Gangneung and East Sea. The airmass observed in the PBL on 10 December (Figure 2f; blue dotted) originated further northwest and traveled through the inland before arriving and was sampled at Gangneung and East Sea. Figure 6a,b show that aerosol concentrations are higher over the land (Gangneung, filled) than over the ocean (East Sea, open), regardless of its origin; both airmasses originated from northwest Korea (Figure 2f). The aerosol concentrations are related to the airmass path; concentrations are strongly related to whether the air masses stayed over the ocean or land for several hours before being sampled. In Figure 6, aerosol concentrations are lower where the airmass stayed over the ocean before being sampled. Further, larger-sized particles are observed when the airmass stayed over the ocean. Larger-sized particles over the ocean are more evident on 11 December, when the airmass stayed over the ocean in and above the PBL (at both 600 m and 2000 m) than on 10 December, when the airmass stayed over the land before being sampled.
Countries in continental outflow regions are dominantly affected by aerosols of upwind areas. A previous study has shown the east–west contrast of AOD over the Korean Peninsula with the highest AOD over China, then the Yellow Sea, followed by AOD in the middle of the Korean Peninsula, then the eastern part of Korea [21]. Reference [19] also showed that aerosol concentrations in the PBL were higher over the Yellow Sea than over the East Sea based on airborne measurements. The authors interpreted the east–west contrast of aerosols as being due to the continental outflows. On the other hand, in this study, the total aerosol Ncn within the PBL was the highest in Seoul, followed by Gangneung, East Sea and Yellow Sea. According to Figure 6, the aerosol concentrations in the PBL recorded from the ocean-leg (blue, open symbols) were lower than those from the land-leg (blue, filled symbols), even though the origins of the airmass were similar. The lower aerosol concentrations over the East Sea in previous studies [19,21] could not be relates to the continental outflows but occurred because the airmass stayed over the ocean a couple of hours before being sampled.
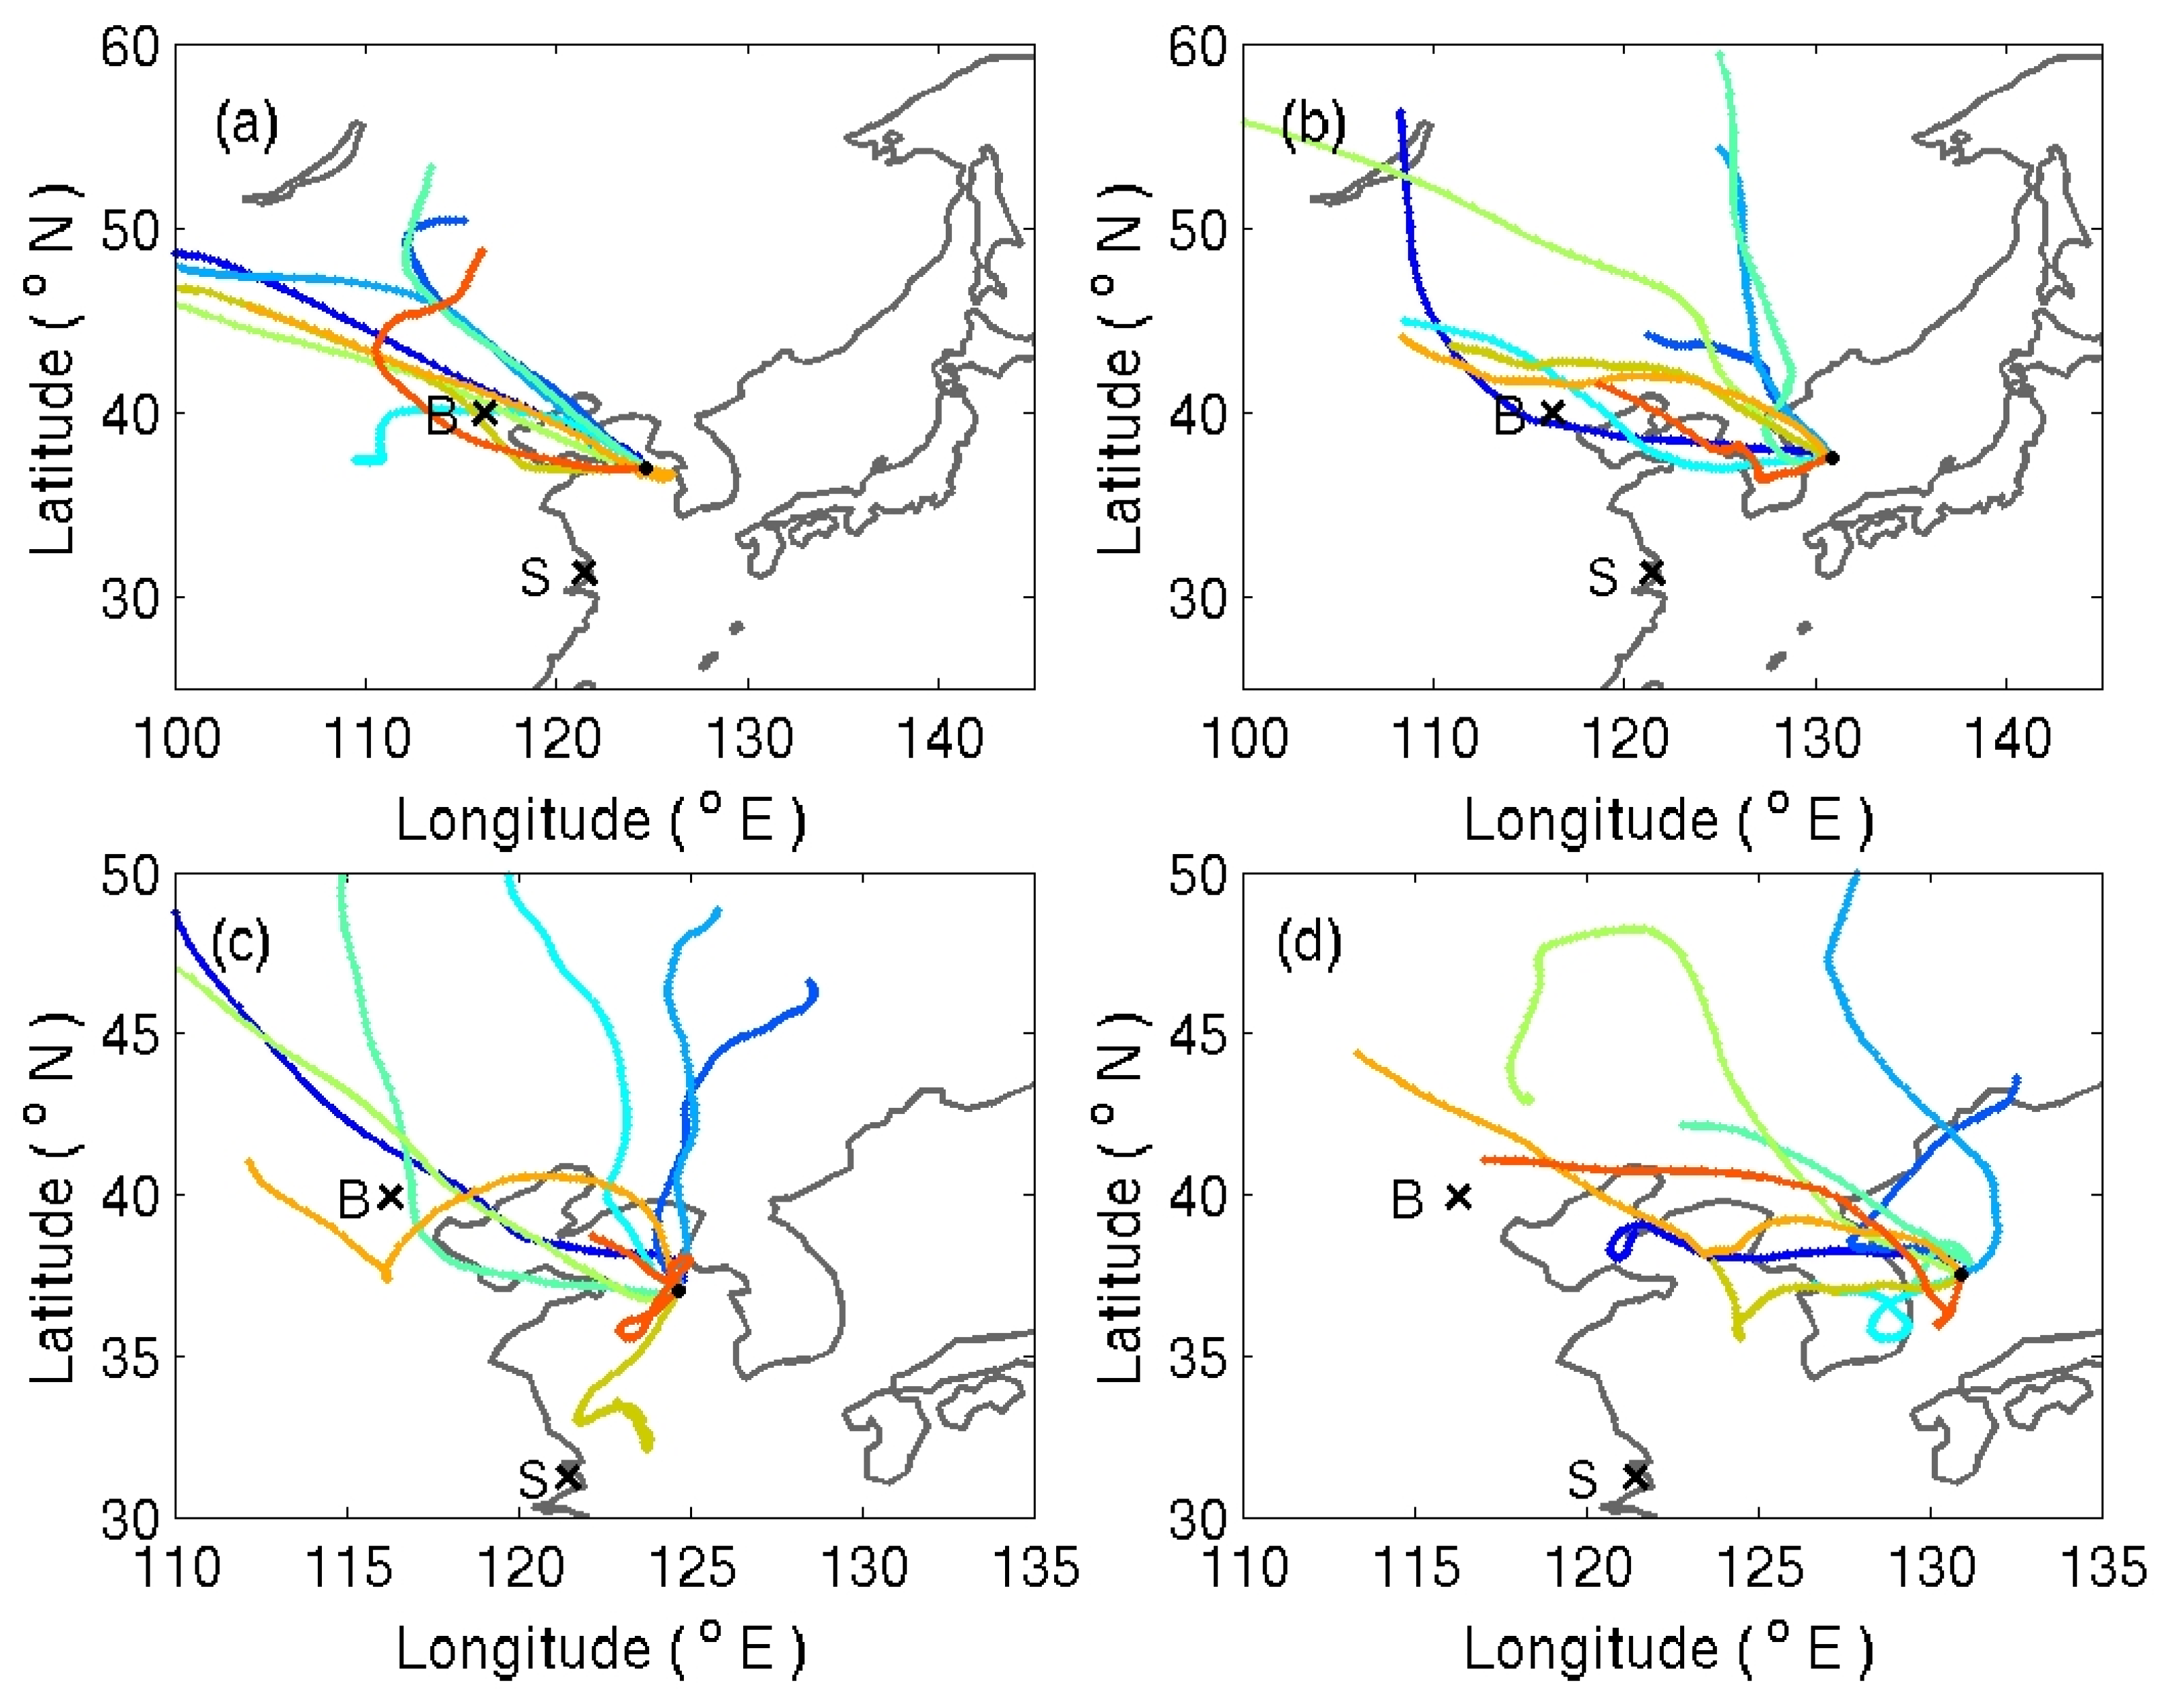
The 3-day back trajectories for the nine flights of [19] are shown in Figure 7 to examine the origin and path of the airmass. The airmasses that arrived at 3000 m over the Yellow Sea and East Sea originated from the northern part of China and passed through Beijing to reach the Korean Peninsula (Figure 7a,b). Airmasses that arrived at 500 m over the Yellow Sea and East Sea originated from a wider area of China (Figure 7c,d). For the Yellow Sea, airmasses originated in northern and southern China and arrived at 500 m over the Yellow Sea via Beijing and Shanghai (Figure 7c). Beijing and Shanghai are among the largest cities in China and they correspond to cities with high air pollution. On the other hand, the airmasses that arrived at 500 m over the East Sea originated from further north (Figure 7d). Interestingly, the airmass did not pass over Beijing or Shanghai and stayed a little longer over the sea for several hours before being sampled. Further, the surface winds over the East Sea during most of the experiment periods were easterly (not shown), indicating that aerosols over the East Sea in their study originated from the open ocean or, at least, stayed over the ocean for several hours before being sampled over the East Sea, even if the aerosols originated from China several days before.
The satellite-derived AOD is a column-integrated value. Therefore, it is expected that Korea reveals the AOD east–west gradient if the prevailing winds are westerly and the airmass originates in or passes through the polluted area during the observation. As discussed earlier, [27] showed that the airmass that caused high aerosol concentrations in Korea originated from the northern and southern parts of China (Beijing and Shanghai). Here, Beijing and Shanghai are to the west or southwest of Korea, capable of efficiently transporting aerosols to the Korean Peninsula through the westerly winds. However, the airmass originating from northeast China does not transport high aerosols to Seoul. Therefore, the east–west AOD gradients shown in a previous study could be closely related to the high aerosol transport from China to Korea via the westerly wind during the experiments, referred to as back trajectory (Figure 16 in [19]). Note that high AOD does not always guarantee high aerosol concentrations in the PBL, as aerosols originating from remote locations (China) could pass by Korea without transporting them to the ground (Figures 3 and 5 in [30]). Further, if the aerosols above PBL are transported into the PBL, they can be modified by interacting with clouds within the PBL [16]. Figure 2 shows that aerosols sampled in this study originated from northeastern China. Further, they did not pass over either Beijing or Shanghai, indicating that the high aerosol concentrations did not transport from China to the Korean Peninsula during the experiment, resulting in not showing the east–west aerosol contrast in this study.
Although the results on the Ncn are in agreement with previous results in the regions where comparable in situ measurements exist, over the Yellow and East Seas, the results of this study require caution to conclude because the number of flights analyzed here is based on nine individual flights during December 2016. Long-term continuous measurements and comprehensive observations are required for further studies.

5. Summary and Conclusions

Although East Asia is a region where diverse and extensive aerosol sources exist, limited data on aerosol properties are available, especially as a function of height above the surface. This study examined the vertical structure of aerosols in and around the Korean Peninsula from east to west. Nine flights were made in the cloud-free boundary layer between 1 and 11 December 2016. During the experiments, the Korean Peninsula was affected by a northwesterly wind and all the airmasses originated from near Lake Baikal or northeast China. Under these atmospheric conditions, the total aerosol Ncn within the PBL was the highest in Seoul, as expected (1000–10,000 cm−3), followed by Gangneung (~1000–5000 cm−3), East Sea and the Yellow Sea.
Further, aerosol concentrations obtained in the afternoons were higher than those recorded in the mornings. The higher PBL aerosol concentrations in the afternoon and over the land indicate that local aerosol sources influence the aerosols in the PBL. Aerosols obtained from relatively clean environments (Gangneung and over the oceans) are far more polluted than those obtained from typical maritime environments. PM10 in the PBL was 3–30 μg m−3 in Seoul, ~10 μg m−3 in Gangneung and less than 10 μg m−3 over the ocean. PM10 near 2000 m was 0.1–1 μg m−3. The PSD in the PBL shows similar shapes, with PSD peaks at D < 0.25 μm and D ~2–3 μm. However, subtle variations exist because of the cloud–aerosol interactions associated with precipitation and the origin and path of the airmass. Further, PSDs obtained over the ocean showed lower concentrations than aerosols over the land with a few larger-sized particles. However, the Ncn and PM10 from above the PBL did not show significant differences with geographical locations (Yellow Sea, Seoul, Gangneung, East Sea) and dates (morning versus afternoon), showing less than 300–400 cm−3. Similarly to aerosol concentrations, PSDs above the PBL did not show significant differences.
This study provides the first vertical structure of aerosols (concentration and size distribution of aerosols) over the inland of the Korean Peninsula using in situ aircraft measurement. The in situ data from this study will be used as a reference to validate the aerosol concentrations derived using lidar, satellite and models. A previous study has shown the east–west gradient of AOD across the Korean Peninsula with the aerosol concentration decreased from west to east, supported by airborne measurements over the East and Yellow Seas. However, the current study shows that the concentration of inland aerosols was the highest, followed by aerosols over the East Sea and Yellow Sea with the lowest aerosol concentrations. It should be noted that the satellite-derived AOD is a column-integrated value; thus, high AOD does not always guarantee high aerosol concentrations in the PBL. Furthermore, concentrations are strongly related to whether the air masses stayed over the ocean or land for several hours before being sampled; the longer the air mass stays over the ocean, the lower the aerosol concentration is. The results also show that aerosols sampled over the Korean Peninsula during the experiments were transported from China to Korea without passing through the polluted areas in China (e.g., Beijing and Shanghai).

Author Contributions

Conceptualization, E.J.; software, E.J.; validation, E.J. and B.-H.H.; formal analysis, E.J.; investigation, E.J.; resources, K.-H.C.; data curation, E.J. and S.S.; writing—original draft preparation, E.J.; writing—review and editing, E.J., B.-H.H. and S.-S.Y.; visualization, E.J.; supervision, E.J. and B.-H.H.; project administration, K.-H.C.; funding acquisition, E.J. All authors have read and agreed to the published version of the manuscript.

Funding

This research was supported by the Kyungpook National University Research Fund, 2018.

Institutional Review Board Statement

Not applicable.

Informed Consent Statement

Not applicable.

Acknowledgments

We thank all individuals who assisted in making the observations from the Cessna206 during the experiment. A particular note of appreciation is due to the pilots Myung-Hyun Son and Heejun Jeong of Shinhan Aerial Survey Co., LTD, and Myoung-joo Lee of Weather Vision, the onboard observer during the flights. We are in debt with the comprehensive review and constructive comments provided by the anonymous reviewers. This research was supported by the Kyungpook National University Research Fund, 2018.

Conflicts of Interest

The authors declare no conflict of interest.

References

  1. Twomey, S. The influence of pollution on the shortwave albedo of clouds. J. Atmos. Sci. 1977, 34, 1149–1152. [Google Scholar] [CrossRef] [Green Version]
  2. Albrecht, B.A. Aerosols, cloud microphysics, and fractional cloudiness. Science 1989, 245, 1227–1230. [Google Scholar] [CrossRef]
  3. Anderson, T.; Charlson, R.; Bellouin, N.; Boucher, O.; Chin, M.; Christopher, S.; Haywood, J.; Kaufman, Y.J.; Kinne, S.; Ogren, J.A.; et al. An “A-Train” strategy for quantifying direct climate forcing by anthropogenic aerosols. Bull. Am. Meteorol. Soc. 2005, 86, 1795–1809. [Google Scholar] [CrossRef]
  4. Wild, M. Global dimming and brightening: Areview. J. Geophys. Res. Atmos. 2009, 114, D00d16. [Google Scholar] [CrossRef] [Green Version]
  5. IPCC. Climate Change 2013: The physical science basis. In Contribution of Working Group I to the Fifth Assessment Report of the Intergovernmental Panel on Climate Change; Stocker, T.F., Qin, D., Plattner, G.-K., Tignor, M., Allen, S.K., Boschung, J., Nauels, A., Xia, Y., Bex, V., Midgley, P.M., Eds.; Cambridge University Press: Cambridge, UK; New York, NY, USA, 2013; p. 1535. [Google Scholar] [CrossRef] [Green Version]
  6. Schwartz, S.E.; Charlson, R.J.; Kahn, R.A.; Ogren, J.A.; Rodhe, H. Why hasn’t earth warmed as much as expected? J. Clim. 2010, 23, 2453–2464. [Google Scholar] [CrossRef] [Green Version]
  7. Ding, A.J.; Huang, X.; Nie, W.; Sun, J.N.; Kerminen, V.-M.; Petäjä, T.; Su, H.; Cheng, Y.F.; Yang, X.-Q.; Wang, M.H.; et al. Enhanced haze pollution by black carbon in megacities in China. Geophys. Res. Lett. 2016, 43, 2873–2879. [Google Scholar] [CrossRef]
  8. Prospero, J.M.; Collard, F.-X.; Molinie, J.; Jeannot, A. Characterizing the annual cycle of African dust transport to the Caribbean basin and South America and its impact on the environment and air quality. Glob. Biogeochem. Cycles 2014, 29, 757–773. [Google Scholar] [CrossRef]
  9. Holben, B.N.; Eck, T.F.; Slutsker, I.; Tanre’, D.; Buis, J.P.; Setzer, A.; Vermote, E.; Reagan, J.A.; Kaufman, Y.J.; Nakajima, T.; et al. AERONET—A federated instrument network and data archive for aerosol characterization. Rem. Sens. Environ. 1998, 66, 1–16. [Google Scholar] [CrossRef]
  10. Yum, S.S.; Hudson, J.G.; Song, K.Y.; Choi, B.-C. Springtime cloud condensation nuclei concentrations on the west coast of Korea. Geophys. Res. Lett. 2005, 32, L09814. [Google Scholar] [CrossRef]
  11. Nakajima, T.; Sekiguchi, M.; Takemura, T.; Uno, I.; Higurashi, A.; Kim, D.; Sohn, B.J.; Oh, S.-N.; Nakajima, T.Y.; Ohta, S.; et al. Significance of direct and indirect radiative forcings of aerosols in the East China Sea region. J. Geophys. Res. 2003, 108, 8658. [Google Scholar] [CrossRef]
  12. Wang, Z.; Wu, Z.; Yue, D.; Shang, D.; Guo, S.; Sun, J.; Ding, A.; Wang, L.; Jiang, J.; Guo, H.; et al. New particle formation in China: Current knowledge and further directions. Sci. Total. Environ. 2017, 577, 258–266. [Google Scholar] [CrossRef] [Green Version]
  13. Loeb, N.G.; Schuster, G.L. An observational study of the relationship between cloud, aerosol and meteorology in broken low level cloud conditions. J. Geophys. Res. 2008, 113, D14214. [Google Scholar] [CrossRef] [Green Version]
  14. Welton, E.J.; Voss, K.J.; Gordon, H.R.; Maring, H.; Smirnov, A.; Holben, B.; Schmid, B.; Livingston, J.M.; Durkee, P.A.; Formenti, P.; et al. Ground-based lidar measurements of aerosols during ACE-2: Instrument description, results, and comparisons with other ground-based and airborne measurements. Tellus 2000, 52B, 636–651. [Google Scholar] [CrossRef] [Green Version]
  15. Seinfeld, J.H.; Carmichael, G.R.; Arimoto, R.; Conant, W.C.; Brechtel, F.J.; Bates, T.S.; Cahill, T.A.; Clarke, A.D.; Doherty, S.J.; Flatau, P.J.; et al. ACE-Asia: Regional climatic and atmospheric chemical effects of Asian dust and pollution. Bull. Amer. Meteorol. Soc. 2004, 85, 367–380. [Google Scholar] [CrossRef]
  16. Jung, E.; Albrecht, B.A.; Prospero, J.M.; Jonsson, H.H.; Kreidenweis, S.M. Vertical structure of aerosols, temperature and moisture associated with an intense African dust event observed over the Eastern Caribbean. J. Geophys. Res. 2013, 118, 4623–4643. [Google Scholar] [CrossRef]
  17. Yum, S.S.; Roberts, G.; Kim, J.H.; Song, K.; Kim, D. Sub-micron aerosol size distributions and cloud condensation nuclei concentrations measured at Gosan, Korea, during the Atmospheric Brown Clouds-East Asian Regional Experiment 2005. J. Geophys. Res. 2007, 112, D22S32. [Google Scholar] [CrossRef]
  18. Kim, J.H.; Yum, S.S.; Shim, S.; Yoon, S.-C.; Hudson, J.G.; Park, J.; Lee, S.-J. On aerosol hygroscopicity, cloud condensation nuclei (CCN) spectra and critical supersaturation measured at two remote islands of Korea between 2006 and 2009. Atmos. Chem. Phys. 2011, 11, 12627–12645. [Google Scholar] [CrossRef] [Green Version]
  19. Kim, J.H.; Yum, S.S.; Shim, S.; Kim, W.J.; Park, M.; Kim, J.-H.; Kim, M.-H.; Yoon, S.-C. On the submicron aerosol distributions and CCN number concentrations in and around the Korean Peninsula. Atmos. Chem. Phys. 2014, 14, 8763–8779. [Google Scholar] [CrossRef] [Green Version]
  20. Kim, J.H.; Yum, S.S.; Lee, Y.-G.; Choi, B.-C. Ship measurements of submicron aerosol size distributions over the Yellow Sea and the East China Sea. Atmos. Res. 2009, 93, 700–714. [Google Scholar] [CrossRef]
  21. Kim, Y.J.; Lee, J.H.; Kim, B.-G. An analysis of aerosol-cloud relationship using MODIS and NCEP/NCAR reanalysis data around Korea. J. Korean Soc. Atmos. Environ. 2011, 27, 152–167. (in Korean). [Google Scholar] [CrossRef]
  22. Kim, M.-H.; Yeo, H.; Sugimoto, N.; Lim, H.-C.; Lee, C.-K.; Heo, B.-H.; Yu, Y.-S.; Sohn, B.-J.; Yoon, S.-C.; Kim, S.-W. Estimation of particle mass concentration from lidar measurement. Atmosphere 2015, 25, 169–177. (in Korean). [Google Scholar] [CrossRef] [Green Version]
  23. Huebert, B.J.; Bates, T.; Russell, P.B.; Shi, G.; Kim, Y.J.; Kawamura, K.; Carmichael, G.; Nakajima, T. An overview of ACE-Asia: Strategies for quantifying the relationships between Asian aerosols and their climatic impacts. J. Geophys. Res. 2003, 108, 8633. [Google Scholar] [CrossRef] [Green Version]
  24. Clarke, A.; Kapustin, V. Hemispheric aerosol vertical profiles: Anthropogenic impacts on optical depth and cloud nuclei. Science 2010, 329, 1488–1492. [Google Scholar] [CrossRef] [PubMed]
  25. Stull, R.B. An Introduction to Boundary Layer Meteorology; Kluwer Academic: Norwell, MA, USA, 1988; 666p. [Google Scholar]
  26. Rogers, R.R.; Yau, M.K. A Short Course in Cloud Physics, 3rd ed.; International Series in Natural Philosophy: Oxford, UK, 1989; 290p. [Google Scholar]
  27. Shi, H.; Lee, S.S.; Chun, H.W.; Song, H.J.; Noh, Y.C.; Sohn, B.J. Optical properties of aerosols related to haze events over Seoul inferred from Skyradiometer and satellite-borne measurements. Atmosphere 2016, 26, 289–299. [Google Scholar] [CrossRef] [Green Version]
  28. Chun, Y.; Kim, J.; Choi, J.-C.; Shin, D.-S. The Characteristics of the Aerosol Number Concentration Observed in Seoul and Anmyondo During an Yellow Sand Phenomenon. J. KOSAE 1999, 15, 575–586. [Google Scholar]
  29. Guo, S.; Hu, M.; Zamora, M.L.; Peng, J.; Shang, D.; Zheng, J.; Du, Z.; Wu, Z.; Shao, M.; Zeng, L.; et al. Elucidating severe urban haze formation in China. Proc. Natl. Acad. Sci. USA 2014, 111, 17373–17378. [Google Scholar] [CrossRef] [PubMed] [Green Version]
  30. Jung, E.; Albrecht, B.A.; Feingold, G.; Jonsson, H.H.; Chuang, P.; Donaher, S.L. Aerosols, clouds, and precipitation in the North Atlantic trades observed during the Barbados aerosol cloud experiment—Part 1: Distributions and variability. Atmos. Chem. Phys. 2016, 16, 8643–8666. [Google Scholar] [CrossRef] [Green Version]
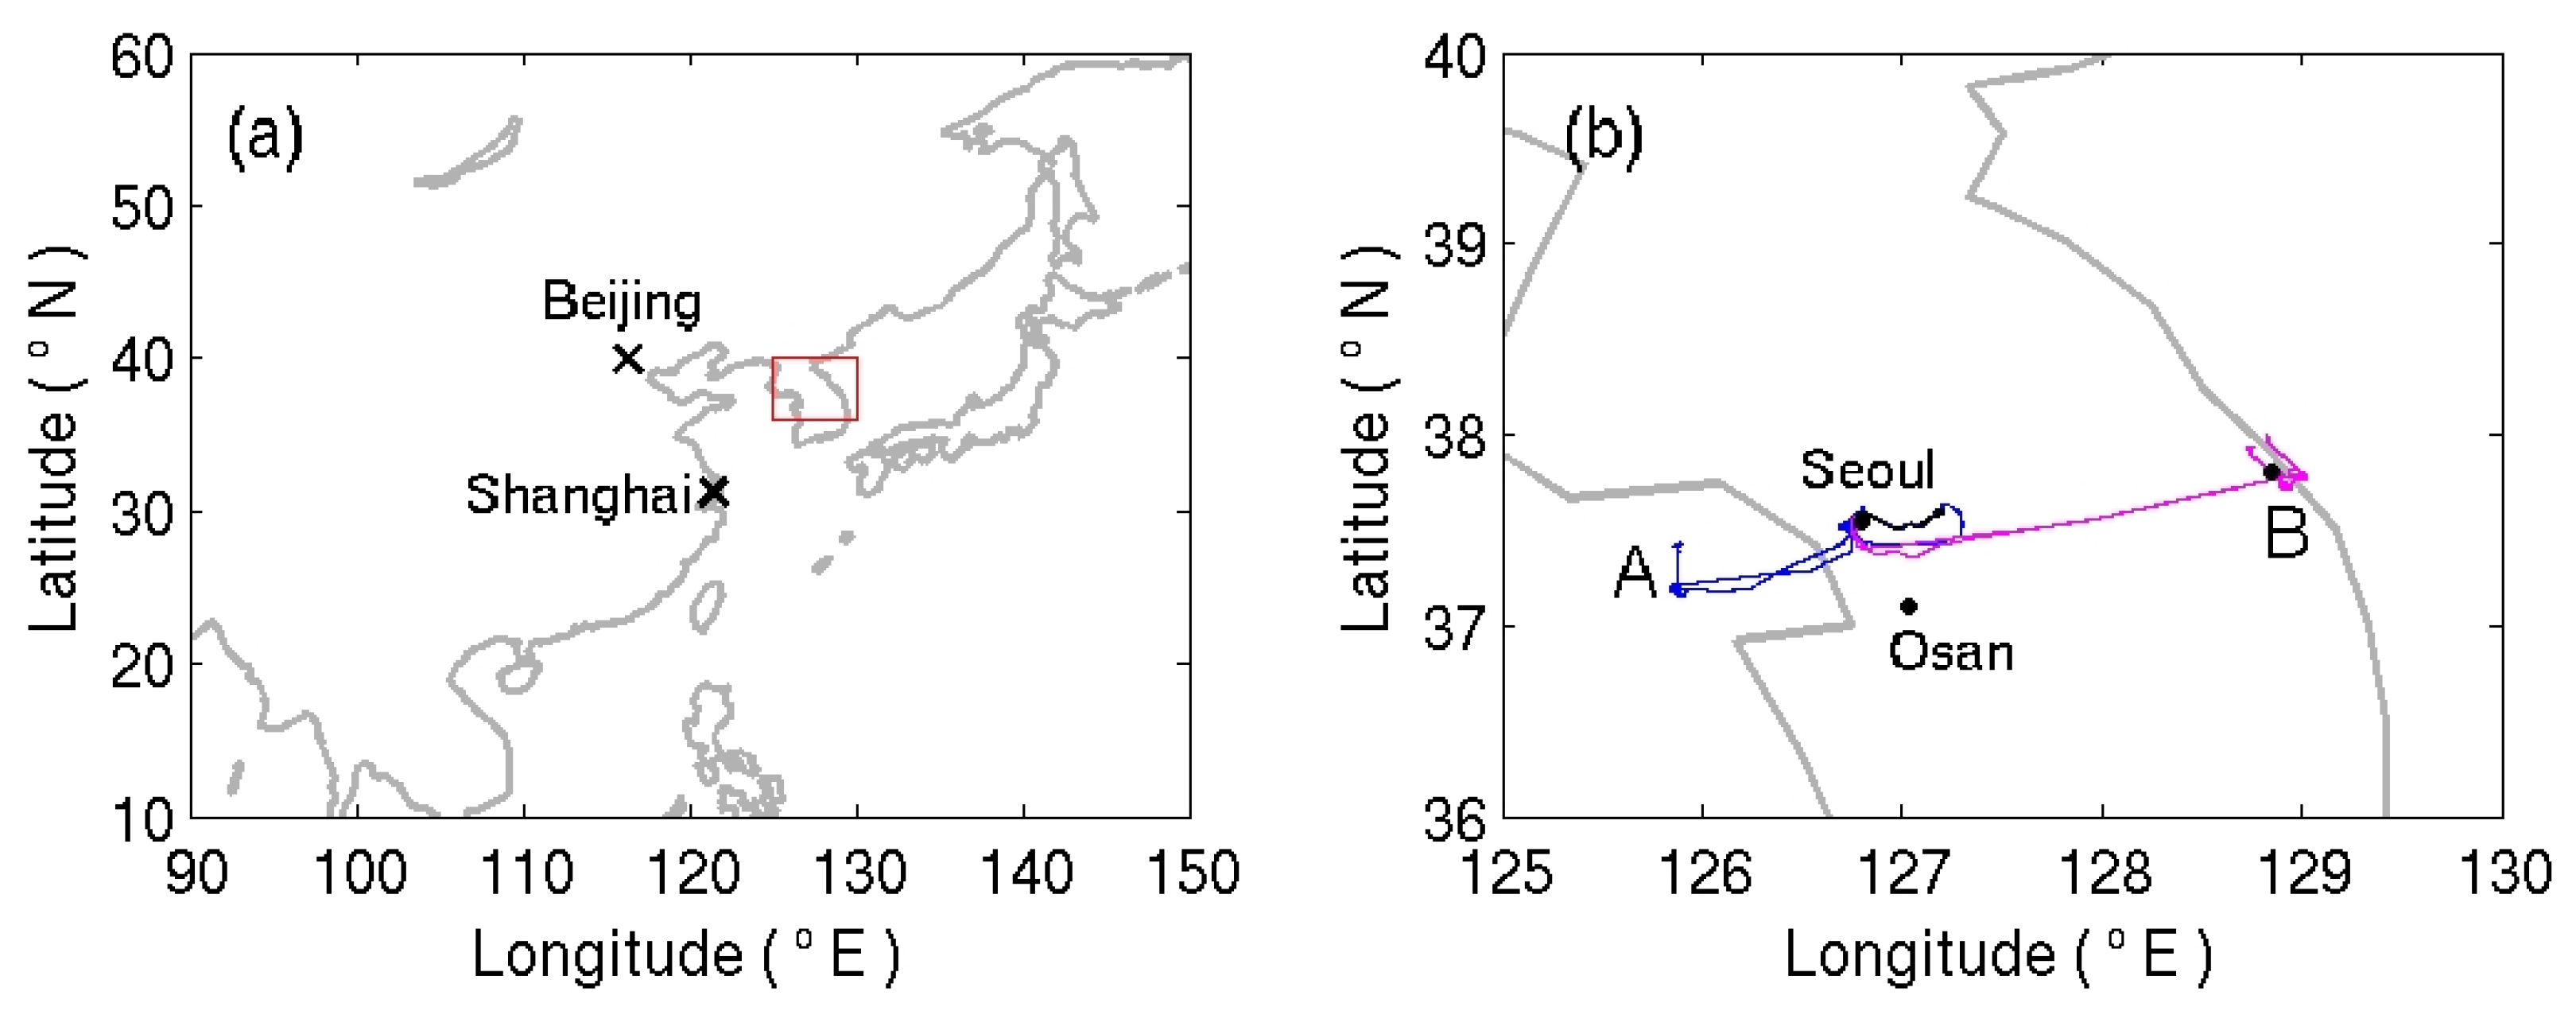
Figure 1. (a) Geographical locations of an experimental area with (b) an enlarged area of the Korean Peninsula. A and B in (b) show the Yellow Sea and Gangneung roughly, respectively. In (b), the blue lines indicate the flight patterns for the Yellow Sea and Seoul and magenta lines indicate the flight patterns for the Gangneung area parallel to the coastline. The black line in (b) shows the Han River, which flows across Seoul, the capital of South Korea. Seoul and upper-sounding locations (Osan and Bukgangneung) are overlaid as black dots in (b).
Atmosphere 12 01299 g001
Figure 2. A 24 h back trajectory of airmass arriving at 2000 m (ac) and 500 m (de) over the Yellow Sea (a,d), Seoul (b,e) and Gangneung (c,f). The heights of 500 m and 2000 m represent the heights within and above the PBL, respectively. Each symbol indicates 6 h marks. X denotes Beijing.
Atmosphere 12 01299 g002
Figure 3. Vertical profiles of (a) potential temperature and (b) wind direction at Osan 06 UTC and (c) wind direction at Bukgangneung 00 UTC. Each profile was obtained from the day of flight in Seoul and Gangneung.
Atmosphere 12 01299 g003
Figure 4. The vertical structure of total number concentration (Ncn, cm−3) and PM10 (μg m−3) obtained from the Yellow Sea, Seoul, Gangneung and East Sea. (ad) indicate Ncn and (eh) represent PM10. Individual dots indicate the mean value of Ncn and PM10 obtained at constant heights (level-leg flights). The vertical lines connect aerosols obtained from level-leg flights. The horizontal bar represents standard deviation. Gangneung and East Sea flights were made along the coastline, 10 km apart (Figure 1). The colors are the same as those shown in back trajectories in Figure 2. For example, the blue circles with dashed lines in Figure 4a indicate Ncn obtained on 6 December AM flight.
Atmosphere 12 01299 g004
Figure 5. Particle size distributions (PSD) obtained from the (a) Yellow Sea, (b) Seoul, (c) Gangneung and (d) East Sea. Individual lines represent PSDs calculated from level-leg flights within and above the PBL. For example, PSDs on 6 December within and above PBL were obtained from 661 m and 1903 m, respectively.
Atmosphere 12 01299 g005
Figure 6. The particle size distributions at 600 m (blue) and 2000 m (red) off Gangneung (land) and East Sea (Ocean) on (a) 11 December and (b) 10 December. The filled and open symbols represent the aerosols obtained from land-legs (Gangneung) and ocean-legs (over the East Sea).
Atmosphere 12 01299 g006
Figure 7. A 3-day back trajectory of airmass arriving at 2000 m (a,b) and 500 m (c,d) over the Yellow Sea (a,c) and East Sea (b,d) for the nine flights in [19]. The figures were created by the author. The 500 m and 2000 m were chosen to represent the heights within and above the PBL, respectively. The same color was used for the same flight.
Atmosphere 12 01299 g007
Table 1. Flight Summary.
RF No.DateTime (LST) HH:MMMain Flight AreaPath No.Note
11 December 201615:13–16:32Seoul3Two layers along the Han River
Flight was made across the coastline
22 December 201609:36–12:44Gangneung1Flight was made across the coastline
32 December 201613:51–18:13Gangneung1RF was made along the Han River (the lowest level only), then flew to the Gangneung area (across the coastline)
46 December 20167:47–11:35Yellow Sea, Seoul3Three layers along the Han River
59 December 201614:22–16:12Seoul3Three layers along the Han River
610 December 20167:56–11:37Yellow Sea, Seoul3Three layers along the Han River
710 December 201613:37–16:21Gangneung2RF was made along the Han River (the lowest level), then flew to the Gangneung area (parallel to the coastline)
811 December 20167:45–11:22Gangneung2RF was made along the Han River (the lowest level), then flew to the Gangneung area (parallel to the coastline)
911 December 201612:51–16:39Gangneung2Parallel to the coastline
RF indicates research flight. Path 1: Flew to Gangneung and sampled aerosols across the coastline at three constant heights. Path 2: Flew to Gangneung and sampled aerosols parallel to the coastline at three constant heights over the land and ocean, respectively. Path 3: Flew along the Han River or flew to the Yellow Sea and sampled aerosols along the Han River. Flights sampled aerosols at two constant heights over the Yellow Sea and 2–3 heights along the Han River.
Table 2. The mean of Ncn and PM10 for the level-leg flights shown in Figure 4.
LocationFigure 4 (Colors)DateHeight (m)NCN (cm−3)PM10 (μg m−3)
Yellow Sea(a) and (e)blue dashed6 December AM661.2 ± 966.21143.1 ± 642.86.37 ± 2.34
1903.0 ± 76.7585.6 ± 12.120.49 ± 0.14
red solid10 December AM431.6 ± 6.08288.2 ± 103.898.51 ± 3.52
1866.5 ± 8.07299.88 ± 356.030.42 ± 0.08
Seoul(b) and (f)sky solid1 December PM738.8 ± 19.87773.0 ± 770.814.6 ± 3.16
1738.1 ± 14.12935.4 ± 1872.66.01 ± 3.33
blue dashed6 December AM406.8 ± 465.965335.1 ± 752.916.27 ± 3.90
1413.1 ± 29.6277.2 ± 18.390.86 ± 0.79
2363.5 ± 10.7796.7 ± 8.710.13 ± 0.08
cooper solid9 December PM722.8 ± 10.392785.7 ± 693.425.69 ± 4.28
1454.2 ± 13.56299.6 ± 252.42.35 ± 2.69
2384.4 ± 19.4276.6 ± 12.100.95 ± 0.19
red solid10 December AM708.4 ± 47.281231.3 ± 1089.47.35 ± 5.37
1428.5 ± 9.19457.8 ± 24.30.60 ± 0.13
2359.0 ± 6.72387.6 ± 22.80.11 ± 0.03
grey2 December PM721.8 ± 9.335498.3 ± 1507.014.83 ± 3.27
grey10 December PM707.5 ± 8.394313.3 ± 2410.419.5 ± 13.37
grey11 December AM718.6 ± 21.47464.98 ± 97.03.60 ± 0.73
Gangneung(c) and (g)blue dashed dot10 December PM427.5 ± 7.033926.7 ± 545.09.9 ± 2.03
1910.3 ± 8.87243.7 ± 109.140.68 ± 0.55
cooper11 December AM595.8 ± 9.50862.85 ± 50.666.41 ± 1.02
1909.4 ± 5.41141.15 ± 377.40.07 ± 0.10
green11 December PM580.4 ± 9.735084.6 ± 381.648.245 ± 1.46
1937.5 ± 9.98136.2 ± 21.270.16 ± 0.08
East Sea(d) and (h)blue dashed dot10 December PM426.4 ± 8.181581.7 ± 620.726.33 ± 1.32
1906.9 ± 11.53306.98 ± 150.510.77 ± 0.72
green dot11 December PM607.4 ± 430.592446.0 ± 430.606.45 ± 1.27
Publisher’s Note: MDPI stays neutral with regard to jurisdictional claims in published maps and institutional affiliations.