Article

Study of Atmospheric Pollution and Health Risk Assessment: A Case Study for the Sharjah and Ajman Emirates (UAE)

1
College of Natural and Health Sciences, Zayed University, Abu Dhabi P.O. Box 144534, United Arab Emirates
2
Faculty of Civil Engineering, Transilvania University of Brasov, 2 Turnului Street, 500025 Brasov, Romania
3
SC Utilnavorep SA, 900055 Constanta, Romania
*
Authors to whom correspondence should be addressed.
Atmosphere 2021, 12(11), 1442; https://doi.org/10.3390/atmos12111442
Submission received: 12 September 2021 / Revised: 24 October 2021 / Accepted: 27 October 2021 / Published: 1 November 2021
(This article belongs to the Special Issue Assessing Atmospheric Pollution and Its Impacts on the Human Health)

Abstract

:
Dust is a significant pollution source in the United Arab Emirates (UAE) that impacts population health. Therefore, the present study aims to determine the concentration of heavy metals (Cd, Pb, Cr, Cu, Ni, and Zn) in the air in the Sharjah and Ajman emirates’ urban areas and assesses the health risk. Three indicators were used for this purpose: the average daily dose (ADD), the hazard quotient (HQ), and the health index (HI). Data were collected during the period April–August 2020. Moreover, the observation sites were clustered based on the pollutants’ concentration, given that the greater the heavy metal concentration is, the greater is the risk for the population health. The most abundant heavy metal found in the atmosphere was Zn, with a mean concentration of 160.30 mg/kg, the concentrations of other metals being in the following order: Ni > Cr > Cu > Pb > Cd. The mean concentrations of Cd, Pb, and Cr were within the range of background values, while those of Cu, Ni, and Zn were higher than the background values, indicating anthropogenic pollution. For adults, the mean ADD values of heavy metals decreased from Zn to Cd (Zn > Ni > Cr > Cu > Pb > Cd). The HQ (HI) suggested an acceptable (negligible) level of non-carcinogenic harmful health risk to residents’ health. The sites were grouped in three clusters, one of them containing a single location, where the highest concentrations of heavy metals were found.

1. Introduction

Heavy metals are the most common and hazardous chemicals in the environment due to their toxicity, persistence, and bioaccumulation [1,2]. Even at low concentrations, heavy metals (lead (Pb), chromium (Cr), nickel (Ni), arsenic (As), mercury (Hg), cadmium (Cd), cobalt (Co), zinc (Zn), and copper (Cu)) are known for their high toxicity [3]. These pollutants originate from anthropogenic and natural processes [4].
Anthropogenic processes that lead to the release of heavy metals and other pollutants include industrial, agricultural, mining, and metallurgical activities. Automobile exhaust, smelting, insecticides, and fossil burning are activities that contribute significantly to environmental pollution with heavy metals, e.g., lead, arsenic, copper, zinc, nickel, vanadium, mercury, selenium, and tin [4]. On the other hand, sources of natural emissions of these metals include sea-salt sprays, volcanic eruptions, forest fires, and wind-borne soil particles.
Rock-weathering is another source of heavy metals released into the atmosphere [5]. Several studies demonstrated that high levels of heavy metals result from natural emissions and vehicles’ exhaust in the traffic [6,7].
A significant ecological and public health concern is associated with the environmental contamination and heavy metals’ ultimate toxic effect [8,9,10,11,12,13,14,15]. Although many heavy metals are essential micronutrients necessary for various biochemical and physiological processes and functions [8], excessive exposure to these agents results in a wide range of adverse health effects and diseases [16]. Each metal has a distinctive toxicological profile and action mechanism. These toxicological effects depend on exposed individuals’ age, gender, genetics, and nutritional status. Limiting access to arsenic, cadmium, chromium, lead, and mercury is a health priority given their systemic toxicity and carcinogenic effect on the population [17].
The rapid economic and industrial development in the United Arab Emirates (UAE) has markedly impacted the country’s air quality, where gases and dust are being emitted into the air in exceedingly high concentrations, rendering air pollution a critical public health problem [18,19,20,21]. Recent studies have demonstrated that road dust is a significant source of air pollution with heavy metals [21,22,23] and is a leading factor affecting human health [21,24,25]. Indeed, in the UAE, results of ecological risk assessments showed that Cd and Hg in road dust constitute a high public health risk [12,18]. The primary sources of heavy metal in road dust are soil materials, vehicle exhaust emissions, atmospheric deposition, and industrial and commercial activities [26,27,28]. The vehicles’ emissions—including a complex mixture of metals from tires, brakes, parts wear and tear, and suspended road dust—are perhaps the most important source of air pollution with heavy metals [21,26,29,30,31,32] in urban areas. Long-term inhalation, ingestion, and dermal contact of these factors are associated with a wide range of acute or chronic health adverse effects [24,26] by their accumulation in the vital organs, such as the brain, liver, bones, and kidneys [33,34].
Copper is a nutrient for humans, but exposure to high concentrations can produce diseases, as Taylor et al. [35] presented in their reviews on the literature about the effects of Cu on human health. Pb is regarded as a mutagen and probable carcinogen, producing renal tumors and disturbing the reproductive and nervous systems [36]. Exposure to increased concentration of Zn has toxic effects, rarely resulting in intoxication and interferring with Cu uptake [37]. The health effects produced by Ni can be cardiovascular diseases, contact dermatitis, respiratory diseases (respiratory tract cancer, lung fibrosis, and asthma) [38,39]. Inhalation and ingestion of contaminated food and water are the main ways of introducing Ni to the organism [40]. Cadmium is a toxic metal for the population and animals, deposited in the environment by agricultural and industrial pollution [41]. Its accumulation in the human body through inhalation and ingestion provokes different types of cancer. The primary way chromium (especially in the form of Cr(III) and Cr(VI)) enters the organism is through inhalation [42], affecting the respiratory tract by producing rhinitis, pharyngitis, bronchitis.
Therefore, the present study was performed to determine the levels of heavy metals in the road dust from urban areas in the Sharjah and Ajman emirates (UAE) and to evaluate these agents’ impact on public health. Clustering the observation sites (based on the studied metals’ concentrations in the atmospheric dust and health indicators) was performed to determine the most polluted zones and those with the highest risk for the population.

2. Materials and Methods
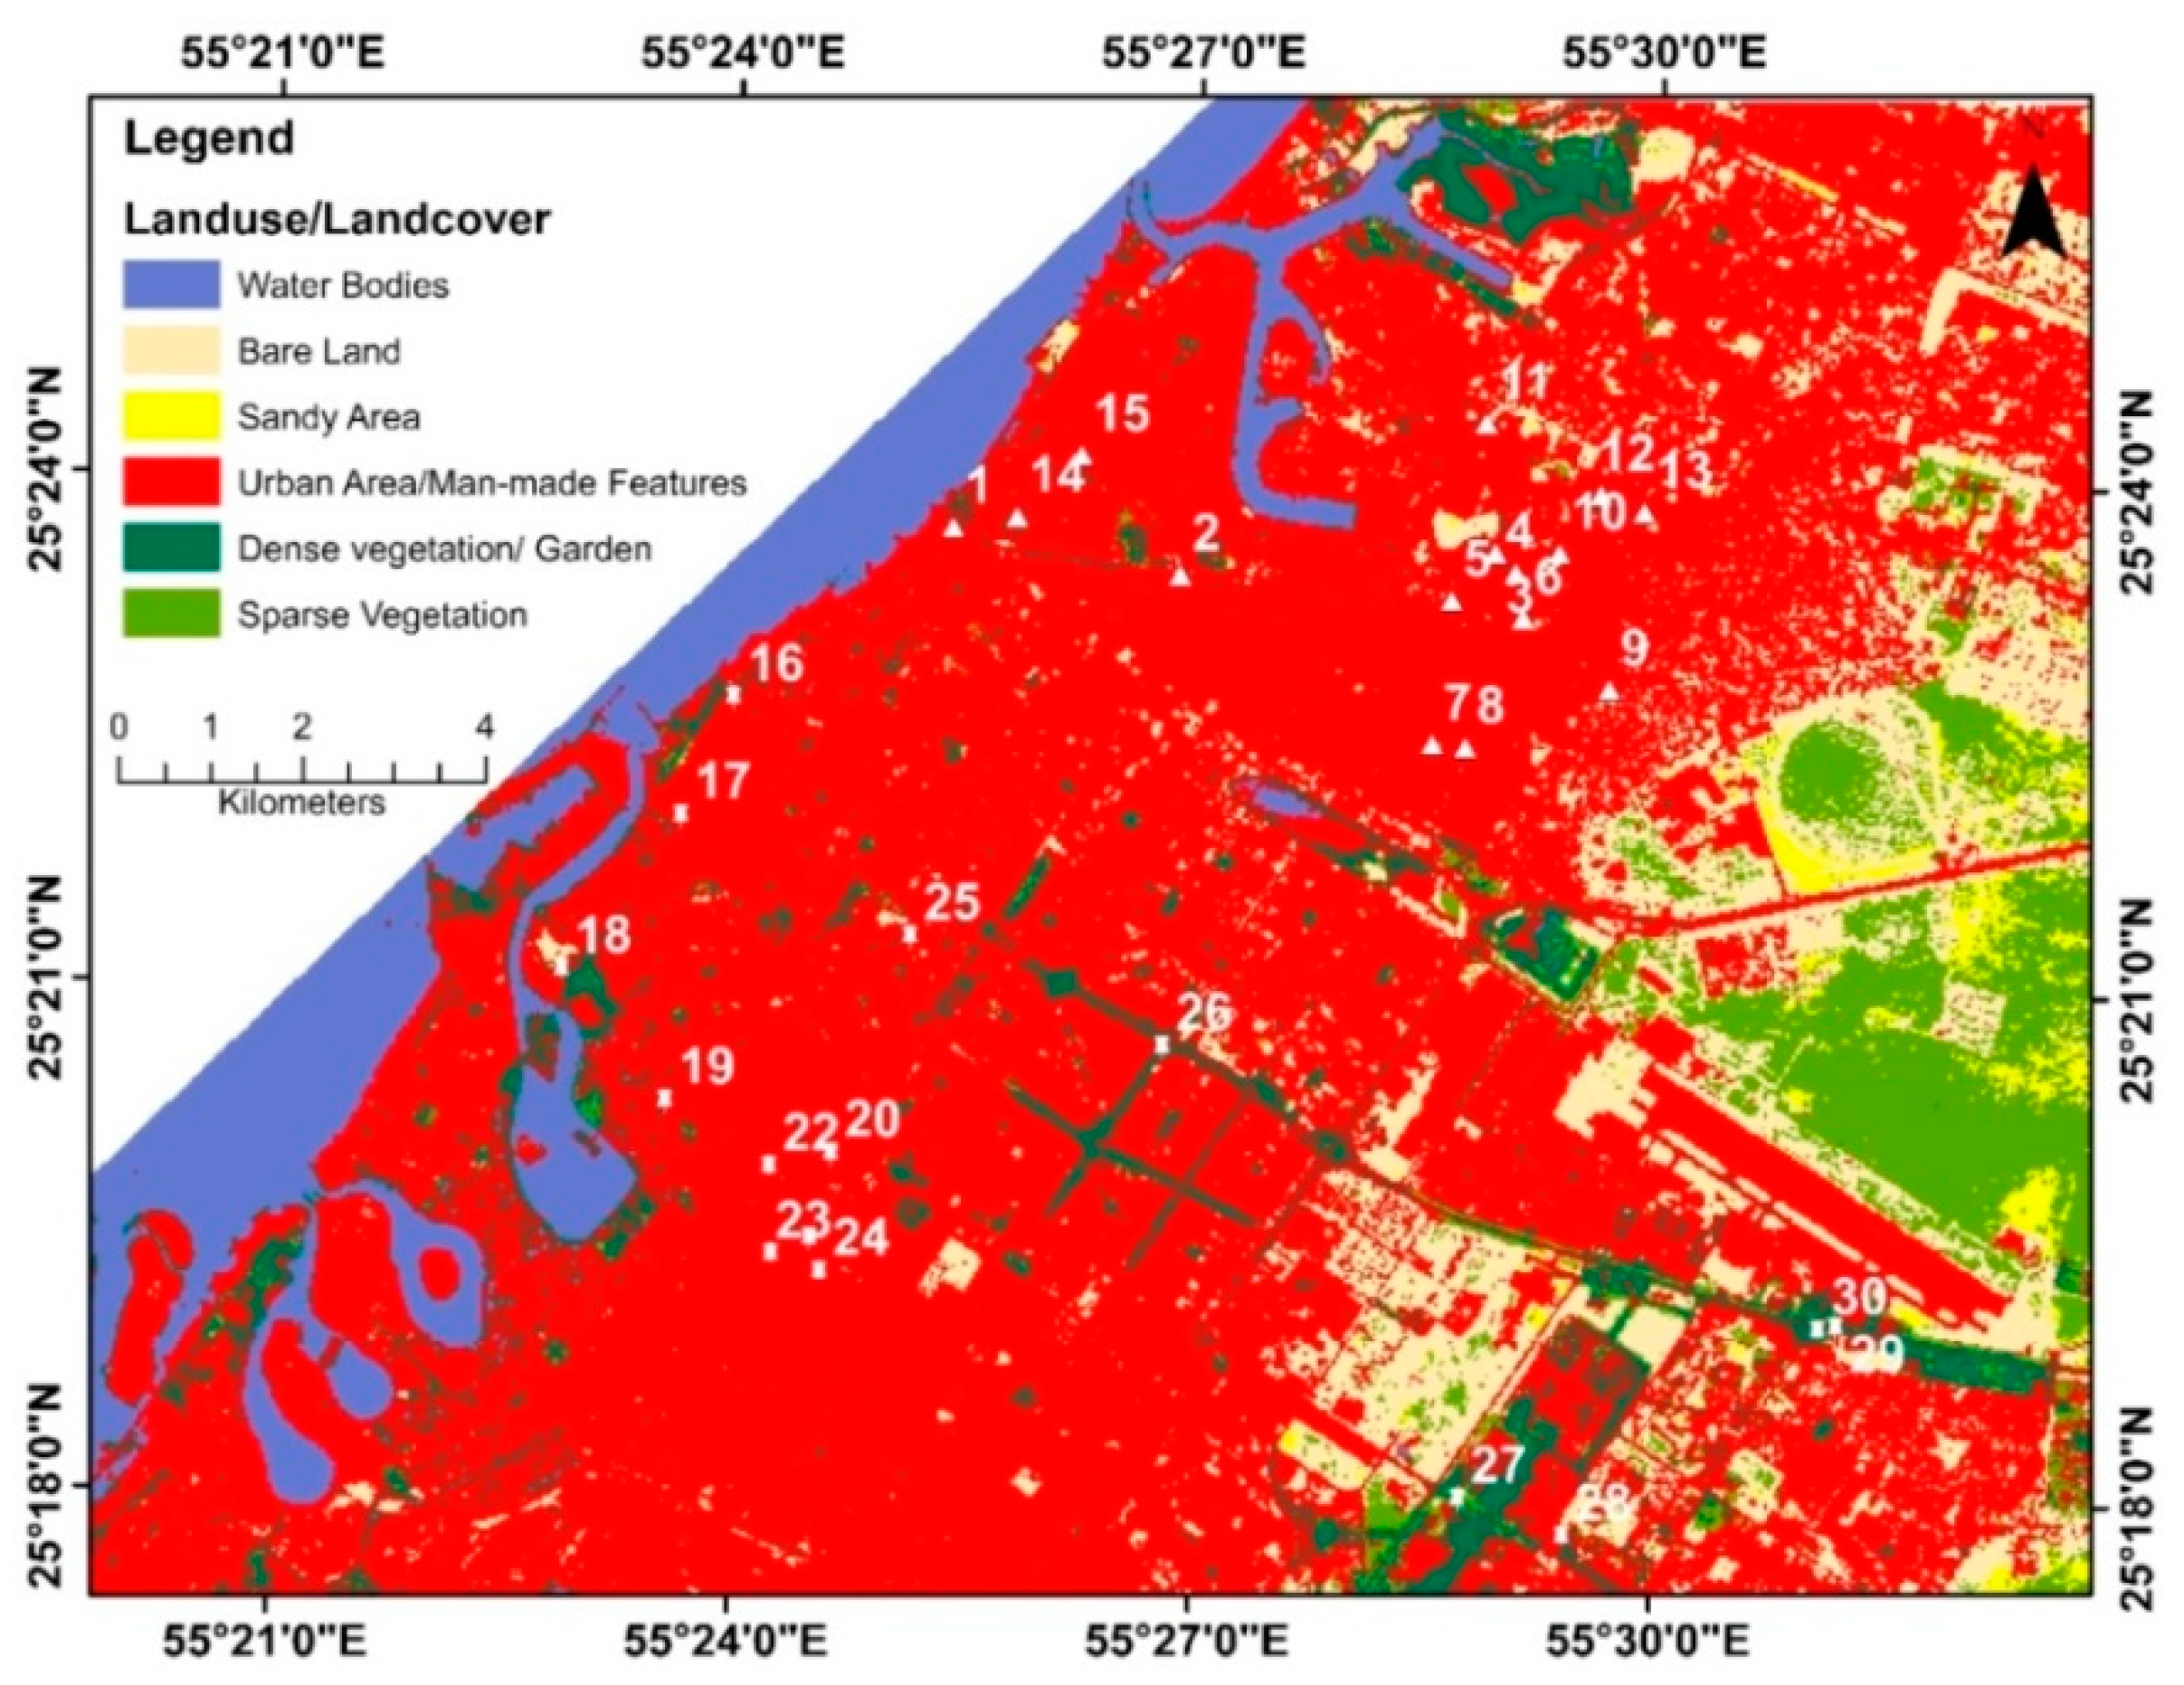
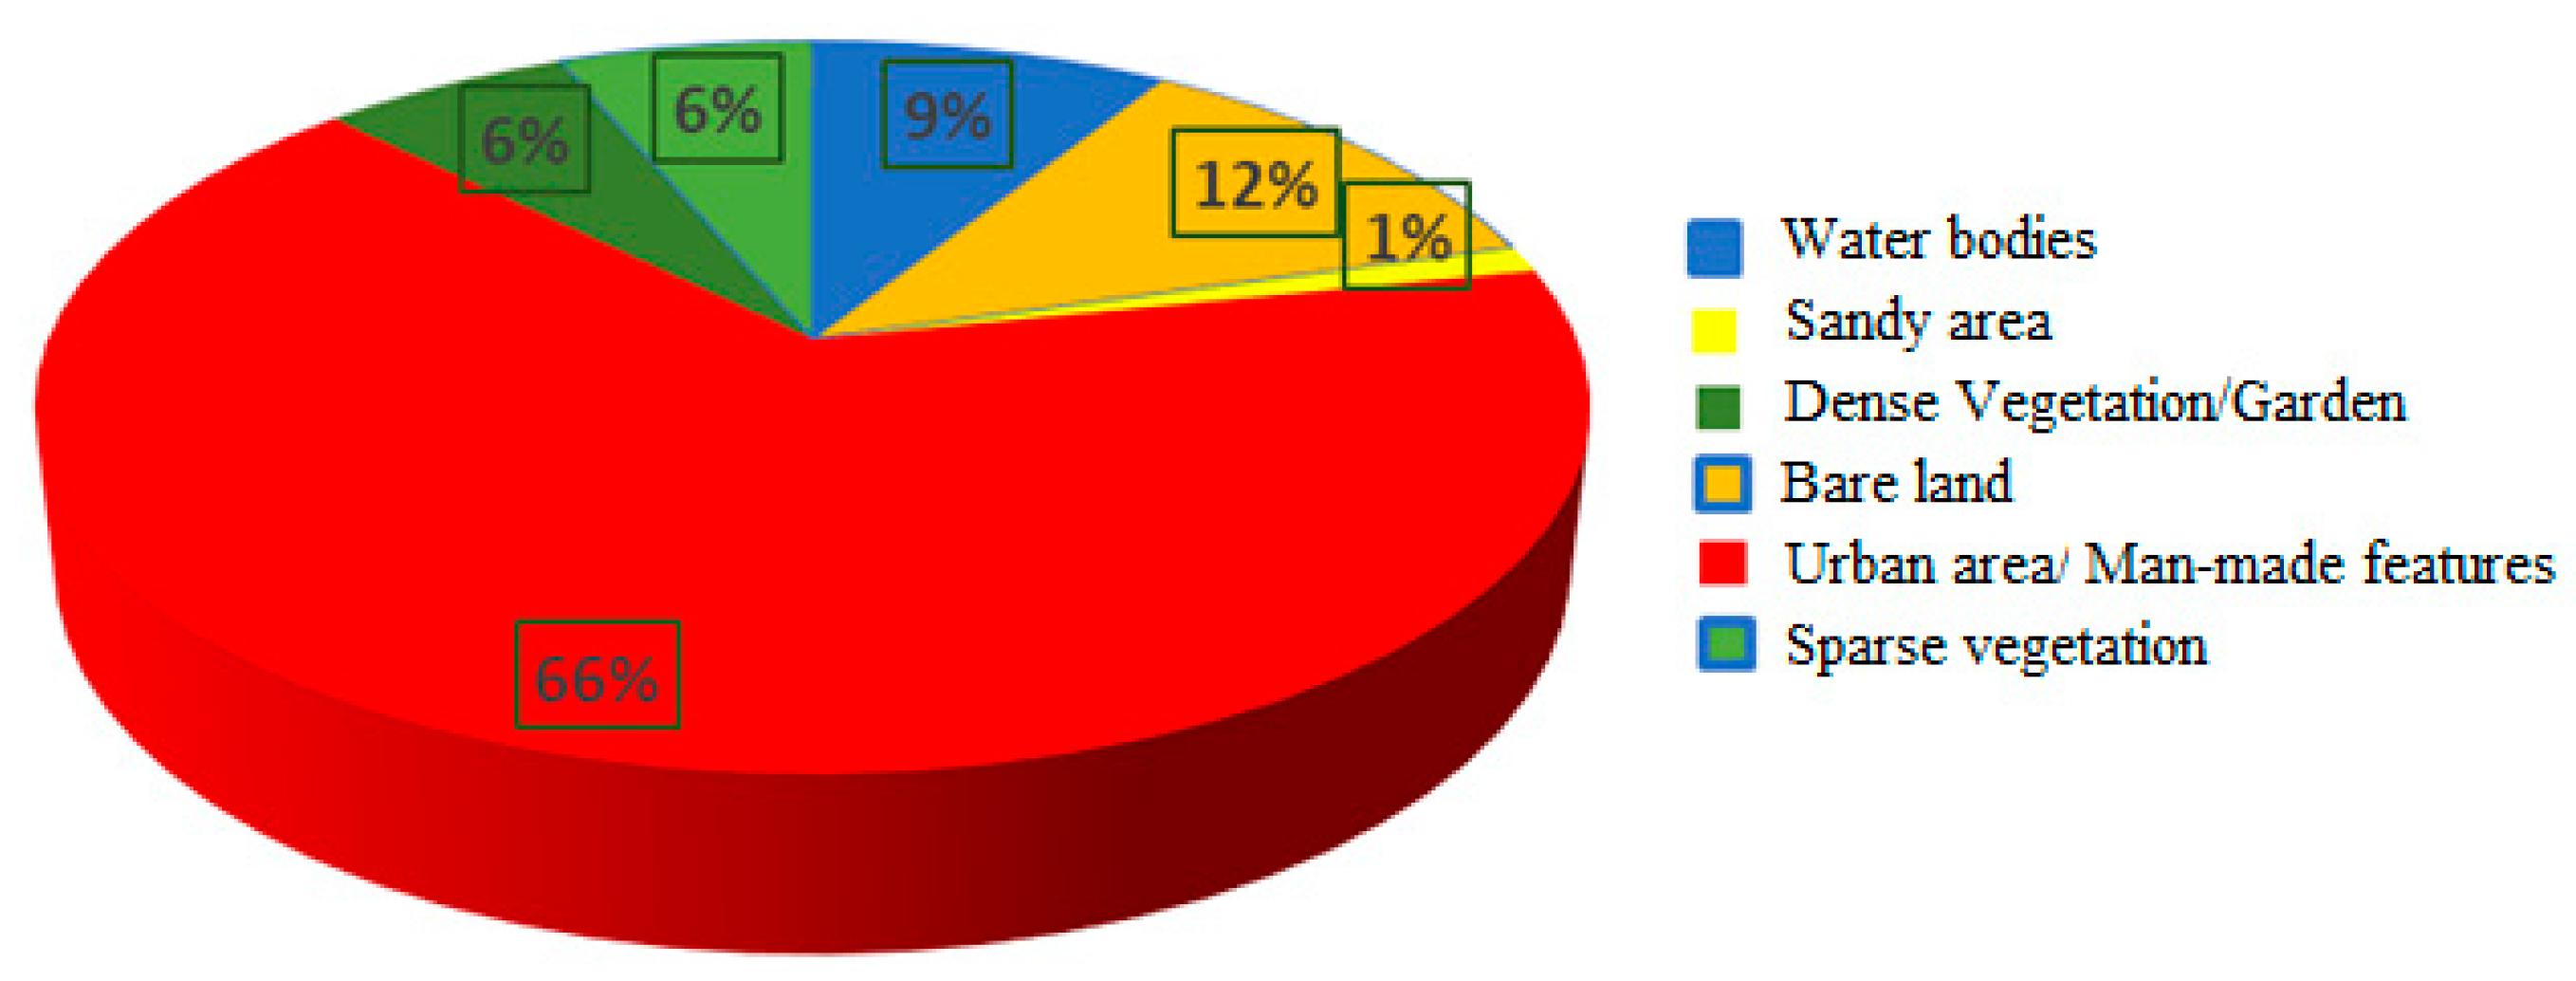
2.1. Study Area

Sharjah is the third emirate in the UAE, in terms of population number. Sharjah city, the capital of this emirate, is situated at 25°21′27″ N latitude and 55°23′27″ E longitude. Ajman is the fifth largest emirate in the UAE, and its capital, with the same name, is located at 25°24′49″ N latitude and 55°26′44″ E longitude (Figure 1).
The articles [21,25] present an extensive analysis of the climate in the region. Still, we summarize here some aspects related to the climate in the Sharjah and Ajman emirates. The study area belongs to a hot desert with warm winters and scorching and humid summers. Rainfall is generally light and erratic and occurs almost entirely from November to April. About two-thirds of annual precipitations fall in February and March [43].
The chart from Figure 2 presents the average temperatures and precipitation evolution. Figure 3 shows the cloudy, sunny, and precipitation days, precipitation amounts, maximum temperatures, and wind speed recorded at the Sharjah International Airport. Two sampling sites are situated nearby (29 and 30).
The wind rose for Sharjah International Airport (Figure 4) shows that most often throughout the year the wind blows from west to east or east to west, with speeds between 12 and 19 km/h.
Ajman has a similar climate as Sharjah.
Land use/Land cover (LULC) is the placement of activities and physical structures within a specific geographical area. It is a crucial metric for determining how human activities interact with the natural world [44]. The local, regional, and global environments are under tremendous stress due to changing land-use practices. The degradation of air quality is one of the most important environmental effects of urbanization.
Environmental and social factors, such as land use, community design, transportation networks, have been shown to have a significant impact on public health [45]. Many variables could cause particulate pollution, such as dust from construction, domestic garbage, and vehicle exhaust, but most pollution can be associated with land-use changes. Understanding the response mechanisms of urban particle pollution is crucial for pollution prevention and environmental protection [46].
To better understand the study area, we used recently released Landsat 8 satellite images for LULC mapping and monitoring in the region (Figure 5).
Results of the land-cover analysis (Figure 5 and Figure 6) show that 66% of the study area (187.61 km2) mostly includes urban area/human-made features, which includes industrial sites, petrol pumps, hotels, tourist areas, residential and commercial buildings, airport, etc.
Other land uses do not directly emit air pollutants but attract vehicular sources such as bus terminals, shopping centers, warehouses, etc.
The major categories of the land use and the associated surfaces in the study area are:
  • Sparse vegetation: date palms, Prosopis juliflora, etc. (18.07 km2);
  • Water bodies: water in the terrestrial area and nearby sea (25.35 km2);
  • Dense vegetation/Garden: human-made garden areas and concentrated vegetation (17.77 km2);
  • Urban area/Human-made features: industrial areas, petrol pumps, hotels, tourist areas, residential and commercial buildings, airports, etc. (187.61 km2);
  • Sandy area (3.37 km2)
  • Bare land (33.52 km2).

2.2. Instruments and Methods

2.2.1. Samples Collection

Dust samples were collected from thirty different Sharjah and Ajman emirates locations for five months (April–August 2020) using large dust traps placed at the height of 4 m above the ground level. Collected samples (150 at each site) were safely packed and moved to a desiccator before transporting to the laboratory. Samples were air-dried for 48 h to avoid moisture in a well-protected area. Then, each sample was sieved using a mechanical sieve shaker (Retsch, AS 200) with a 63µm filter to remove any large particles. A six-stage Anderson cascade impactor (Tecora, Italy) with an intake flow rate of 28.3 L/min was used to segregate dust particles.
Dust with a diameter lower than 10 µm was collected on the glass disks in the cascade impactor. The size ranges were 10 µm, 9.0 µm, 7.0 µm, 5.8 µm, 4.7 µm, and 3.3 µm. A cellulose nitrate filter with 100 mm diameter and 3 µm pore size was used as a backup filter.

2.2.2. Reagents, Standards, and Laboratory Ware

All experiments were performed using analytical reagent (AR) grade chemicals. The reference standard, check standard, and reagents were purchased from Sigma Aldrich. A 1:1 acid mixture was prepared using conc. nitric acid (69% v/v) and hydrochloric acid (37% v/v). Ultra-pure water with chemical resistivity of 18.2 MΩ.cm was obtained from a Merck Millipore (Massachusetts, USA) water purification system in the lab. For the sample oxidation, 30% hydrogen peroxide was used. Class-A grade glassware was utilized throughout the analysis. All glassware and plasticware were washed 5–6 times with ultrapure water followed by 10% nitric acid to remove contaminations and then air-dried. The Mars-6 system (CEM, North Carolina, USA) was employed to digest the samples. ICP-OES analysis was performed using a Perkin Elmer (Ohio, USA) Avio 200 system.

2.2.3. Samples Analysis

Sample digestion was performed by following USEPA 3050B [47] procedure. A total of 0.2 g of each sample was accurately weighed and transferred to Teflon vessels for microwave-assisted digestion. Afterwards, 10 mL of 1:1 HCl: HNO3 were added to the digestion vessel, mixed the slurry well, and digested it using the microwave digestion system at 95 °C for 5 min. The slurry was cooled and then added to 5 mL conc. HNO3. It was then heated and refluxed at 95 °C for 5 min, cooled, followed by the careful addition of 10% H2O2 for oxidation. The solutions were carefully transferred to 100 mL volumetric flasks, made up to mark with water, and filtered using Whatman 41 filters. The filtered solutions were moved to the ICP-OES system and analyzed for heavy metals. Replicate analyses were carried out on each sample.
Strict quality control and quality assurance procedures were followed to prepare and analyze samples, laboratory blanks, check standards, and standard spiked samples. Laboratory blanks were prepared using the same reagents used for the digestion without adding dust samples. The laboratory blank values for each metal were much lower than those of metals’ concentrations in the target samples. Method detection (MDL) was calculated using the equation:
MDL = Mean + 2 9 × SD
where Mean is the average concentration and SD is the standard deviation of blanks [48]. The MDL values ranged between 0.02 µg/kg (Cd) and 25.2 µg/kg (K). The metals’ recovery percentages (spiked and standard) were between 95% and 105%. The precision of repeated analysis was determined (for every metal) by computing the coefficient of variation, which was less than 3%.

2.3. Heath Risk Assessment

In this study, the impact of the pollution on the population exposed to dust metals has been assessed by computing the ADD (mg/kg/day) of pollutants via ingestion (ADDing), dermal contact (ADDderm), and inhalation (ADDinh). The utilized formulas are (2)–(4) [24,47].
A D D i n g = c × R i n g × C F × E F × E D B W × A T ,
A D D d e r m = c × S A × C F × S L × A B S × E F × E D B W × A T ,
A D D i n h = c × R i n h × E F × E D P E F × B W × A T ,
where the notations’ meanings are given in Table 1.
The model used in this study to calculate people’s exposure to dust metals is based on those developed by the Environmental Protection Agency of the United States [24].
The reference dose (RfD) estimates the maximum acceptable risk on a population group (in this case, adults) through daily exposure during a lifetime. An unfavorable health effect during a lifetime can be signaled using the threshold of RfD value. No adverse health effect is concluded if the ADD value is lower than the reference dose. If the ADD value is higher than the RfD, the exposure pathway will likely cause harmful human health effects [24]. The reference dose (RfD) values of heavy metals for the ingestion, dermal contact, and inhalation are presented in Table 2 [50].
After computing ADD, the hazard quotient (HQ), related to non-carcinogenic toxic risk, was calculated by dividing the daily dose by a specific reference dose (RfD).
H Q = A D D R f D
The last index determined in this study is the hazard index (HI), representing the cumulative non-carcinogenic risk. It is estimated by summing up the hazard quotients for ingestion (HQing), dermal (HQderm), and inhalation(HQinh):
H I = H Q i n g + H Q d e r m + H Q i n h

2.4. Sites Classification

The last objective of this study was to classify the sites based on the metals concentrations in the samples and on the indexes computed in the previous section. To this aim, the k-means algorithm was utilized after choosing the optimal number of clusters by the elbow method [51,52]. A comparison of the clusters’ contents was finally provided to determine the concordance between the pollution level and the health risk in the zones contained by the groups.

3. Results and Discussion

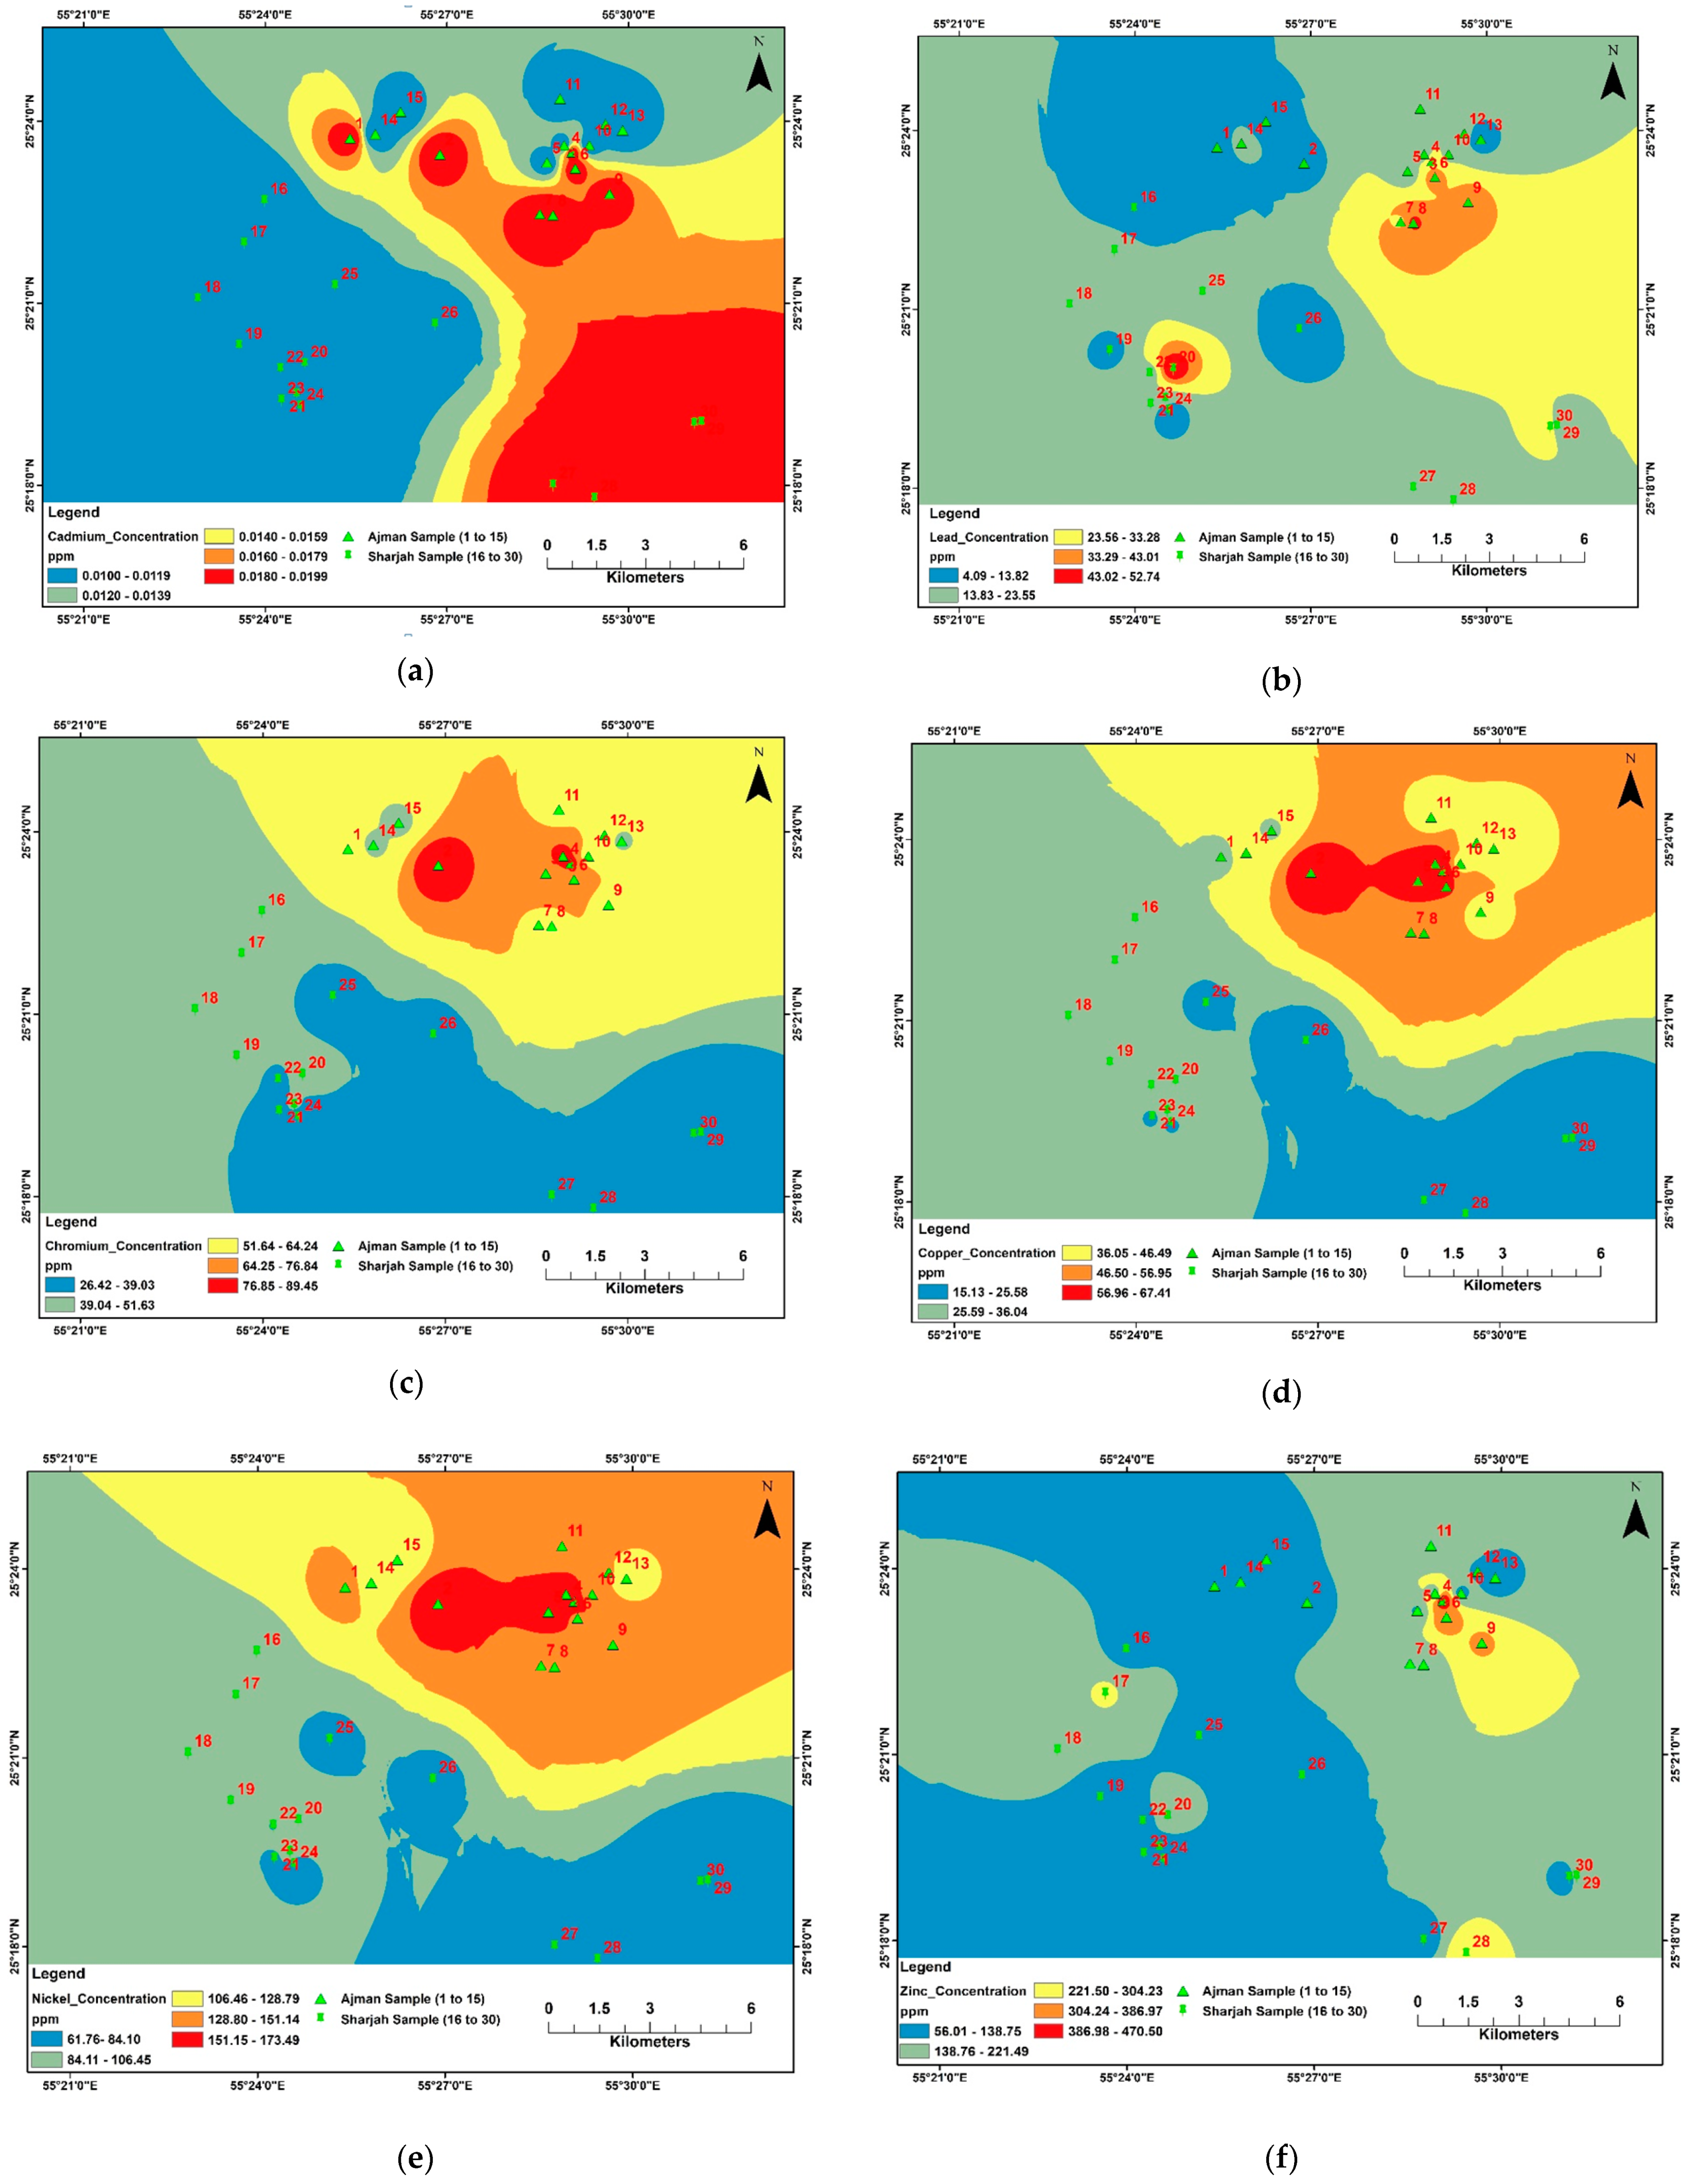
3.1. Analysis of the Heavy Metals’ Concentrations

The average concentrations in the samples at the observation sites are presented in Table 3.
The most abundant metal measured was Zn, with a mean concentration of 160.304 mg/kg. The average concentrations of the other studied metals were, in decreasing order, Ni > Cr > Cu > Pb > Cd. The mean concentrations of Cd, Pb, and Cr were within the range of background values. The mean concentrations of Cu, Ni, and Zn were higher than the background values, indicating anthropogenic pollution.
Based on the experimental data, the maps reflecting the concentration of the metals are presented in Figure 7.
The minimum, mean, and maximum levels of heavy metals (Cd, Pb, Cr, Cu, Ni, and Zn) in the dust samples collected from the studied areas in Sharjah and Ajman are presented in Table 4.
The composition of dust collected from industrial areas presents much higher concentrations of Zn and Ni than other metals. The highest concentration of Zn was found in samples 4, 6, and 9 (400.49, 377.30, and 316.49 mg/Kg, respectively), collected from the Ajman industrial area. The high zinc concentrations result from the steel processing activities, tire abrasion, and the corrosion of metallic parts of cars. The highest concentrations of Ni were contained by samples 7, 5, and 8 (173.49, 167.21, and 165.65 mg/Kg, respectively), collected from the Ajman industrial area. Nickel could originate from natural sources, but its presence in the air results from fuel combustion or metal plating activity.
The copper concentrations at sites 18, 28, 22, and 27 are the highest (67.41, 66.76, 65.71, and 61.75 mg/Kg). Site 18 is a bus station, and the presence of a high concentration of Cu can be attributed to traffic, tire abrasion, and the corrosion of metallic parts of cars. Site 22 is located in the Sharjah industrial area. Thus, Cu’s presence can be attributed to industrial activities. The other two sites (27 and 28) are located at the University of Sharjah, where the heavy traffic can explain the high pollution.
The heavy metals concentrations in the collected dust samples from the study area were compared with those in selected cities in the world and the world reference values (Table 5). Based on the values of the pollutants’ concentrations reported in different studies, the study zone occupies the first place for Cr pollution, the second one (after Hawaii) for Ni pollution, and the third for Zn pollution. These values indicate that the dust content is an issue in the area of Sharjah and Ajman.
Since each city has its specific combination of elemental compositions and the observed similarities may not reflect the actual natural and anthropogenic diversity among the different urban settings, it is necessary to establish a standard procedure to analyze the urban dust samples and draw conclusions based on the experiments [24,53].
Table 5. Heavy metals concentration in dust in different cities around the world, (mg/kg).
LocationCrNiCuZnCdPbReference
Study area89.44173.4867.91470.490.01852.73This study
Beijing69.3325.9772.13219.200.64202.82[24]
Ottawa43.3015.2065.84112.500.3739.05[54]
Hawaii273.0177.0167.0434.0-106.0[55]
Birmingham-41.1466.9534.01.6248.0[56]
Hong Kong-28.60110.03840.0-120.0[57]
Background values705030900.3535[58]
The pollutants’ concentrations recorded at different sites are not essentially influenced by wind transportation.
This conclusion results from comparing the wind rose and the metals concentrations in the samples collected at opposite sites, such as 25 and 28 or 27 and 30. We also remark that sites 29 and 30 are close to each other, but the concentrations of Zn differ. The same is valid for sites 25 and 26. This is due to the existence of small factories situated in the neighborhood of 25 and 29.

3.2. Health Risk Assessment

First, the non-carcinogenic effect on health was assessed by calculating the average daily doses (ADD) values, then the hazard quotient (HQ). The minimum, mean, and maximum levels of ADD and total ADD for adults via ingestion, dermal, and inhalation contact routes in the study area are listed in Table 6.
The highest ADD values are those for Ni and Zn, corresponding to absorption by ingestion, while the lowest are those for Cd. The main pathway the pollutants enter the organism is ingestion. Indeed, ADDing is about 103 times higher than ADDderm and 104 times higher than ADDinh.
The ADDing, ADDderm, and ADDinh are lower than the RfD for the studied heavy metals, which preliminarily indicates no significant effect on the health.
The mean levels of total ADD (ADD total) (in mg/kg-day) are 1.84 × 10⁻⁸ for Cd, 2.76 × 10⁻⁵ for Pb, 6.97 × 10⁻⁵ for Cr, 5.08 × 10⁻⁵ for Cu, 1.53 × 10⁻⁴ for Ni, and 2.20 × 10⁻⁴ for Zn. The mean values of total ADD for adults are ordered decreasingly as follows: Zn > Ni> Cr >Cu > Pb > Cd.
The minimum, mean, and maximum levels of HQ and total HQ for adults through ingestion, dermal, and inhalation contact pathways are presented in Table 7.
HQ ≤ 1 indicates no adverse health effects, while HQ > 1 indicates likely negative health effects [59]. All the studied heavy metals had total HQs below 1 (Table 7). Accordingly, the health risk estimation of Cd, Pb, Cr, Cu, Ni, and Zn suggests a low level of non-carcinogenic harmful health risk in all samples taken from the Ajman and Sharjah studied areas. The average hazard index HI is 3.32 × 10⁻². It shows a negligible non-carcinogenic risk to residents’ health.

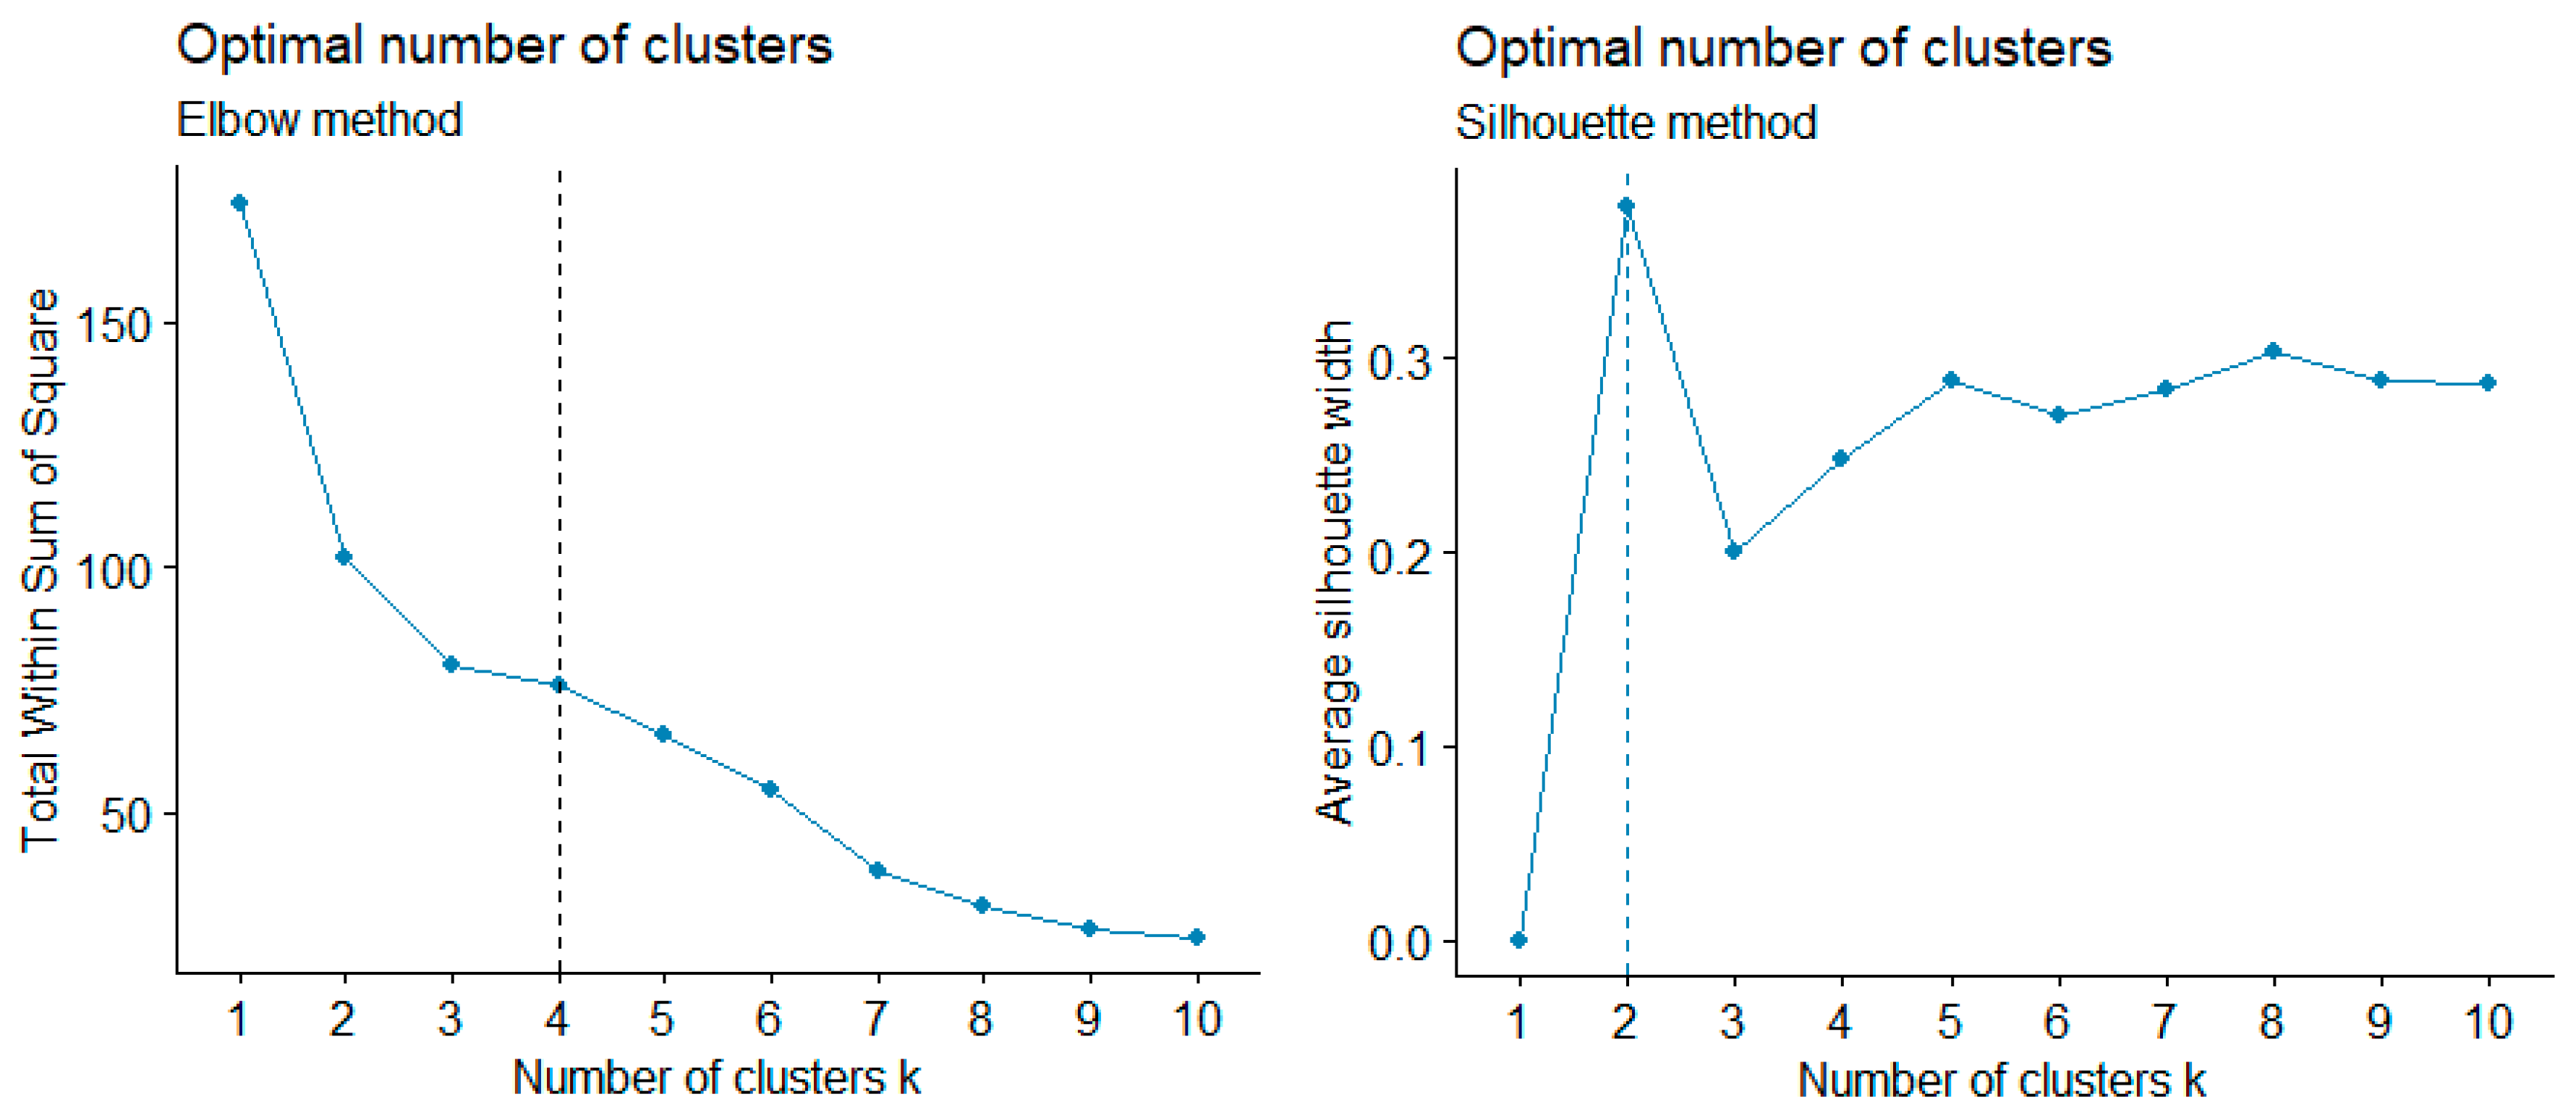
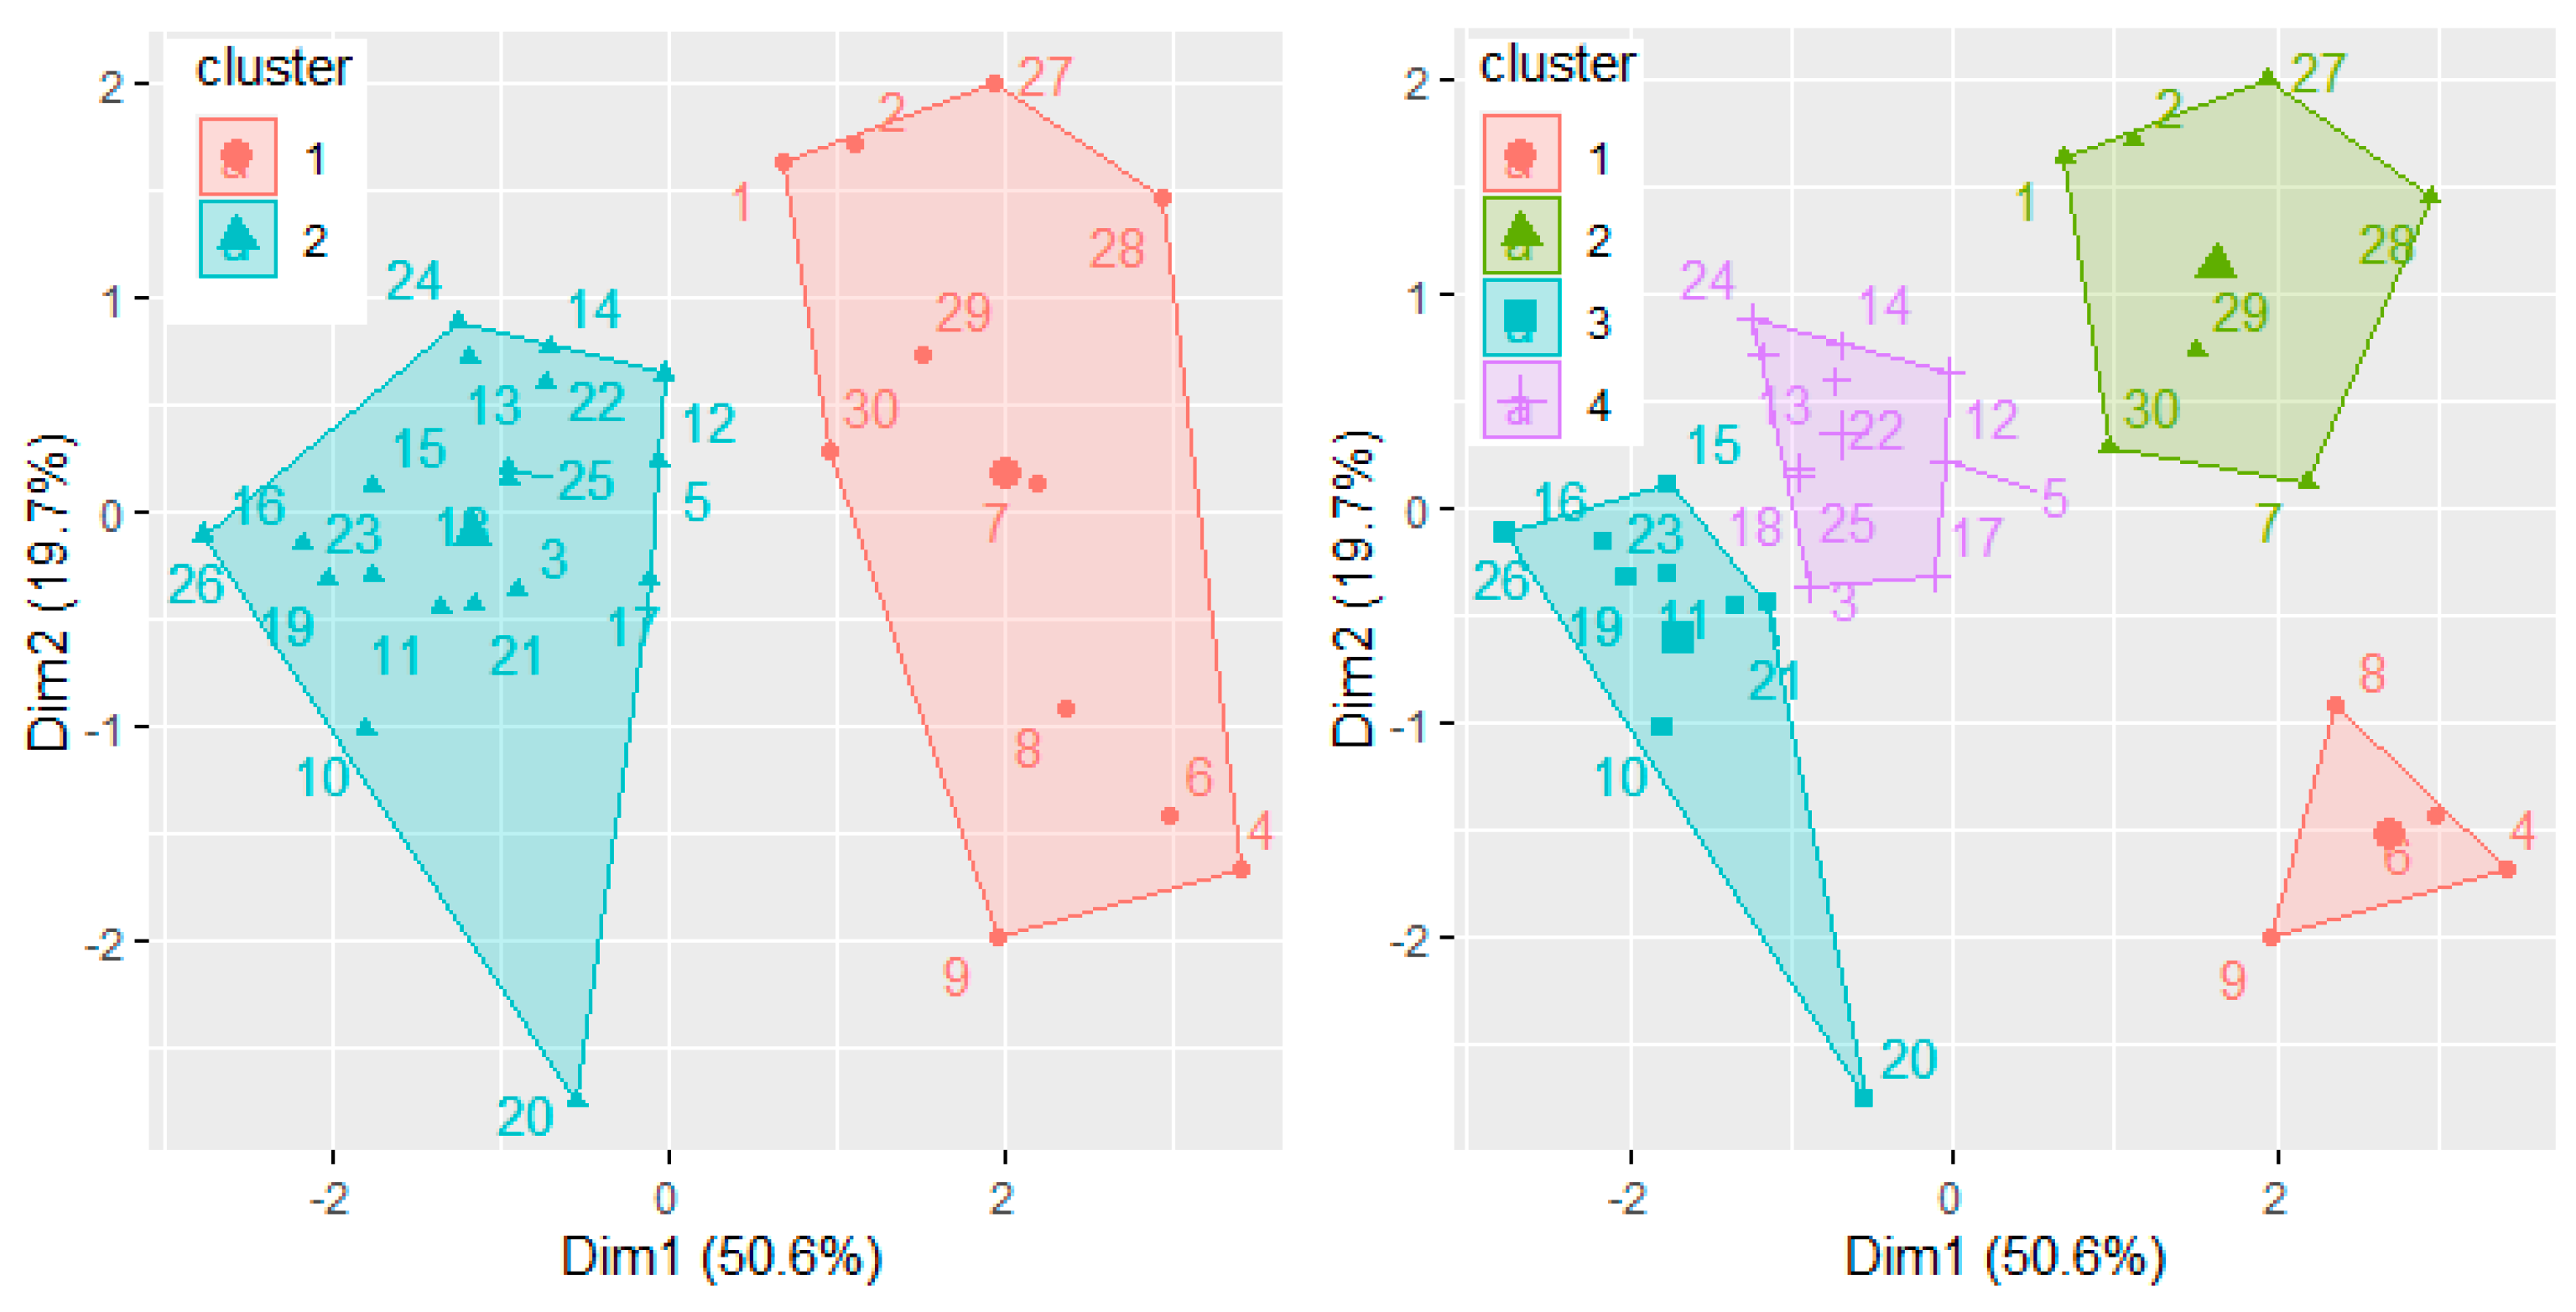
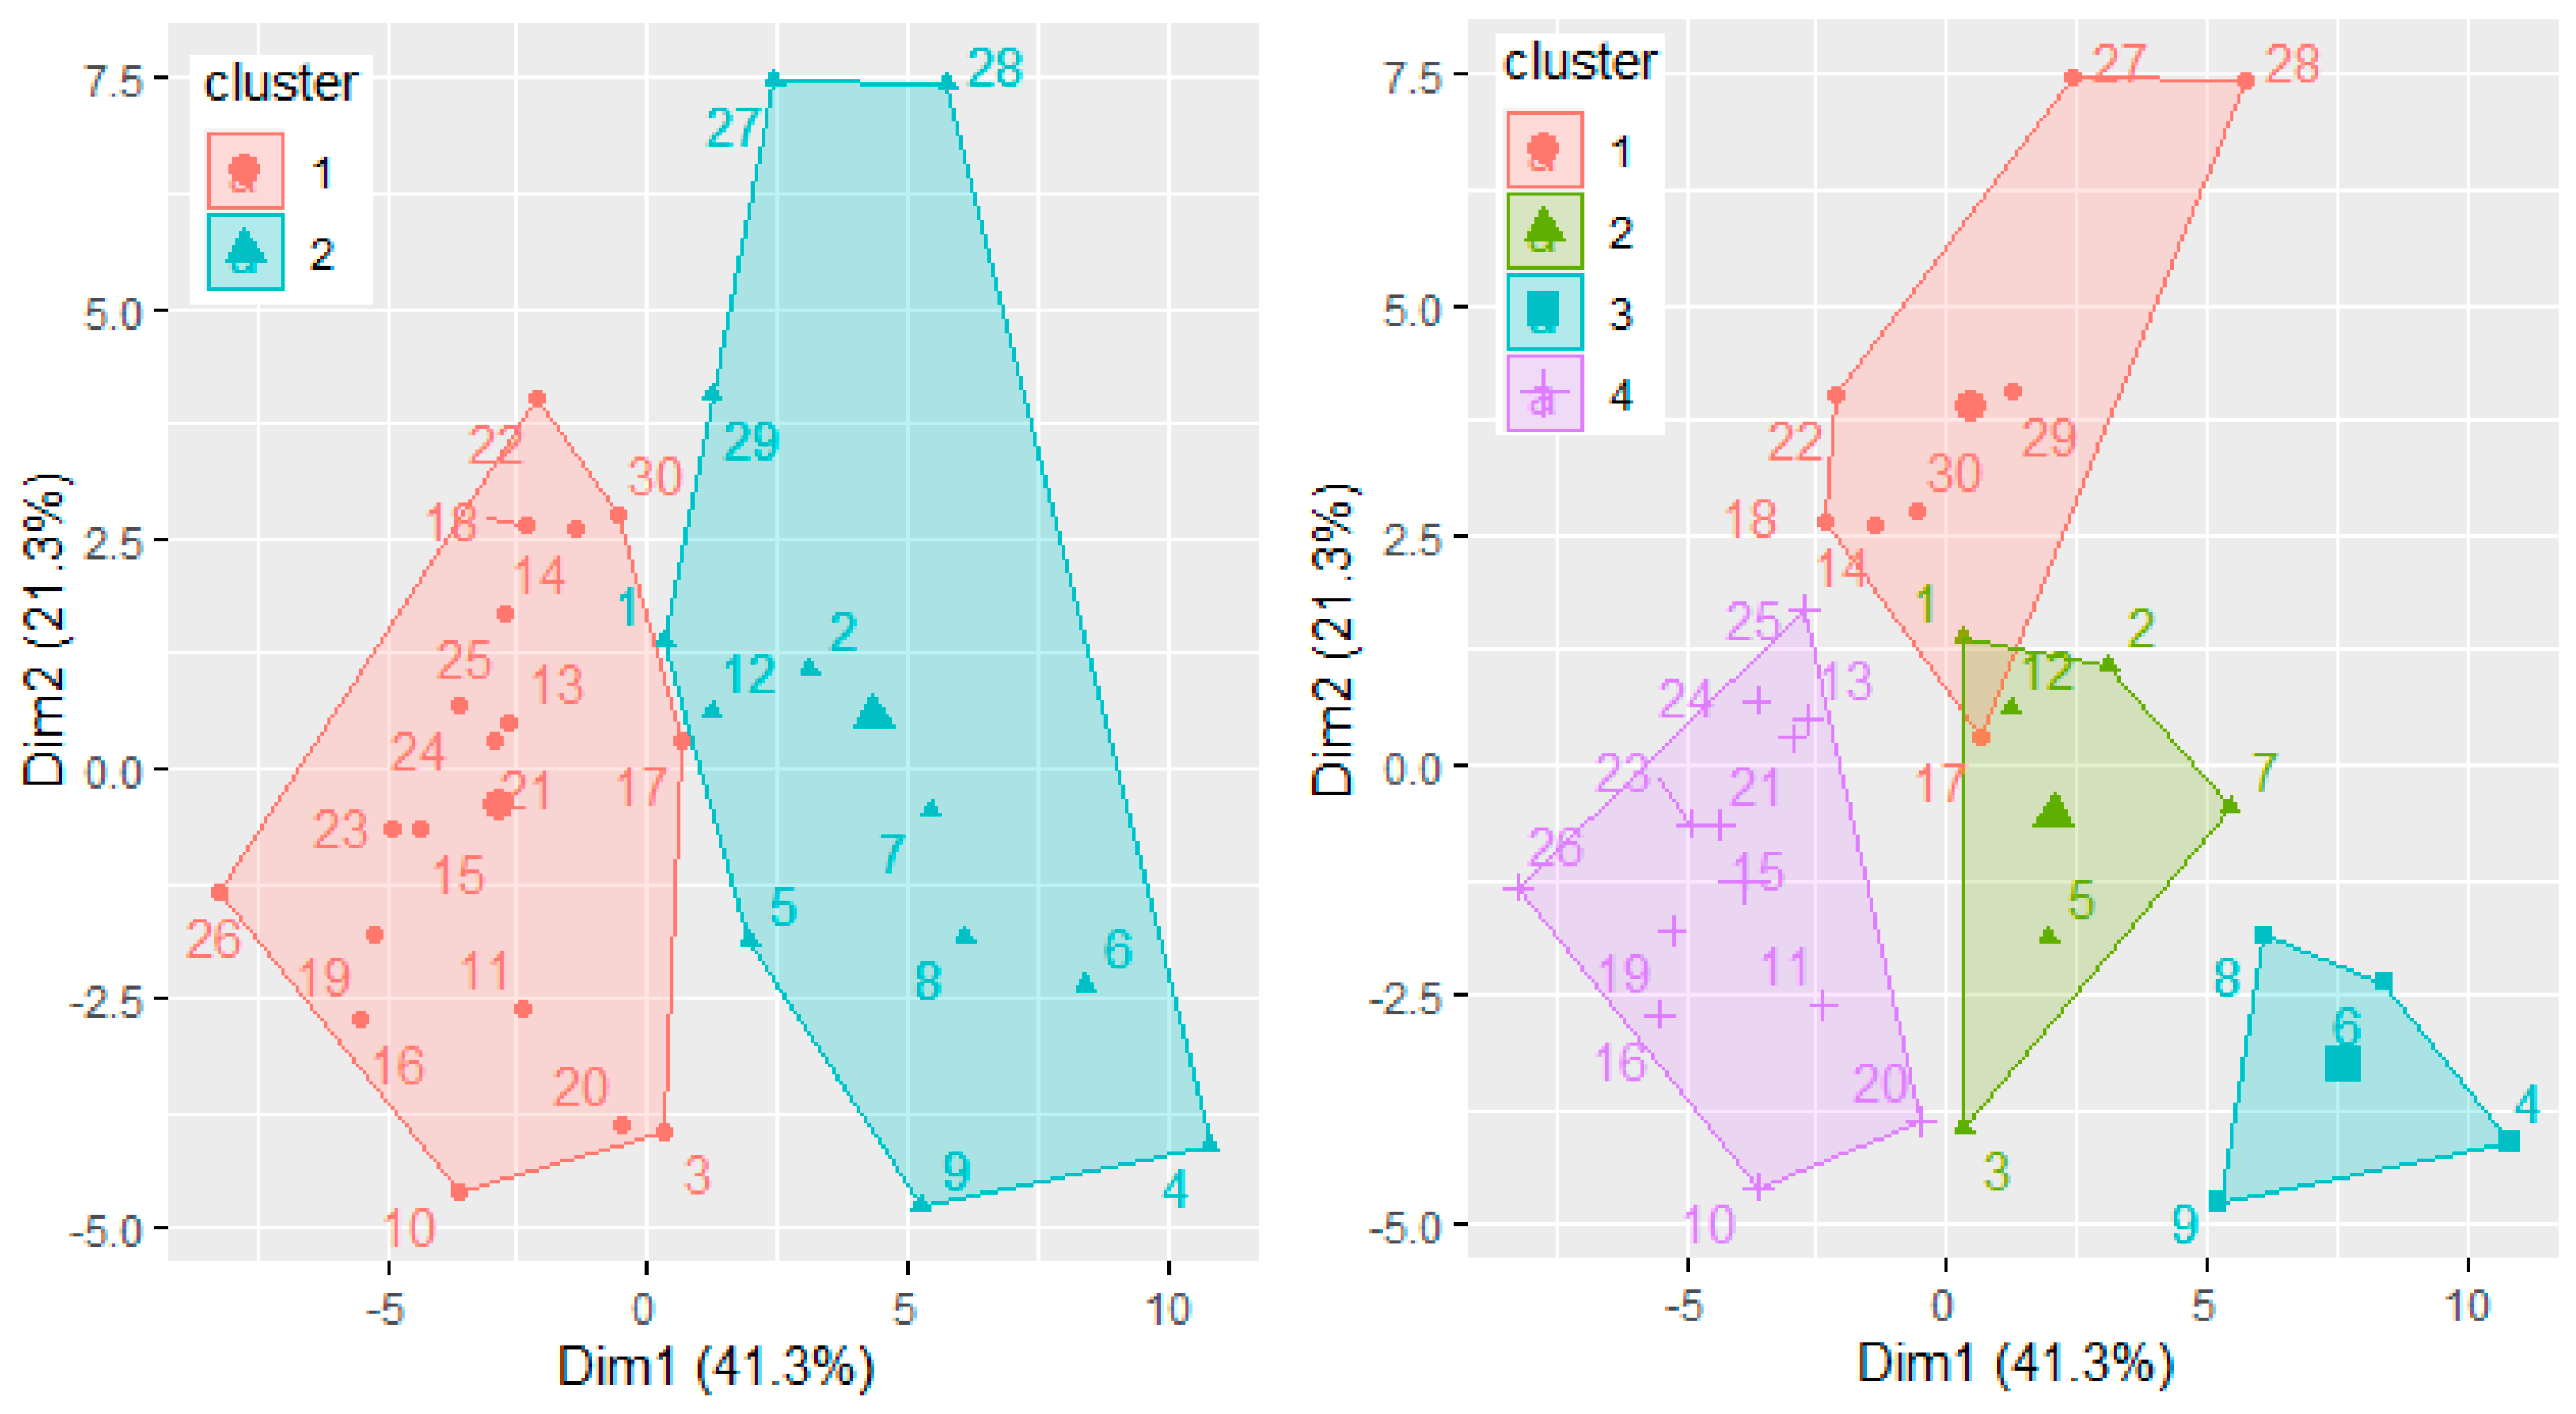
3.3. Site Clustering

Clustering has been performed for grouping the observation sites’ function of the pollution impact on the population health, based on the health indexes.
The series containing the pollutants concentrations recorded at each site were normalized, and the silhouette and elbow methods (Figure 8) were used to determine the optimal number of clusters. Based on them, k was found to be 2 and 4.
Running the k-means algorithm with k = 2, all the sites, but the first one, are contained in the same cluster. Running the k-means algorithm with k = 4, the following sites have been included in the clusters: (1) 1; (2) 2–4, 6, 8, 9, 11–13; (3) 14–31; (4) 5, 7, 10 (Figure 9).
Using k = 2, it resulted that the sites with the highest concentrations of Zn (4, 6, 9), Ni (7, 8), and Cu (27, 28) are in the same cluster. Still, sites 5, 18, and 22 with high concentrations of Ni and Zn are contained in the second cluster. Using k = 4, the sites with the highest concentrations of Zn (4, 6, 9) and Ni (8) are in the first cluster.
Samples 27 and 28 (high concentration of Cu) are kept in another cluster, while the samples with the lowest concentrations are in Cluster 3. Comparing the clustering based on the sum of squares of the distances between the groups (SSD) over the total sum of distances (TSD), the best clustering is the second (SSD/TSD = 41.5% when k = 2, and 60.8% for k = 4).
All the indices previously computed were utilized for clustering the sites. The procedure was performed using the k-means algorithm with k = 2 and k = 4 (determined by the elbow method). Figure 10 shows the sites’ clustering (based on the health indexes).
For k = 2, the sites with the highest concentrations with Ni (5, 7, 8), Zn (4, 6, 9), 27, and 28 are in the same cluster, confirming an increased risk impact on health due to high pollution with different elements in the air. For k = 4, the samples with the highest values of the health indices are mainly situated in clusters 1 (sites 18, 22, 27, 28), 2 (5, 7), and 3 (4, 5, 8, 9). For k = 4, the samples with the largest values of the health indices are mainly situated in clusters 1 (sites 18, 22, 27, 28), 2 (5, 7), and 3 (4, 5, 8, 9). The best clustering corresponds to k = 4 because SSD/TSD is 29.2% for k = 2, compared to 54.9%, for k = 4.
Cluster 3 from Figure 10 and Cluster 1 from Figure 9 have the same members, so the highest health risk is due to high concentrations of Zn and Ni. The sites 27–30 belong to the same cluster in Figure 9 and Figure 10, showing a similar effect of the same pollutants on human health. Cluster 4 in Figure 10 contains the sites with the lowest impact on population health.

4. Conclusions

This study investigated the existence of heavy metals in the samples of atmospheric dust collected in the Sharjah and Ajman emirates, of the United Arab Emirates. It assessed the impact of pollutants on human health. This type of study is very significant for the residents of the UAE since the economic, industrial, and commercial development has increased the volume of exhausted gases and dust in the environment, which is severely impacting air pollution within the country.
The results show that the average concentration of heavy metals in the collected and analyzed dust samples can be ordered in decreasing order as follows: Zn > Ni > Cr > Cu > Pb > Cd. Compared with the recommended maximum allowable limits, Zn, Ni, and Cr concentrations exceeded the admissible concentrations at some locations—mainly situated in the industrial zones—indicating anthropogenic pollution. Still, at this stage of the research, the contribution of desert sand to the heavy metals pollution cannot be distinguished from that produced by anthropogenic sources.
Hazard quotient values for single and hazard index values for all studied metals are lower than the safe level for adults, indicating a non-significant non-carcinogenic. The mean values of HI through ingestion, dermal contacts, and inhalation adsorption showed a low non-carcinogenic risk to residents’ health.
The clustering of the sites based on raw data and computed indices indicated four locations with the highest risks for human health (mainly due to the high concentrations of Zn and Ni).
Since many health issues of the population have been linked to air pollution with heavy metals, some measures have been proposed and are necessary to prevent such health risks [60]. They include developing detection protocols, guidelines and practices, and legislation to reduce emissions, particularly in areas with high levels of heavy metal pollution.
Since the Sharjah and Ajman cities are continuously developing, a monitoring program should be implemented. Automatic stations that record the concentrations of the most important pollutants should be placed in crowded areas and industrial zones. These should provide real-time information to the population, through electronic devices placed on visible displays. They also might be connected to a system that sends alerts to the population when the admissible pollution limit is exceeded.
Furthermore, engineering solutions are critical to both minimize pollution and prevent occupational exposure. An essential stage towards prevention is the early monitoring of human exposure to environmental pollution for a prompt action to reduce emissions and, by consequence, the adverse health effects. National collaborative efforts are needed to shape effective strategies, policies, and practices to control and prevent heavy metal toxicity.

Author Contributions

Conceptualization, Y.N. and F.H.; methodology, A.B.; software, M.S., C.M.X.; validation, A.B., F.E.K. and C.S.D.; formal analysis, A.B.; investigation, N.B.O. and A.E.B.; resources, F.H.; data curation, C.M.X., Y.N. and A.B.; writing—original draft preparation, A.A.A.-T.; writing—review and editing, A.B. and C.S.D.; visualization, J.I.; supervision, A.B.; project administration, Y.N.; funding acquisition, F.H. All authors have read and agreed to the published version of the manuscript.

Funding

The APC was funded by Zayed University, Abu Dhabi, and RIF project R20115 funded by Zayed University.

Institutional Review Board Statement

Not applicable.

Informed Consent Statement

Not applicable.

Data Availability Statement

Data will be available on request.

Conflicts of Interest

The authors declare no conflict of interest.

References

  1. Ali, H.; Khan, E.; Ilahi, I. Environmental chemistry and ecotoxicology of hazardous heavy metals: Environmental persistence, toxicity, and bioaccumulation. J. Chem. 2019, 2019, 6730305. [Google Scholar] [CrossRef] [Green Version]
  2. Briffa, J.; Sinagra, E.; Blundell, R. Heavy metal pollution in the environment and their toxicological effects on humans. Heliyon 2020, 6, e04691. [Google Scholar] [CrossRef] [PubMed]
  3. 3. Herawati, N.; Suzuki, S.; Hayashi, K.; Rivai, I.F.; Koyoma, H. Cadmium, copper and zinc levels in rice and soil of Japan, Indonesia and China by soil type. Bull. Environ. Contam. Toxicol. 2000, 64, 33–39. [Google Scholar] [CrossRef] [PubMed]
  4. He, Z.L.; Yang, X.E.; Stoffella, P.J. Trace elements in agroecosystems and impacts on the environment. J. Trace Elem. Med. Biol. 2005, 19, 125–140. [Google Scholar] [CrossRef]
  5. Kok, J.F.; Parteli, E.J.; Michaels, T.I.; Karam, D.B. The physics of wind-blown sand and dust. Rep. Prog. Phys. 2012, 75, 106901. [Google Scholar] [CrossRef] [PubMed] [Green Version]
  6. Jin, Y.; O’Connor, D.; Ok, Y.S.; Tsang, D.C.W.; Liu, A.; Hou, D. Assessment of sources of heavy metals in soil and dust at children’s playgrounds in Beijing using GIS and multivariate statistical analysis. Environ. Int. 2019, 124, 320–328. [Google Scholar] [CrossRef] [PubMed]
  7. Hou, D.; O’Connor, D.; Nathanail, P.; Tian, L.; Ma, Y. Integrated GIS and multivariate statistical analysis for regional scale assessment of heavy metal soil contamination: A critical review. Environ. Pollut. 2017, 231, 1188–1200. [Google Scholar] [CrossRef]
  8. Tchounwou, P.B.; Yedjou, C.G.; Patlolla, A.K.; Sutton, D.J. Heavy metal toxicity and the environment. Exp. Suppl. 2012, 101, 133–164. [Google Scholar] [CrossRef] [PubMed] [Green Version]
  9. Bradl, H. Heavy Metals in the Environment: Origin, Interaction and Remediation; Academic Press: London, UK, 2002; Volume 6. [Google Scholar]
  10. Bărbulescu, A.; Dumitriu, C.S. Assessing the water quality by statistical methods. Water 2021, 13, 1026. [Google Scholar] [CrossRef]
  11. Bărbulescu, A.; Barbeș, L.; Dumitriu, C.S. Statistical Assessment of the Water Quality Using Water Quality Indicators—Case study from India. In Water Safety, Security and Sustainability. Advanced Sciences and Technologies for Security Applications; Vaseashta, A., Maftei, C., Eds.; Springer: Amsterda, The Netherlands, 2021; pp. 599–613. [Google Scholar] [CrossRef]
  12. Al-Taani, A.A.; Nazzal, Y.; Howari, F.; Iqbal, J.; Bou-Orm, N.; Xavier, C.M.; Bărbulescu, A.; Sharma, M.; Dumitriu, C.S. Contamination Assessment of Heavy Metals in Agricultural Soil, in the Liwa Area (UAE). Toxics 2021, 9, 53. [Google Scholar] [CrossRef]
  13. Nazzal, Y.H.; Bărbulescu, A.; Howari, F.; Al-Taani, A.A.; Iqbal, J.; Xavier, C.M.; Sharma, M.; Dumitriu, C.Ș. Assessment of metals concentrations in soils of Abu Dhabi Emirate using pollution indices and multivariate statistics. Toxics 2021, 9, 95. [Google Scholar] [CrossRef]
  14. Mihăilescu, M.; Negrea, A.; Ciopec, M.; Negrea, P.; Duțeanu, N.; Grozav, I.; Svera, P.; Vancea, C.; Bărbulescu, A.; Dumitriu, C.S. Full factorial design for gold recovery from industrial solutions. Toxics 2021, 9, 111. [Google Scholar] [CrossRef] [PubMed]
  15. Aonofriesei, F.; Bărbulescu, A.; Dumitriu, C.-S. Statistical analysis of morphological parameters of microbial aggregates in the activated sludge from a wastewater treatment plant for improving its performances. Rom. J. Phys. 2021, 66, 809. [Google Scholar]
  16. WHO/IAEA/FAO—World Health Organization, International Atomic Energy Agency & Food and Agriculture Organization of the United Nations. Trace Elements in Human Nutrition and Health. 1996. Available online: https://apps.who.int/iris/handle/10665/37931 (accessed on 21 August 2021).
  17. Tchounwou, P.B.; Centeno, J.A.; Patlolla, A.K. Arsenic toxicity, mutagenesis, and carcinogenesis: A health risk assessment and management approach. Mol. Cell. Biochem. 2004, 255, 47–55. [Google Scholar] [CrossRef] [PubMed]
  18. Al-Taani, A.A.; Nazzal, Y.; Howari, F.M. Assessment of heavy metals in roadside dust along the Abu Dhabi–Al Ain National Highway, UAE. Environ. Earth Sci. 2019, 78, 411. [Google Scholar] [CrossRef]
  19. National Strategy and Action Plan for Environmental Health for the United Arab Emirates. 2010. Available online: https://sph.unc.edu/wp-content/uploads/sites/112/2013/07/report.pdf (accessed on 19 August 2021).
  20. The United Arab Emirates Unified Aerosol Experiment. 2006. Available online: http://sonmi.weebly.com/uploads/2/4/7/4/24749526/the_united_arab_emirates_unified_aerosol_experiment_uae2_2006.pdf (accessed on 21 August 2021).
  21. Nazzal, Y.; Bărbulescu, A.; Howari, F.; Yousef, A.; Al-Taani, A.A.; Al Aydaroos, F.; Naseem, M. New insights on sand dust storm from historical records, UAE. Arab. J. Geosci. 2019, 12, 396. [Google Scholar] [CrossRef]
  22. Suryawanshi, P.V.; Rajaram, B.S.; Bhanarkar, A.D.; Chalapati Rao, C.V. Determining heavy metal contamination of road dust in Delhi, India. Atmósfera 2016, 29, 221–234. [Google Scholar] [CrossRef] [Green Version]
  23. Bărbulescu, A.; Șerban, C.; Caramihai, S. Assessing the soil pollution using a genetic algorithm. Rom. J. Phys. 2021, 66, 806. [Google Scholar]
  24. Du, Y.; Gao, B.; Zhou, H.; Ju, X.; Hao, H.; Yin, S. Health risk assessment of heavy metals in road dusts in urban parks of Beijing, China. Procedia Environ. Sci. 2013, 18, 299–309. [Google Scholar] [CrossRef] [Green Version]
  25. Barbulescu, A.; Nazzal, Y. Statistical analysis of dust storms in the United Arab Emirate. Atmos. Resear. 2020, 231, 104669. [Google Scholar] [CrossRef]
  26. Nazzal, Y.; Ghrefat, H.; Rose, M.A. Application of multivariate geostatistics in the investigation of heavy metal contamination of roadside dusts from selected highways of the Greater Toronto Area, Canada. Environ. Earth Sci. 2014, 71, 1409–1419. [Google Scholar] [CrossRef]
  27. Pant, P.; Harrison, R.M. Estimation of the contribution of road traffic emissions to particulate matter concentrations from field measurements: A review. Atmos. Environ. 2013, 77, 78–97. [Google Scholar] [CrossRef]
  28. Thorpe, A.; Harrison, R.M. Sources and properties of non-exhaust particulate matter from road traffic: A review. Sci. Total Environ. 2008, 400, 270–282. [Google Scholar] [CrossRef] [PubMed]
  29. Apeagyei, E.; Bank, M.S.; Spengler, J.D. Distribution of heavy metals in road dust along an urban-rural gradient in Massachusetts. Atmos. Environ. 2011, 45, 2310–2323. [Google Scholar] [CrossRef]
  30. Kelly, J.; Thornton, I.; Simpson, P.R. Urban geochemistry: A study of the influence of anthropogenic activity on heavy metal content of soils in traditionally industrial and nonindustrial areas of Bristol. Appl. Geochem. 1996, 11, 363–370. [Google Scholar] [CrossRef]
  31. Gabarron, M.; Faz, A.; Acosta, J.A. Effect of different industrial activities on heavy metal concentrations and chemical distribution in topsoil and road dust. Environ. Earth Sci. 2017, 76, 129. [Google Scholar] [CrossRef]
  32. Losacco, C.; Perillo, A. Particulate matter air pollution and respiratory impact on humans and animals. Environ. Sci. Pollut. Res. Int. 2018, 25, 33901–33910. [Google Scholar] [CrossRef]
  33. Kabata-Pendias, A. Trace Elements in Soil and Plants, 4th ed.; Taylor & Francis: Boca Raton, FL, USA, 2011. [Google Scholar]
  34. Caspah, K.; Mathuthu, M.; Madhuku, M. Health risk assessment of heavy metals in soils from Witwatersrand Gold Mining Basin, South Africa. Int. J. Environ. Res. Public Health 2016, 13, 663. [Google Scholar]
  35. Taylor, A.A.; Tsuji, J.S.; Garry, M.R.; McArdle, M.E.; Goofellow, W.L., Jr.; Adams, W.J.; Menzie, C.A. Critical Review of Exposure and Effects: Implications for Setting Regulatory Health Criteria for Ingested Copper. Environ. Manag. 2020, 65, 131–159. [Google Scholar] [CrossRef] [Green Version]
  36. Ogwuegbu, M.O.C.; Muhanga, W. Investigation of lead concentration in the blood of people in the copper belt province of Zambia. J. Environ. 2005, 1, 66–75. [Google Scholar]
  37. Plum, L.M.; Rink, L.; Haase, H. The Essential Toxin: Impact of Zinc on Human Health. Int. J. Environ. Res. Public Health 2010, 7, 1342–1365. [Google Scholar] [CrossRef] [PubMed] [Green Version]
  38. Chen, Q.Y.; Brocato, J.; Laulicht, F.; Costa, M. Mechanisms of nickel carcinogenesis. In Essential and Non-Essential Metals. Molecular and Integrative Toxicology; Mudipalli, A., Zelikoff, J.T., Eds.; Springer: New York, NY, USA, 2017; pp. 181–197. [Google Scholar]
  39. Sinicropi, M.S.; Caruso, A.; Capasso, A.; Palladino, C.; Panno, A.; Saturnino, C. Heavy metals: Toxicity and carcinogenicity. Pharmacologyonline 2010, 2, 329–333. [Google Scholar]
  40. Genchi, G.; Carocci, A.; Lauria, G.; Sinicropi, M.S.; Catalano, A. Nickel: Human Health and Environmental Toxicology. Int. J. Environ. Res. Public Health 2020, 17, 679. [Google Scholar] [CrossRef] [PubMed] [Green Version]
  41. Genchi, G.; Sinicropi, M.S.; Lauria, G.; Carocci, A.; Catalano, A. The Effects of Cadmium Toxicity. Int. J. Environ. Res. Public Health 2020, 17, 3782. [Google Scholar] [CrossRef] [PubMed]
  42. ATSDR. Agency for Toxic Substances and Disease Registry. Environmental Health and Medical Education. Chromium Toxicity. Available online: https://www.atsdr.cdc.gov/csem/chromium/physiologic_effects_of_chromium_exposure.html (accessed on 7 September 2021).
  43. Ministry of Presidential Affairs, National Centre of Metrology-Climate History-Sharjah. Available online: www.ncm.ae. (accessed on 2 October 2020).
  44. Dewan, A.M.; Yamaguchi, Y.; Rahman, M.Z. Dynamics of land use/cover changes and the analysis of landscape fragmentation in Dhaka Metropolitan, Bangladesh. GeoJournal 2012, 77, 315–330. [Google Scholar] [CrossRef]
  45. Azapagic, A.; Chalabi, Z.; Fletcher, T.; Grundy, C.; Jones, M.; Leonardi, G.; Osammor, O.; Sharifi, V.; Swithenbank, J.; Tiwarya, A.; et al. An integrated approach to assessing the environmental and health impacts of pollution in the urban environment: Methodology and a case study. Process. Saf. Environ. 2013, 91, 508–520. [Google Scholar] [CrossRef]
  46. Wei, X.; Gao, B.; Wang, P.; Zhou, H.; Lu, J. Pollution characteristics and health risk assessment of heavy metals in street dusts from different functional areas in Beijing, China. Ecotoxicol. Environ. Saf. 2015, 112, 186–192. [Google Scholar] [CrossRef]
  47. U.S. EPA. Exposure Factors Handbook (1997, Final Report); EPA/600/P-95/002F a–c; US Environmental Protection Agency: Washington, DC, USA, 1997. Available online: https://cfpub.epa.gov/si/si_public_record_report.cfm?Lab=NCEA&dir,EntryId=12464 (accessed on 2 October 2020).
  48. Kamani, H.; Ashrafi, S.D.; Isazadeh, S.; Jaafari, J.; Hoseini, M.; Mostafapour, F.K.; Bazrafshan, E.; Nazmara, S.; Mahvi, A.H. Heavy metal contamination in street dusts with various land uses in Zahedan, Iran. Bull. Environ. Contam. Toxicol. 2015, 94, 382–386. [Google Scholar] [CrossRef]
  49. U.S. EPA. Risk Assessment Guidance for Superfund, Volume 1: Human Health Evaluation Manual. EPA/540/1-89/002. 1989. Available online: https://www.epa.gov/sites/default/files/2015-09/documents/rags_a.pdf (accessed on 15 October 2020).
  50. U.S. EPA. Risk Assessment Guidance for Superfund: Volume III—Part A, Process for Conducting Probabilistic Risk Assessment. 2001. Available online: https://www.epa.gov/risk/risk-assessment-guidance-superfund-rags-volume-iii-part (accessed on 15 October 2020).
  51. Cluster Analysis: Basic Concepts and Algorithms. Available online: https://www-users.cs.umn.edu/~kumar001/dmbook/ch8.pdf (accessed on 10 November 2019).
  52. Everitt, B.S.; Landau, S.; Leese, M.; Stahl, D. Cluster Analysis, 5th ed.; Wiley: Chichester, UK, 2011. [Google Scholar]
  53. Duzgoren-Aydin, N.S.; Wong, C.S.C.; Aydin, A.; Song, Z.; You, M.; Li, X.D. Heavy metal concentrations and distribution in the urban environment of Guangzhou, SE China. Environ. Geochem. Health 2006, 28, 375–391. [Google Scholar] [CrossRef]
  54. Rasmussen, P.E.; Subranmanian, K.S.; Jessiman, B.J. A multi-element profile of house dust in relation to exterior dust and soils in the city of Ottawa, Canada. Sci. Total Environ. 2001, 267, 125–140. [Google Scholar] [CrossRef]
  55. Sutherland, R.A.; Tolosa, C.A. Multi-element analysis of road-deposited sediment in an urban drainage basin, Honolulu, Hawaii. Environ. Pollut. 2000, 110, 483–495. [Google Scholar] [CrossRef]
  56. Charlesworth, S.; Everett, M.; McCarthy, R. A comparative study of heavy metal concentration and distribution in deposited street dusts in a large and a small urban area: Birmingham and Coventry, West Midlands, UK. Environ. Int. 2003, 29, 563–573. [Google Scholar] [CrossRef]
  57. Yeung, Z.L.L.; Kwok, R.C.W.; Yu, K.N. Determination of multi-element profiles of street dust using energy dispersive X-ray fluorescence (EDXRF). Appl. Radiat. Isot. 2003, 58, 339–346. [Google Scholar] [CrossRef] [Green Version]
  58. China National Environment Monitoring Centre. Background Values of Soil Elements in China; China Environmental Science Press: Beijing, China, 1990. [Google Scholar]
  59. U.S. EPA. Superfund Public Health Evaluation Manual EPA/540/1-86. 1986. Available online: https://nepis.epa.gov/Exe/ZyNET.exe/2000DATB.TXT?ZyActionD=ZyDocument&Client=EPA&Index=1986+Thru+1990&Docs=&Query=&Time=&EndTime=&SearchMethod=1&TocRestrict=n&Toc=&TocEntry=&QField=&QFieldYear=&QFieldMonth=&QFieldDay=&IntQFieldOp=0&ExtQFieldOp=0&XmlQuery=&File=D%3A%5Czyfiles%5CIndex%20Data%5C86thru90%5CTxt%5C00000000%5C2000DATB.txt&User=ANONYMOUS&Password=anonymous&SortMethod=h%7C-&MaximumDocuments=1&FuzzyDegree=0&ImageQuality=r75g8/r75g8/x150y150g16/i425&Display=hpfr&DefSeekPage=x&SearchBack=ZyActionL&Back=ZyActionS&BackDesc=Results%20page&MaximumPages=1&ZyEntry=1&SeekPage=x&ZyPURL (accessed on 15 October 2020).
  60. Jaishankar, M.; Tseten, T.; Anbalagan, N.; Mathew, B.B.; Beeregowda, K.N. Toxicity, mechanism and health effects of some heavy metals. Interdiscip. Toxicol. 2014, 7, 60–72. [Google Scholar] [CrossRef] [Green Version]
Figure 1. Study area location and sampling map.
Atmosphere 12 01442 g001
Figure 2. Average temperature and precipitation in Sharjah (International Airport).
Atmosphere 12 01442 g002
Figure 3. (a) Cloudy, sunny, and precipitation days; (b) precipitation amounts; (c) maximum temperatures; (d) wind speed.
Atmosphere 12 01442 g003
Figure 4. Wind rose for Sharjah International Airport.
Atmosphere 12 01442 g004
Figure 5. Landuse/Landcover (LULC) map of the study area.
Atmosphere 12 01442 g005
Figure 6. Pie chart showing the LULC percentage distribution of the studied region (from the LANDSAT 8).
Atmosphere 12 01442 g006
Figure 7. Maps showing the concentrations of (a) Cd, (b) Pb, (c) Cr, (d) Co, (e) Ni (f) Zn in the study area.
Atmosphere 12 01442 g007
Figure 8. The elbow method for the normalized pollutants dataset.
Atmosphere 12 01442 g008
Figure 9. Clusters determined by the k-means algorithm with k = 2 (in the left) and k = 4 (in the right), based on the pollutants’ concentrations.
Atmosphere 12 01442 g009
Figure 10. Clusters determined by the k-means algorithm with k = 2 (in the left), and k = 4 (in the right) based on the health risk indicators.
Atmosphere 12 01442 g010
Table 1. Exposure factors for dose models (adult).
FactorDefinitionUnitValueReference
cConcentration of the contaminant in dustsmg/kg-This study
RingIngestion rate of soilmg/day100[49]
ATAverage timedays365 × ED
BWAverage body weightkg55.9Environmental site [50]
CFConversion factorkg/mg1 × 10−6
EFExposure frequencydays/year35
EDExposure durationyear24[50]
SASurface area of the skin that contacts the dustcm25000[50]
RinhInhalation ratem3/day20
SLSkin adherence factor for dustmg/cm21
ABSDermal absorption factor (chemical specific)-0.001
PEFParticle emission factorm3/kg1.32 × 109
Table 2. Values of RfD for the six studied heavy metals [50].
MetalIngestionDermalInhalation
Cd0.00100.000050.0030
Pb0.00350.000530.0035
Cr0.00500.000250.000029
Cu0.03700.00110.0400
Ni0.02000.00100.0210
Zn0.3000.06000.3200
Table 3. Average concentration values of the metals in the samples.
Site
no
LocationLatitudeLongitudePb (ppm)Copper (ppm)Zn
(ppm)
Ni (ppm)Cr
(ppm)
Cd
(ppm)
1Sheraton hotel tourist area25°23′43″55°25′24″6.0634.8489.80142.3461.490.02
2Alnuaimiay tourist area25°23′27″55°26′53″11.5767.41115.11173.4989.450.02
3Ajman industrial areas and petrol stations25°23′36″55°28′56″15.1966.76190.50167.2182.390.01
425°23′29″55°29′04″34.2865.71470.49165.6580.780.02
525°23′19″55°28′39″16.2261.75132.38156.8166.810.01
625°23′13″55°29′07″37.7757.37377.30148.9764.710.02
725°22′28″55°28′32″32.3153.58150.32146.1763.540.02
825°22′27″55°28′45″44.8447.67185.83136.3061.970.02
925°22′48″55°29′41″40.2142.14316.49134.6861.710.02
1025°23′36″55°29′21″21.4541.64115.19134.6658.900.01
11Ajman residential and commercial area 25°24′22″55°28′52″13.9940.33170.67134.3758.470.01
1225°23′57″55°29′37″14.9240.24133.33129.5955.350.01
13Adnoc Ajman25°23′51″55°29′54″9.4939.9283.48115.7949.990.01
14Ajman commercial area25°23′47″55°25′49″16.4737.53101.15114.9349.840.01
1525°24′09″55°26′14″11.0635.41106.18108.5649.670.01
16Sharjah residential and commercial areas25°22′41″55°23′59″4.5435.16121.4598.7247.610.01
1725°21′59″55°23′39″18.4932.99229.4197.0245.500.01
18Sharjah-bus station25°21′4″55°22′53″20.4631.11152.7596.5544.940.01
19Sharjah commerial area 25°20′18″55°23′34″11.0629.22124.6093.7644.850.01
20Sharjah industrial area25°19′06″55°24′39″52.7428.73192.0190.9241.250.01
2125°19′30″55°24′31″24.0127.90127.3489.8739.870.01
2225°19′55″55°24′15″20.5927.32105.5884.0138.110.01
2325°19′24″55°24′16″15.8925.26106.3183.1937.690.01
2425°19′18″55°24′35″4.0825.2555.9579.8635.290.01
25Sharjah airport highway25°21′17″55°25′9″16.1524.53126.1179.4234.810.01
2625°20′39″55°26′48″7.0520.6966.9478.6634.190.01
27Sharjah University25°18′0″55°28′45″18.1120.44106.8270.0334.110.02
2825°17′47″55°29′26″16.9617.92275.4169.8833.800.02
29Sharjah airport25°19′2″55°31′12″22.2916.43151.2162.2230.020.02
3025°19′1″55°31′5″24.9215.13129.0161.7626.420.02
Table 4. Extreme values of the heavy metals concentrations in the 30 samples.
MetalHeavy Metals Concentrations in Samples (mg/kg)Background Values of the World (mg/Kg)
MeanMinMaxStd. Dev.
Cd0.0130.0050.0180.0030.35
Pb20.1054.07552.73712.00035
Cr50.78326.41689.44516.10070
Cu37.01115.12567.41115.20030
Ni111.51361.762173.48635.60050
Zn160.30455.953470.49392.10090
Table 6. Average daily dose (ADD) and total ADD for heavy metals through different pathways.
MetalCdPbCrCuNiZn
ADDingMean1.84 × 10−82.75 × 10−56.96 × 10−55.07 × 10−51.53 × 10−42.20 × 10⁻⁴
Min.6.85 × 10−95.58 × 10−63.62 × 10−52.07 × 10−58.46 × 10−57.66 × 10−5
Max.2.47 × 10−87.22 × 10−51.23 × 10−49.23 × 10−52.38 × 10−46.45 × 10⁻⁴
ADDdermMean4.47 × 10−116.70 × 10−81.69 × 10−71.23 × 10−73.72 × 10−75.34 × 10⁻⁷
Min.1.67 × 10−111.36 × 10−88.81 × 10−85.04 × 10−82.06 × 10−71.87 × 10−7
Max.6.00 × 10−111.76 × 10−72.98 × 10−72.25 × 10−75.78 × 10−71.57 × 10⁻⁶
ADDinhMean2.78 × 10−124.17 × 10−91.05 × 10−87.68 × 10−92.31 × 10−83.33 × 10⁻⁸
Min 1.04 × 10−128.46 × 10−105.48 × 10−93.14 × 10−91.28 × 10−81.16 × 10−8
Max.3.74 × 10−121.09 × 10−81.86 × 10−81.40 × 10−83.60 × 10−89.77 × 10⁻⁸
Total
ADD
Mean1.84 × 10−82.76 × 10−56.97 × 10−55.08 × 10−51.53 × 10−42.20 × 10⁻⁴
Min.6.87 × 10−85.60 × 10−63.63 × 10−52.08 × 10−58.48 × 10−57.68 × 10−5
Max.2.47 × 10−87.24 × 10−51.23 × 10−49.26 × 10−52.38 × 10−46.46 × 10⁻⁴
Table 7. HQ for heavy metals through different pathways and HI.
MetalCdPbCrCuNiZn
HQingMean1.84 × 10−57.87 × 10−31.39 × 10−21.37 × 10−37.64 × 10−37.32 × 10⁻⁴
Min6.85 × 10−61.60 × 10−37.24 × 10−35.60 × 10−44.23 × 10−32.55 × 10−4
Max2.47 × 10−52.06 × 10−22.45 × 10−22.50 × 10−31.19 × 10−22.15 × 10⁻³
HQdermMean8.94 × 10−71.28 × 10−46.77 × 10−41.13 × 10−43.72 × 10−48.91 × 10⁻⁶
Min3.33 × 10−72.59 × 10−53.52 × 10−44.63 × 10−52.06 × 10−43.11 × 10−6
Max1.20 × 10−63.35 × 10−41.19 × 10−32.06 × 10−45.78 × 10−42.61 × 10⁻⁵
HQinhMean2.78 × 10−91.19 × 10−63.69 × 10−41.91 × 10−71.12 × 10−61.04 × 10⁻⁷
Min1.04 × 10−92.40 × 10−71.92 × 10−47.81 × 10−86.22 × 10−73.63 × 10−8
Max3.74 × 10−93.11 × 10−66.49 × 10−43.48 × 10−71.75 × 10−63.05 × 10⁻⁷
Total HQMean1.93 × 10−58.00 × 10−31.50 × 10−21.48 × 10−38.01 × 10−37.41 × 10⁻⁴
Min7.18 × 10−61.62 × 10−37.78 × 10−36.06 × 10−44.44 × 10−32.59 × 10−4
Max2.59 × 10−52.10 × 10−22.63 × 10−22.70 × 10−31.25 × 10−22.18 × 10⁻³
Publisher’s Note: MDPI stays neutral with regard to jurisdictional claims in published maps and institutional affiliations.

