Article

Operational Analysis and Medium-Term Forecasting of the Greenhouse Gas Generation Intensity in the Cryolithozone

by
Andrey V. Timofeev
1,*,
Viktor Y. Piirainen
2,
Vladimir Y. Bazhin
3 and
Aleksander B. Titov
4
1
Data Processing Laboratory, EqualiZoom LLC, Akzhol 2, Nur-Sultan 010000, Kazakhstan
2
Department of Material Science and Technology of Art Products, Mechanical and Mechanical Engineering Faculty, Saint Petersburg Mining University, 2 21st Line, 199106 St. Petersburg, Russia
3
Department of Automation of Technological Processes and Productions, Mineral Refining Faculty, Saint Petersburg Mining University, 2 21st Line, 199106 St. Petersburg, Russia
4
Graduate School of Business Engineering, Institute of Industrial Management, Economics and Trade, Peter the Great St. Petersburg Polytechnic University (SPbPU), 199034 St. Petersburg, Russia
*
Author to whom correspondence should be addressed.
Atmosphere 2021, 12(11), 1466; https://doi.org/10.3390/atmos12111466
Submission received: 10 October 2021 / Revised: 28 October 2021 / Accepted: 2 November 2021 / Published: 5 November 2021
(This article belongs to the Special Issue Air Quality Management)

Abstract

:
We proposed a new approach to solving the problem of operational analysis and medium-term forecasting of the greenhouse gas generation (CO2, CH4) intensity in a certain area of the cryolithozone using data from a geographically distributed network of multimodal measuring stations. A network of measuring stations, capable of functioning autonomously for long periods of time, continuously generated a data flow of the CO2, CH4 concentration, soil moisture, and temperature, as well as a number of other parameters. These data, taking into account the type of soil, were used to build a spatially distributed dynamic model of greenhouse gas emission intensity of the permafrost area depending on the temperature and moisture of the soil. This article presented models for estimating and medium-term predicting ground greenhouse gases emission intensity, which are based on artificial intelligence methods. The results of the numerical simulations were also presented, which showed the adequacy of the proposed approach for predicting the intensity of greenhouse gas emissions.

1. Introduction

It is known [1,2,3,4] that due to climate change, much of the organic CO2 and CH4 that are conserved in the cryolithozone ecosystem can be released. For example, colossal reserves of organic CO2 and CH4 are mothballed in permafrost peatlands. For the time being, the factor of the release of these conserved CO2 and CH4 is significant and should be taken into account in a measures set, which is aimed to compensate for the effect of greenhouse gas emissions. In order to take this factor into account, it is necessary to have a formal method and tools in order to make adequate medium-term forecasts for the amounts of CO2 and CH4 generated in specific areas of the permafrost region. Relatively, few works have been devoted to the description of greenhouse gas emission processes in the cryolithozone, most of which are not aimed at quantitative prediction of greenhouse gas emission intensity with reference to specific territories [5,6,7,8,9,10]. These works mainly estimate the potential hydrocarbon and methane reserves in different areas of the cryolithozone and describe the mechanism of greenhouse gas generation. For example, it is pointed out that the intensity of the process of greenhouse gas emission in the cryolithozone depends on the soil temperature and humidity, as well as on its biological composition. At the same time, no attempt is made to solve the problem of predicting the quantitative dynamics of greenhouse gas release from the soil of the cryolithozone, depending on various scenarios of soil temperature and moisture changes. In these works, no mathematical model of greenhouse gas generation has been made and no instrumental means have been proposed for measuring the parameters included in these models.
At the same time, researchers engaged in forecasting the intensity of greenhouse gas generation in the cryolithozone need a methodology and appropriate tools that would allow, in a clear reference to specific territories, quick generation of quantitative estimates of the intensity of greenhouse gas generation in these territories, depending on various scenarios of changes in the average temperature and humidity in these areas. Hence, this work aimed to develop a new method for the operational analysis and medium-term forecasting of the intensity of greenhouse gas generation in the cryolithozone, as well as to formulate requirements for the tools that will provide the developed method with adequate data. The approach proposed in the present work is intended for operative surveillance of the process of greenhouse gas emission within a specific territory, as well as for determining medium-term forecasts of this emission quantity. The method and instrumental means which provide this analysis are described. The contribution of this paper is given below.
  • The data-driven predictive model is based on artificial intelligence methods and designed for operational estimation as well as for the formation of a forecast of the spatial concentration of greenhouse gases. This model allows for more accurate quantitative predictions of greenhouse gas generation because it relies on directly linking the measurements used to build the model to the measurement locations. This model is constantly being refined, literally at the rate of new data, and therefore takes into account the gradual depletion of hydrocarbon reserves in the soil, as well as this refinement gradually compensating for the a priori inaccuracy of hydrocarbon maps.
  • The proof of the proposed predictive model adequacy was carried out in the form of numerical simulations with usage of a specialized data set.
  • The proof of existence of a sustainable regression model that binds the value of intensive CO2 production with the temperature and soil moisture was produced by numerical simulation.
The rest of this document is organized as follows. Section 2 presents related works. Section 3 describes a new method for predicting the intensity of greenhouse gas generation in the cryolithozone. Section 4 is the most important section of this paper and it contains the results of numerical testing of the possibility for a qualitative approximation of the greenhouse gas intensity value as a regression function from the arguments “soil moisture” and “soil temperature”. Section 5 concludes the paper with brief conclusions and suggestions for future research on this topic.

2. Related Work

As indicated in the previous section, most of the scientific papers devoted to the analysis of the process of greenhouse gas emissions in the cryolithozone are not aimed at quantitative prediction of the intensity of these emissions in relation to specific territories. An exception is the work [11], which made a very interesting attempt to quantitatively analyze the process of greenhouse gas emission in the cryolithozone. It was assumed that carbon reserves during freezing do not decompose, and after thawing they are released with intensity, the dynamics of which are described by some function which depends on the soil temperature. The soil type was taken from the soil atlas, where the data were approximate. In general, this interesting model relied on a number of static assumptions and did not examine the process of hydrocarbon release in cryolithozone as a dynamic process. So, this approach was intended as a rough estimate of the permafrost carbon-climate feedback and, as a result, a simplified potential hydrocarbon release estimate was formed. A characteristic feature is also the fact that not all key parameters affecting the generation of greenhouse gases were subjected to research. In addition, this work did not describe a hardware system designed both for operational measurement of soil parameters (temperature and humidity), and for controlling the intensity of greenhouse gas emission flux, as the problem statement did not require it. As a matter of fact, in the paper [11] presented an approach to estimating greenhouse gas emissions from large-scale permafrost melting, which is based on the use a simplified three-component model. This model combines three main elements: (a) maps and profiles of soil carbon (C) distribution in permafrost soils [12,13]; (b) incubation experiments to quantify the rate of C loss during thawing; and (c) models of soil thermal dynamics in response to climate warming. Phase (b) creates data sets containing digitized data that characterize the relationship of carbon generation intensity with soil type and temperature gradient. The authors called this approach the Permafrost Carbon Network Incubation-Panarctic Thermal scaling approach (PInc-PanTher). In general, this approach allows us to form a rough potential estimate of greenhouse gas emissions in specific areas of the cryolithozone without taking into account the depletion of soil hydrocarbon reserves and without considering the heterogeneity of hydrocarbon concentrations in specific soil areas. This approach is based entirely on soil atlases, so the accuracy of its prediction is largely determined by the accuracy of the atlas. However, this accuracy is not good enough.
Unlike PInc-PanTher, the approach proposed in this paper was based on a data-driven methodology that allows elements (a) and (b) to be information-assembled in a single phase. This phase simultaneously collects information of soil parameters and greenhouse gas generation, and builds and continuously refines a model that relates greenhouse gas emission rates to a group of objectively measurable parameters, such as soil moisture, soil temperature, and time. A nonparametric regression is considered as a model, and as its parameters, the type of soil in which the sensors of the measuring multimodal station are immersed. This regression was approximated based on artificial intelligence methods, in particular, using boosting methods. The soil type, which is considered as a parameter of this model can be obtained, for example, from soil atlases with classification of soil types [12]. In this case, there is no need to use soil carbon maps [13], which, like soil atlases, are rather approximate. In the framework of the proposed approach, the accuracy of the hydrocarbon map is uncritical. The fact is that the parameter “soil type” in the measurement points is used only at the moment of system installation, when a previously improved model is used for the forecast. Then, the model is improved and refined without reference to the soil atlas, but with reference to the geographical locations of the measurement stations. Thus, the data-driven approach used in this work allows us to quickly compensate for inaccuracy of hydrocarbon maps, as the system will be constantly improved and refined as new measurements and data arrive, which will be obtained in 24/365 mode. The model can be refined in various ways, the simplest of which is to take into account the newly obtained data to refine the regression reconstruction. Gradually, when a sufficient amount of data are accumulated at each location of multimodal measuring stations, the constructed regression will depend more on the observed data rather than on the initial information about the soil type, which may not be quite accurate. Thus, a gradual decrease in the intensity of greenhouse gas generation as the hydrocarbon content of the soil is depleted can also be taken into account. In principle, as a regression parameter, the data on the soil carbon map can also be used, but it is not critical. The main thing is that the model of greenhouse gas generation is based on a clear territorial reference to the nodes in which the measuring stations are installed. The data from these nodes are used to make the target regression, linking the independent variables (time, temperature, and humidity) with the target parameter: the intensity of greenhouse gas emissions at specific points. Thus, this approach is based on the use of data from a specific territory, which are constantly updated and refined, which makes the proposed approach, theoretically, more accurate.

3. Method

A spatially distributed system of multimodal measuring stations (multimodal measuring station MMS) located at points of X = { X i | i = 1 , N } in which precise measurements of the thermal and moisture fields of the soil were made is given. Each MMS includes a garland of sensors of various modalities, some of the sensors are buried in the ground, and the sensors of greenhouse gas emission and the communication and information transfer system remain on the surface. The entire controlled area was divided into a system of adjacent prisms, Ω ( j ) ,   j J ,   Ω = j J Ω ( j ) , whose height is equal to the depth of control of the temperature and moisture fields, and, in fact, the depth of immersion of multimodal, sensor garlands into the soil. This set of prisms is called the MMS placement grid and was used to construct the resulting forecast of the emission intensity of the controlled area. The vertical axes of the MMS garlands were used as prism Ω ( j ) edges. Figure 1 shows an image of a prism of multimodal sensor stations, the edges of which are multimodal sensor stations with the indices i, i + 1, and i + 2. Marker “1” stands for the controller with a self-contained power supply and LoRaWAN wireless data transfer module, “2” for greenhouse gas emission intensity measurement module, “3”, “4”, and “5” for humidity and temperature measurement modules, and “6” for the base that fixes the station in the well. The figure has a schematic character, and in a real version the number of temperature and humidity measurement modules can reach 10–15 units. The indices of the measuring stations, which are located on the faces of this prism, form a set ω ( j ) , | ω ( j ) | = 3 .
Let ο ( t , X i ) = ( T ( t | X i ) , r H ( t | X i ) ) be the measurement made by the i-th station at the time t T ,  T is a set of moments of measurements of the earth’s physical fields: thermal and moisture, T ( t | X i ) is the temperature of the soil at the time t T , averaged over the space of the measuring cylinder (the geometric location of the underground multimodal garland), and r H ( t | X i ) is the soil moisture measured at time t T and averaged over the measuring cylinder space. As an auxiliary problem, the problem of finding regression functions of the following kind is solved:
I g g ( t | X i ) = F g g ( ο ( t , X i ) | S o i l _ T y p e ( X i ) ) .
Here, I g g ( t | X i ) is the intensity of greenhouse gas emission; g g is an index of a greenhouse gas type, g g { C O 2 , C H 4 } ; X i is a point in space; and S o i l _ T y p e ( X i ) is the soil type at the point of space X i , according to the soil atlas. Examples of soil types include: gelisols, pistosols, alfisols, entisols, Inceptisols, spodosols, oxisols, etc. Nonparametric approximations for F g g ( ο ( t , X i ) | S o i l _ T y p e ( X i ) ) functions were constructed and refined in real time, using the data set from the MMS grid. According to the measurement data from the MMC grid, gradually, a full BigData Set was formed, which was used for high-quality approximation of F g g ( ) regressions, which we denote by F g g ( ) . A detailed description of this approximation, as well as the results obtained, is given in the next section of the article. It is assumed that the intensity of greenhouse gas generation measured by the sensors of the multimodal station is generated by an area of soil that is immediately adjacent to the installation point of the station. The area of this plot S ( X k ) is not known a priori, although it is quite small: j , k ω ( j ) : S ( X k ) < < Ω ( j ) . For simplicity, suppose that j , k ω ( j ) : S ( X k ) = S = c o n s t and S ( X k ) have the shape of a circle centered at point X k . The value of S must be estimated a priori in the process of additional research. In this case, to estimate the greenhouse emission intensity at point X i , we use a simple correction function: I g g C ( t | X i ) = I g g ( t | X i ) / S . To approximate the values of I g g ( t | ) at points x Ω \ X for any prism Ω ( j ) , approximation I g g ( j ) ( t | x ) is used, for which the following notation is true:
x Ω ( j ) Ω : I g g ( j ) ( t | x ) = k ω ( j ) I g g C ( t | X i ) λ ( x , k ) , λ ( x , k ) = x X k ( k ω ( j ) x X k ) 1
Thus, we have an opportunity to estimate temperature, humidity, and greenhouse gas emission levels at any point x Ω of the controlled space of the cryolithozone. Let T p r = ( t o , t o + Δ T ) ; t o , Δ T > 0 be the time prediction interval. Taking into account (1), an estimate of the value of greenhouse gas emissions of type g g   I g g ( T p r | Ω ) for the region forecasting Ω , can be determined in the following way:
I g g ( T p r | Ω ) = j J Ω ( i ) Δ T I g g ( j ) ( t | x ) d t d x
In practice, the Riemann integrals in (2) are calculated numerically.

4. Results

In this section, we present the results of numerical simulations, which prove the possibility of qualitative approximation of the regression function F g g ( ) . The fact is that a qualitative approximation of this regression function is the basis for the success of the proposed forecasting technique. Numerical experiments were performed on the data set, which was collected under real conditions.

4.1. Description of the Data Set and Conditions for Numerical Studies

To check the possibility of constructing a qualitative approximation of the regression function F g g ( ) , for g g = C O 2 , the data set “Soil CO2 Flux, Moisture, Temperature, and Litterfall” [14], which contains data on the intensity of soil CO2 emission depending on temperature, soil moisture, and soil type, was selected. These data contain measurements of CO2 emission rates, soil moisture, relative humidity, temperature, and litterfall from six types of tree plantations at the La Selva Biological Station, Costa Rica. All measurements were made (1) hourly during 2-day field campaigns and (2) as single daytime measurements during multiple survey campaigns, over the period 2004–2010. All measurements were made at the same sites with three to five measurements per plot. The experimental design included four randomized blocks composed of twelve 50-m × 50-m plots, each of which originally contained a single tree species. Four replicate plots of six plantation types, a total 24 plots, were included in this study. Obviously, the intensity of CO2 emission depends not only on temperature and moisture, but also on soil type, which largely determines the level of saturation of soil layers with C, and also determines the ability of soil to generate CO2. The process of CO2 generation by soil is multifactorial, including both reverse absorption of CO2 by the soil, and an increase in the generation of CO2 depending on the state of the whole complex of biochemical processes, which have a clearly expressed diurnal periodicity.
In this section, the task was to test the hypothesis that knowing the temperature of a particular soil area, its moisture content, and soil type; it is possible to predict the intensity of CO2 generation in this area with a fairly high accuracy. Data set “Soil CO2 Flux, Moisture, Temperature, and Litterfall” contains data on the intensity of soil CO2 emission (parameter “CO2_Flux_Exp”, number of micromoles of CO2 per m2 per 1 s) depending on a group of parameters, including the temperature (parameter “Tsoil”) measured at two depths of 5 cm and 10 cm (parameter “z(Tsoil)”), the type of vegetation at the measurement location (four varieties), the relative humidity (parameter “RH”, %), and the H2O content in 1 cm3 of soil at 12 cm depth, expressed as a percentage (parameter “Soil_H2O”). Let us call a particular realization of this group of parameters a parametric point. The parameters date and time of the measurement as well as several characteristics of the measurement location were also available and used. The generalized soil type in the test region should be referred to the “oxisols” type. Unfortunately, almost 97% of the values of this parameter in the data set were corrupted and equal to the same value, −9999. However, the “alphabetic code for the planted tree species” parameter was clearly defined for each place where “CO2_Flux_Exp” parameter was measured. Each type of planted tree leaves a corresponding type of foliage in the soil. The foliage, in the process of its decomposition, contributes significantly to the generation of greenhouse gases. Thus, the parameter “planted tree type code”, to a certain extent, replaces the parameter “soil type”, which turned out to be unavailable for the numerical study. The values of the parameter “alphabetic code for the planted tree species” referenced in the following text of the article have the following values: HIAL is Hieronyma alchorneoides; PEMA is Pentaclethra macroloba; PIPA is Pinus patula subspecies tecunumanii; VIKO is Virola koschnyi; VOFE is Vochysia ferruginea; and VOGU is Vochysia guatemalensis. It was found that there is quite a significant relationship between the parameters RH and Soil_H2O: Spearman rank correlation coefficient between the available samples of these parameters was 0.52 (p-value = 1.18 × 10⁻⁶), and Pearson correlation coefficient was 0.48 (p-value = 7.62 × 10⁻⁸). That is, there is a correlation between “RH” and “Soil_H2O” values, albeit a weak one. Thus, “RH” characterizes “Soil_H2O” to a certain extent, and this fact, in general, is consistent with the general physical ideas about the process of moisture transfer from air to soil and back. Since the “suitable” measurements of parameter “Soil_H2O” (102 pieces) turned out to be insufficient for the qualitative construction of the regression function F g g ( ) , it was decided to exclude the use of this parameter completely, assuming that its properties are partially reflected in the “RH” parameter. The results of numerical simulation fully confirmed the assumption made.
Additionally, the statistical dependence between the parameters of intensity of soil CO2 emission (“CO2_Flux_Exp” parameter) and soil temperature was rather weak. For example, the Spearman rank correlation coefficient was only 0.17 (p-value = 0.1), although physically this relationship certainly exists. The point is that the relationship function of these quantities additionally depends on a group of other parameters. Approximation of this function, taking into account the group of additional parameters, was one of the tasks of this study.
As already mentioned, the process of CO2 emission depends to a large extent on the type of soil, and hence on the place where it is measured. In addition, the time of day has a certain influence (daylight plays a significant role in photosynthesis processes). All these facts were taken into account in the process of approximation of the regression function F g g ( ) . A group of computational experiments was carried out. All experiments followed the same scheme, which was designed to provide high generalizability:
  • Approximation method: GBR (Gradient Boosting Regression) [15].
  • The available data set was always divided into two parts: the power of the first part 70%, and the power of the second part 30%. The first part was used for regression reconstruction, and the second part for testing. This was carried out in order to increase the generalizability of the approximation function. All results that summarize specific experiments always correspond to the test part of the sample only, according to the principle of cross validation.
  • Several standard metrics were used to control the quality of approximation, including: MSE (mean squared error), explained_variance_score (explained variance regression score function, best possible score is 1.0, lower values are worse), max_error (maximum residual error), mean_absolute_error (mean absolute error regression loss), mean_squared_error (mean squared error regression loss), and r2_score (coefficient of determination regression, best possible score is 1.0). The metric r2_score was considered as dominant.
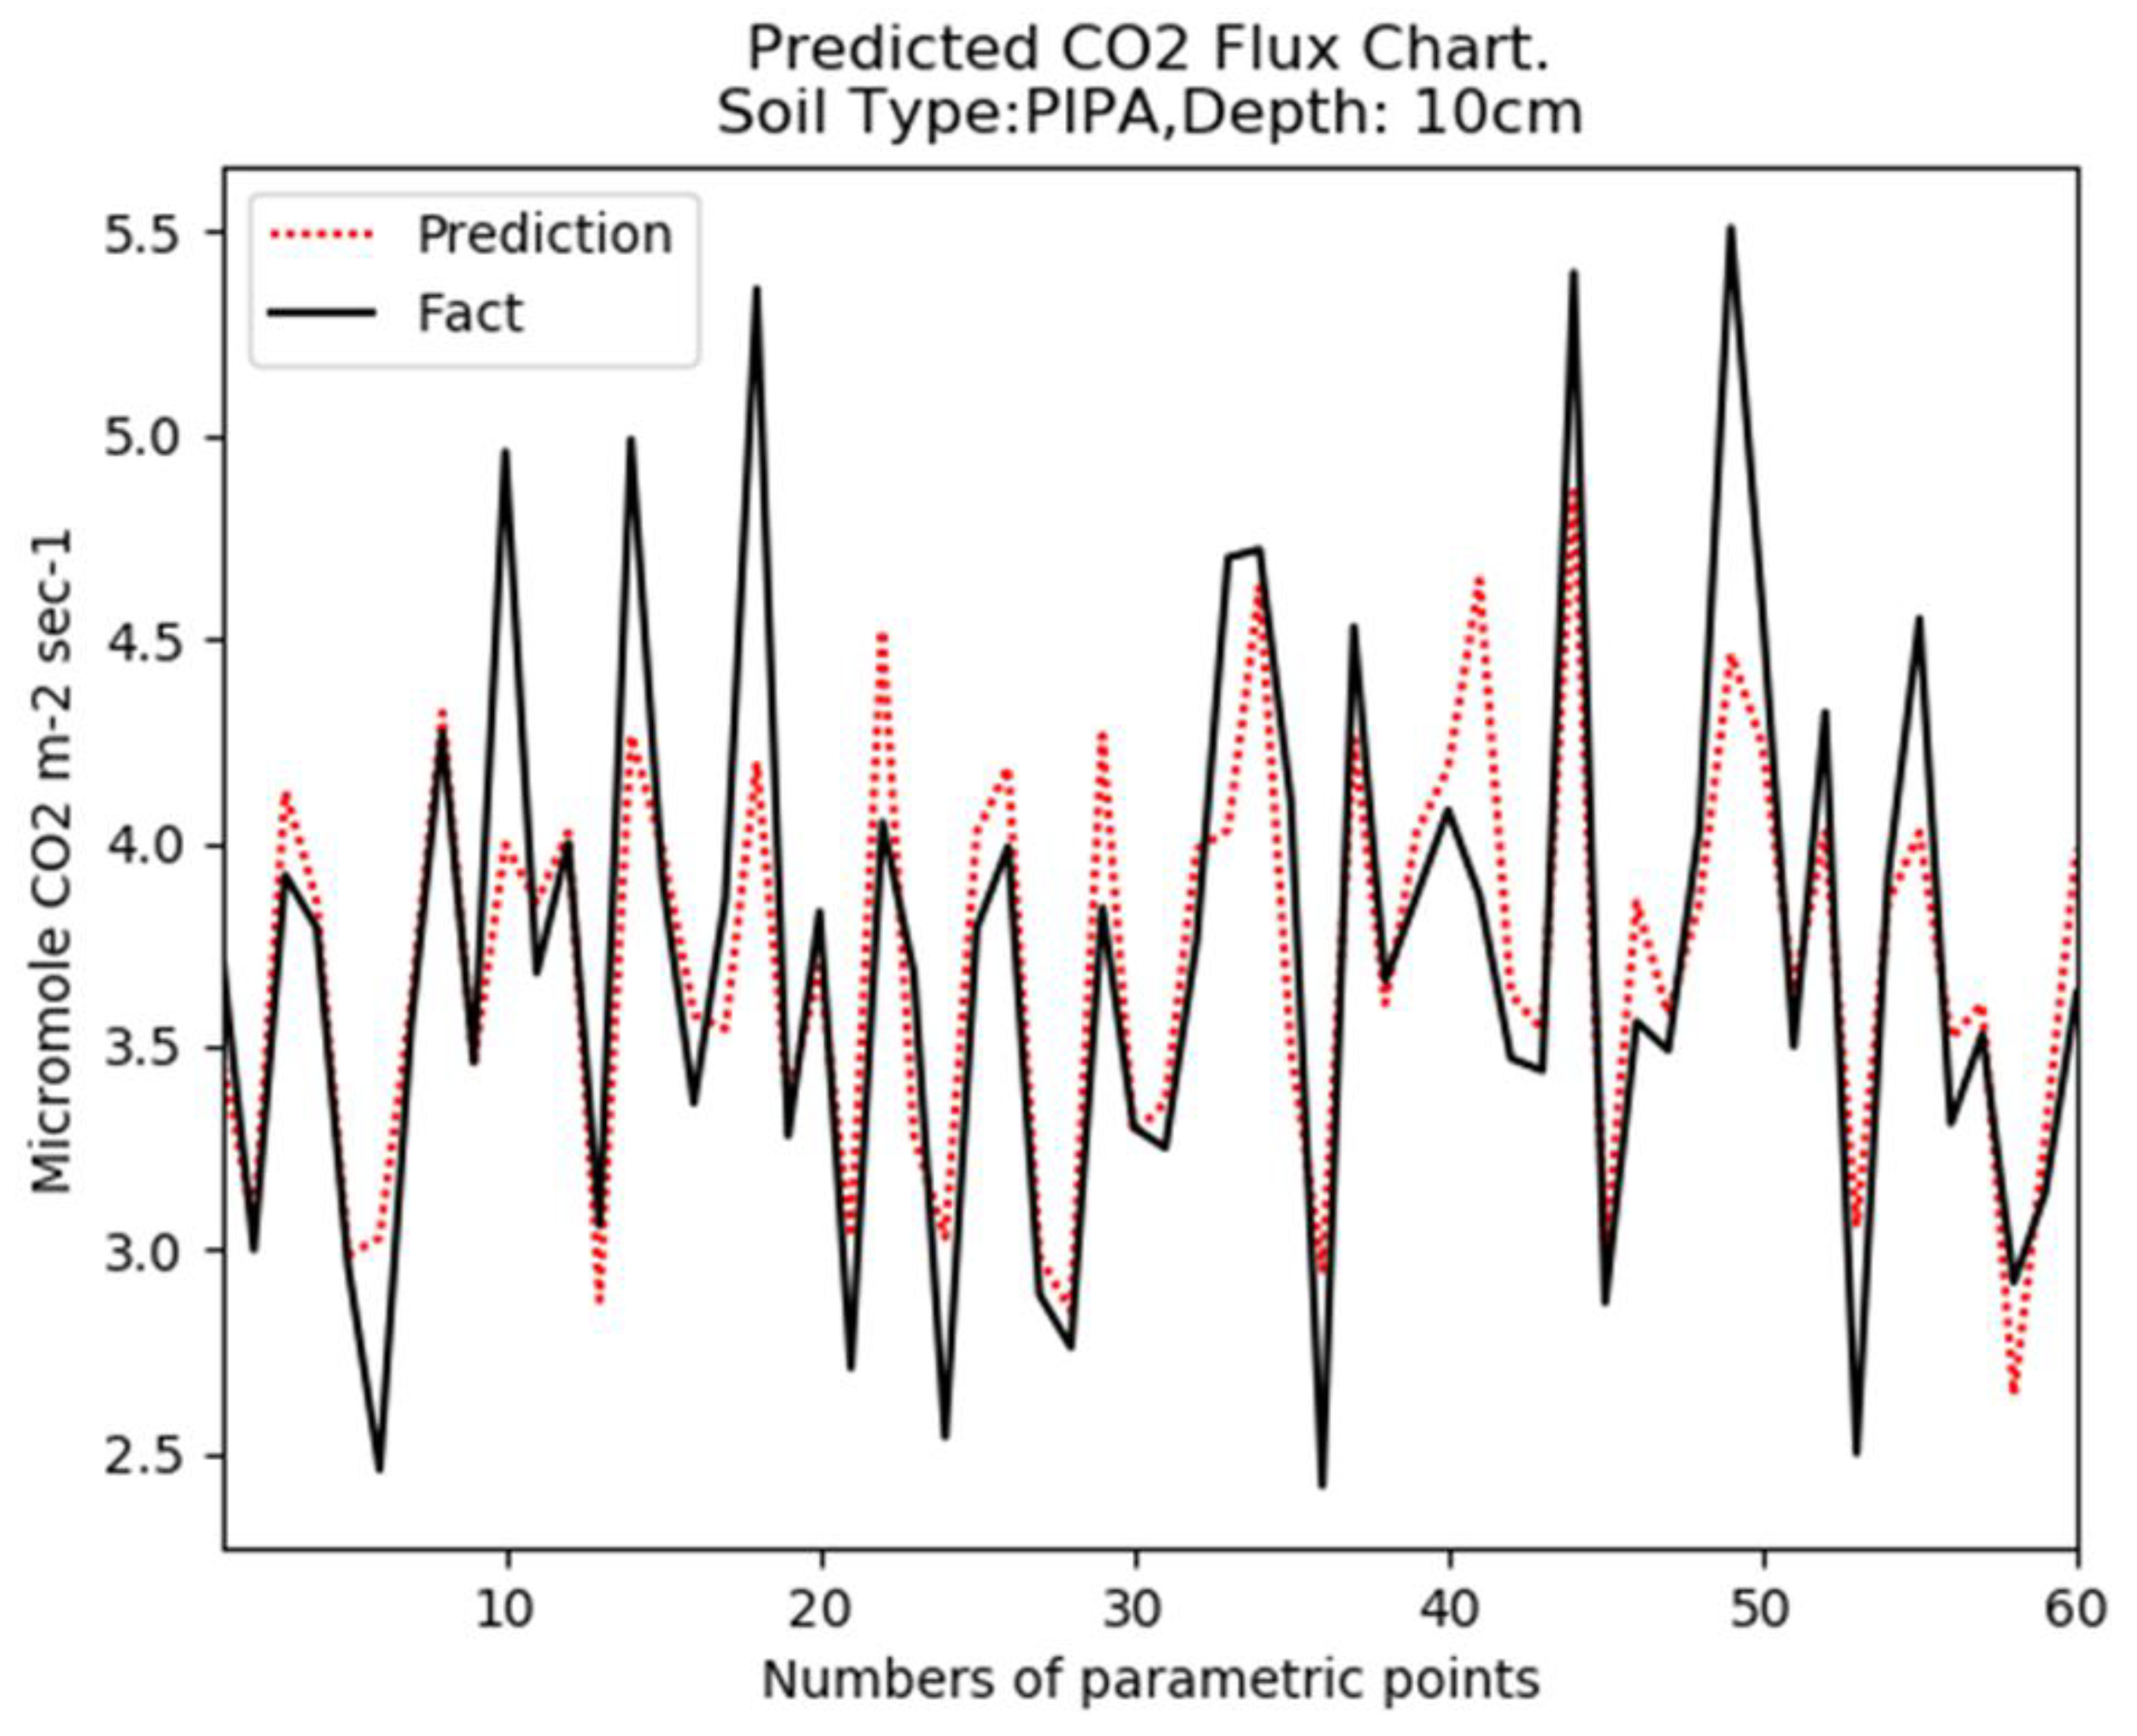
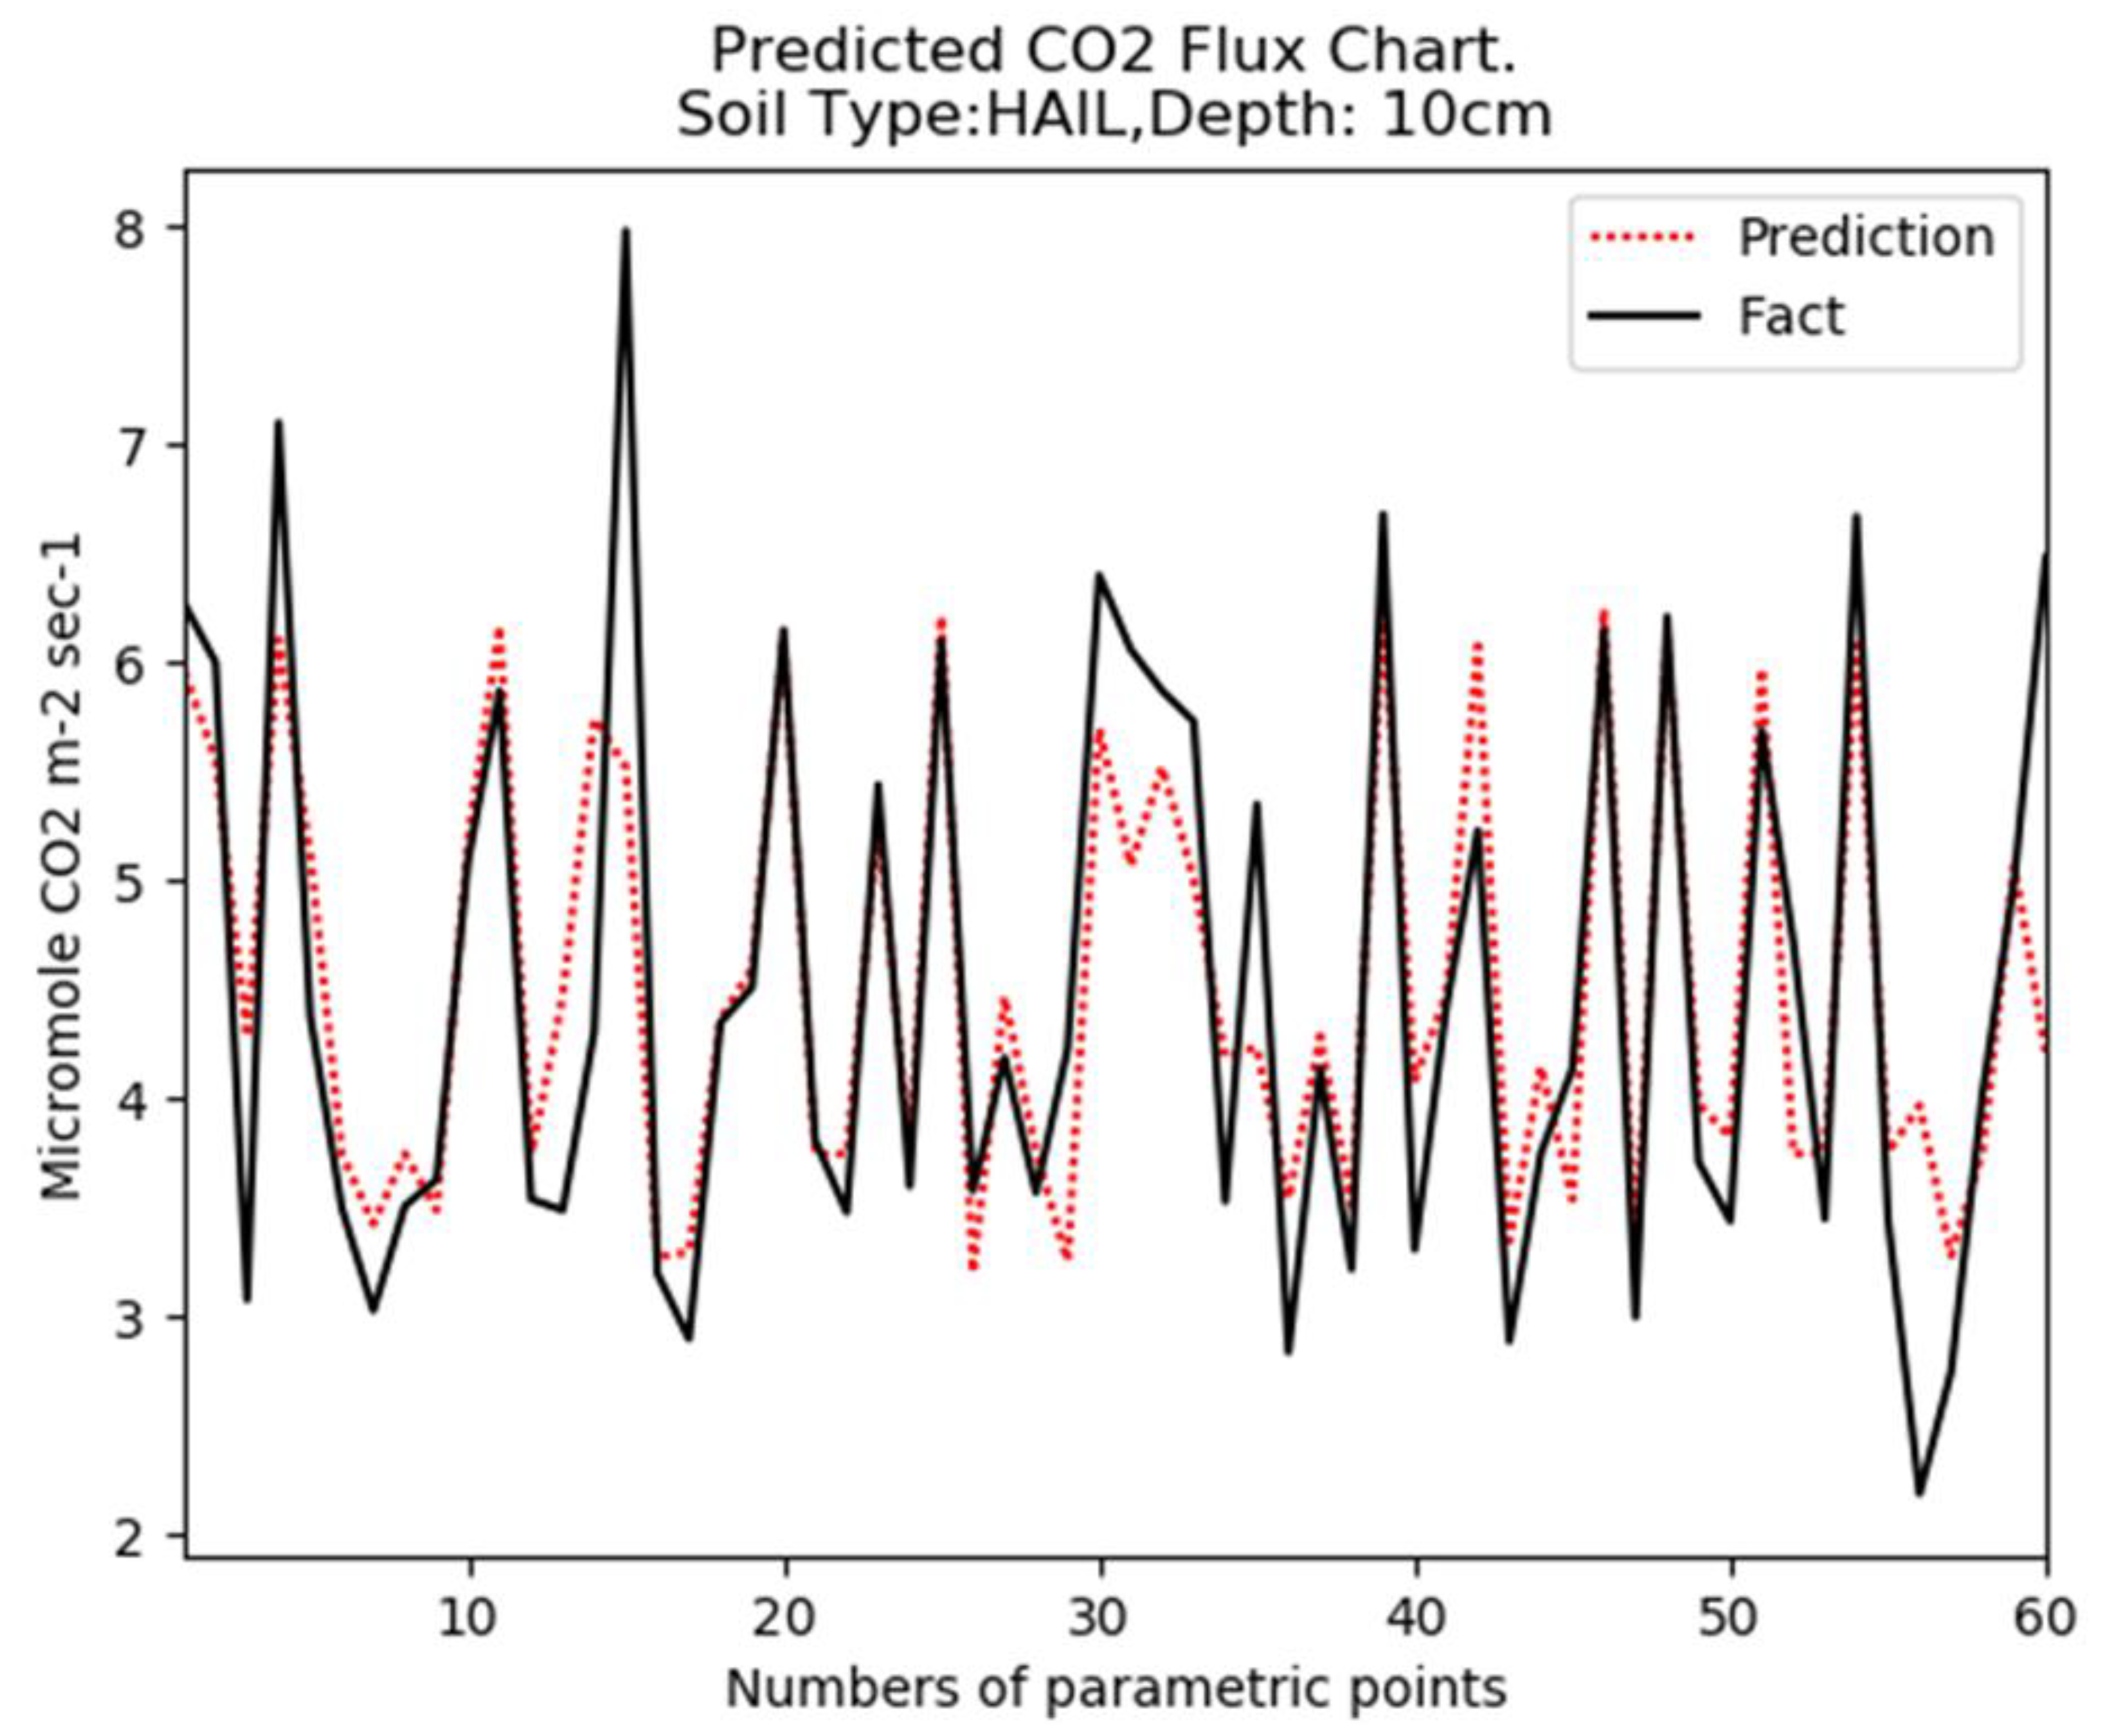
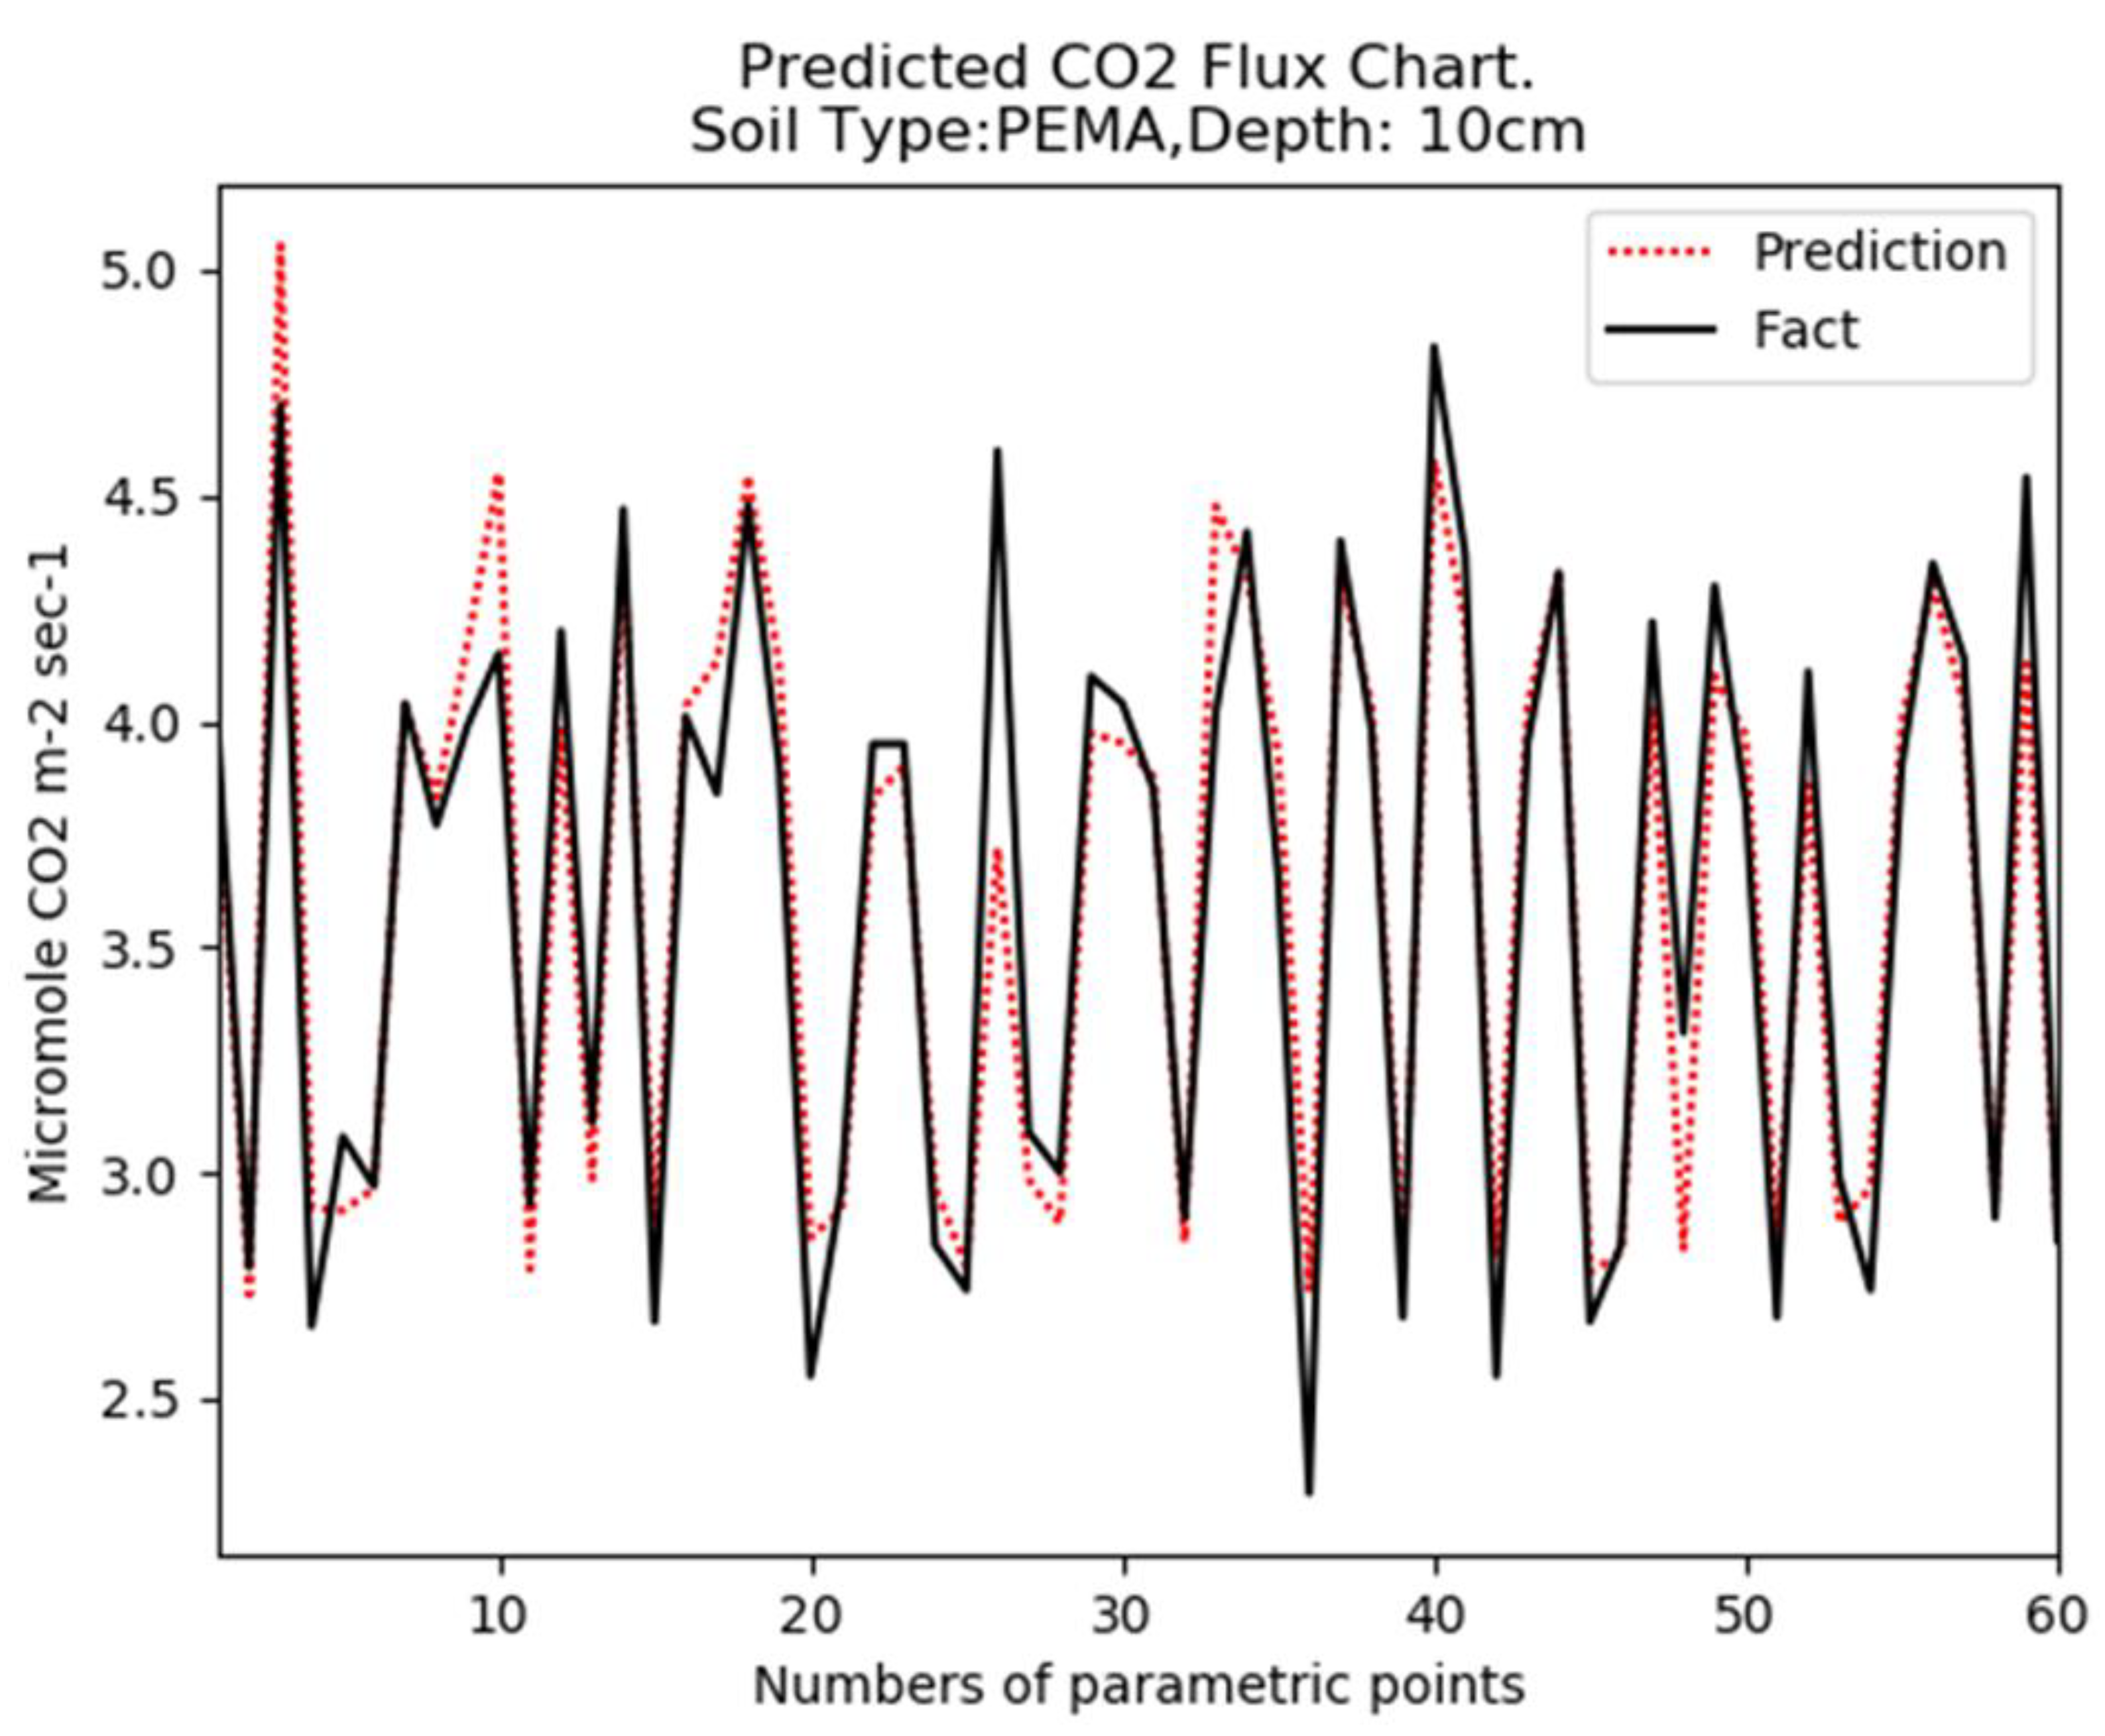
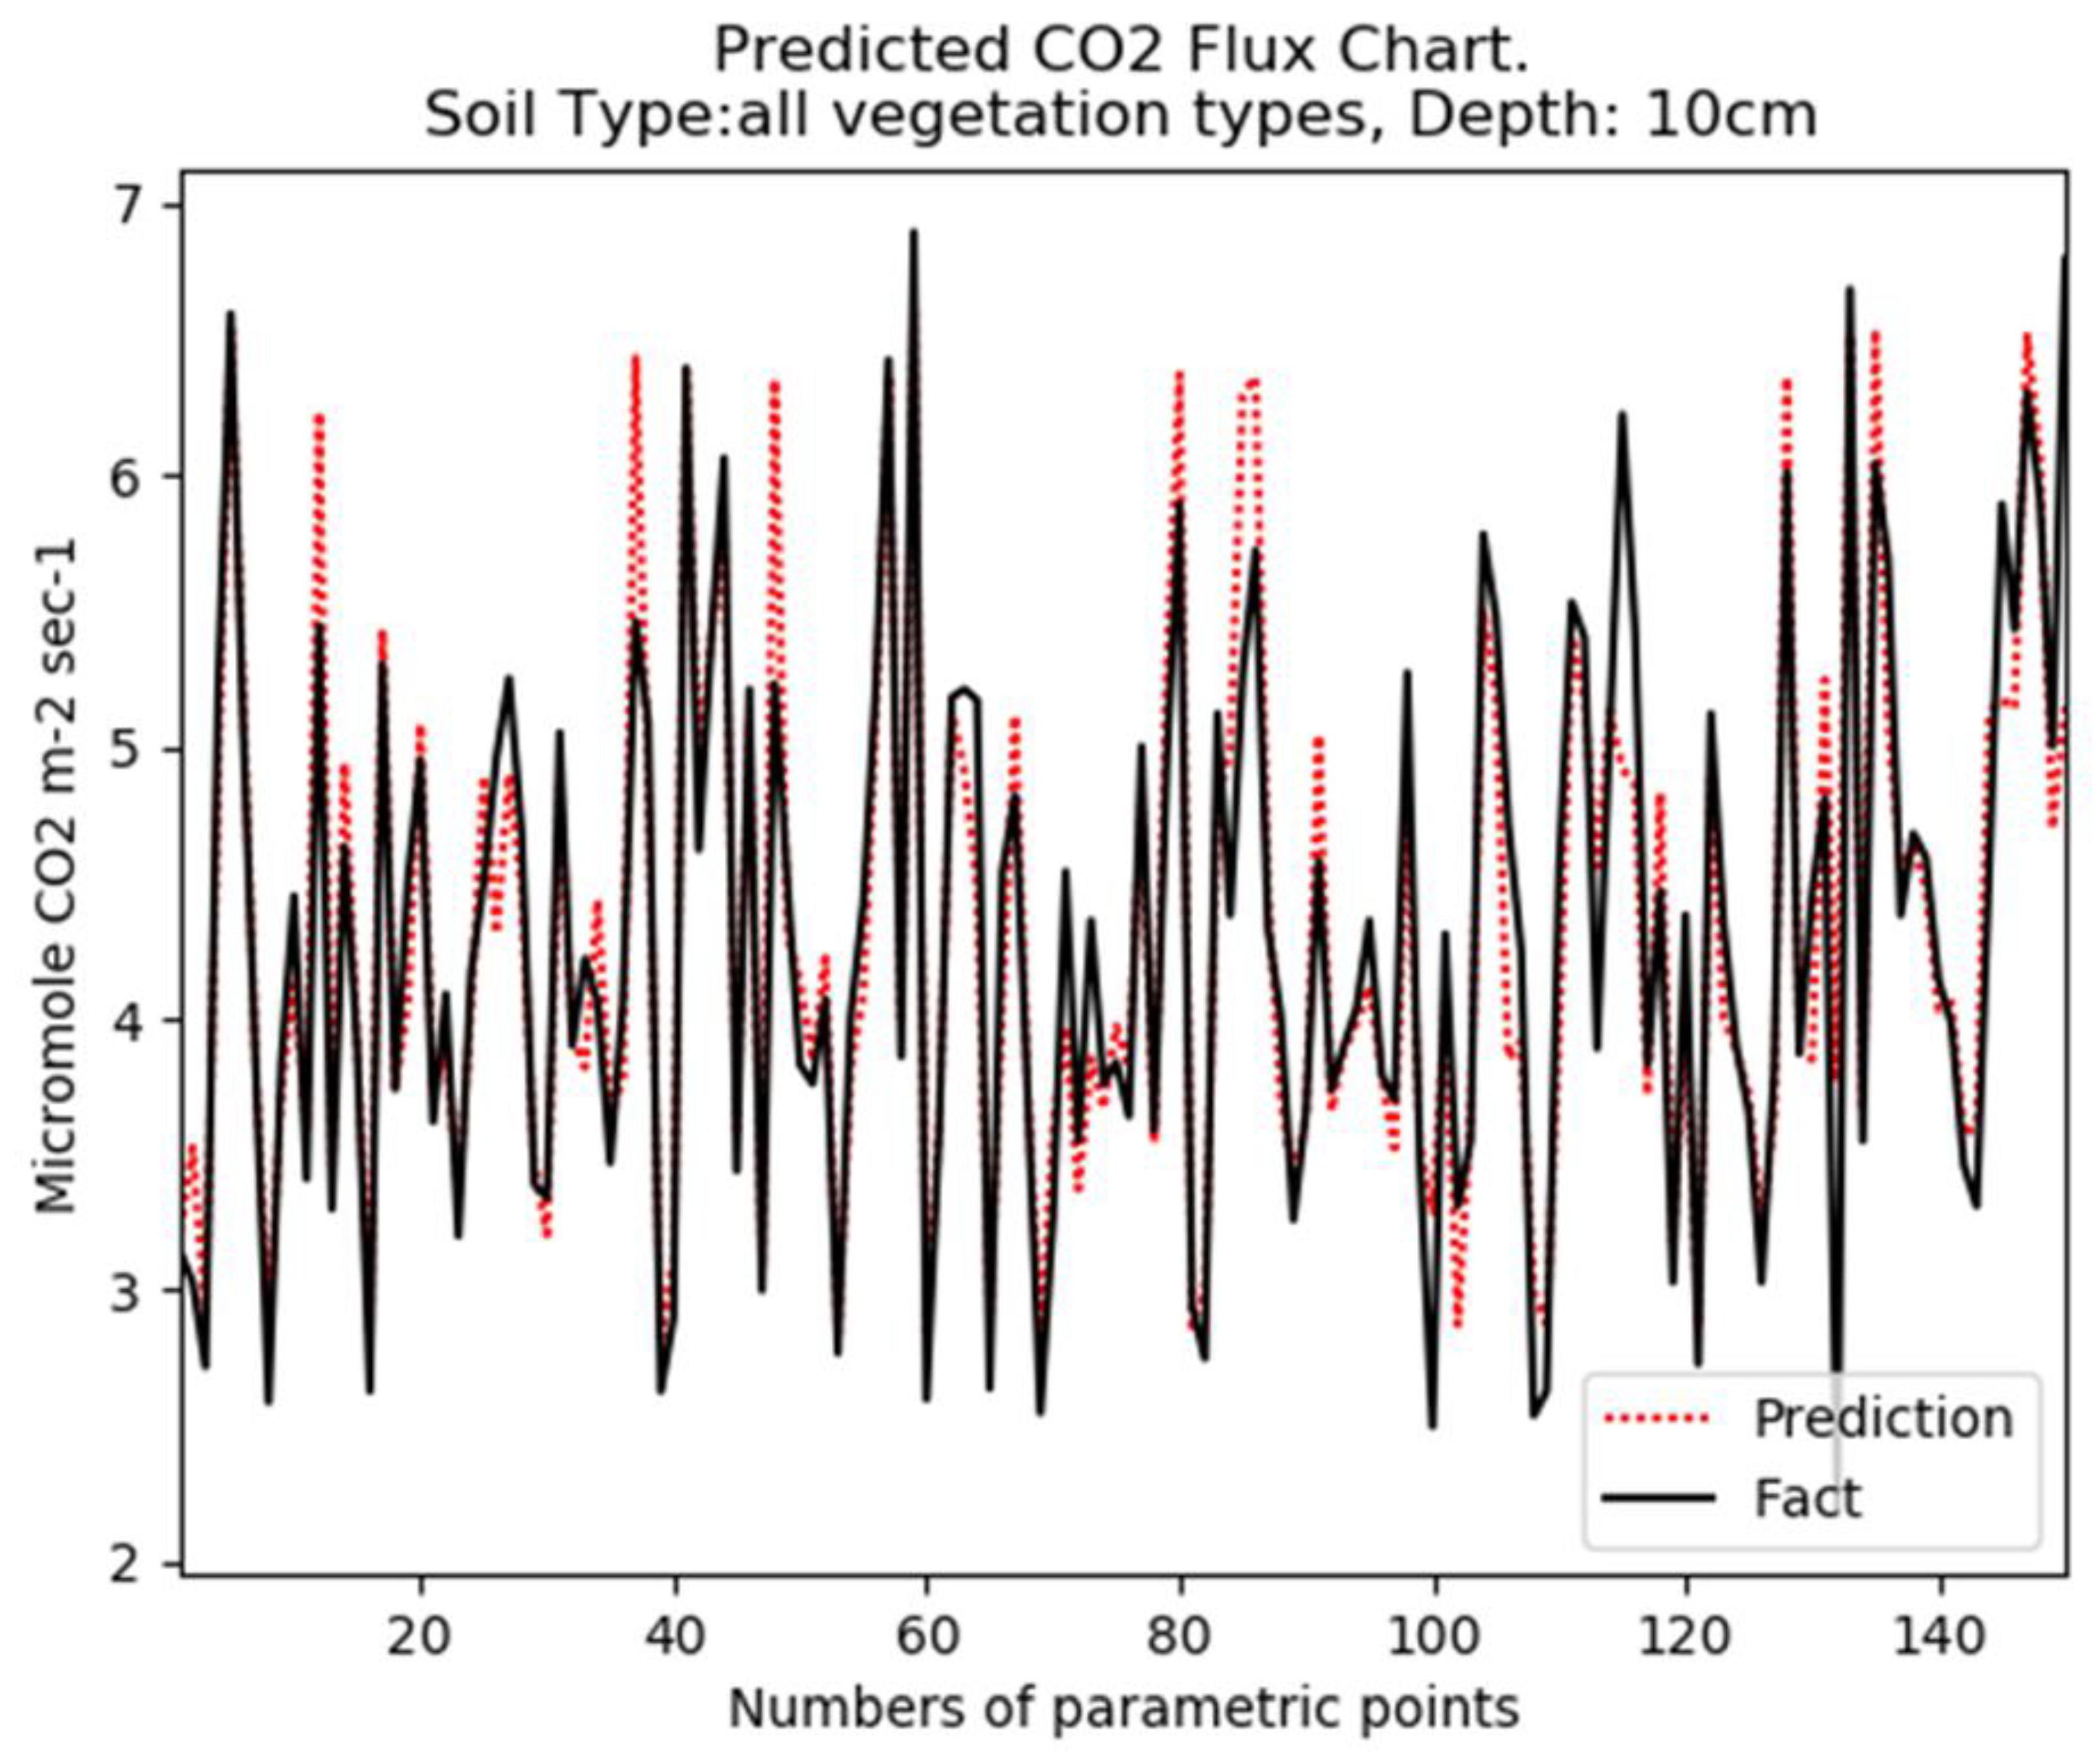
The regression function was reconstructed at different time intervals for different types of vegetation. In the graphs in Figures 2–5, the numbers of parametric points are plotted on the x axis (abscissa axis), each of which corresponds to a particular realization of a group of parameters (air temperature, relative humidity, etc.) On the x axis, the parametric points are arranged in ascending order of the moments of time at which these points were measured. This sequence of time moments is an irregular time series.

4.2. A Description of the Experimental Conditions and the Results Obtained in These Experiments

In the next group of experiments, the possibility of a qualitative approximation of the F g g ( ) function was tested for each vegetation type. The quality of F g g ( ) approximation was also checked for the case where the data set contained measurements from spatial points with different vegetation types. After approximation for F g g ( ) regression was built, its behavior in dependence on “soil temperature” and “soil moisture” parameters was checked. The behavior of F g g ( ) should be consistent with theoretical assumptions. Since the main soil characteristic used in this series of experiments is almost entirely determined by the type of vegetation that grows at the measurement location, we, for simplicity, used the vegetation code as the soil type characteristic. For example: “Soil Type: PEMA”.

4.2.1. Experiment 1

The objective of the experiment was to test the quality of the approximation of the F g g ( ) regression on daily data for PIPA vegetation type. Soil temperatures were measured at a depth of 10 cm. For each parametric point, the soil temperature at the time of measurement belongs to the interval (22 °C, 26 °C). Number of parametric points: 200. The approximation quality parameters are given in Table 1, and the result of the approximation is shown in Figure 2. Overall, it can be concluded that the quality of the approximation reflected in Table 1 is quite satisfactory.

4.2.2. Experiment 2

Here, we checked the quality of the approximation of the regression F g g ( ) on daily data for HAIL vegetation type. The soil temperature was measured at a depth of 10 cm. For each parametric point, the soil temperature at the time of measurement belongs to the interval (22 °C, 26 °C). Number of parametric points: 200. The approximation quality parameters are given in Table 2, and the result of the approximation is shown in Figure 3. The approximation quality is comparable to the approximation quality from experiment 1.

4.2.3. Experiment 3

In this experiment, the quality of the F g g ( ) approximation was tested for the VIKO vegetation type. The soil temperature was measured at a depth of 10 cm. For each parametric point, the soil temperature at the time of measurement belongs to the interval (22 °C, 26 °C). Number of parametric points: 200. The approximation quality parameters are given in Table 3, and the result of the approximation is shown in Figure 4. The approximation quality is very good.

4.2.4. Experiment 4

Here, we worked with the PEMA vegetation type. Temperature measurement depth was 10 cm. The approximation quality parameters are given in Table 4, and the result of the approximation is shown in Figure 5.

4.2.5. Experiment 5

In this case, approximation was carried out for all vegetation types from the observation area, including HIAL, PEMA, PIPA, VIKO, VOFE, and VOGU. Temperature measurement depth was 10 cm. For each parametric point, the soil temperature at the time of measurement belongs to the interval (22 °C, 26 °C). Number of parametric points: 500. The approximation quality parameters are given in Table 5, and the result of the approximation is shown in Figure 6.
Further, the properties of this regression F g g ( ) were investigated, particularly the sensitivity of the model to the parameters of soil temperature (“Tsoil”) and relative humidity (“PH”). These studies were formalized in the form of the following experiments.

4.2.6. Experiment 6

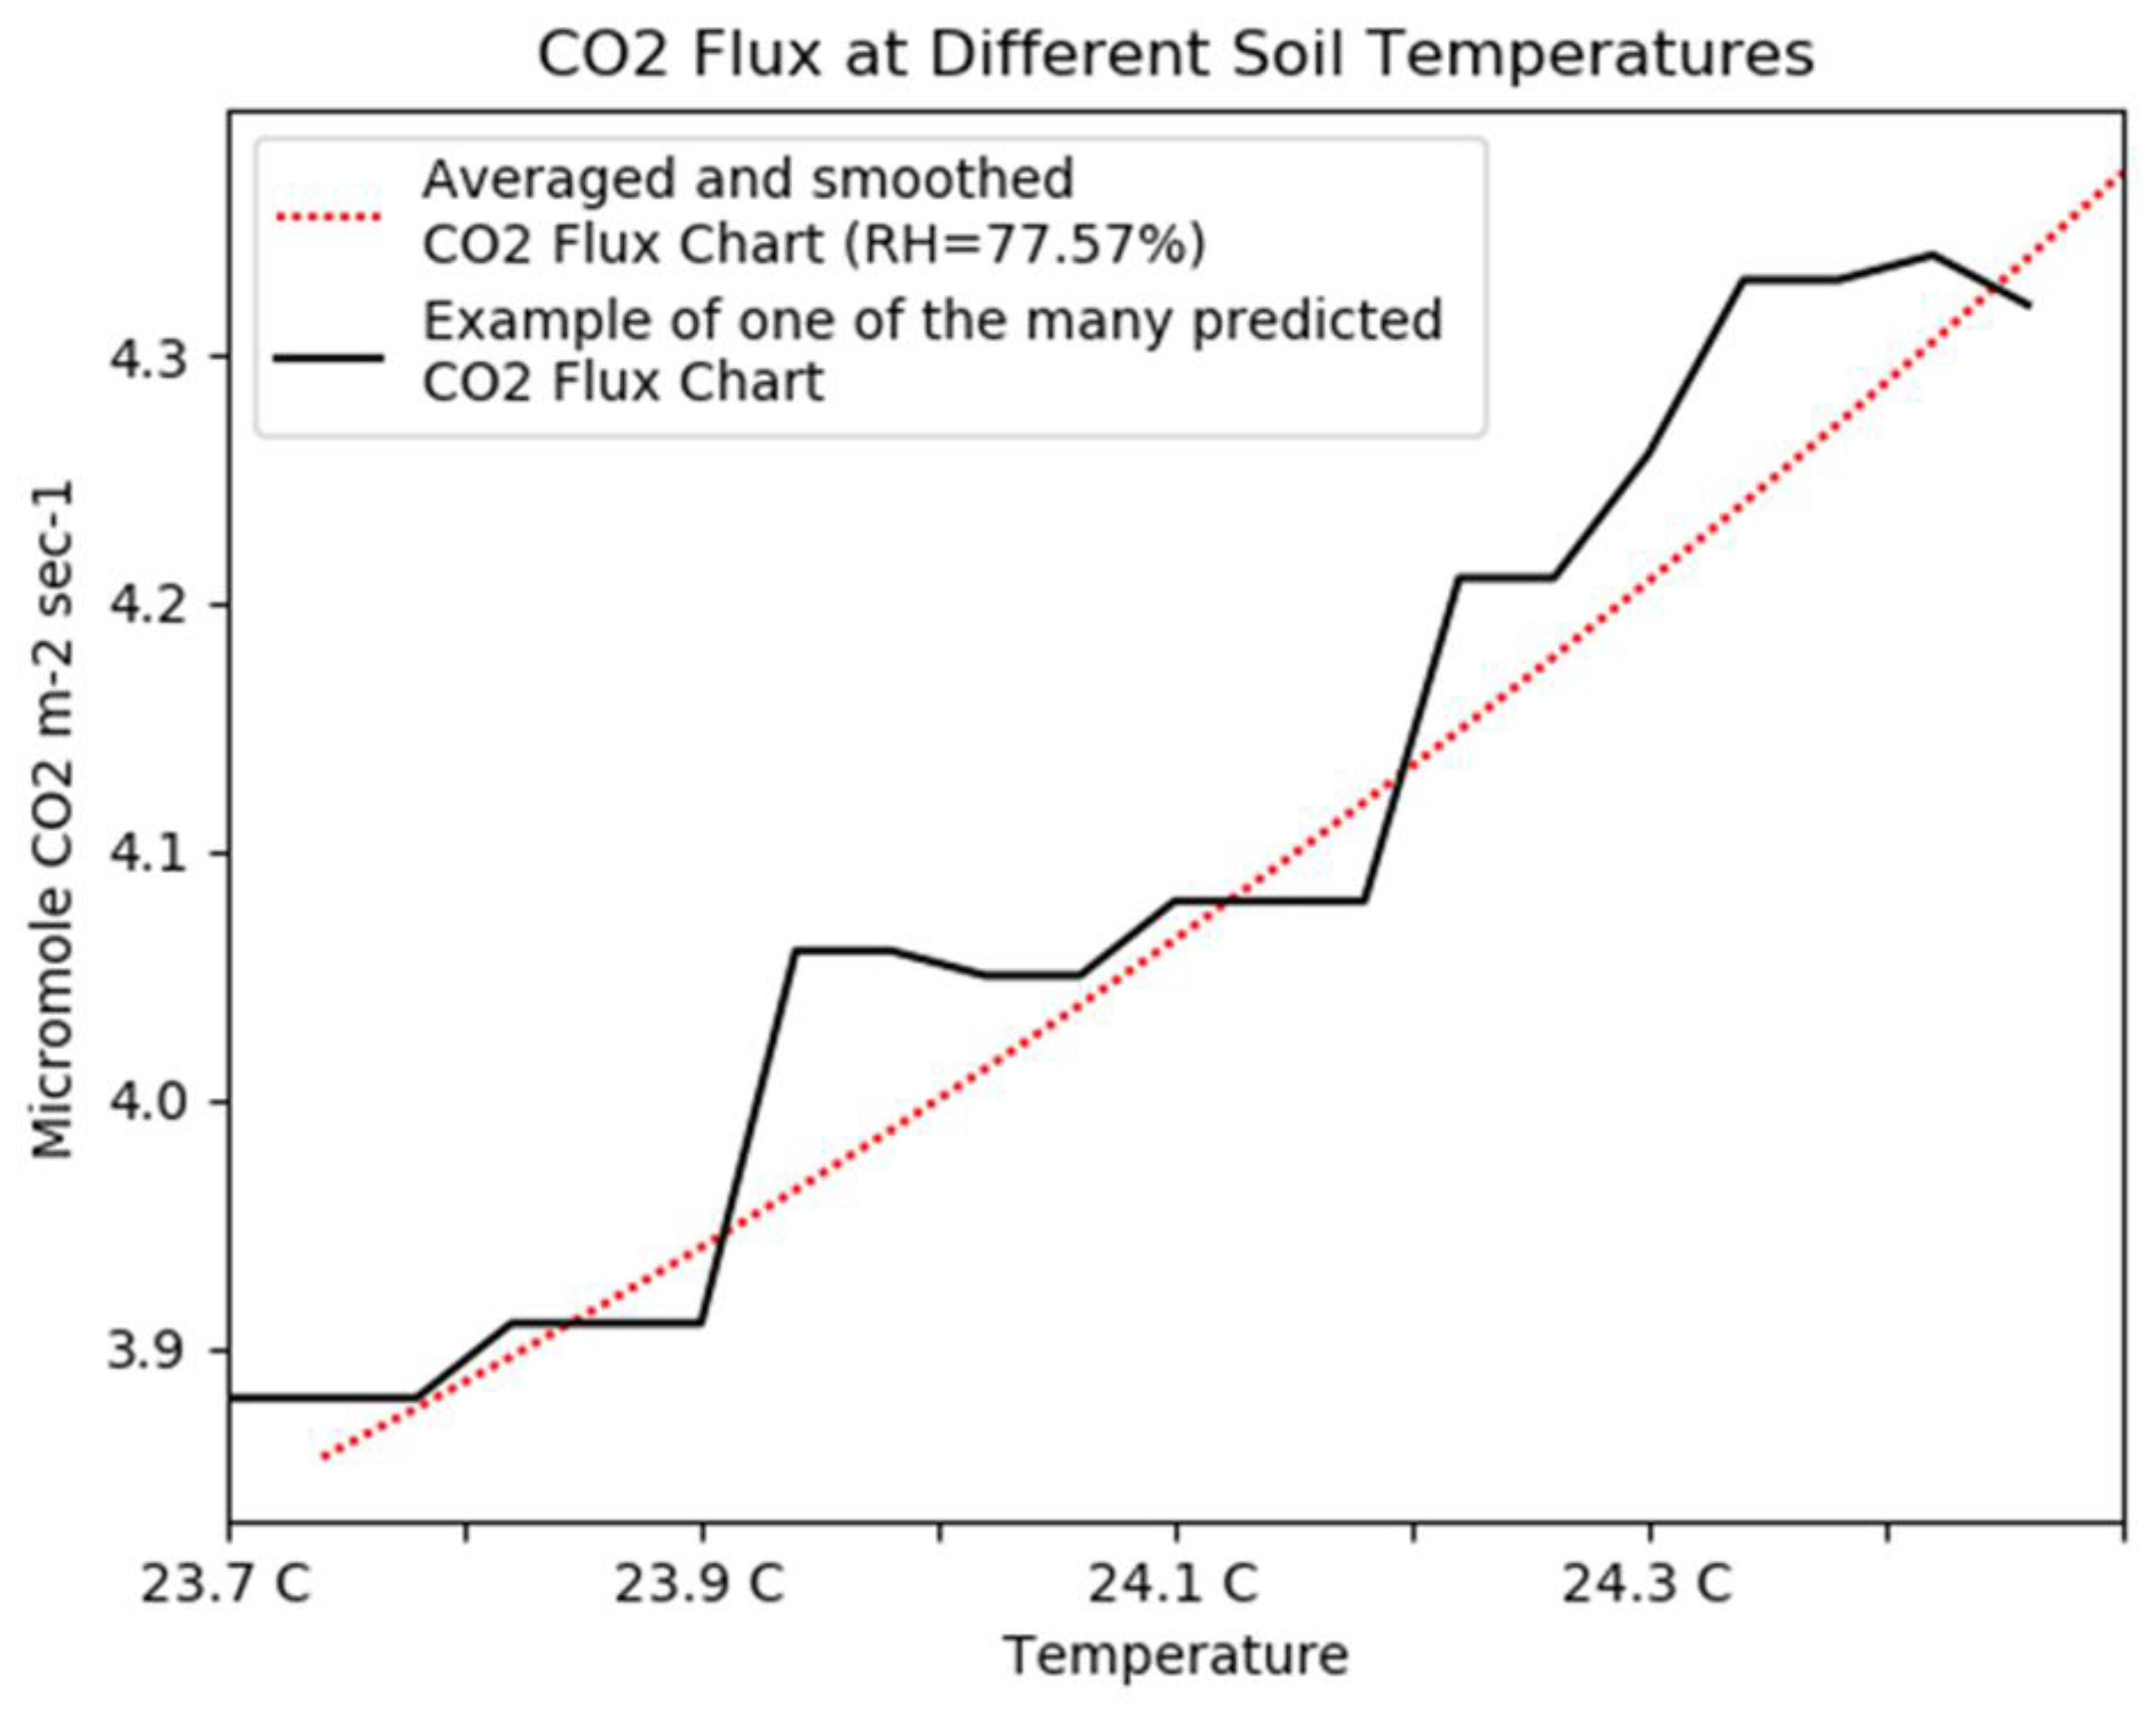
The purpose of this experiment was to study the behavior of CO2 flux intensity as a function of temperature (“Tsoil”) within the framework of the previously constructed approximation F g g ( ) . The approximation F g g ( 5 ) [ ] from experiment 5 was used. The regressor “Tsoil” (or T) growth rate was 0.1 °C. Initial value of parameter T was 23.7 °C. Let us denote the dataset that we used in this experiment as D S = { ( S o i l _ C O 2 _ F l u x i , T i , r H i , S o i l _ T y p e ( X i ) ) i | i { 1 , N } } . Here, i is index of record, to which correspond values S o i l _ C O 2 _ F l u x i (CO2 emission rate), and T i , r H i , S o i l _ T y p e ( X i ) , X i respectively are soil temperature, relative soil humidity, and soil type at measuring point X i . F g g ( 5 ) [ T | r H , S o i l _ T y p e ( X ) ] is the approximation that was obtained in experiment 5. The result of this experiment is shown in Figure 7.
The main point is the “Averaged and Smoothed CO2 Flux” Chart. This function describes the tendency of the S o i l _ C O 2 _ F l u x S A ( T ) value to change with temperature averaged over a set of auxiliary parameter { ( r H , S o i l _ T y p e ( X ) ) i } values. The function “Averaged and Smoothed CO2 Flux” S o i l _ C O 2 _ F l u x S A ( T ) has the following form:
S o i l _ C O 2 _ F l u x S A ( T ) = i = 1 N F g g [ T | r H i , S o i l _ T y p e ( X i ) ] N .
The second chart is given for an example of a typical CO2 flux forecast implementation when we use only one regressor: the temperature. In this case, a function F g g ( 5 ) [ T | r H i , S o i l _ T y p e ( X i ) ] corresponds to a randomly chosen index 1 i N . The graph shows that the CO2 emission rate is a monotonically increasing function of temperature. This is quite consistent with the physical meaning of carbon dioxide emission process. Thus, in this sense, the approximation built for F g g ( ) is quite adequate:

4.2.7. Experiment 7

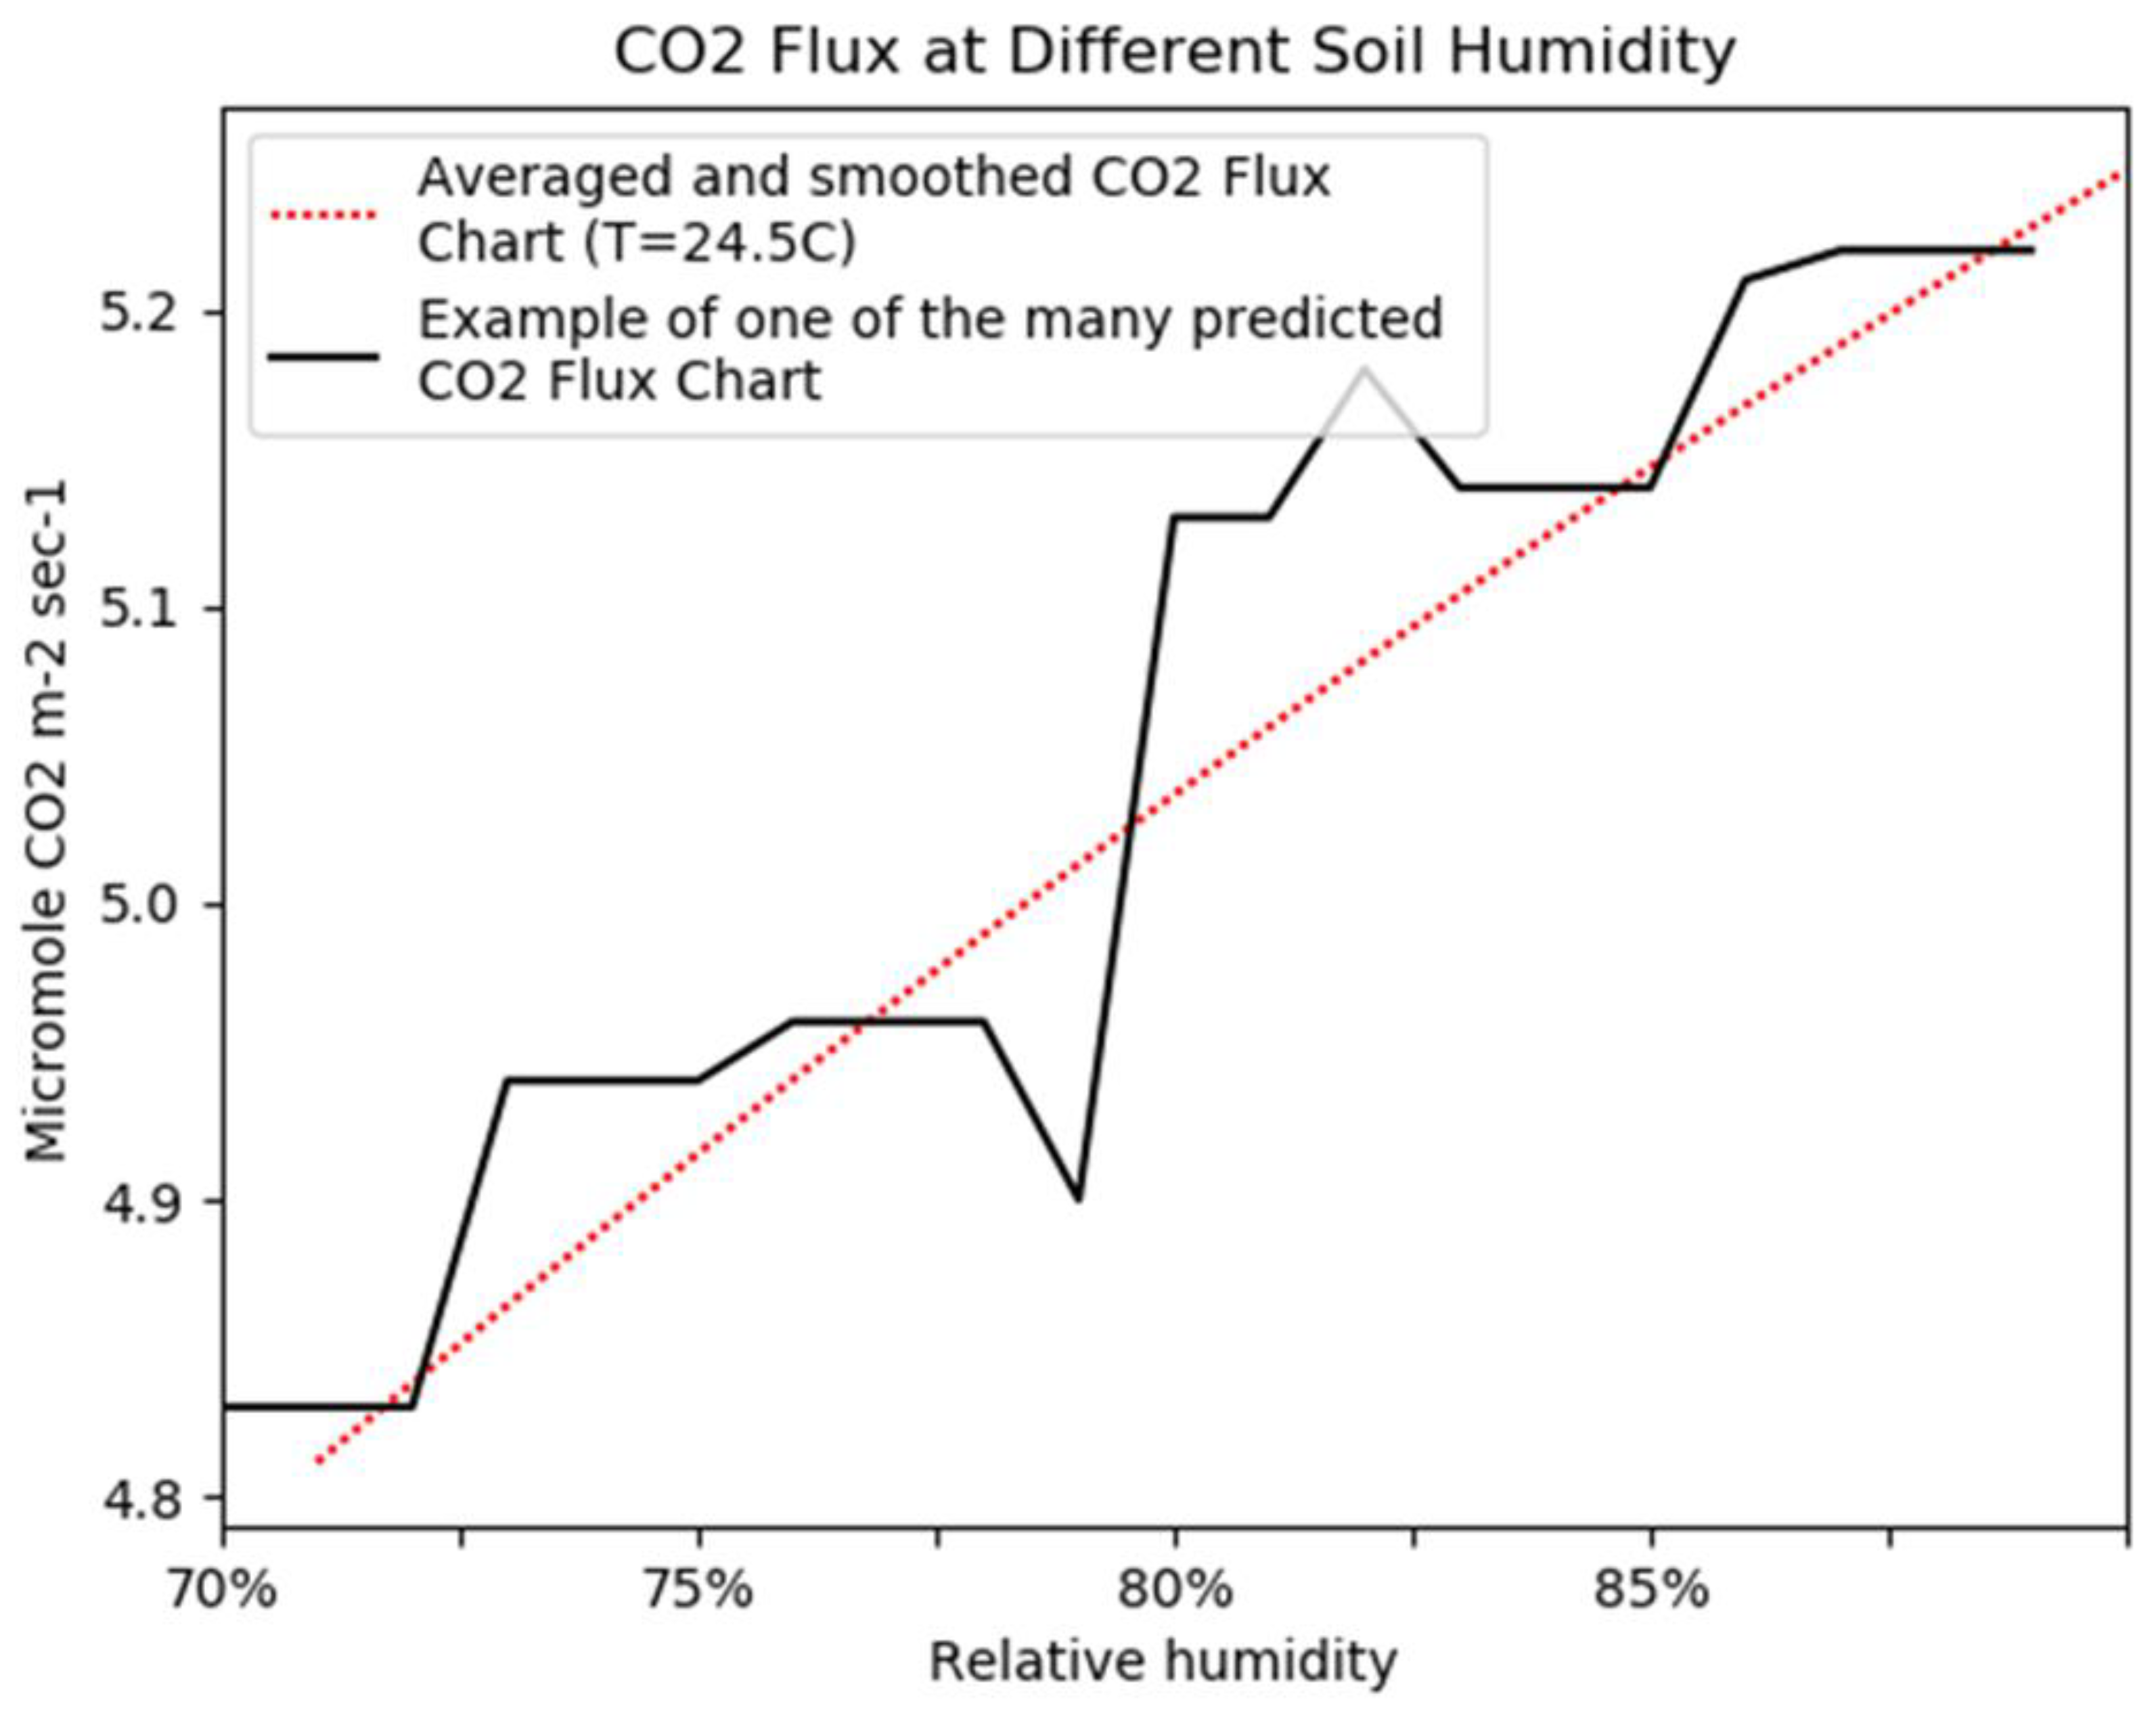
Similarly, with the conditions of experiment 6, the purpose of this experiment was to study the behavior of CO2 flux intensity as a function of relative humidity (rH). The approximation F g g ( 5 ) [ p H | T , S o i l _ T y p e ( X ) ] from experiment 5 was used. The regressor rH growth rate was 1%. Initial value of parameter rH was 70%. The result of this experiment is shown in Figure 8.
As in experiment 6, the main point is the “Averaged and Smoothed CO2 Flux” chart. In this case, the function “Averaged and Smoothed CO2 Flux” S o i l _ C O 2 _ F l u x S A ( r H ) has the following form:
S o i l _ C O 2 _ F l u x S A ( r H ) = i = 1 N F g g [ r H | T i , S o i l _ T y p e ( X i ) ] N .
As before, the second graph is given for an example of a typical CO2 flux forecast implementation when we use only one regressor: rH. A function F g g ( 5 ) [ r H | T i , S o i l _ T y p e ( X i ) ] corresponds to a randomly chosen index 1 i N . Here, the CO2 emission rate is a monotonically increasing function of relative humidity. This makes perfect sense physically. Thus, the approximation F g g ( ) is quite adequate in this sense too.

4.2.8. Experiment 8

The objective of this experiment was to confirm that model ( F g g ( ) ) shows a monotonic dependence of the CO2 flux intensity on a simultaneous increase in both soil temperature (“Tsoil” or T) and soil relative humidity (rH). The approximation F g g ( 5 ) [ T , p H | S o i l _ T y p e ( X ) ] from experiment 5 was used (the same as in experiments 6 and 7). The regressor rH growth rate was 1%. Initial value of parameter rH was 70%, and the regressor Tsoil (or T) growth rate was 0.1 °C. Initial value of parameter T was 23.7 °C. The results of this experiment are shown in Figure 9.
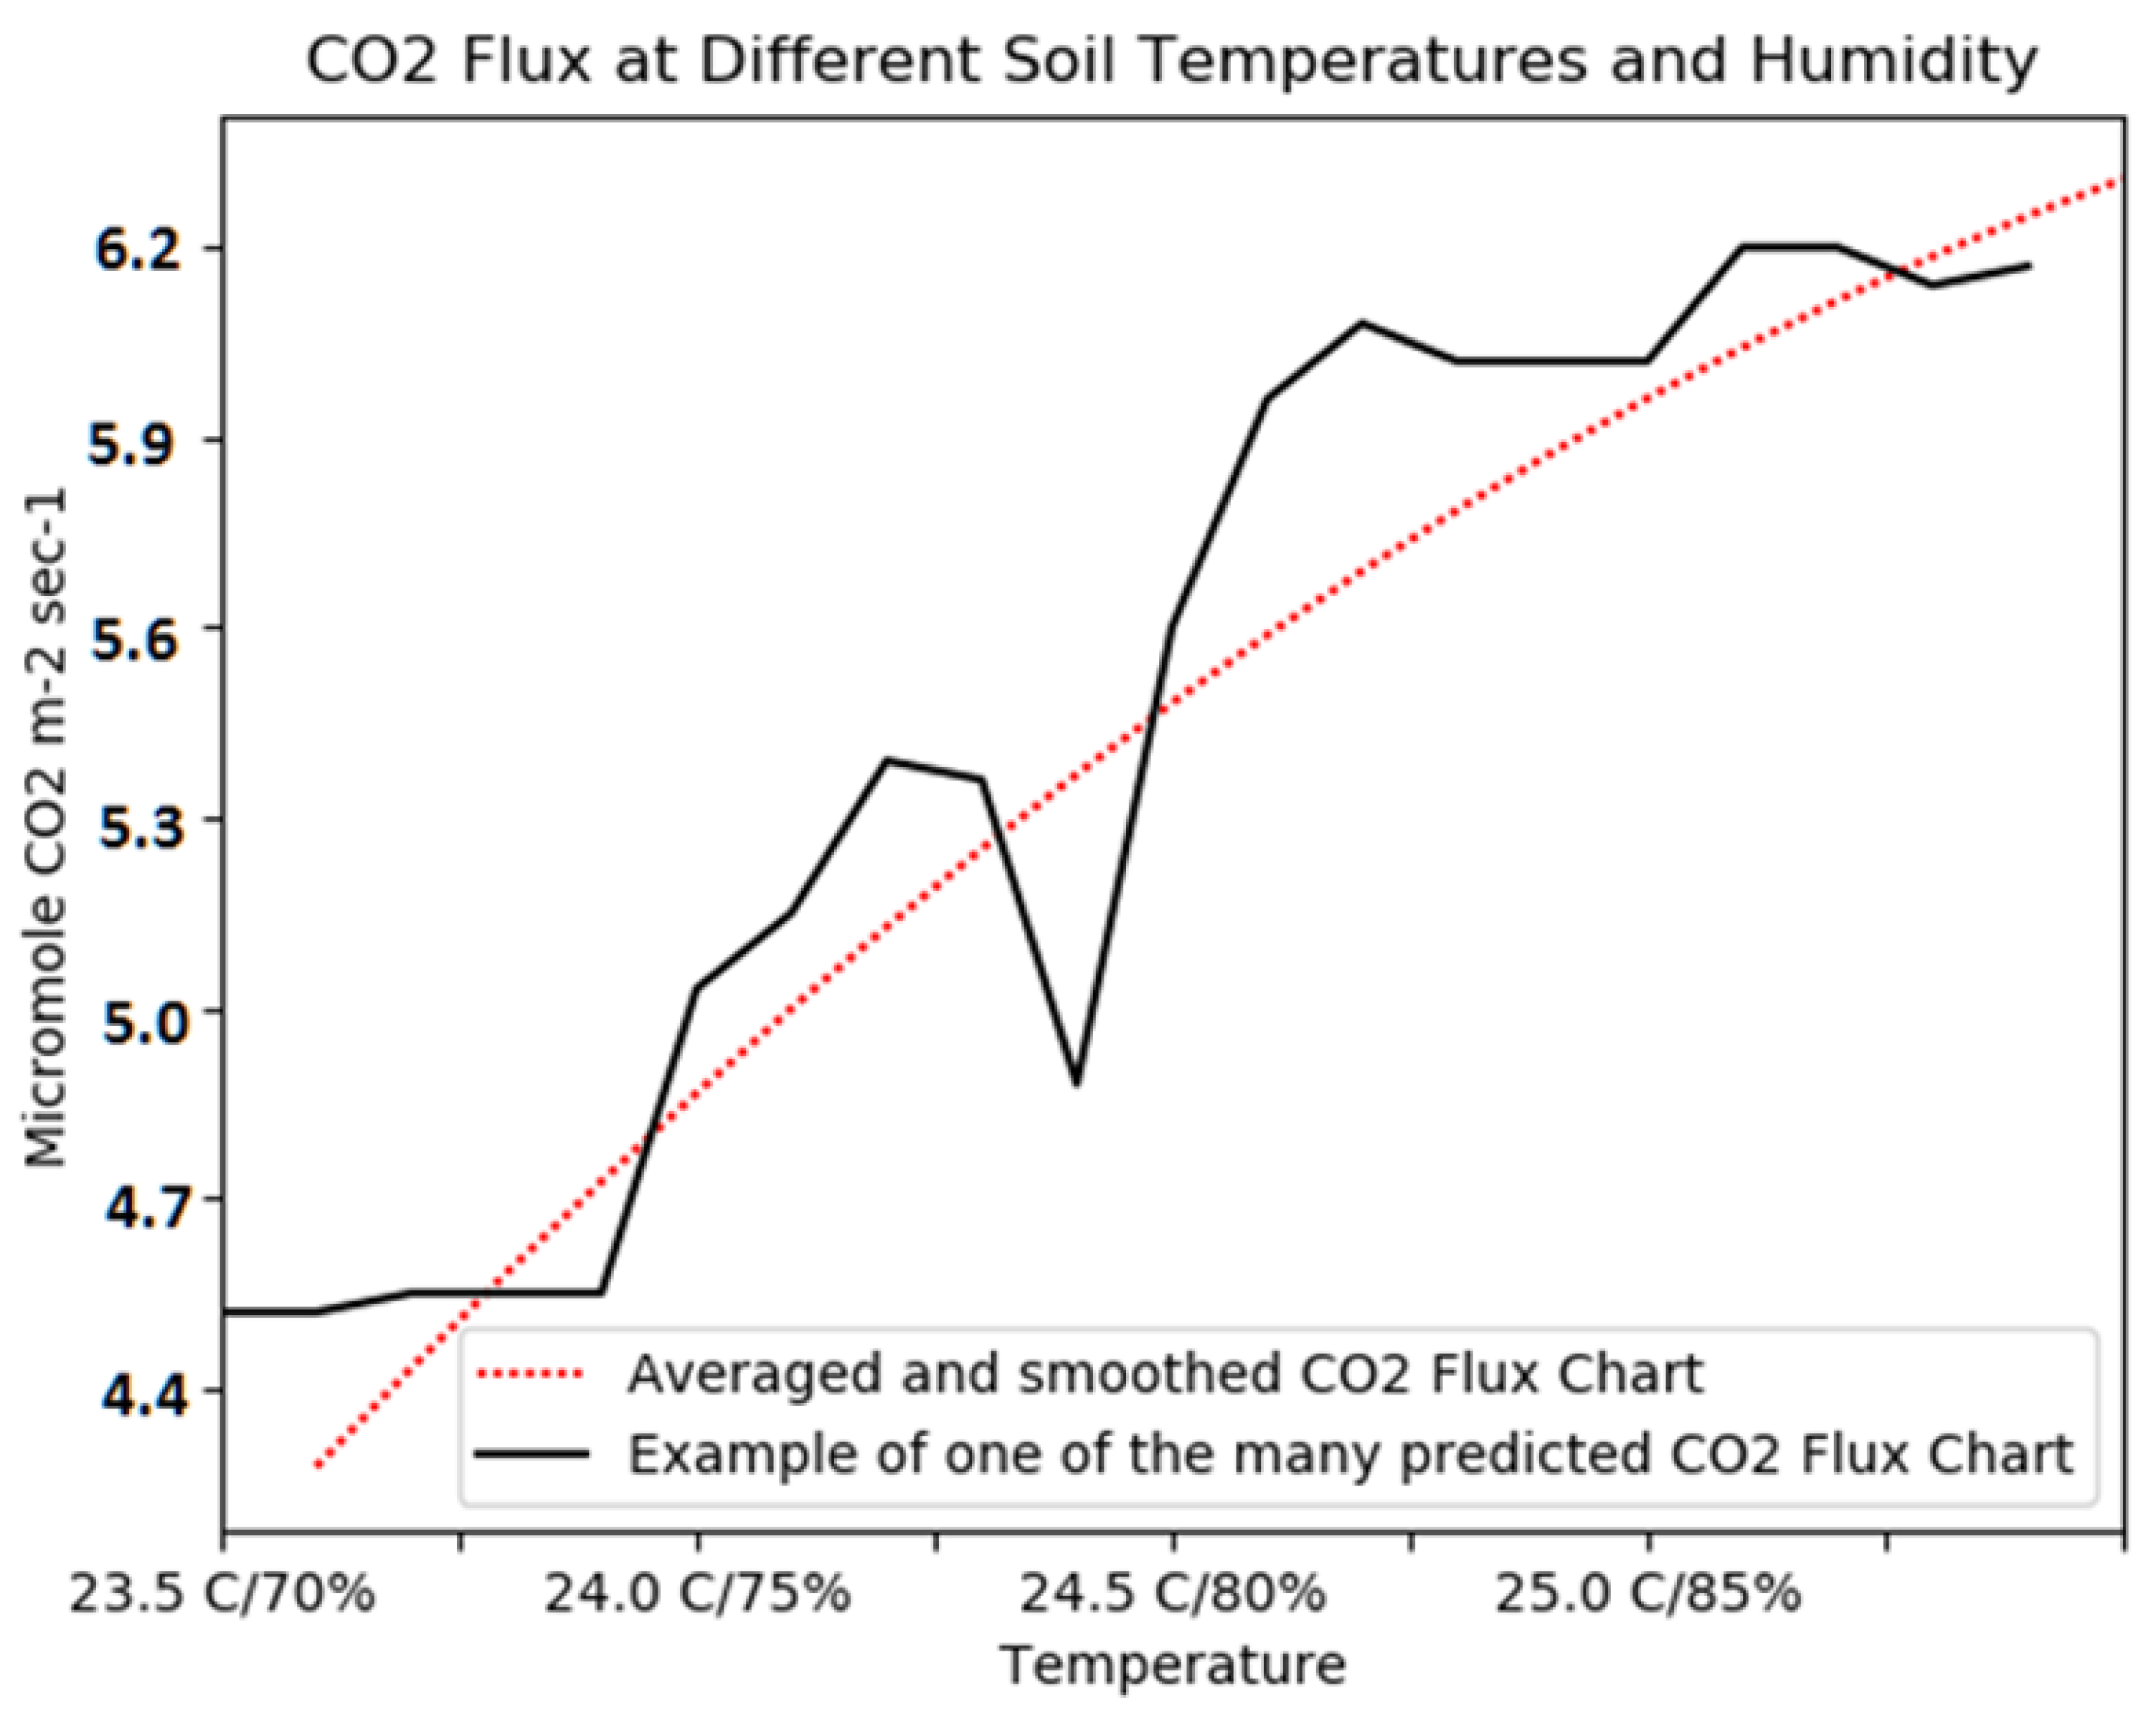
The function “Averaged and Smoothed CO2 Flux” S o i l _ C O 2 _ F l u x S A ( T , r H ) has the following form:
S o i l _ C O 2 _ F l u x S A ( T , r H ) = i = 1 N F g g [ T , r H | S o i l _ T y p e ( X i ) ] N .
Here, the second chart is given for an example of a typical CO2 flux forecast implementation when we use both regressors: T and rH. Here, function F g g ( 5 ) [ T , r H | S o i l _ T y p e ( X i ) ] , as before, corresponds to a randomly chosen index 1 i N . Here, the CO2 emission rate increases monotonically with a simultaneous increase in both the soil temperature and relative soil moisture. This fact is fully consistent with both the theory of the greenhouse gas emission process and the practice of field observing this process. Thus, the approximation F g g ( ) is quite good.

5. Discussion on Numerical Simulations Results

The constructed regression approximation (Figure 6, Figure 7 and Figure 8), which relates the intensity of soil CO2 emission with the dynamics of the parameters soil temperature and relative humidity, are in good agreement with the physicochemical models of soil CO2 generation. In particular, at relative humidity of 82%, the intensity of ground CO2 emission was 5.1 micromol CO2 per m2 per 1 s, and at relative humidity of 75%, respectively, the intensity of ground CO2 emission was somewhat reduced to 4.8 micromol CO2 per m2 per 1 s. With a simultaneous increase in both soil temperature (up to 26 °C) and relative humidity (up to 90%), the intensity of soil CO2 emission increased to the value of 6.2 micromoles of CO2 per m2 per 1 s. As a result of numerical experiments on data set “Soil CO2 Flux, Moisture, Temperature, and Litterfall” [14], the possibility of the effective application of modern methods of data analysis and machine learning for approximation of the regression dependence of the parameter “intensity of soil CO2 emission” on regressor values of “soil temperature”, and also on moisture parameters and soil type, was confirmed. The results of the approximation were in good agreement with the physicochemical models of the process of soil CO2 generation. Thus, the investigated approach to approximating the intensity of soil CO2 can be effectively used in the problems of predicting the generation of soil CO2 from the data obtained from a network of spatially distributed multimodal sensors, considering that an atlas of soil types in the region of prediction construction is available. Thus, the numerical study which was carried out has high confidence. Based on this confidence, the approximation of F g g ( ) is sufficiently effective practically, and we can consider that a measurement set of (a) soil temperature, (b) soil moisture, and (c) known soil type at the measurement site is quite sufficient to solve the problem of greenhouse gas prediction.

6. Multimodal Measuring Stations (Multimodal Sensor Network) Requirements

Thus, as a result of modeling, it was possible to formulate the following requirements for the composition of the measuring station, as a unit of a multimodal sensor network:
  • Each station must contain sensors for measuring CO2/CH4 flux, soil temperature, and soil moisture.
  • The top-level data processing system, where information from the sensor network is collected, must contain information about the exact coordinate of the measurement points and about soil types at the measuring stations locations.
At the same time, the data-driven approach to reconstruct the F g g ( ) function allows, in the mode of constant consideration of new incoming data, the gradual reduction of the dependence of the model on the soil atlas data (they may be inaccurate). After a certain interval of time, taking into account the array of measurements made, the model will be fully linked to a specific measurement point, and the measured data will have a significantly greater influence than the information from the soil atlas.
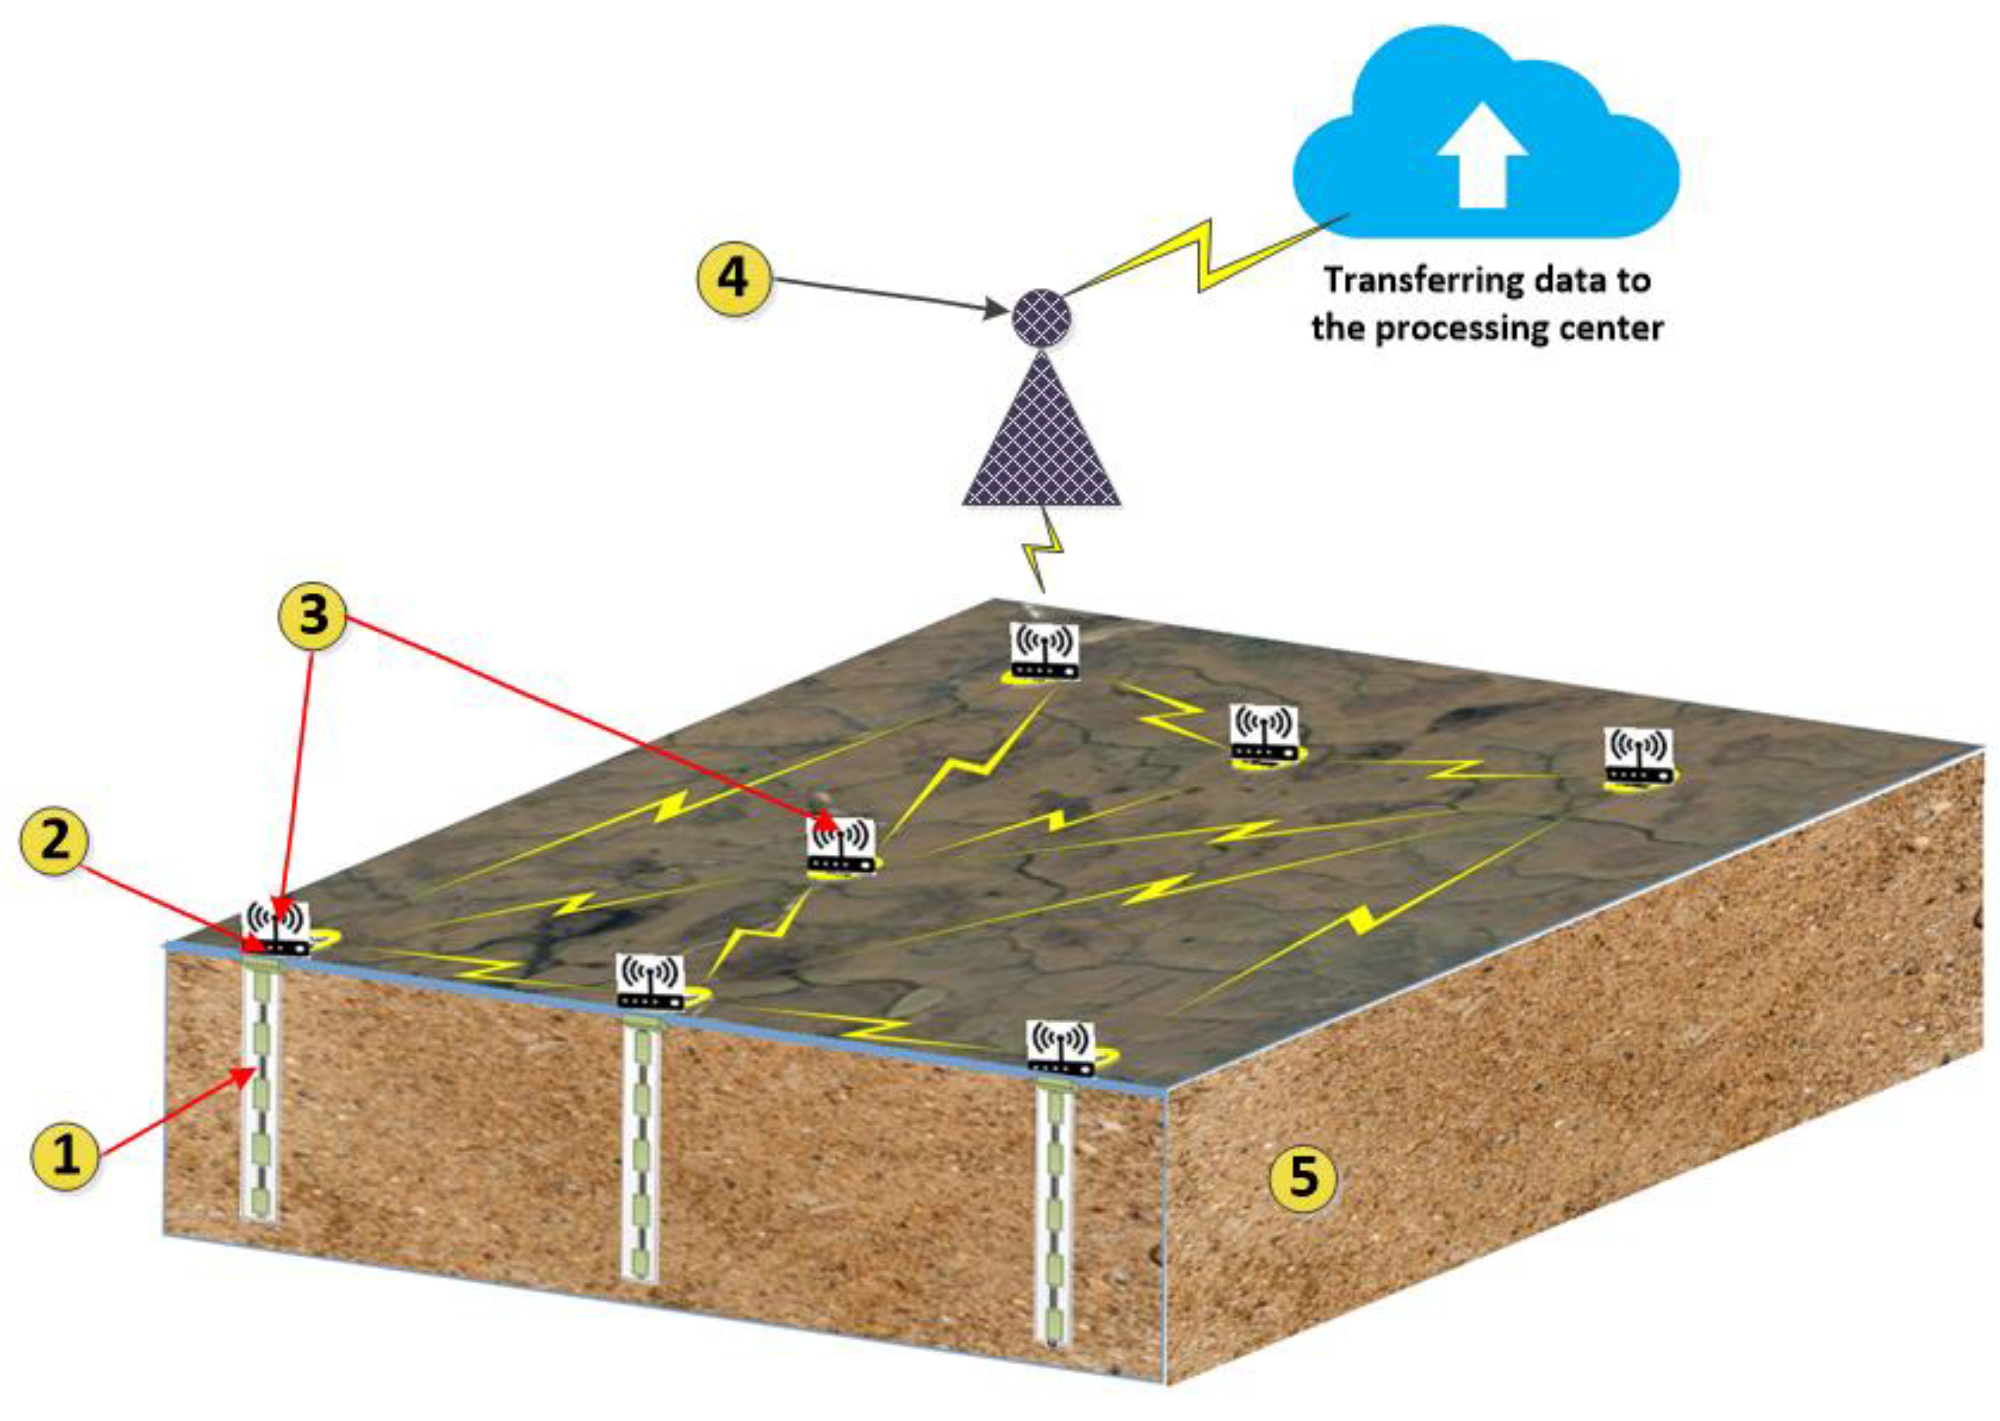
The effective solution of the operational analysis task and medium-term forecasting of greenhouse gas generation intensity, set in Section 1, Section 2 and Section 3, is ensured by the application of adequate instrumental support. In our case, this requires the creation of a network of multimodal stations, which transmit a continuous flow of data to remote processing centers and which can operate in long-term autonomous mode (Figure 10).

7. Conclusions

The proposed approach in this work to the control and forecasting of the processes of greenhouse gas emission implies the combined use of special instrumental means, operating in autonomous mode, as well as original methods for quantitative forecasting of greenhouse greenhouse gas emissions from a specific geographic area of the controlled territory during the forecast period. This system is a network of geographically distributed multimodal sensor stations designed to measure the intensity of greenhouse gas emissions (carbon dioxide and methane) from the surface of the controlled territory. This network is considered a low-maintenance and autonomous system in terms of energy supply, which means that each multimodal station is powered by a battery, the capacity of which provides for up to several years (more than five) of autonomous operation. The data set was obtained as a result of the functioning of this network, which, in turn, was used to train (calibrate) the predictive component of the system.
The numerical modeling proved that the mathematical methods underlying the prognostic component of the proposed system are practically effective for prognostic problems solution in question.
The proposed model was set up on a data set that was collected in the tropics. In this data, the soil temperatures varied in the range 22–26 °C. At high latitudes, soil CO2 emission occurred during the warm season: June–September. During this period, at a depth of 15–20 cm, the temperature varied in the range 5–12 °C [16]. At shallower depths (0–5 cm), the temperature can be much higher, but only for a short time. In general, the model presented in the paper, after appropriate refinements (adaptation), should also work in high-latitude conditions, since the decomposition of organic matter in arctic permafrost soils proceeds by the same mechanism as in low latitude conditions. In any case, the model’s small adaptation with the usage of a regional dataset may be necessary, which is a technical point.
The forecast of the greenhouse gas amount emitted from the controlled area soil is generated on the basis of soil parameters (temperature, moisture) dynamics forecast. The more accurate the dynamics prediction of these parameters, the more accurate the emitted soil greenhouse gas amount forecast. It is objectively difficult to obtain a long-term, qualitative forecast regarding the dynamics of soil parameters, but it is quite possible during the few-week forecast interval.
In addition to the control of soil greenhouse gas emissions, the proposed approach of forming a forecast in the form of an I g g ( ) functional, subject to changes in the parameters of the regression model and the measurement model, can be used in other conditions. In particular, the suggested approach may be used for the problems of controlling and forecasting carbon dioxide emissions in the areas of heavy industrial activity, for example, in the areas of large sea ports [17]. Since in this case the mechanism of carbon dioxide generation is different, the regression arguments will not be soil parameters, but a different set of parameters related to the specific features of a particular controlled area. For example: intensity of works and other industrial activity, time of year, time of day, type of works, and industrial activity, etc. Similarly, the proposed approach can be used as part of a subsystem for monitoring CO2 emissions in other industrial applications [18,19,20,21].
The proposed hardware-software approach can be used to create simultaneously low-maintenance and energy-autonomous systems or controlling and forecasting of greenhouse gases in the cryolithozone. In order to improve the accuracy of quantitative prediction, we are planning a series of in-situ full-scale experiments of the multimodal sensor network. The purpose of these tests is to improve the approximate dependence (2) on the approximation quality itself, considering that the accuracy of greenhouse gas emissions intensity forecasting in the region significantly depends on it.

Author Contributions

Conceptualization, A.V.T., V.Y.B. and V.Y.P.; methodology, A.V.T.; software, A.V.T.; validation, A.V.T., A.B.T. and V.Y.P.; formal analysis, A.V.T.; investigation, A.V.T. and V.Y.P.; writing—original draft preparation, A.V.T.; writing—review and editing, A.V.T. and V.Y.B.; visualization, A.V.T. All authors have read and agreed to the published version of the manuscript.

Funding

This research received no external funding.

Institutional Review Board Statement

Not applicable.

Informed Consent Statement

Not applicable.

Data Availability Statement

“Soil CO2 Flux, Moisture, Temperature, and Litterfall”, La Selva, Costa Rica, 2003–2010. ORNL DAAC, Oak Ridge, TN, USA. http://dx.doi.org/10.3334/ORNLDAAC/1373, accessed on 28 October 2021.

Conflicts of Interest

The authors declare no conflict of interest.

References

  1. Koven, C.D.; Ringeval, B.; Friedlingstein, P.; Ciais, P.; Cadule, P.; Khvorostyanov, D.; Krinner, G.; Tarnocai, C. Permafrost carbon-climate feedbacks accelerate global warming. Proc. Natl. Acad. Sci. USA 2011, 108, 14769–14774. [Google Scholar] [CrossRef] [PubMed] [Green Version]
  2. Vonk, J.; Sánchez, L.; García, B.; van Dongen, V.; Alling, V.; Kosm, A. Activation of old carbon by erosion of coas tal and subsea permafrost in Arctic Siberia. Nature 2018, 489, 137–140. [Google Scholar] [CrossRef] [PubMed]
  3. Turetsky, M.R.; Abbott, B.; Jones, M.C.; Anthony, K.W.; Olefeldt, D.; Schuur, E.A.G.; Koven, C.; McGuire, A.D.; Grosse, G.; Kuhry, P.; et al. Permafrost collapse is accelerating carbon release. Nature 2019, 569, 32–34. [Google Scholar] [CrossRef] [PubMed] [Green Version]
  4. Abbott, B.W.; Larouche, J.R.; Jones, J.B., Jr.; Bowden, W.B.; Balser, A.W. Elevated dissolved organic carbon biodegradability from thawing and collapsing permafrost. J. Geophys. Res. Biogeosci. 2014, 119, 2049–2063. [Google Scholar] [CrossRef]
  5. Schuur, E.A.G.; McGuire, A.D.; Schadel, C.; Grosse, G.; Harden, J.W.; Hayes, D.; Hugelius, G.; Koven, C.; Kuhry, P.; Lawrence, D.; et al. Climate change and the permafrost carbon feedback. Nature 2015, 520, 171–179. [Google Scholar] [CrossRef] [PubMed]
  6. Kraev, G.; Rivkina, E. Accumulation of Methane in Permafrost-Affected Soils of Cryolithozone. Arct. Environ. Res. 2017, 173–184. [Google Scholar] [CrossRef]
  7. Pries, C.E.H.; Logtestijn, R.S.P.; Schuur, E.A.G.; Natali, S.M.; Cornelissen, J.H.C.; Aerts, R.; Dorrepaal, E. Decadal warming causes a consistent and persistent shift from heterotrophic to autotrophic respiration in contrasting permafrost ecosystems. Glob. Chang. Biol. 2015, 21, 4508–4519. [Google Scholar] [CrossRef] [PubMed]
  8. Kwon, M.J.; Jung, J.Y.; Tripathi, B.M.; Göckede, M.; Lee, Y.K.; Kim, M. Dynamics of microbial communities and CO2 and CH4 fluxes in the tundra ecosystems of the changing Arctic. J. Microbiol. 2019, 57, 325–336. [Google Scholar] [CrossRef] [PubMed]
  9. Knoblauch, C.; Beer, C.; Liebner, S.; Grigoriev, M.N.; Pfeiffer, E.-M. Methane production as key to the greenhouse gas budget of thawing permafrost. Nat. Clim. Chang. 2018, 8, 309–312. [Google Scholar] [CrossRef] [Green Version]
  10. Kim, Y.; Ueyama, M.; Harazono, Y.; Tanaka, N.; Nakagawa, F.; Tsunogai, U. Assessment of Winter Fluxes of CO2 and CH4 in Boreal Forest Soils of Central Alaska Estimated by the Profile Method and the Chamber Method: A Diagnosis of Methane Emission and Implications for the Regional Carbon Budget. Tellus. Ser. B Chem. Phys. Meteorol. 2007, 59, 223–233. [Google Scholar] [CrossRef]
  11. Koven, C.D.; Schuur, E.A.G.; Schädel, C.; Bohn, T.J.; Burke, E.; Chen, G.; Chen, X.; Ciais, P.; Grosse, G.; Harden, J.W.; et al. A simplified, data-constrained approach to estimate the permafrost carbon–climate feedback. Philos. Trans. R. Soc. A Math. Phys. Eng. Sci. 2015, 373, 20140423. [Google Scholar] [CrossRef] [PubMed]
  12. Hugelius, G. Estimated stocks of circumpolar permafrost carbon with quantified uncertainty ranges and identified data gaps. Biogeosciences 2014, 11, 6573–6593. [Google Scholar] [CrossRef] [Green Version]
  13. Todd-Brown, K.E.O.; Randerson, J.T.; Post, W.M.; Hoffman, F.M.; Tarnocai, C.; Schuur, E.A.G.; Allison, S.D. Causes of variation in soil carbon simulations from CMIP5 Earth system models and comparison with observations. Biogeosciences 2013, 10, 1717–1736. [Google Scholar] [CrossRef]
  14. Raich, J.; Valverde-Barrantes, O. Soil CO2 Flux, Moisture, Temperature, and Litterfall. La Selva, Costa Rica, 2003–2010; ORNL DAAC: Oak Ridge, TN, USA, 2017. [Google Scholar]
  15. Friedman, J. Greedy Function Approximation: A Gradient Boosting Machine. Ann. Stat. 2001, 29, 1189–1232. [Google Scholar] [CrossRef]
  16. Stochkute, Y.; Far Eastern Federal University; Vasilevskaya, L. Evaluation of long-term air and soil temperature changes on the far north-east of russia. Geogr. Bull. 2016, 2, 37. [Google Scholar] [CrossRef]
  17. Jürgen, W. Handbook of Terminal Planning, 2nd ed.; Springer: Suderburg, Germany, 2011. [Google Scholar]
  18. Litvinenko, V.; Tsvetkov, P.; Dvoynikov, M.; Buslaev, G. Barriers to implementation of hydrogen initiatives in the context of global energy sustainable development. J. Min. Inst. 2020, 244, 428–438. [Google Scholar] [CrossRef]
  19. Morenov, V.; Leusheva, E.; Buslaev, G.; Gudmestad, O.T. System of Comprehensive Energy-Efficient Utilization of Associated Petroleum Gas with Reduced Carbon Footprint in the Field Conditions. Energies 2020, 13, 4921. [Google Scholar] [CrossRef]
  20. Buslaev, G.; Morenov, V.; Konyaev, Y.; Kraslawski, A. Reduction of carbon footprint of the production and field transport of high-viscosity oils in the Arctic region. Chem. Eng. Process. Process. Intensif. 2021, 159, 108189. [Google Scholar] [CrossRef]
  21. Zagashvili, Y.; Kuzmin, A.; Buslaev, G.; Morenov, V. Small-Scaled Production of Blue Hydrogen with Reduced Carbon Footprint. Energies 2021, 14, 5194. [Google Scholar] [CrossRef]
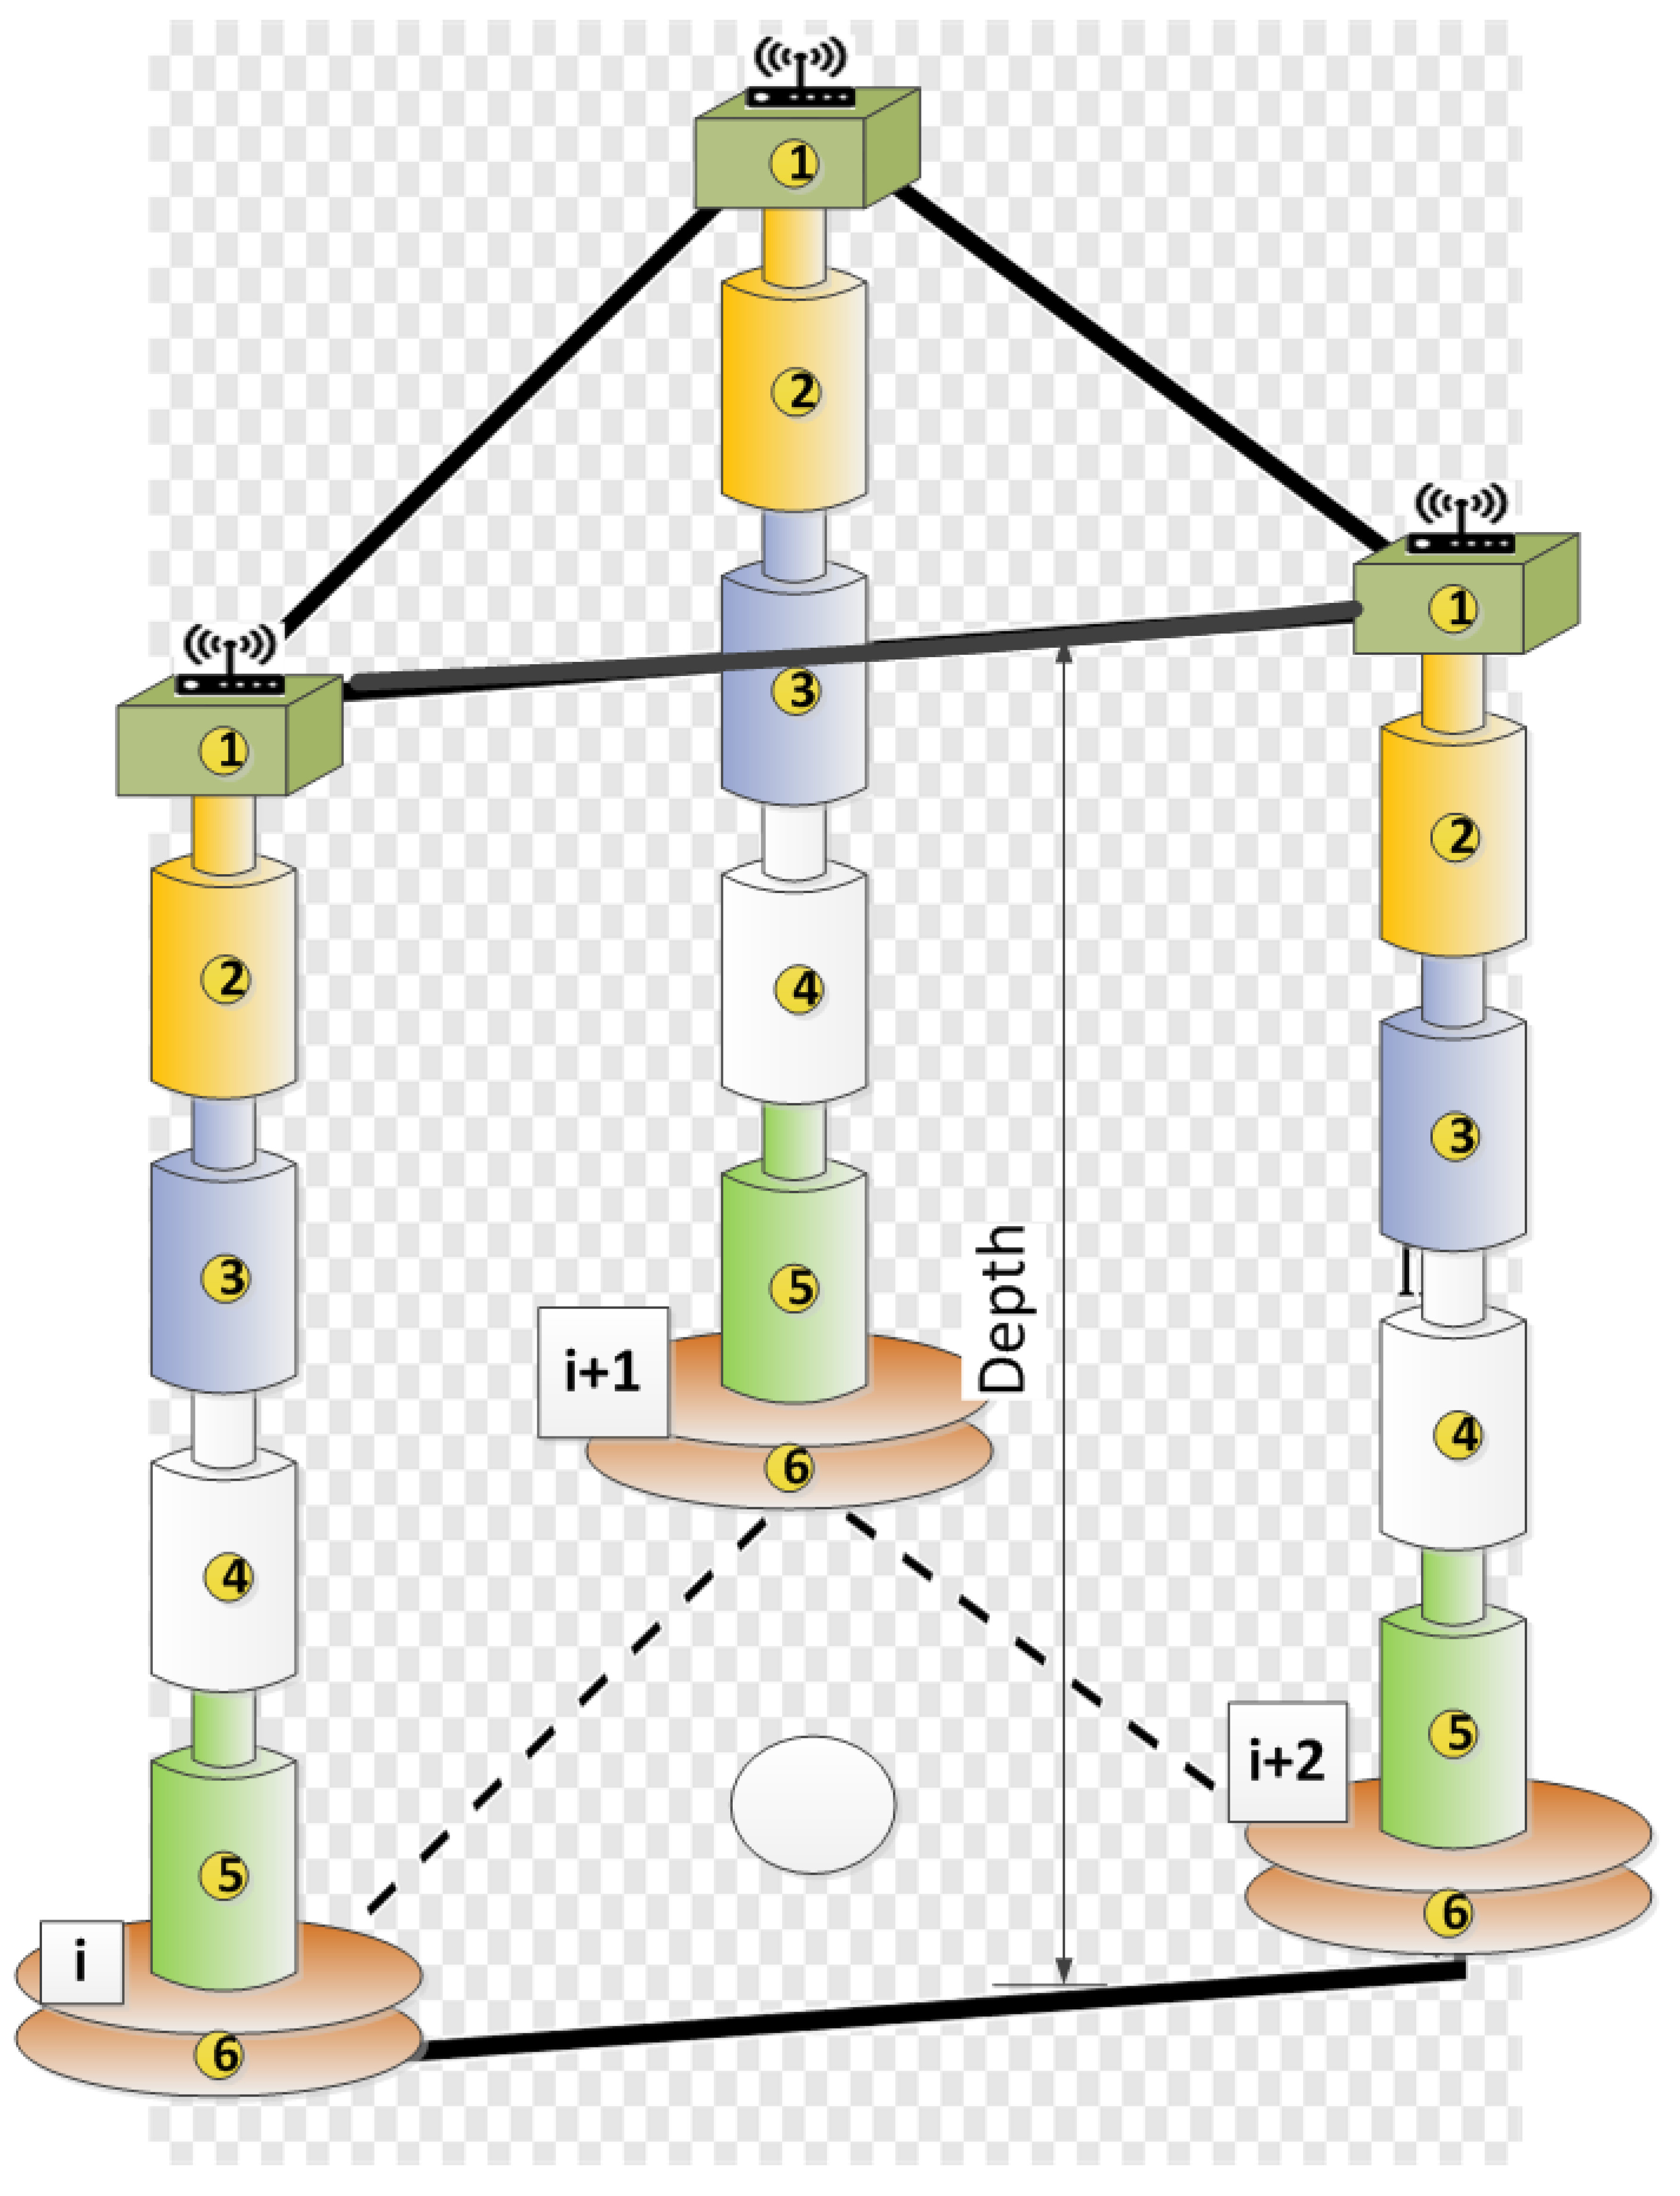
Figure 1. “Prism” of multimodal sensor stations.
Atmosphere 12 01466 g001
Figure 2. Regression approximation results in experiment 1.
Atmosphere 12 01466 g002
Figure 3. Regression approximation results in experiment 2.
Atmosphere 12 01466 g003
Figure 4. Regression approximation results in experiment 3.
Atmosphere 12 01466 g004
Figure 5. Regression approximation results in experiment 4.
Atmosphere 12 01466 g005
Figure 6. Regression approximation results in experiment 5.
Atmosphere 12 01466 g006
Figure 7. Results of experiment 6. Dependence of CO2 flux rate on soil temperature.
Atmosphere 12 01466 g007
Figure 8. Results of experiment 7. Dependence of CO2 flux rate on relative humidity.
Atmosphere 12 01466 g008
Figure 9. Results of experiment 8. Dependence of CO2 flux rate on values of parametric pairs (T—soil temperature, rH—soil relative humidity).
Atmosphere 12 01466 g009
Figure 10. Topology of the network of autonomous multimodal measuring stations, distance between stations (1–15) km. 1—sensors for measurements inside the soil; 2—sensors on the ground surface to measure greenhouse gas emissions; 3—modems of measuring stations; 4—gateway for data transmission to external networks; 5—soil layer under study.
Atmosphere 12 01466 g010
Table 1. The results of experiment 1.
CriterionValue
r2_score, 10.722
explained_variance_score, 10.722
max_error, μmol m−2 s−11.052
mean_absolute_error, μmol m−2 s−10.279
MSE, (μmol m−2 s−1)20.140
Table 2. The results of experiment 2.
CriterionValue
r2_score, 10.722
explained_variance_score, 10.722
max_error, μmol m−2 s−12.203
mean_absolute_error, μmol m−2 s−10.491
MSE, (μmol m−2 s−1)20.486
Table 3. The results of experiment 3.
CriterionValue
r2_score, 10.897
explained_variance_score, 10.899
max_error, μmol m−2 s−11.019
mean_absolute_error, μmol m−2 s−10.292
MSE, (μmol m−2 s−1)20.125
Table 4. The results of experiment 4.
CriterionValue
r2_score, 10.878
explained_variance_score, 10.878
max_error, μmol m−2 s−10.845
mean_absolute_error, μmol m−2 s−10.179
MSE, (μmol m−2 s−1)20.0623
Table 5. The results of experiment 5.
CriterionValue
r2_score, 10.793
explained_variance_score, 10.795
max_error, μmol m−2 s−11.447
mean_absolute_error, μmol m−2 s−10.225
MSE, (μmol m−2 s−1)20.102
Publisher’s Note: MDPI stays neutral with regard to jurisdictional claims in published maps and institutional affiliations.