Article

The Impact of Intense Winter Saharan Dust Events on PM and Optical Properties at Urban Sites in the Southeast of the Iberian Peninsula

Atmospheric Pollution Laboratory (LCA), Department of Applied Physics, Miguel Hernández University, Avenida de la Universidad S/N, 03202 Elche, Spain
*
Author to whom correspondence should be addressed.
Atmosphere 2021, 12(11), 1469; https://doi.org/10.3390/atmos12111469
Submission received: 10 September 2021 / Revised: 25 October 2021 / Accepted: 4 November 2021 / Published: 6 November 2021

Abstract

:
The influence of three Saharan dust events (SDE) on particulate matter (PM) concentrations and aerosol optical properties (AOP) during February 2021 was studied. The physical characteristics of the African aerosol were different for each episode. Therefore, the impacts of the three events on PM and AOP were analyzed separately. The monitoring sites were placed in Elche, in the southeast of the Iberian Peninsula. The sites can be classified as urban background locations. The procedure used to obtain the contribution of SDE to PM10 mass concentrations was the 40th percentile method. Nearly half of the days during the study period were under the influence of Saharan air masses. The average contribution of mineral dust (MD) to the PM10 mean concentration was ~50%, which was the highest contribution during the month of February in the last 14 years. The results show that those events characterized by a high input of fine particles (PM1 and PM2.5) caused larger increases in the absorption (σap) and scattering (σsp) coefficients than SDE in which coarse particles predominated. Nevertheless, as expected, SAE (Scattering Angström Exponent) values were lowest during these episodes. AAE (Absorption Angström Exponent) values during SDE were slightly higher than those observed in the absence of African dust, suggesting some contribution from MD to the absorption process.

1. Introduction

The Mediterranean Basin is exposed to continuous incoming air masses loaded with dust from North Africa. The influence of Saharan dust transport on particulate matter (PM) levels has an expected latitudinal dependence [1,2]. Therefore, the impact of these episodes on PM levels in southern regions within the European continent is significantly higher than that observed in more northerly areas.
The south-eastern Iberian Peninsula (SEIP), located in the Western Mediterranean Basin (WMB), is geographically close to North Africa, hence the occurrence of Saharan dust events (SDE) in this region is quite common. Several studies have determined that the annual frequency of these events in the SEIP ranges between 22 and 26% [1,3]. At regional background (RB) stations, an 18–25% contribution of mineral dust (MD) to annual mean PM10 values (i.e., particles with aerodynamic diameters < 10 μm) has been estimated [1,3,4]. Although during the winter period the frequency of these events is lower (~14%), the MD contribution to PM10 is similar to the annual average [3]. It has been established that the mean annual number of exceedances of the daily PM10 limit value (2008/50/CE Directive) in this area is ~4 [5].
In urban areas located in the SEIP, the impact of SDE is greater on coarse particles than on fine particles, not only increasing their concentration, but also modifying their chemical composition [6,7]. The PM10 fraction can be considered as the best air quality indicator for evaluating the short-term health effects of Saharan dust [8]. This is supported by the results of previous works. For instance, Pérez et al. [9] observed an increase in daily mortality in the city of Barcelona during SDE due to the increase of coarse PM concentrations. On the other hand, in a study carried out in Madrid [10], the authors concluded that an increase of 10 μg·m−3 in the coarse fraction (PM10–2.5) during Saharan dust days was associated with a 2.8% increase in total mortality, compared with 0.6% during non-dust days.
In addition to its adverse effects on human health, MD can provide a surface site for heterogeneous reactions of atmospheric gases, and can also absorb and scatter solar radiation. Therefore, MD may lead to a change in the radiative balance. It is generally established that MD has a slight net cooling effect, although with a high level of uncertainty. Its direct radiative forcing varies between −0.3 and +0.1 W·m–2 at a global scale [11]. Aerosol optical properties (AOP) can undergo significant variations under the influence of SDE. Several studies carried out in the Iberian Peninsula have analyzed the impact of SDE on AOP [12,13,14,15,16,17]. The main variations in AOP during SDE include: increases in the scattering (σsp) and absorption (σap) coefficients; a rise in the Absorption Angström Exponent (AAE) due to the absorption of UV and visible radiation by MD; a drop in the Scattering Angström Exponent (SAE) because of the predominance of coarse particles during these events; and a rise in the Single Scattering Albedo (SSA) value since the relative increase in σsp is greater than that in σap. On the other hand, AOP variations depend on the physicochemical properties of MD. MD is mainly made up of quartz and silicate minerals. Other main components (whose contribution depend on the source region) include organic matter, Fe2O3, Al2O3, and CaCO3. MD is typically irregular in shape and is characterized by a large size spectrum, from hundreds of nanometers to tens of micrometers [18]. MD can undergo different aging processes. Therefore, its chemical and physical properties may vary during transport, leading to changes in its optical properties [18]. In addition, the radiative effect of MD may be affected by other factors such as the travel distance, the pathway from source regions, and the atmospheric lifetimes of the particles [19].
Size distribution is an essential characteristic for estimating the aerosol radiative effect, but its representation remains challenging due to the large size spectrum of MD [20]. In order to gain insights into the influence of aerosol size distributions on AOP, this work is focused on the analysis of the variations in AOP during three different SDE. Additionally, the contribution of SDE to PM10 levels in an urban area located in the SEIP during wintertime was quantified.

2. Materials and Methods

2.1. Sampling Sites

Two urban background (UB) sites located in Elche (38°16′ N; 0°41′ W; 86 m.a.s.l) were selected for this work. The city is located in the south-eastern Spanish Mediterranean basin, about 12 km from the coast, and is highly sensitive to SDE due to its proximity to the African continent. Recent work addressing the impact of Saharan mineral dust on PM levels and composition in this area can be found in [6,7,21,22].
Data from the “Agroalimentari (AGRO) (38°14′ N; 0°41′ W; 54 m.a.s.l)” station (see Figure 1), located on the outskirts of the city, were used in the first part of this study (Section 3.1.1). In this section, the MD load at an RB station was calculated in order to quantify the impact of SDE on PM10 levels over the last 14 years. The selected station was located in the town of Pinoso (PIN) (38°25′ N; 1°02′ W; 637 m.a.s.l.), about 44 km from Elche. Both stations belong to the Environmental Surveillance Network of the regional Government of Valencia. A monitoring station equipped with suitable optical instruments and located at the Miguel Hernández University of Elche (UMH) (38°16′ N; 0°41′ W; 93 m.a.s.l) was chosen to study the variation in AOP under SDE during February 2021 (Section 3.1.2 and Section 3.2). At this station, PM10, PM2.5, and PM1 concentrations were continuously measured using a GRIMM 190 optical counter. The spectrometer provided PM levels with a 10 min time resolution. One hour and twenty-four hour averages were subsequently calculated. Daily values were corrected by comparison with PM concentrations obtained by the gravimetric technique.
Table 1 summarizes the measurements performed at each site.

2.2. SDE Detection

The identification of SDE was based on the results of the predictive model BSC-DREAM8b (https://ess.bsc.es/bsc-dust-daily-forecast, accessed on 3 November 2021). The analysis of PM10 time series helped to confirm the occurrence of SDE over the study area. Meteorological scenarios were investigated based on synoptic charts at 850 hPa geopotential height from NCEP reanalysis with a spatial resolution of 2.5° × 2.5°.
The procedure used to estimate the MD load in PM10 during SDE was the “P40 method” http://ec.europe.eu/environment/air/quality/legislationpdf/sec_2011_0208.pdf (accessed on 3 November 2021). The basis of this method can be found in [23,24]. A good summary of this methodology can also be found in [25]. Briefly, the method consists of calculating the monthly moving 40th percentile of the PM10 time series at an RB site after excluding days with desert dust outbreaks. This is then denoted as the RB level. The daily net contribution of MD to PM10 levels in a given region can subsequently be obtained by subtracting the daily RB level from the daily PM10 concentration measured at the RB site [23]. The P40 method is commonly used to determine the MD contribution to PM10 and PM2.5 where chemical speciation is not required. In addition, it should be noted that, although the calculation was done for the RB stations, this methodology allows estimating the daily contribution of African dust for the whole region [25].

2.3. Aerosol Optical Properties

Scattering (σsp) and backscattering (σbsp) coefficients at 450, 525, and 635 nm were obtained by means of an LED-based integrating nephelometer (model Aurora 3000, ECOTECH Pty Ltd., Knoxfield, Australia). A full calibration of the nephelometer was performed four times per year by using CO2 as span gas, while zero check measurements were performed daily by using internally filtered particle free air. Scattering coefficients were corrected for truncation and for non-Lambertian errors according to the method reported by Müller et al. [26]. In this work, correction factors for total scattering at each wavelength were obtained from Angström exponents using the parameters provided by Müller et al. [26]. The measurements were conducted under dry conditions using a processor-controlled automatic heater. The time resolution was 5 min. Hourly averages were subsequently calculated. σsp and σbsp were measured during February 2021.
The backscatter fraction (b) was obtained from the following equation:
b = σbspsp
The scattering Angström exponent (SAE) was derived from σsp values as follows:
SAE = - ln σ sp ( λ 1 ) σ sp ( λ 2 ) ln λ 1 λ 2
where λ1 = 450 nm and λ2 = 635 nm.
The scattering Angström exponent describes the wavelength-dependence of scattered light. In situations where the scattering is dominated by fine particles (d < 1 μm), SAE values are usually equal to or greater than 1.5 [27], while values close to 0 occur when the scattering is dominated by coarse particles [28]. Negative values also occur when MD is the dominant aerosol component [29].
Aerosol absorption coefficients (σap) at seven wavelengths (370, 470, 520, 590, 660, 880, and 950 nm) and BC (Black carbon) concentrations were obtained by means of a dual-spot aethalometer (AE33, Magee Scientific, Berkeley, CA, USA). The AE33 minimizes the loading effect [30]. The M8060 filter with a multiple scattering parameter C = 1.39 has been used according to the manufacturer’s instructions. The time resolution was 5 min. Hourly averages were subsequently calculated. σap was measured during February 2021.
The absorption Angström exponent (AAE) was obtained from σap values using the following equation:
AAE = - ln σ ap ( λ 1 ) σ ap ( λ 2 ) ln λ 1 λ 2
where λ1 = 370 nm and λ2 = 950 nm.
The AAE value can provide an indication of the aerosol composition. When BC is the dominant absorbing aerosol component, the AAE value is close to 1 [31], while MD aerosols typically have AAE values significantly higher than 1 [29,32].
Finally, SSA values were calculated from σap and σsp coefficients:
SSA = σ sp σ sp + σ ap
The SSA provides information about the cooling or warming effect of atmospheric aerosols.

3. Results and Discussion

3.1. Impact of Dust Aerosols on PM Concentrations

3.1.1. Influence of SDE on PM10 Levels in Wintertime

The presence of Saharan dust over the SEIP is quite constant throughout the year, although the frequency of SDE increases substantially between spring (April, May, June) and autumn (October, November, December) [1]. During the colder months (January, February, March) the frequency and duration of dust events tend to be lower. The average number of days under the influence of Saharan dust events in the SEIP during wintertime is about 13 [3]. However, as previously mentioned, this does not imply that the percentage contribution of Saharan dust to PM10 levels is lower than in other seasons.
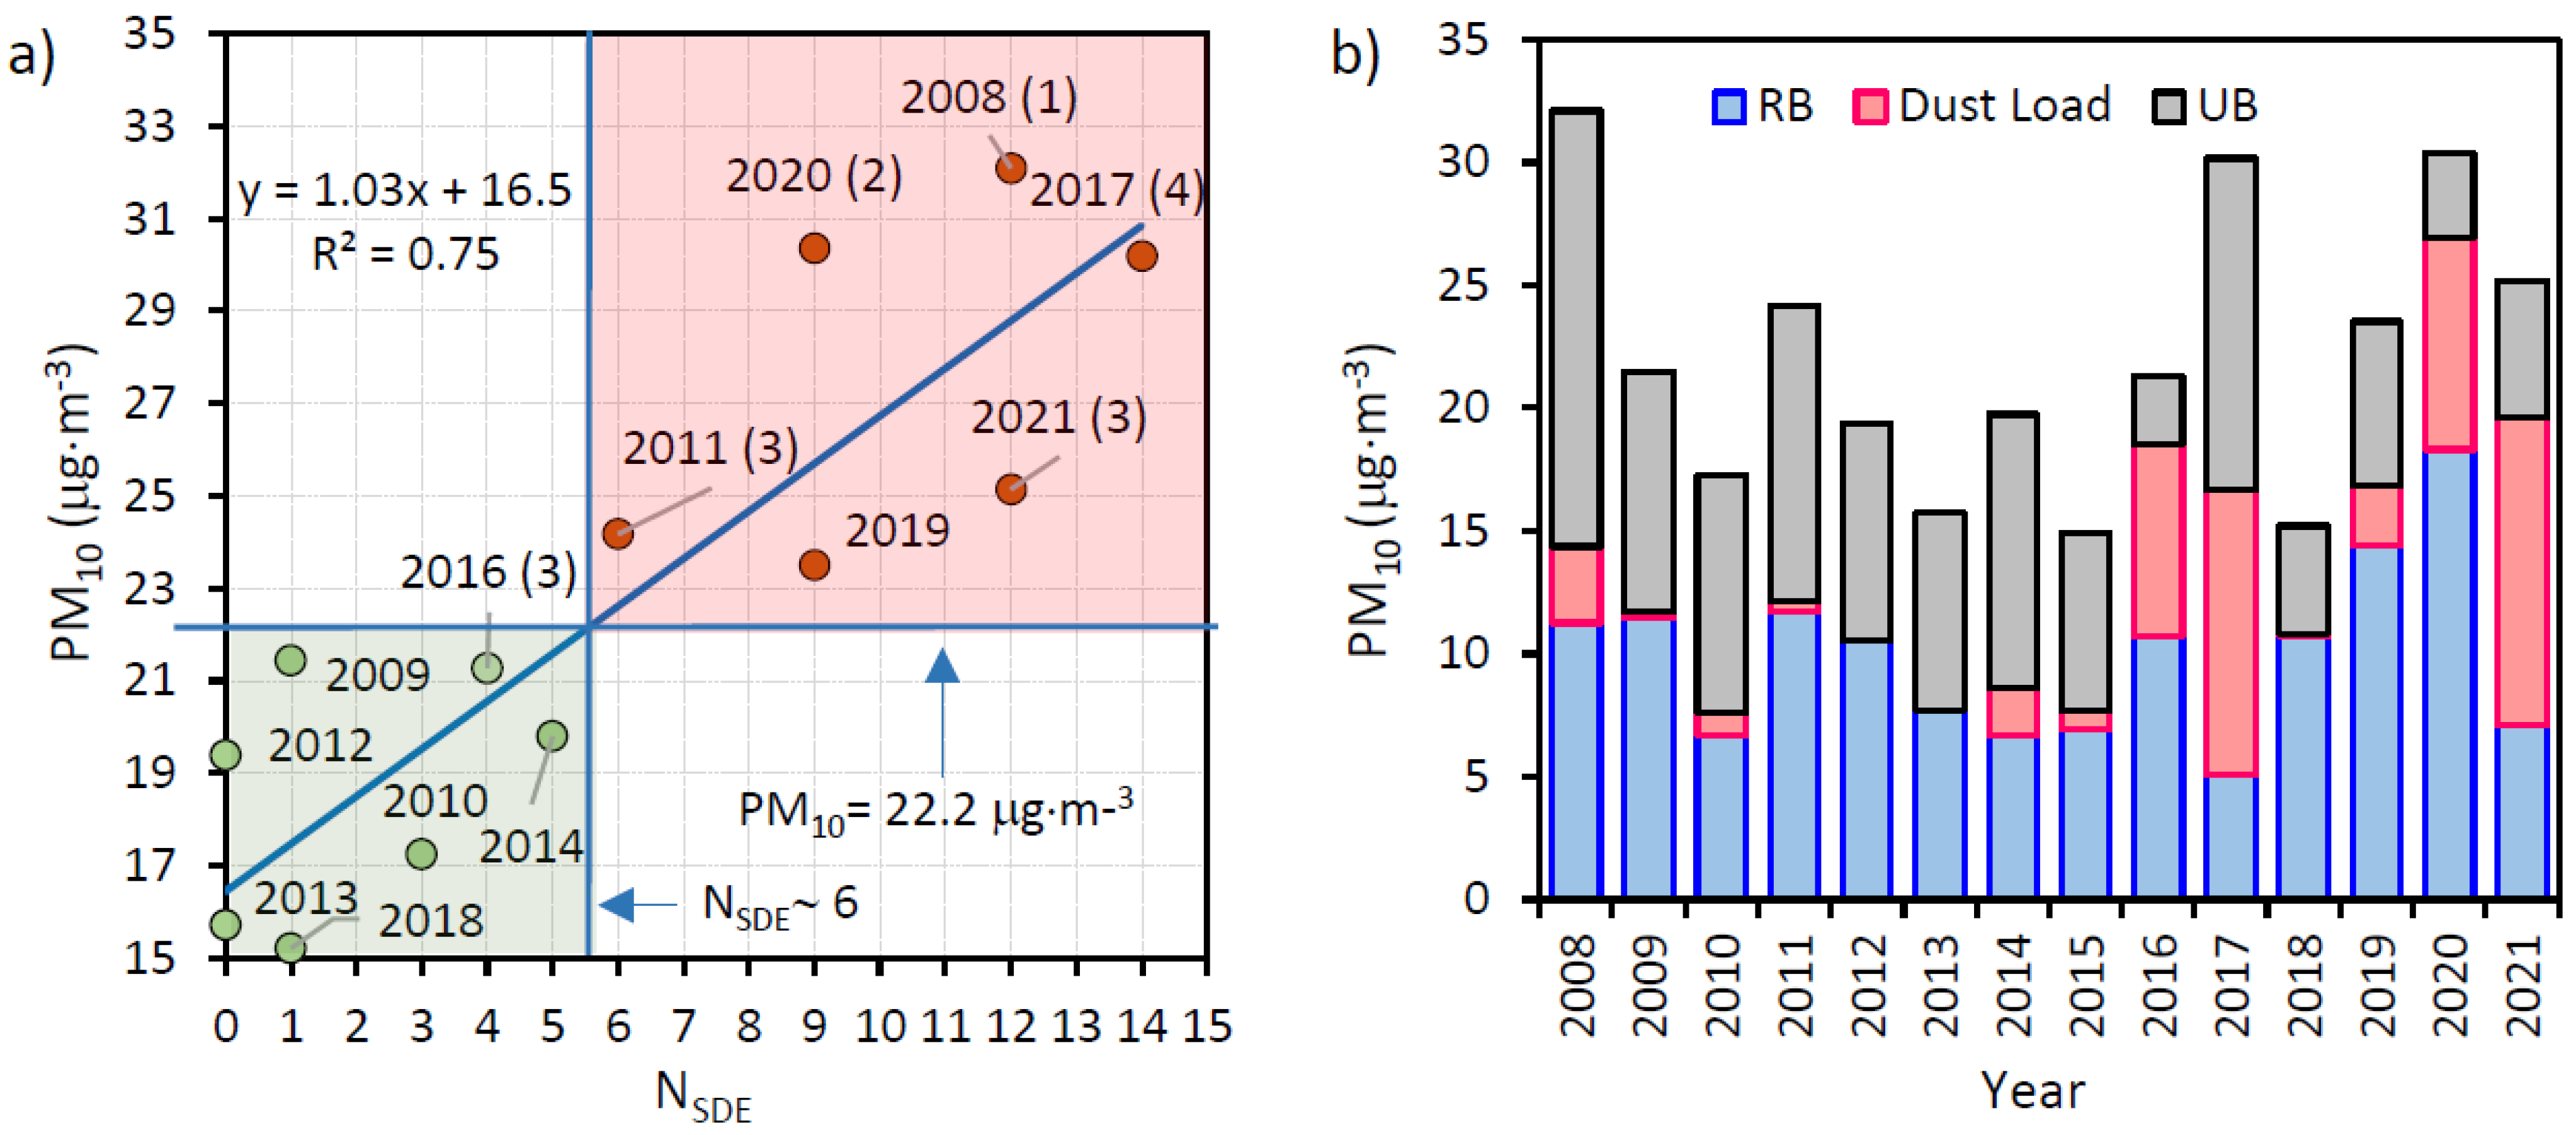
Figure 2a shows the relationship between the number of days influenced by Saharan dust intrusions (NSDE) and the mean PM10 concentration obtained at AGRO during the month of February over the last 14 years (2008–2021). The correlation was statistically significant at a 95% confidence level (R2 = 0.75). A background PM10 concentration of 16.5 μg·m−3 was obtained on non-event days. As seen in Figure 2a, large variations in the mean PM10 concentrations were registered, with the largest difference (~17 μg·m−3) being between 2008 and 2018.
Figure 2a also shows average PM10 levels (blue horizontal line) and NSDE levels (blue vertical line) obtained during the month of February for the 2008–2014 period. The intersection of both lines divides the graph into two sections. The years in which the NSDE and the mean PM10 concentration were lower than the average values for the whole study period (22.2 μg/m3 and ~6) fall within the green area of the plot. For those years within the red area of the graph, the NSDE and the mean PM10 concentration were above the average values for the whole period. The number of exceedances of the PM10 daily limit value (50 μg·m−3, 2008/50/EC Directive) due to SDE are shown in brackets. Exceedances caused by other types of events were not considered. For example, during the colder months, episodes of high atmospheric stability leading to the accumulation of pollutants are frequent. Although these events have a greater impact on PM1 and PM2.5 concentrations, significant increases in PM10 levels are also observed [6].
Both the determination coefficient and the slope of the line shown in Figure 2a were lower when all winter months were considered (R2 = 0.43; slope = 0.28). The reason for this is that using a longer period of data does not result in proportional increases in the NSDE and the mean PM10 concentrations, possibly because the relative increase in the number of days with air masses coming from the Atlantic (sometimes associated with precipitation events) is greater than the increase in the NSDE.
To determine the contribution of Saharan dust to PM10 mass concentrations during the month of February between 2008 and 2021, the P40 method was used. The MD load was calculated at the Pinoso station (PIN). Figure 2b shows the MD contribution to mean PM10 levels during February for the whole study period. The RB contribution was determined from PM10 concentrations measured at PIN after subtracting the MD load. On the other hand, the UB contribution was calculated by subtracting the RB and MD contributions to the total PM10 concentration recorded at AGRO.
An increase in the MD load in the second half of the study period was observed, especially during February 2021, when MD contributed ~50% to the average PM10 concentration. On average, the percentage contribution of MD to PM10 levels was ~14%, showing the relevance of this type of event in the SEIP.

3.1.2. Characterization of SDE during February 2021

February 2021 falls within the red area of Figure 2a and had up to 12 days under the influence of Saharan dust (three of them with PM10 levels above 50 μg·m−3). Furthermore, as already mentioned, the contribution of MD was the highest of the whole study period. For this reason, SDE occurring during the month of February 2021 were studied in more detail. With this objective, PM and AOP data from the UMH station were analyzed. PM10 concentrations measured at the UMH site showed a high correlation with those recorded at AGRO (PM10(UMH) = 1.1·PM10(AGRO); R2 = 0.94).
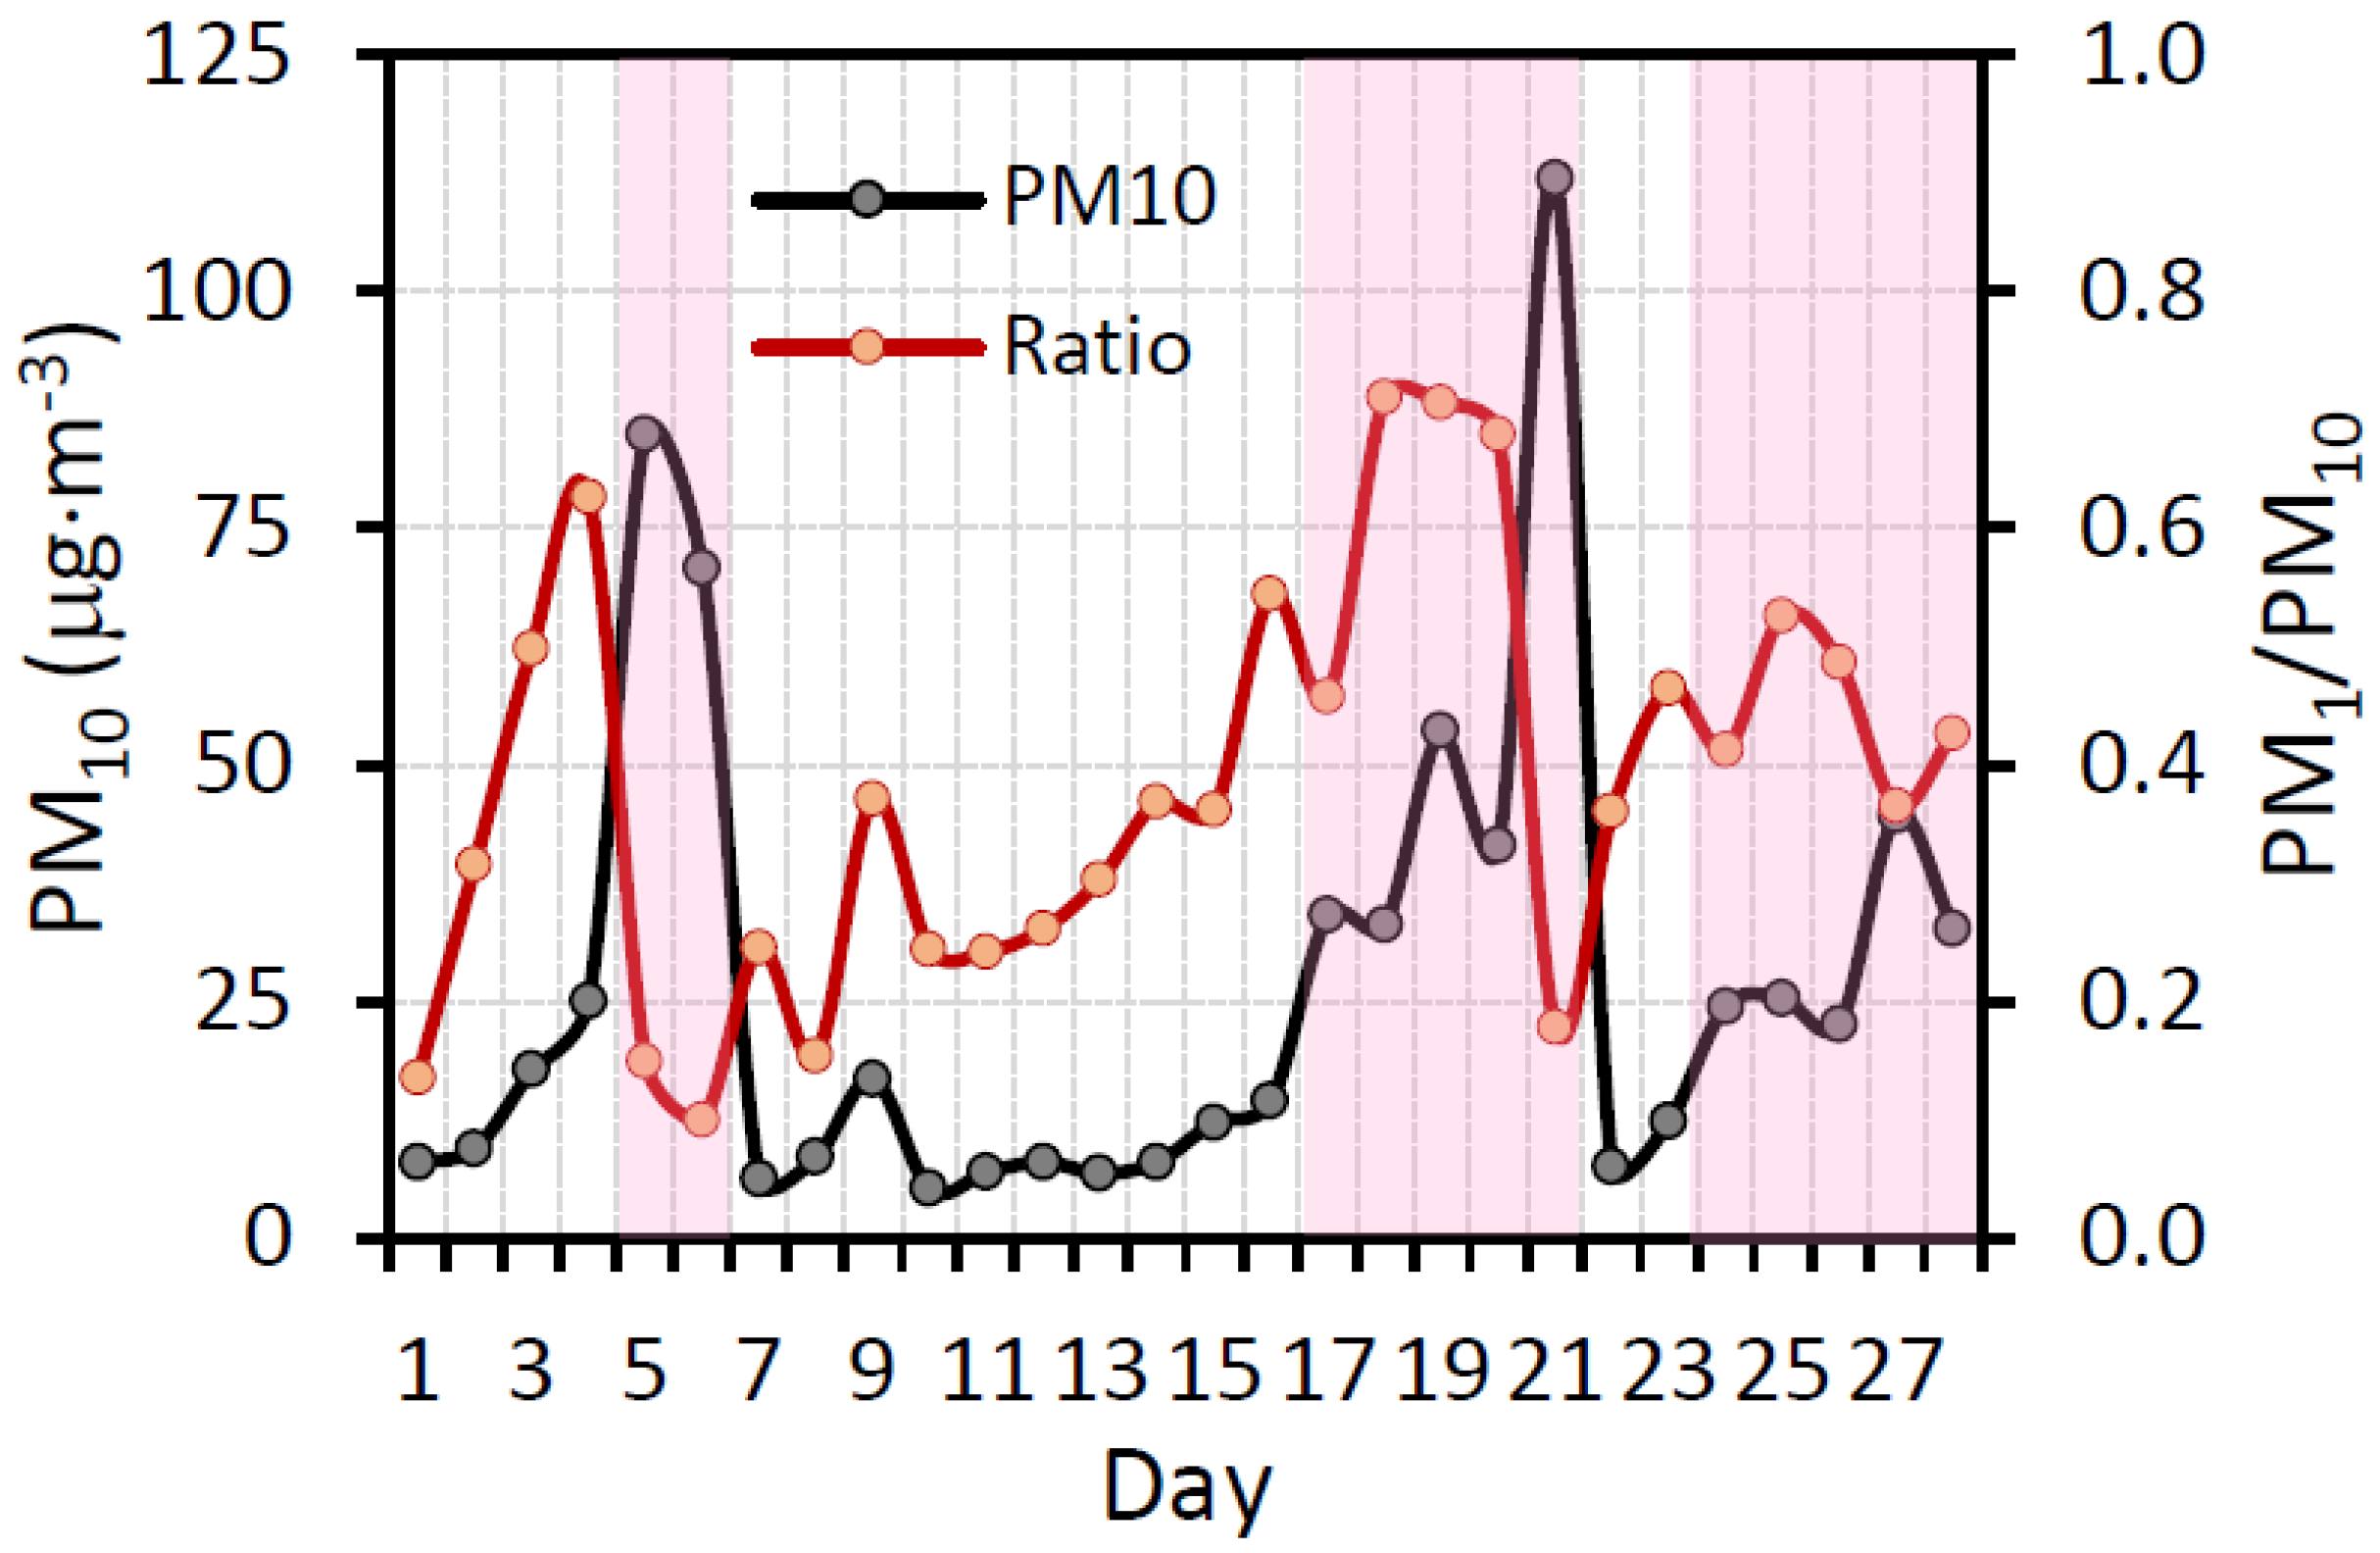
Figure 3 shows the evolution of PM10 daily concentrations as well as the PM1/PM10 ratio during February 2021. The monthly average PM10 and PM1/PM10 values were 26.9 μg·m−3 and 0.38, respectively. This ratio suggests a large contribution from coarse particulate matter at the study site. The mean PM2.5 and PM1 concentrations were, respectively, 15.1 and 9.8 μg·m−3. These values are generally low compared with those reported for other urban areas in Europe [33,34]. This is most likely due to the lack of industrial sources in the vicinity of the sampling site and the lower traffic emissions [6].
Figure 3 also shows the periods under the influence of Saharan events (shaded in pink) during February 2021. The third event lasted until the first days of March 2021, although the peak daily concentration was recorded on 27 February. During dust episodes, large increases in PM10 levels were observed, as well as a significant decrease in the PM1/PM10 ratio. The highest contribution of coarse particles was recorded during the first two episodes, with PM1/PM10 ratios below 0.2.
Figure S1 (Supplementary Material) shows simulations of dust load (g/m2) and dust opt. depth (550 nm) from the BSC/DREAM8b model over the Iberian Peninsula during the three SDE registered in February 2021. On the other hand, the synoptic patterns (850 hPa) associated with the transport of Saharan dust to the study area were different for the three events, as seen in Figure S1. A low-pressure system located west of the Iberian Peninsula was responsible for the first episode (SDE1). The second episode (SDE2) was characterized by a high-pressure system over the central Mediterranean region coupled with a trough emanating southward from the Icelandic low. Finally, a high-pressure system centerd over the western Mediterranean was the dominant scenario during the third event (SDE3). The characteristics of the three dust episodes registered in February 2021 are presented in Table 2.
PM10 levels were highest for SDE1 and SDE2. However, the mass size distribution was quite different during both episodes. A higher contribution of fine particles (<2.5 µm) to PM10 concentrations was observed during SDE2, as shown by the mean values of the PM mass ratios. The contribution of fine particles during SDE3 was also significantly higher than during SDE1.

3.2. Impact of SDE on Optical Properties

3.2.1. General Features

Table 3 presents summary statistics of aerosol optical properties (on an hourly basis) at the UMH site during the study period. The hourly evolution of the measured parameters is shown in Figure S2 (Supplementary Material).
The mean value obtained for σap (10.1 Mm−1) was lower than the values recorded in near-shore urban environments in the Iberian Peninsula such as Burjassot (18.6 Mm−1; λ = 520 nm) [35] and Granada (24 Mm−1; λ = 550 nm) [36]. Similarly, σsp values in Burjassot (80 Mm−1; λ = 550 nm) [37] and Granada (61 Mm−1; λ = 550 nm) were higher than that reported here [36]. Nevertheless, comparisons between the aerosol optical properties shown in Table 3 and reference values obtained in previous works at UB sites should be carried out with caution since the monitoring periods are different.
The AAE value (1.40) indicates that, although BC was the main absorbing aerosol component, there was some contribution from non-BC absorbers, such as Brown Carbon (BrC) and MD. Undoubtedly, coarse particles predominated over fine particles and had a prominent role in the scattering process according to the mean SAE value (0.50). In fact, the P95 value (below 1.25) points to the predominance of large particles. This may be due to the following reasons: (1), almost half of the days in the study period were under the influence of African episodes; and (2), coarse particles may be resuspended in the air after the events. In addition, it should be noted that no precipitation events causing wet deposition occurred.
The mean SSA value (0.82) indicates that aerosols were mainly made up of scattering components. However, a certain contribution from absorbing particles cannot be ruled out, as SSA values below 0.85 may indicate the presence of highly absorbing aerosols [38].

3.2.2. MSE and MAE Values

Values of MSE (mass scattering efficiency) and MAE (mass absorption efficiency) were determined from PM mass concentrations and aerosol optical parameters. To obtain MSE and MAE values, the MLR (multilinear regression) method was used. The contribution from submicron (PM1), fine (PM2.5–1) and coarse particles (PM10–2.5) was calculated using the following formulas:
σsp (λ = 520 nm) = MSE1·PM1 + MSE2.5–1·PM2.5–1 + MSE10–2.5·PM10–2.5 + C
σap (λ = 525 nm) = MAE1·PM1 + MAE2.5–1·PM2.5–1 + MAE10–2.5·PM10–2.5 + C
C values have no radiative significance [36].
Table 4 presents MSE and MAE values obtained at the UMH site.
σap was mainly contributed by submicron particles, with an insignificant contribution from coarse particles. The values obtained were quite close to those found in the city of Granada [36]. On the other hand, although the greatest contribution to the σsp value was from the PM1 fraction, the influence of larger particles was not negligible. Additionally, it can be observed that the larger the particle size, the smaller the scattering efficiency.

3.2.3. AOP Variations as a Function of the Characteristics of SDE

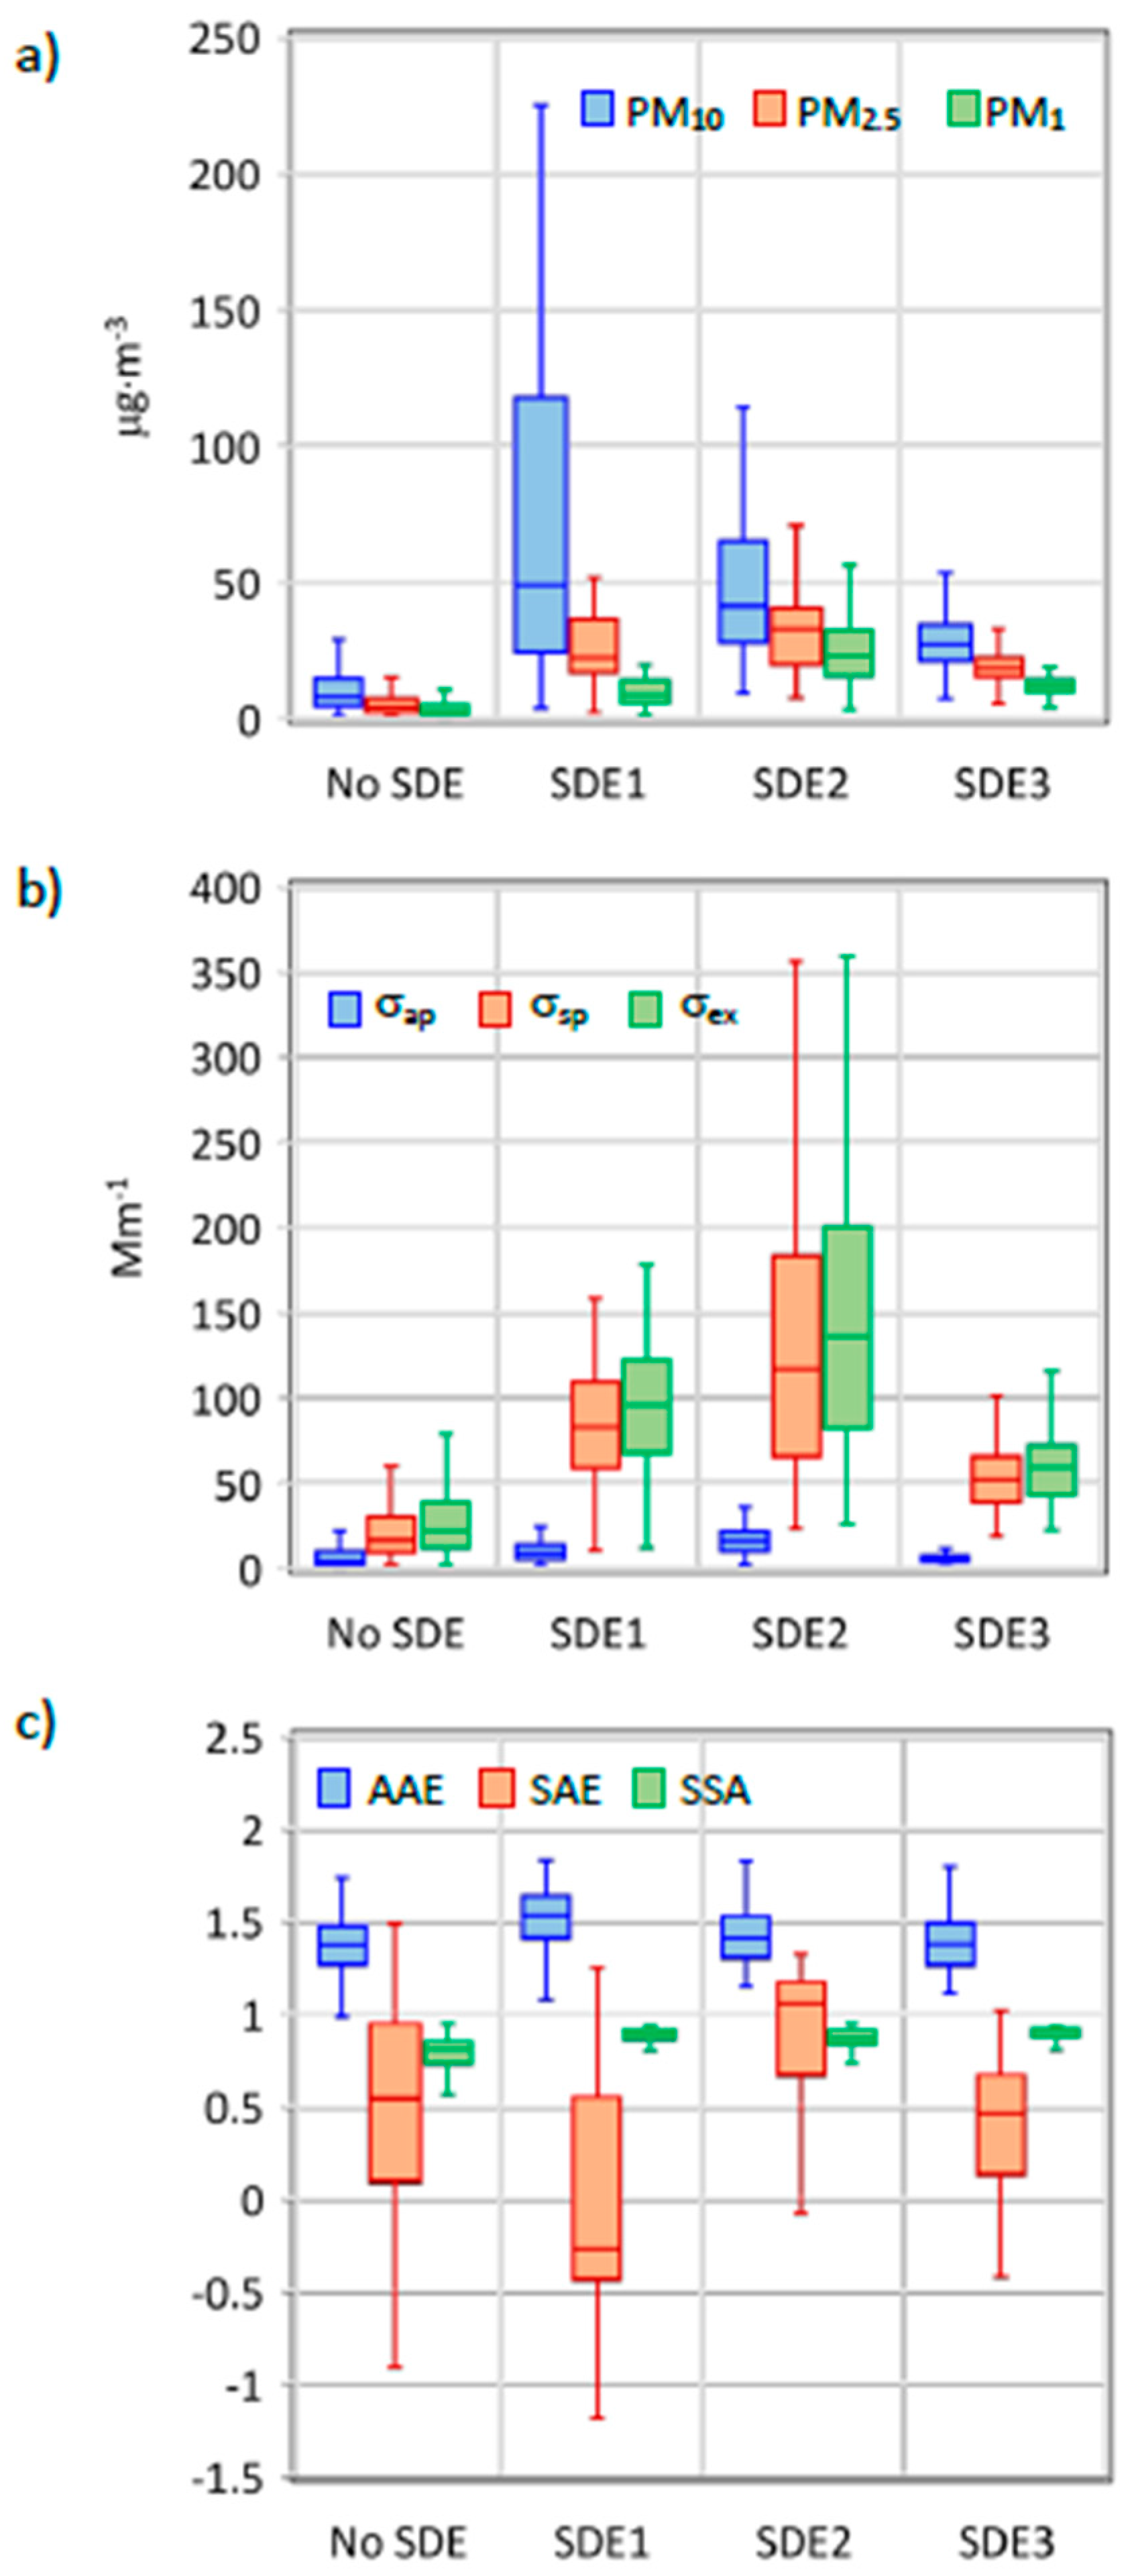
As shown in Section 3.1.2, particle mass size distributions for the three events detected during the study period were different. To study the impact of each episode on AOP, hourly data were used. Figure 4 shows PM mass concentrations, σsp, σap, the extinction coefficient (σextext = σsp + σap), AAE, SAE, and SSA for each of the three episodes. The values of these parameters in the absence of Saharan events (No SDE) are also shown.
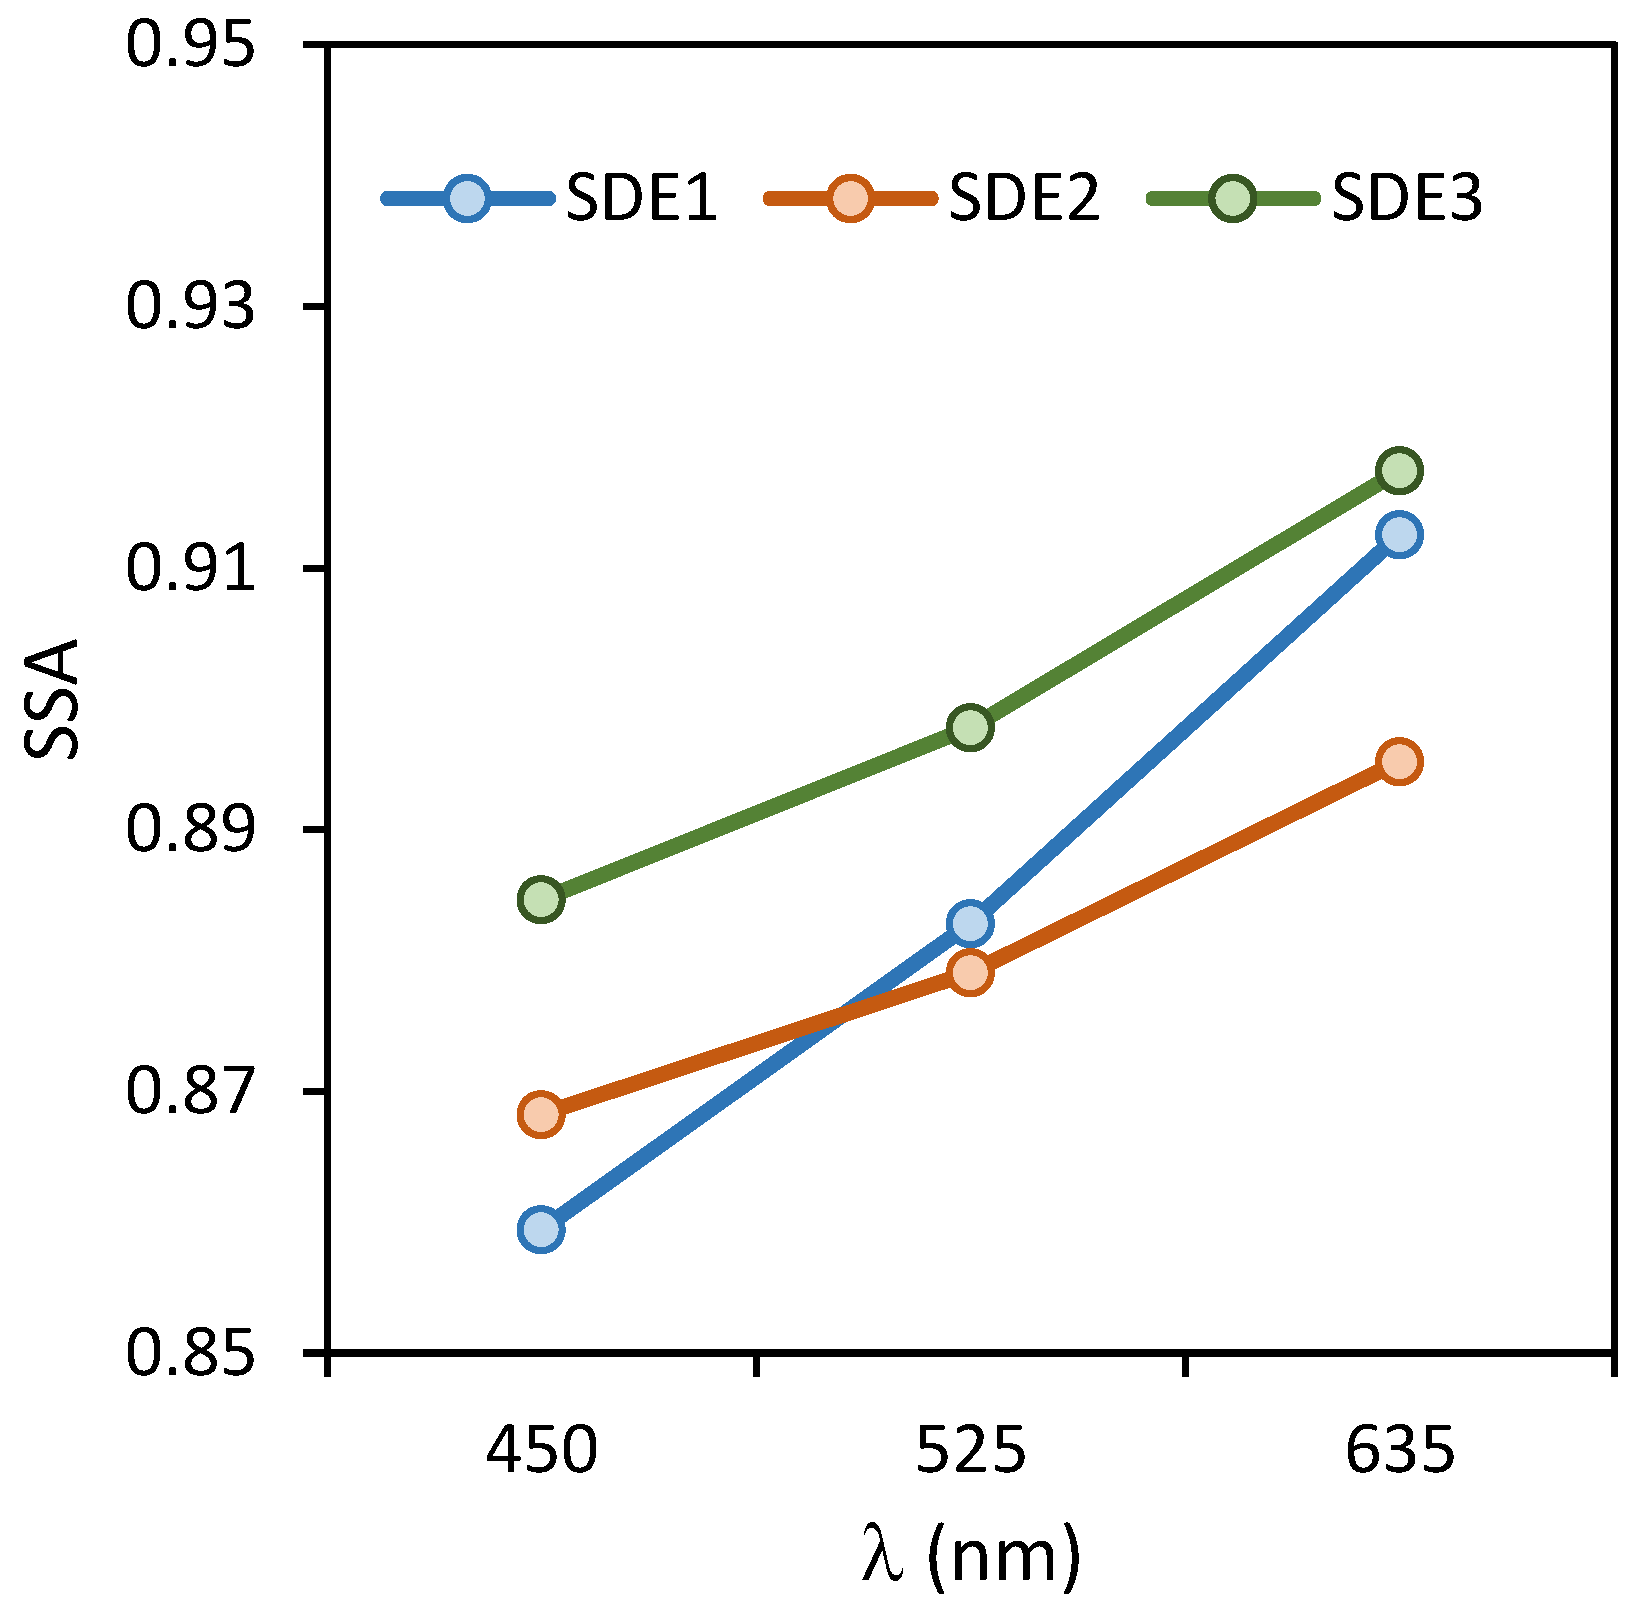
The impact of SDE on PM10 levels was highest during SDE1 (Figure 4a). In contrast, the largest contribution to the fine fractions was observed during SDE2. This affected σsp and σap values, as shown in Figure 4b. The median σap value during SDE2 (16.3 Mm−1) was considerably higher than during SDE1 (9.4 Mm−1), and the same was observed for σsp. As a result, the highest σext value was recorded during SDE2. SAE values (Figure 4c) were quite low both in the presence and absence of Saharan dust. The average SAE value during SDE1 (0.024) was the lowest due to the large contribution of coarse particles during this event. SSA mean values for the three episodes were very similar and close to 0.880 (Figure 4c). This value was higher than that recorded in the absence of events (0.776). Values close to or above 0.900 (λ = 520 nm) have been previously obtained in the Iberian Peninsula during Saharan events [17,39,40,41]. The spectral variation of SSA can provide useful information about the dominance of specific aerosol types (e.g., BC, organic carbon, dust, sulfates) during events [42,43]. Generally, SSA increases with wavelength for dust aerosols and decreases for biomass-burning and urban/industrial aerosols, while it exhibits almost neutral spectral dependence in the case of the aerosol mixture and sulfate particles [44,45,46]. In addition, an equal mixing of fine and coarse particles is produced when SSA is nearly independent of the wavelength [42]. Figure 5 shows the spectral dependence of SSA (450–635 nm). The slope of the line for SDE1 was significantly higher (almost twice) than for SDE2 and SDE3. This suggests that the contribution of MD was greater during SDE1 than during the other episodes.
Figure 5 also indicates that SDE1 was dominated by coarse aerosols, while during SDE2 and SDE3, the contribution of fine and coarse particles was more similar. An equivalent discrimination of aerosol types according to aerosol size can be found in Patel et al. [42].
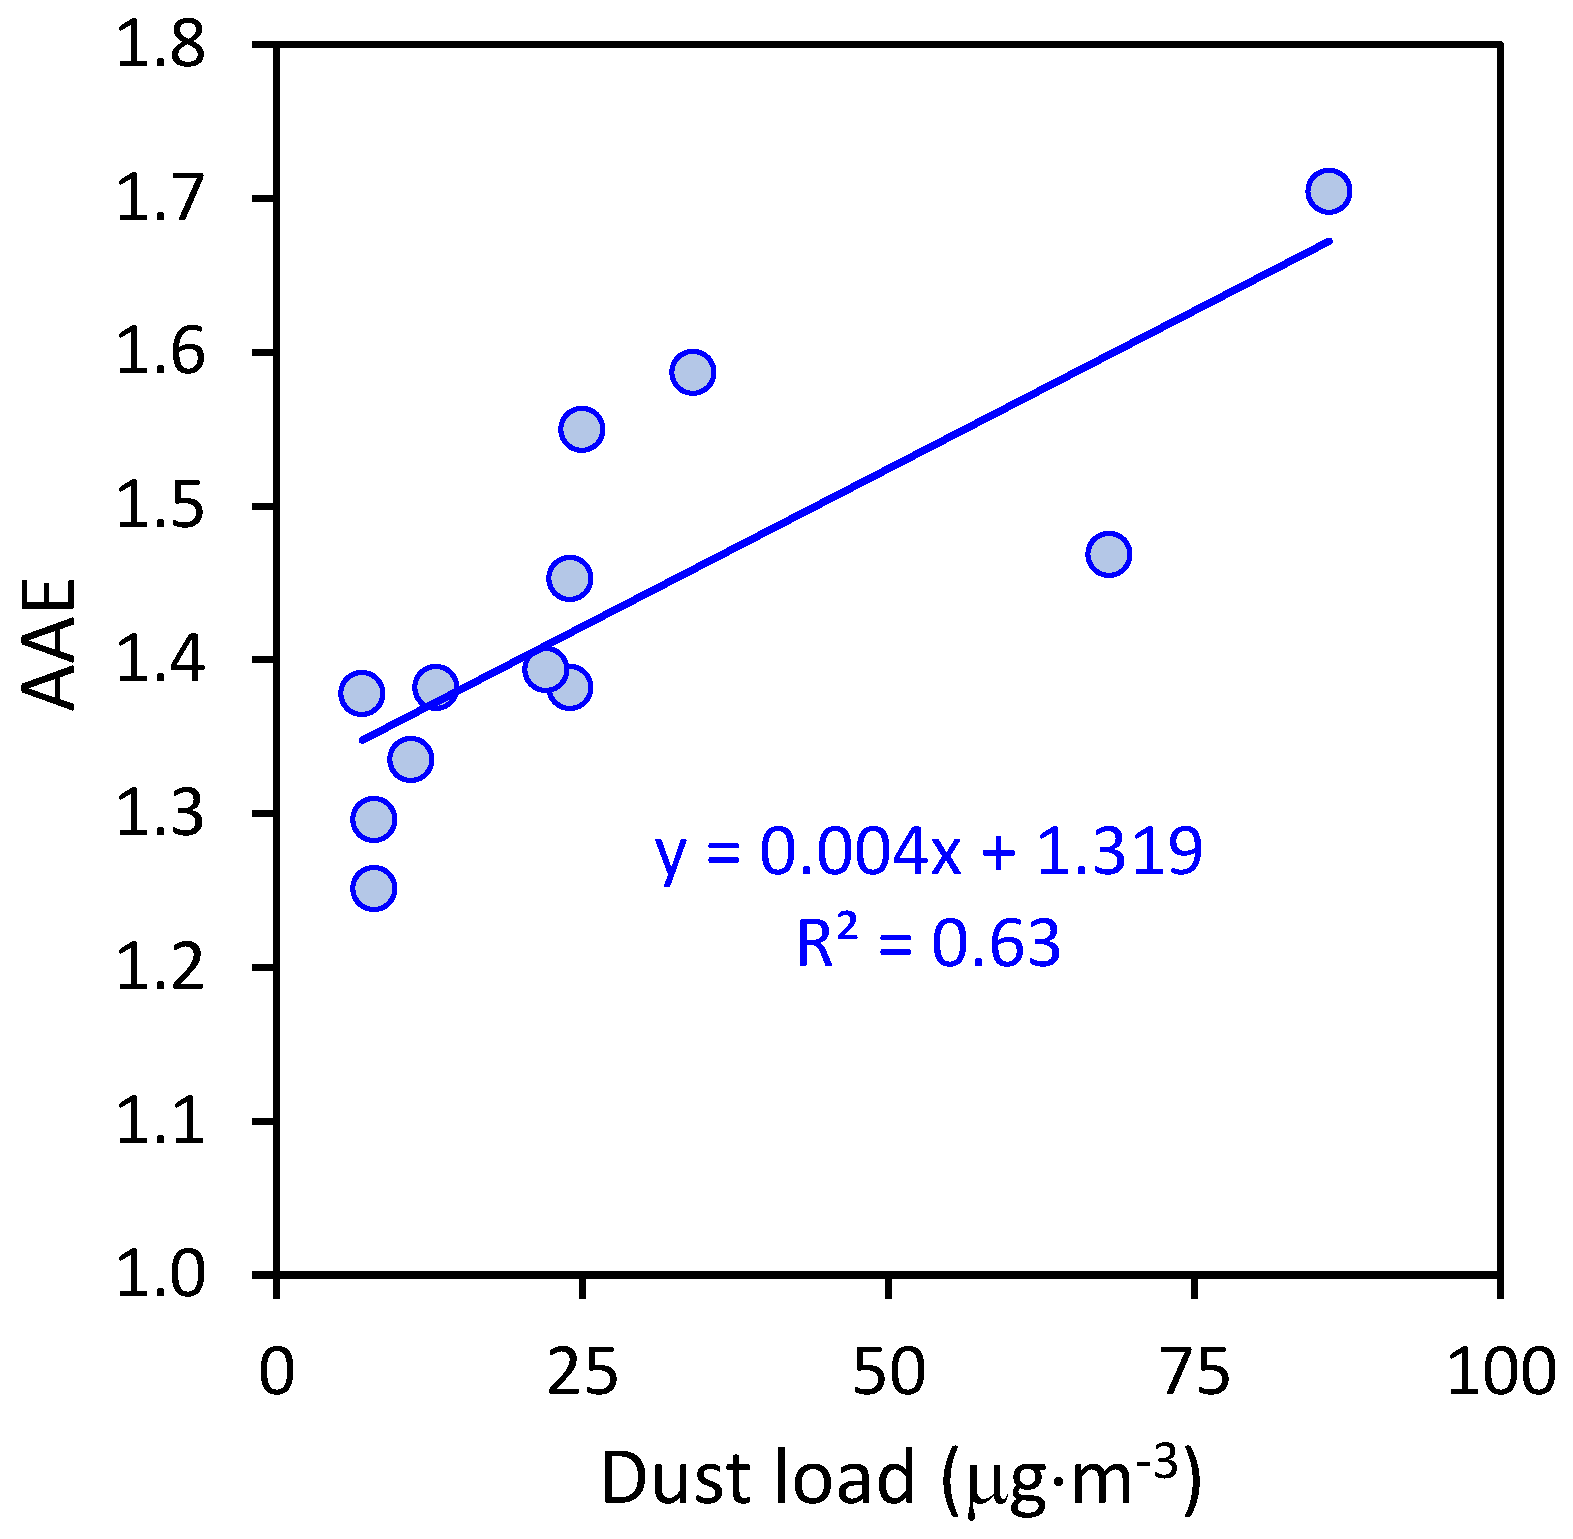
The highest mean AAE value was recorded during this first episode (1.525). AAE values during SDE2 and SDE3 were also slightly higher than those obtained in the absence of events. Therefore, it can be assumed that during both SDE, there was some contribution from MD to the absorption process. Figure 6 shows the relationship between AAE values and MD loads on event days (NSDE = 12). It can be observed that an increment in the MD load was linked with an increase in the AAE value. Similar results were obtained by Ealo et al. [15].
The correlation between AAE and MD concentrations was statistically significant (p-value < 0.05) and indicates that, in the absence of Saharan dust, an AAE value of 1.319 would be obtained. This implies an average MD contribution of 6% to the monthly average AAE value shown in Table 3.
A better characterization of the absorption during these events can be carried out by analyzing the relationship between AAE and EAE (Extinction Angström Exponent). The use of the matrix representing the division of AAE vs. EAE space is widely used [43,46]. This approach provides a good discrimination among light-absorbing PM components (mostly MD, mixed MD and BC, and mostly BC) since each of these species have specific and well-known values of AAE and EAE. In this work, the absorbing aerosols have been distinguished based on the following classification [43]: mostly MD (AAE > 1.8, EAE < 0.8), mostly BC (0.8 < AAE < 1.4, EAE > 1), and mixed MD and BC (AAE ~ 1.5, EAE ~ 0.9). Table 5 shows the mean values obtained for AAE450–635 and EAE450–635 during the three events and for no SDE conditions.
The data shown in Table 5 suggest that during the three SDE, light absorption was produced by mixed MD and BC aerosols. The values for SDE1 were closer to the absorption dominated by MD, while for no SDE conditions, a higher contribution of BC to the absorption process was observed.

4. Conclusions

The average contribution of MD to the PM10 mass concentration at an UB site in south-eastern Spain during February 2021 was ~50%. This value was the highest obtained for the month of February in the last 14 years. The high MD load over the area was due to three SDE detected in February 2021. The characteristics of the three episodes (mass size distributions, duration, synoptic scenarios, etc) were different. SDE1 was characterized by a large contribution from coarse particles, while the highest PM2.5 and PM1 mass concentrations were registered during SDE2. As a consequence, the influence of each event on AOP was also different. σap and σsp values were highest during SDE2, while the lowest SAE values were obtained for SDE1. The SAE monthly mean value found in this study was quite low (0.50) for an urban environment. A possible reason for this is that coarse particles remained in the atmosphere after dust episodes. MD loads during SDE were significantly correlated with AAE values, indicating a contribution from this component to the absorption process. The relationship between AAE and EAE indicates that the MD contribution was higher during the first event. This outcome is in agreement with that obtained from the SSA spectral analysis, pointing to MD as the dominant aerosol type during SDE1. On the other hand, SSA values were similar during the three events and higher than during non-event periods. This indicates that during SDE, the scattering dominates over the absorption process. From the results obtained it can also be concluded that particles of all sizes are involved in the scattering process, although fine particles scatter light more efficiently (MSE = 4.44 ± 0.06 m2·g−1 for PM1). In contrast, only the finest particles significantly absorb light.

Supplementary Materials

The following are available online at https://www.mdpi.com/article/10.3390/atmos12111469/s1, Figure S1: Meterorological scenarios at 850 mb geopotential height (m) (NCEP/NCAR reanalysis) and results of predictive model BSC-DREAM8b for: (a) SDE1, (b) SDE2 and (c) SDE3. Figure S2: Hourly evolution of σsp, SAE, σap, AAE and SSA during February 2021 at the UMH site.

Author Contributions

Conceptualization, J.C.; Data curation, R.C.; Formal analysis, A.L.-C., R.C., E.Y. and N.G.; Funding acquisition, J.C. and J.F.N.; Investigation, A.L.-C., A.C., E.Y. and J.F.N.; Supervision, E.Y. and J.C.; Writing—original draft, A.L.-C. and J.F.N.; Writing—review & editing, N.G. All authors have read and agreed to the published version of the manuscript.

Funding

This research was funded by the Spanish Ministry of Science, Innovation and Universities (COSMOS Project, ref. RTI2018-098639-B-I00).

Institutional Review Board Statement

Not applicable.

Informed Consent Statement

Not applicable.

Data Availability Statement

Publicly available datasets were analysed in this study.

Acknowledgments

The authors would like to thank the Environmental Surveillance Network of the regional Government of Valencia for supplying the time series of PM10 used in this study, and the ACTRIS-Spain network (CGL2017-90884-REDT). A. Clemente thanks the Spanish Ministry of Education for a predoctoral grant (FPU18/00081). A. López-Caravaca thanks the Spanish Ministry of Science and Innovation for a predoctoral grant (PRE2019-457 089098).

Conflicts of Interest

The authors declare no conflict of interest.

References

  1. Pey, J.; Querol, X.; Alastuey, A.; Forastiere, F.; Stafoggia, M. African dust outbreaks over the Mediterranean Basin during 2001–2011: PM10 concentrations, phenomenology and trends, and its relation with synoptic and mesoscale meteorology. Atmos. Chem. Phys. 2013, 13, 1395–1410. [Google Scholar] [CrossRef] [Green Version]
  2. Barnaba, F.; Bolignano, B.; Di Liberto, L.; Morelli, M.; Lucarelli, F.; Nava, S.; Perrino, C.; Canepari, S.; Basart, S.; Costabile, F.; et al. Desert dust contribution to PM10 loads in Italy: Methods and recommendations addressing the relevant European Commission Guidelines in support to the Air Quality Directive 2008/50. Atmos. Environ. 2017, 161, 288–305. [Google Scholar] [CrossRef]
  3. Huerta-Viso, A.; Crespo, J.; Galindo, N.; Yubero, E.; Nicolás, J.F. Saharan dust events over the Valencian Community (Eastern Iberian Peninsula): Synoptic circulation patterns and contribution to PM10 Levels. Aerosol Air Qual. Res. 2020, 20, 2519–2528. [Google Scholar] [CrossRef]
  4. Querol, X.; Pérez, N.; Reche, C.; Ealo, M.; Ripoll, A.; Tur, J.; Pandolfi, M.; Pey, J.; Salvador, P.; Moreno, T.; et al. African dust and air quality over Spain: Is it only dust that matters? Sci. Total Environ. 2019, 686, 737–752. [Google Scholar] [CrossRef]
  5. Querol, X.; Pey, J.; Pandolfi, M.; Alastuey, A.; Cusack, M.; Pérez, N.; Moreno, T.; Viana, M.; Mihalopoulus, N.; Kallos, G.; et al. African dust contributions to mean ambient PM10 mass-levels across the Mediterranean Basin. Atmos. Environ. 2009, 43, 4266–4277. [Google Scholar] [CrossRef]
  6. Galindo, G.; Yubero, E.; Clemente, A.; Nicolás, J.F.; Varea, M.; Crespo, J. PM events and changes in the chemical composition of urban aerosols: A case study in the western Mediterranean. Chemosphere 2020, 244, 125520. [Google Scholar] [CrossRef] [PubMed]
  7. Nicolás, J.F.; Lucarelli, F.; Galindo, N.; Yubero, E.; Crespo, J.; Calzolai, G.; Nava, S. Impact of traffic flows and meteorological events on the hourly elemental composition of fine and coarse particles at an urban site. Aerosol Air Qual. Res. 2020, 20, 991–1001. [Google Scholar] [CrossRef]
  8. Jiménez, E.; Linares, C.; Martínez, D.; Díaz, J. Role of Saharan dust in the relationship between particulate matter and short-term daily mortality among the elderly in Madrid (Spain). Sci. Total Environ. 2010, 408, 5729–5739. [Google Scholar] [CrossRef]
  9. Pérez, L.; Tobias, A.; Querol, X.; Künzli, N.; Pey, N.; Alastuey, A.; Viana, M.; Valero, N.; González-Cabré, M.; Sunyer, J. Coarse particles from Saharan dust and daily mortality. Epidemiology 2008, 19, 800–807. [Google Scholar] [CrossRef]
  10. Tobías, A.; Pérez, L.; Díaz, J.; Linares, C.; Pey, J.; Alastuey, A.; Querol, X. Short-term effects of particulate matter on total mortality during Saharan dust outbreaks: A case-crossover analysis in Madrid (Spain). Sci. Total Environ. 2011, 412–413, 386–389. [Google Scholar] [CrossRef]
  11. IPCC. Climate Change 2013: The Physical Science Basis. Contribution of Working Group I to the Fifth Assessment Report of the Intergovernmental Panel on Climate Change; Stocker, T.F., Qin, D., Plattner, G.K., Tignor, M., Allen, S.K., Boschung, J., Nauels, A., Xia, Y., Bex, V., Midgley, P.M., Eds.; Cambridge University Press: Cambridge, UK; New York, NY, USA, 2013; p. 1535. [Google Scholar] [CrossRef] [Green Version]
  12. Pereira, S.N.; Wagner, F.; Silva, A.M. Seven years of measurements of aerosol scattering properties, near the surface, in the southwestern Iberia Peninsula. Atmos. Chem. Phys. 2011, 11, 17–29. [Google Scholar] [CrossRef] [Green Version]
  13. Valenzuela, A.; Olmo, F.J.; Lyamani, H.; Antón, M.; Titos, G.; Cazorla, A.; Alados-Arboledas, L. Aerosol scattering and absorption Angström exponents as indicators of dust and dust-free days over Granada (Spain). Atmos. Res. 2015, 154, 1–13. [Google Scholar] [CrossRef] [Green Version]
  14. Ealo, M.; Alastuey, A.; Ripoll, A.; Pérez, N.; Cruz Minguillón, M.; Querol, X.; Pandolfi, M. Detection of Saharan dust and biomass burning events using near-real-time intensive aerosol optical properties in the north-western Mediterranean. Atmos. Chem. Phys. 2016, 16, 12567–12586. [Google Scholar] [CrossRef] [Green Version]
  15. Fernández, A.J.; Molero, F.; Salvador, P.; Revuelta, A.; Becerril-Valle, M.; Gómez-Moreno, F.J.; Artíñano, B.; Pujadas, M. Aerosol optical, microphysical and radiative forcing properties during variable intensity African dust events in the Iberian Peninsula. Atmos. Res. 2017, 196, 129–141. [Google Scholar] [CrossRef]
  16. Titos, G.; Ealo, M.; Pandolfi, M.; Pérez, N.; Sola, Y.; Sicard, M.; Comerón, A.; Querol, X.; Alastuey, A. Spatiotemporal evolution of a severe winter dust event in the western Mediterranean: Aerosol optical and physical properties. J. Geophys. Res. 2017, 122, 4052–4069. [Google Scholar] [CrossRef] [Green Version]
  17. Castañer, R.; Nicolás, J.F.; Crespo, J.; Yubero, E.; Galindo, N.; Caballero, S.; Pastor, C. Influence of air mass origins on optical properties and PM concentrations measured at a high mountain station located in the southwestern Mediterranean. Atmos. Res. 2017, 197, 244–254. [Google Scholar] [CrossRef]
  18. Formenti, P.; Rajot, J.L.; Desboeufs, K.; Saïd, F.; Grand, N.; Chevaillier, S.; Schmechtig, C. Airborne observations of mineral dust over western Africa in the summer Monsoon season: Spatial and vertical variability of physico-chemical and optical properties. Atmos. Chem. Phys. 2011, 11, 6387–6410. [Google Scholar] [CrossRef] [Green Version]
  19. Garrett, T.J.; Russell, L.M.; Ramaswamy, V.; Maria, S.F.; Huebert, B.J. Microphysical and radiative evolution of aerosol plumes over the tropical North Atlantic Ocean. J. Geophys. Res. 2003, 108, 4022. [Google Scholar] [CrossRef]
  20. Denjean, C.; Cassola, F.; Mazzino, A.; Triquet, S.; Chevaillier, S.; Grand, N.; Bourrianne, T.; Momboisse, G.; Sellegri, K.; Schwarzenbock, A.; et al. Size distribution and optical properties of mineral dust aerosols transported in the western Mediterranean. Atmos. Chem. Phys. 2016, 16, 1081–1104. [Google Scholar] [CrossRef] [Green Version]
  21. Galindo, N.; Yubero, E.; Nicolás, J.F.; Varea, M.; Crespo, J. Characterization of metals in PM1 and PM10 and health risk evaluation at an urban site in the western Mediterranean. Chemosphere 2018, 201, 243–250. [Google Scholar] [CrossRef]
  22. Galindo, N.; Yubero, E.; Clemente, A.; Nicolás, J.F.; Navarro-Selma, B.; Crespo, J. Insights into de origin and evolution of carbonaceous aerosols in a Mediterranean urban environment. Chemosphere 2019, 235, 636–642. [Google Scholar] [CrossRef] [PubMed]
  23. Escudero, M.; Querol, X.; Pey, J.; Alastuey, A.; Pérez, N.; Ferreira, F.; Alonso, S.; Rodríguez, S.; Cuevas, E. A methodology for the quantification of the net African dust load in air quality monitoring networks. Atmos. Environ. 2007, 41, 5516–5524. [Google Scholar] [CrossRef]
  24. Pey, J. Caracterización Físico-Química de Aerosoles Atmosféricos en el Mediterráneo Occidental. Ph.D. Thesis, Departament d’Enginyeria Minera i Recursos Naturals, Universitat Politècnica de Catalunya, Barcelona, Spanish, 2008. Available online: http://hdl.handle.net/10803/6992 (accessed on 3 November 2021).
  25. Gama, C.; Pio, C.; Monteiro, A.; Russo, M.; Fernandes, A.P.; Borrego, C.; Baldasano, J.M.; Tchepel, O. Comparison of Methodologies for Assessing Desert Dust Contribution to Regional PM10 and PM2.5 Levels: A One-Year Study Over Portugal. Atmosphere 2020, 11, 134. [Google Scholar] [CrossRef] [Green Version]
  26. Müller, T.; Laborde, M.; Kassel, G.; Wiedensolher, A. Design and performance of a three-wavelength LED-based total scatter and backscatter integrating nephelometer. Atmos. Meas. Tech. 2011, 4, 1291–1303. [Google Scholar] [CrossRef] [Green Version]
  27. López, J.F.; Cachorro, V.E.; de Frutos, A.M. Analysis of aerosol scattering properties measured by nephelometer at a coastal-rural site in the Atlantic southwest of Iberian Peninsula. J. Atmos. Sol. Terr. Phy. 2015, 132, 48–63. [Google Scholar] [CrossRef]
  28. Schuster, G.L.; Dubovik, O.; Holben, B.N. Ångström exponent and bimodal aerosol size distributions. J. Geophys. Res. 2006, 111, D07207. [Google Scholar] [CrossRef] [Green Version]
  29. Collaud Coen, M.; Weingartner, E.; Schaub, D.; Hueglin, C.; Corrigan, C.; Henning, S.; Schwikowski, M.; Baltensperger, U. Saharan dust events at the Jungfraujoch: Detection by wavelength dependence of the single scattering albedo and first climatology analysis. Atmos. Chem. Phys. 2004, 4, 2465–2480. [Google Scholar] [CrossRef] [Green Version]
  30. Drinovec, L.; Močnik, G.; Zotter, P.; Prévôt, A.S.H.; Ruckstuhl, C.; Coz, E.; Rupakheti, M.; Sciare, J.; Müller, T.; Wiedensohler, A.; et al. The “dual-spot” Aethalometer: An improved measurement of aerosol black carbon with real-time loading compensation. Atmos. Meas. Tech. 2015, 8, 1965–1979. [Google Scholar] [CrossRef] [Green Version]
  31. Bergstrom, R.W.; Pilewskie, P.; Russell, P.B.; Redemann, J.; Bond, T.C.; Quinn, P.K.; Sierau, B. Spectral absorption properties of atmospheric aerosols. Atmos. Chem. Phys. 2007, 7, 5937–5943. [Google Scholar] [CrossRef] [Green Version]
  32. Fialho, P.; Hansen, A.D.A.; Honrath, R.E. Absorption coefficients by aerosols in remote áreas: A new approach to decouple dust and black carbón absorption coefficients using seven-wavelength Aethalometer data. J. Aeros. Sci. 2005, 36, 267–282. [Google Scholar] [CrossRef]
  33. Pateraki, S.; Assimakopoulos, V.D.; Bougiatioti, A.; Kouvarakis, G.; Mihalopoulos, N.; Vasilakos, C. Carbonaceous and ionic compositional patterns of fine particles over an urban Mediterranean area. Sci. Total Environ. 2012, 424, 251–263. [Google Scholar] [CrossRef]
  34. Squizzato, S.; Masio, M.; Agostini, C.; Visin, F.; Formenton, G.; Harrison, R.M.; Rampazzo, G. Factors, origin and sources affecting PM1 concentrations and composition at an urban background site. Atmos. Res. 2016, 180, 262–273. [Google Scholar] [CrossRef] [Green Version]
  35. Segura, S.; Estellés, V.; Esteve, A.R.; Marcos, C.R.; Utrillas, M.P.; Martínez-Lozano, J.A. Multiyear in-situ measurements of atmospheric aerosol absorption properties at an urban coastal site in western Mediterranean. Atmos. Environ. 2016, 129, 18–26. [Google Scholar] [CrossRef]
  36. Titos, G.; Foyo-Moreno, I.; Lyamani, H.; Querol, X.; Alastuey, A.; Alados-Arboledas, L. Optical properties and chemical composition of aerosol particles at an urban location: An estimation of aerosol mass scattering and absorption efficiencies. J. Geophys. Res. 2012, 117, D04206. [Google Scholar] [CrossRef] [Green Version]
  37. Esteve, A.R.; Estellés, V.; Utrillas, M.P.; Martínez-Lozano, J.A. In-situ integrating nephelometer measurements of the scattering properties of atmospheric aerosols at an urban coastal site in western Mediterranean. Atmos. Environ. 2012, 47, 43–50. [Google Scholar] [CrossRef]
  38. Schmeisser, L.; Andrews, E.; Ogren, J.A.; Sheridan, P.; Jefferson, A.; Sharma, S.; Kim, J.E.; Sherman, J.P.; Sorribas, M.; Kalapov, I.; et al. Classifying aerosol type using in situ surface spectral aerosol optical properties. Atmos. Chem. Phys. 2017, 17, 12097–12120. [Google Scholar] [CrossRef] [Green Version]
  39. Cachorro, V.E.; Toledano, C.; Prats, N.; Sorribas, M.; Mogo, S.; Berjón, A.; Torres, B.; Rodrigo, R.; de la Rosa, J.; de Frutos, A.M. The strongest desert dust intrusion mixed with smoke over the Iberian Peninsula registered with Sun photometry. J. Geophys. Res. 2008, 113, D14S04. [Google Scholar] [CrossRef] [Green Version]
  40. Valenzuela, A.; Olmo, F.J.; Lyamani, H.; Antón, M.; Quirantes, A.; Alados-Arboledas, L. Classification of aerosol radiative properties during African desert dust intrusions over southeastern Spain by sector origins and cluster analysis. J. Geophys. Res. 2012, 117, D06214. [Google Scholar] [CrossRef]
  41. Gómez-Amo, J.L.; Estellés, V.; Marcos, C.; Segura, S.; Esteve, A.R.; Pedrós, R.; Utrillas, M.P.; Martínez-Lozano, J.A. Impact of dust and smoke mixing on column-integrated aerosol properties from observations during a severe wildfire episode over Valencia (Spain). Sci. Total Environ. 2017, 599–600, 2121–2134. [Google Scholar] [CrossRef]
  42. Patel, P.N.; Dumka, U.C.; Kaskaoutis, D.G.; Babu, K.N.; Mathur, A.K. Optical and radiative properties of aerosols over Desalpar, a remote site in western India: Source identification, modification processes and aerosol type discrimination. Sci. Total Environ. 2017, 575, 612–627. [Google Scholar] [CrossRef] [Green Version]
  43. Patel, P.N.; Dumka, U.C.; Babu, K.N.; Mathur, A.K. Aerosol characterization and radiative properties over Kavaratti, a remote island in southern Arabian Sea from the period of observations. Sci. Total Environ. 2017, 599–600, 165–180. [Google Scholar] [CrossRef]
  44. Dubovik, O.; Holben, B.N.; Eck, T.F.; Smirnov, A.; Kaufman, Y.J.; King, M.D.; Tanre, D.; Slutsker, I. Variability of absorption and optical properties of key aerosol types observed in worldwide locations. J. Atmos. Sci. 2002, 59, 590–608. [Google Scholar] [CrossRef]
  45. Russell, P.B.; Bergstorm, R.W.; Shinozuka, Y.; Clarke, A.D.; De Carlo, P.F.; Jimenez, J.L.; Livingston, J.M.; Redemann, J.; Dubovik, O.; Strawa, A. Absorption Ångström exponent in AERONET and related data as an indicator of aerosol composition. Atmos. Chem. Phys. 2010, 10, 1155–1169. [Google Scholar] [CrossRef] [Green Version]
  46. Giles, D.M.; Holben, B.N.; Tripathi, S.N.; Eck, T.F.; Newcomb, W.W.; Slutsker, I.; Dickerson, R.R.; Thompson, A.M.; Mattoo, S.; Wang, S.-H.; et al. Aerosol properties over the Indo-Gangetic plain: A mesoscale perspective from the TIGERZ experiment. J. Geophys. Res. 2011, 116, D15809. [Google Scholar] [CrossRef]
Figure 1. Geographical location of Elche in the southeast of the Iberian Peninsula and location of the selected monitoring sites.
Atmosphere 12 01469 g001
Figure 2. (a) Relationship between the number of days influenced by Saharan dust (NSDE) and the mean PM10 concentration measured at the AGRO station during the month of February over the 2008–2021 period. The figure also shows average values of PM10 (blue horizontal line) and NSDE (blue vertical line) for the study period. (b) Regional, urban, and mineral dust contributions (RB, UB, and dust load) to the monthly mean PM10 mass concentration in Elche during February from 2008 to 2021.
Atmosphere 12 01469 g002
Figure 3. Daily evolution of PM10 concentrations and PM1/PM10 mass ratios at the UMH site during February 2021. Saharan events are shaded in pink.
Atmosphere 12 01469 g003
Figure 4. Box plots of (a) PM mass concentrations, (b) σsp, σap, and σext, (c) AAE, SAE, and SSA measured at the UMH station. The whiskers correspond to the 25th and 75th percentiles, the line across each box represents the median value, and maximum and minimum values are represented by dashes (−). Data were recorded on an hourly basis.
Atmosphere 12 01469 g004
Figure 5. Spectral variation of SSA for the three SDE.
Atmosphere 12 01469 g005
Figure 6. Correlation between AAE values and MD loads on event days.
Atmosphere 12 01469 g006
Table 1. Measurements of PM levels and/or AOP at the three monitoring stations.
Station (Type)MeasurementsTime ResolutionTime PeriodPurpouse b
AGRO (UB) PM10DailyFeb. (2008–2021)SDE on PM10
PIN (RB) PM10DailyFeb. (2008–2021)SDE on PM10
UMH (UB) PMx a, AOPDaily/HourlyFeb. (2021)SDE on AOP
a: PM10, PM2.5 and PM1; b: To study the influence of SDE on PM10 or AOP.
Table 2. Characteristics of the SDE recorded during February 2021 at the UMH site.
Dates and Duration
(N° days)
PM10/PM2.5/PM1
(µg·m−3) a
PM2.5/PM10PM1/PM2.5PM1/PM10
SDE15–6 (2)84.8/29.8/12.70.330.380.12
SDE217–21 (5)111.9/49.4/19.90.710.740.55
SDE324–28 (5)44.5/28.4/16.20.680.650.44
a: Maximum daily values during the three SDE.
Table 3. Statistical parameters of aerosol optical properties at the UMH station during the study period. b, SAE, SSA, AAE are dimensionless; σsp and σap coefficients are given in Mm−1.
σap
(λ = 520 nm)
AAEσsp
(λ = 525 nm)
bSAESSA
Mean 10.11.4053.90.160.500.82
Median 6.31.3935.50.150.570.84
DS 10.20.1755.00.040.550.10
Max 64.92.07355.80.532.770.95
Min 0.30.981.80.10−1.190.36
P5 1.31.156.90.12−0.460.62
P95 31.31.69178.60.221.220.93
Table 4. Average MSE and MAE (in m2·g−1) for February 2021.
MSE1MSE2.5–1MSE10–2.5RMAE1MAE2.5–1MAE10–2.5R
4.44 ± 0.060.97 ± 0.120.35 ± 0.040.960.61 ± 0.03−0.18 ± 0.060.06 ± 0.020.60
Table 5. Mean values of EAE and AAE during SDE and in the no SDE period.
AAE450–635EAE450–635
SDE11.5000.132
SDE21.4410.766
SDE31.4290.446
No SDE1.3680.917
Publisher’s Note: MDPI stays neutral with regard to jurisdictional claims in published maps and institutional affiliations.