Abstract
Acoustics can cause particles/droplets to agglomerate in the air medium, thereby accelerating gravity sedimentation. To assess the microphysical characteristics and environmental isotope effects of micro-droplet groups under the action of acoustic waves, an air chamber experimental platform was established, and 100 groups of controlled experiments were conducted. The characteristic particle size, size spectrum, isotope values, corresponding linear relationships with hydrogen and oxygen, and d values were analyzed. The isotope exchange equation between the micro-droplet groups and environmental water vapor inside the air chamber was investigated. The results showed that the peak size values of the micro-droplet groups increased under the action of acoustic waves. The characteristic particle size (D90) showed a “trigger effect” with the acoustic operation with a positive deviation in the size spectrum and isotope exchange between the micro-droplet groups and environmental water vapor. The relative variations in theoretical values for different sedimentation conditions were consistent with those of the experimental results. Environment isotopes could be used to trace the acoustic agglomeration process of micro-droplets in the future.
1. Introduction
Atmospheric aerosol particles are of great concern because of their adverse effects on human health and the environment [1,2,3,4,5,6,7,8]. Especially for PM2.5 and PM10, the removal of fine particles has attracted the extensive attention of scholars [9,10,11]. Owing to severe environmental pollution and increasingly strict environmental standards, acoustic agglomeration has been proposed as a potential method to remove fine particles and has been proven to have good dust removal efficiency, particularly in high-temperature and high-pressure environments [12,13]
Vibration of the fluid medium can increase when acoustic waves propagate. The vibration-induced collisions and coalescence of micro-particles/droplets have attracted extensive attention [14,15,16,17]. The acoustic agglomeration mechanisms mainly include orthokinetic interaction, acoustic wake effect, acoustic radiation pressure, and acoustically generated turbulence. Orthokinetic interaction refers to the collision and agglomeration between particles of different sizes due to the different entrained capacities of acoustic waves [14,15,16,17]. This mechanism can explain the acoustic agglomeration of polydisperse particles, but cannot explain the acoustic agglomeration of monodisperse particles. The acoustic wake effect indicates that the particle movement could form a wake zone behind its trajectory, and the particles moving inside the wake zone will accelerate and collide with particles ahead owing to the decrease in resistance. The acoustic wake effect can accurately explain monodisperse particle agglomeration [18,19,20]. When the sound pressure level (SPL) reaches a certain threshold, the acoustic radiation pressure between particles [18] and acoustically generated turbulence can be considered as acoustic agglomeration mechanisms.
Previous studies have shown that the effects of acoustic agglomeration differ with variation in acoustic and particle/droplet parameters. Shaw experimentally concluded that at an SPL of 145 dB, the proportion of dioctyl phthalate vapor concentration in the aerosol decreased by approximately 50% after being exposed to 1000 Hz acoustic waves [19]. Cheng et al. proposed that particle masses greater than 4 μm were 0.65 times more abundant than those less than 4 μm under an acoustic frequency of 3000 Hz and an SPL of 154 dB [14]. The total particle concentrations of PM2.5 and PM10 were reduced by 58% and 77%, respectively, when exposed to sound waves with an SPL of 160 dB [21]. In addition, Chang et al. [22] and Hou et al. [23] found that the droplet dissipation time was significantly shortened under the action of low-frequency acoustic waves. Bai et al. found that particle size (D) was significantly affected by the acoustic wave frequency and was positively correlated with the SPL, acoustic wave action time, and droplet number [24]. Shi et al. found that the longer the residence time of micro-droplets in the acoustic field, the higher the agglomeration effect [25].
Attention should be paid to parameters other than particle size, quantity, and concentration, which are of great significance in understanding the mechanism of acoustic agglomeration. Micro-droplets contain natural tracers of hydrogen and oxygen isotopes and are regarded as the fingerprints of water [26]. The isotopic value of atmospheric precipitation varies with the main controlling factors of precipitation, without considering the difference in water vapor isotopic values. Indoor studies have confirmed that droplet isotopes are sensitive to environmental parameters in saturated water vapor environments [27,28]. Droplet isotopes under acoustic waves are different from those naturally dissipated owing to changes in the molecular exchange rate. In addition to the microphysical characteristics, it is difficult to directly observe the other changes under the action of acoustic waves, and the energy exchange during the action of acoustic waves leads to isotope fractionation, which helps to reveal the mechanism of acoustic agglomeration. For field experiments, atmospheric water vapor deposition induced by low-frequency sound waves is usually based on a variety of observation methods; although intuitive results can be obtained [29,30,31,32], it is still doubtful whether the change process is caused by natural cloud changes or sound waves, and the mechanism research is insufficient, for which isotope changes can provide evidence. To date, there have been few reports on the characteristics of droplet isotopes under the action of acoustic waves [33]. In this study, a small-scale experimental device was prepared, and a comparative analysis of the variation in the micro-droplet groups isotopic values was conducted. A control group each of natural sedimentation and acoustic field sedimentation was also prepared. The particle size of the micro-droplet groups was observed continuously during sedimentation.
The remainder of this paper is organised as follows. After the introduction, the experimental device and analytical methods are introduced. In the third section, experimental data in terms of the particle size, droplet isotopes, and environmental water vapor under different sedimentation conditions have been presented. The fourth section focuses on the linear relationship of the isotope values and d values before and after sedimentation. Theoretical equations of isotope exchange between micro-droplet groups and environmental water vapor were established, and the corresponding isotope variation was calculated and analysed. The conclusions are presented in Section 5.
2. Materials and Methods
2.1. Experiment Setup
As shown in Figure 1, the experimental device comprised a micro-droplet generator, an acoustic generator, an air chamber, and monitoring and sample collection devices. The air chamber was composed of a cylindrical plexiglass tube and a conical bottom plate. The diameter of the glass tube was 600 mm, the height was 2000 mm, the slope of the conical bottom plate was 1:2, and the inner diameter of the outlet pipe of the conical bottom plate was 5 mm. Four loudspeakers were used to emit strong low-frequency acoustic waves. The loudspeakers were fixed above the air chamber, approximately 50 mm away from the top of the air chamber. A plastic film with good acoustic transmission was selected to isolate the top of the air chamber from the outside. The environmental water vapor sampling port was set at the centre of the air chamber, 200 mm away from the top of the air chamber. The input for the micro-droplets and the temperature and humidity sensors were fixed in the centre of the air chamber. A hole with a diameter of 100 mm was placed along the radial direction, 300 mm away from the bottom of the air chamber, which was used to observe the micro-droplet groups size. The laser-emitting end of the laser particle size analyser was placed 1800 mm away from the laser-receiving end. The vertical distance between the top of the water collecting beaker and the outlet of the conical bottom plate was 85 mm. After sedimentation of the micro-droplets was completed, the micro-droplets flowed out of the air chamber through the conical bottom plate and entered the beaker. The hydrogen and oxygen isotope values of the water retained in the beaker were detected.
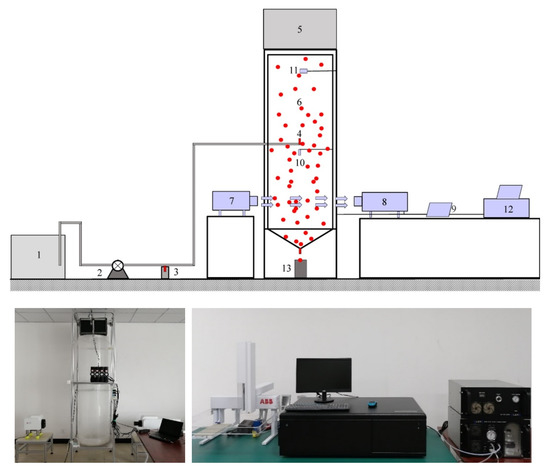
Figure 1.
Schematic and site photograph of the experimental device (1—water tank; 2—water pump; 3—the micro-droplets sample collection bottle; 4—nozzle; 5—acoustic generator; 6—air chamber; 7—laser-emitting end; 8—laser-receiving end; 9—data analysis computer; 10—temperature and humidity sensors; 11—environmental water vapor sampling port; 12—water vapor isotope analyser; and 13—beaker. The micro-droplets generation device included 1, 2, and 4; acoustic generator included 5 and 9; monitoring devices included 7–12; and water sample collection included 3 and 13).
In order to reduce the impact of adhesion micro-droplets at the wall on the isotope values of the micro-droplets, hydrophobic treatment was provided on the inner wall of the air chamber to maximise the number of micro-droplets rebounding after colliding with the wall, which reduced the size and quantity of the adhered micro-droplets. The treatment of the conical bottom plate accelerated the collection rate of the micro-droplets. For the very small micro-droplets adhering to the side wall, the annular groove of the conical bottom plate was used to separate the adhesive micro-droplets, which then entered the annular groove of the conical bottom plate and did not enter the beaker.
The temperature of the air chamber was approximately 25 °C and the relative humidity was 100% during the whole experiment. The maximum increments of temperature and relative humidity of laboratory were 1.4 °C and 10%, respectively. Using natural river water as the micro-droplet source, we collected 200 micro-droplet groups (samples) before and after the natural settlement and 200 samples before and after the acoustic field settlement. A total of 100 groups of control experiments were conducted.
2.1.1. Micro-Droplet Generation Device
The micro-droplet generation device mainly included a water tank, water pump, and nozzle. The water in the water tank was first pressurised by the water pump, and then entered the nozzle. The nozzle contained a wire mesh with a diameter of a millimetre. Different sizes of micro-droplets were generated by varying the mesh size. The particle size range used in this experiment was 4–149 μm, which covers the particle size range of cloud droplets [34]. Micro-droplets below 50 μm accounted for 92% of the total volume.
2.1.2. Acoustic Generator
The acoustic generator comprised four loudspeakers and an audio distributor. The acoustic signal was distributed to the four loudspeakers through an audio distributor to generate the same source of acoustic waves. In this experiment, the frequency of the acoustic waves was 100 Hz, the average SPL in the air chamber was 124 dB, the acoustic field in the air chamber was a plane acoustic field, the SPL had a symmetrical plane [24], and the acoustic field in the air chamber was assumed to be a plane standing wave field.
2.1.3. Monitoring Devices
The monitoring devices included a particle size monitoring device and an environmental water vapor isotope monitoring device. A laser particle size analyser (Winner319, Jinan, China) was used to measure the micro-droplet groups’ size distribution and comprised a laser-emitting end, laser-receiving end, and computer for data analysis. The sampling frequency was set to 1 s. The observed particle size range was 1–500 μm. Before the experiment, calibration was completed with a standard solution to ensure that the measurement and repetition errors of the instrument were less than 3%. The droplet size observed by the laser particle size analyser was the same as that in the original field of the air chamber, and the observation equipment had no effect on the process of micro-droplet group agglomeration. A GLA431-TIWA (Quebec, QC, Canada) liquid water and water vapor isotope analyser was used to monitor the environmental water vapor isotope. The off-axis integrated cavity output spectroscopy (OA-ICOS) laser spectrum analysis technology was used to measure hydrogen and oxygen isotope values, and the analysis accuracies of water vapor for δ18O and δD were 0.15‰ and 0.5‰, respectively. To eliminate measurement errors caused by the time drift and concentration gradient, the standard water vapor source was measured once every 10 h.
2.2. Experimental Process and Sample Collection
An alternating natural settlement–acoustic field settlement cycle was adopted for the experiment. During the entire experiment, micro-droplets were continuously input, the laser particle size analyser was first debugged to the observation state, the temperature and humidity sensors and water vapor isotope analyser were turned on, and then the micro-droplet generator was turned on. When the relative humidity of the air chamber reached the saturation state, the laser particle size analyser initiated continuous real-time monitoring of particle size. Water samples were simultaneously collected and the process lasted for 300 s. The collected water was loaded into a 10 mL bottle for sample retention, the sample number was pasted and recorded, and the remaining water collected was not returned to the water tank. Subsequently, the sample bottle and beaker were replaced, the acoustic generator was turned on, and the experiment was repeated.
2.3. Data and Analysis Method
2.3.1. Isotopes Data
A liquid water and water vapor isotope analyser (model GLA431-TIWA, Quebec, QC, Canada) was used for detecting isotopes of water with accuracies of 0.02‰ and 0.15‰ for δ18O and δD, respectively. During the measurement, 7 needles were measured for each sample, the average value of the last 4 needles was taken as the isotope value, and the measured injection volume data of the last 4 needles fluctuated within 3% as valid data, otherwise the sample should be re-measured. In order to ensure the accuracy of the measurement data, we selected 3 standard samples (3E, 4E and 5E), and the standard sample isotope value range covers the sample isotope value range. After every 3 samples measured, 1 standard sample is measured. The test result is relative to the standard mean ocean water value [26].
where δ is the isotopic composition (‰), Rsa represents the isotopic ratio of the tested samples, and Rsm is the isotopic ratio of a standard sample. The isotope ratio was calculated using Equation (6).
where [X*] and [X] represent the mole number of rare and abundant isotopes of an element, respectively. For stable isotopes in water, these values were estimated as: 2RW = [2HOH]/[H2O], 18RW = [H218O]/[H2O], respectively.
2.3.2. Significance Test Method
The significance level of the influence of acoustic waves on isotope values was analysed using ANOVA [35].
where F is the calculated value. When the calculated value is greater than its critical value (F > Fα(s − 1, n − s)), the significance level of the acoustic wave effect is α; SA and SE represent the square sum of the influencing factors and the experimental error, respectively; fA and fE represent the degrees of freedom of the influencing factors and the experimental error, respectively; represents the average value of the experimental data at the jth level of influencing factors; represents the ith experimental value at the jth level; represents the average value of the total experimental data; s is the level number of the influencing factors; nj is the number of experiments at the jth level; and n is the total number of experiments.
3. Experimental Results and Analysis
3.1. Effects of Acoustic Waves on D90
Average temporal changes in the characteristic particle size (D90) of the micro-droplet groups are shown in Figure 2a. There was a “trigger effect” of D90 with alternating acoustic waves. Thus, when the acoustic waves were turned on, D90 increased with time and then stabilised, and when the acoustic device was turned off, D90 decreased with time and then stabilised. The response of the micro-droplet groups to the acoustic waves can be divided into three stages: the main response period, secondary response period, and dynamic equilibrium period. Within the first 21 s of acoustic operation being on and off, the D90 increments were 20.98 and −10.45 μm, respectively, and the growth rates were 1.00 and −0.50 μm/s, respectively. The secondary response period spanned 21–109 s. During this period, D90 increased slightly by 6.92 and −12.18 μm, respectively, and the growth rates were only 0.08 and −0.16 μm/s, respectively. After 109 s of the process with and without acoustic waves, the D90 of the micro-droplet groups stabilised, and there were no further size variations.
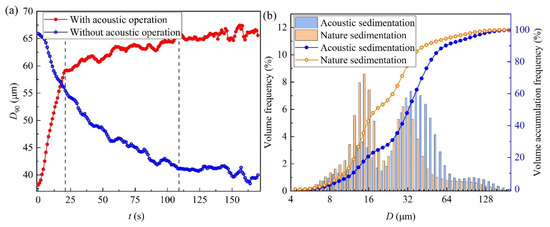
Figure 2.
(a) Variations in D90 and (b) micro-droplets size spectrum and its cumulative frequency.
3.2. Effects of Acoustic Waves on Size Spectrum
Figure 2b represents the averaged size spectrum and corresponding volume cumulative frequency spectrum of micro-droplets under natural sedimentation and acoustic field sedimentation. The number of control groups was 100, with 300 data points in each group. The peak of the size spectrum positively shifted with increasing particle size and spectrum width. The size spectrum under natural sedimentation had a bimodal distribution with peak values of 14 and 31 μm. The size spectrum width was 145 μm, and the droplet size was concentrated in the range of 4–149 μm. For cases with acoustic application, the particle size was mainly distributed in the range of 4–177 μm, with peak sizes of 14 and 34 μm. The volume frequency of the small-diameter particles decreased, whereas that of the large-diameter particles increased after the action of the acoustic waves. The volume frequency of micro-droplets smaller than 29 μm decreased by 30%. The acoustic waves only reduced and transferred the peak volume percentage, but did not change the peak shape.
3.3. Effects of Acoustic Waves on Isotopes Exchange
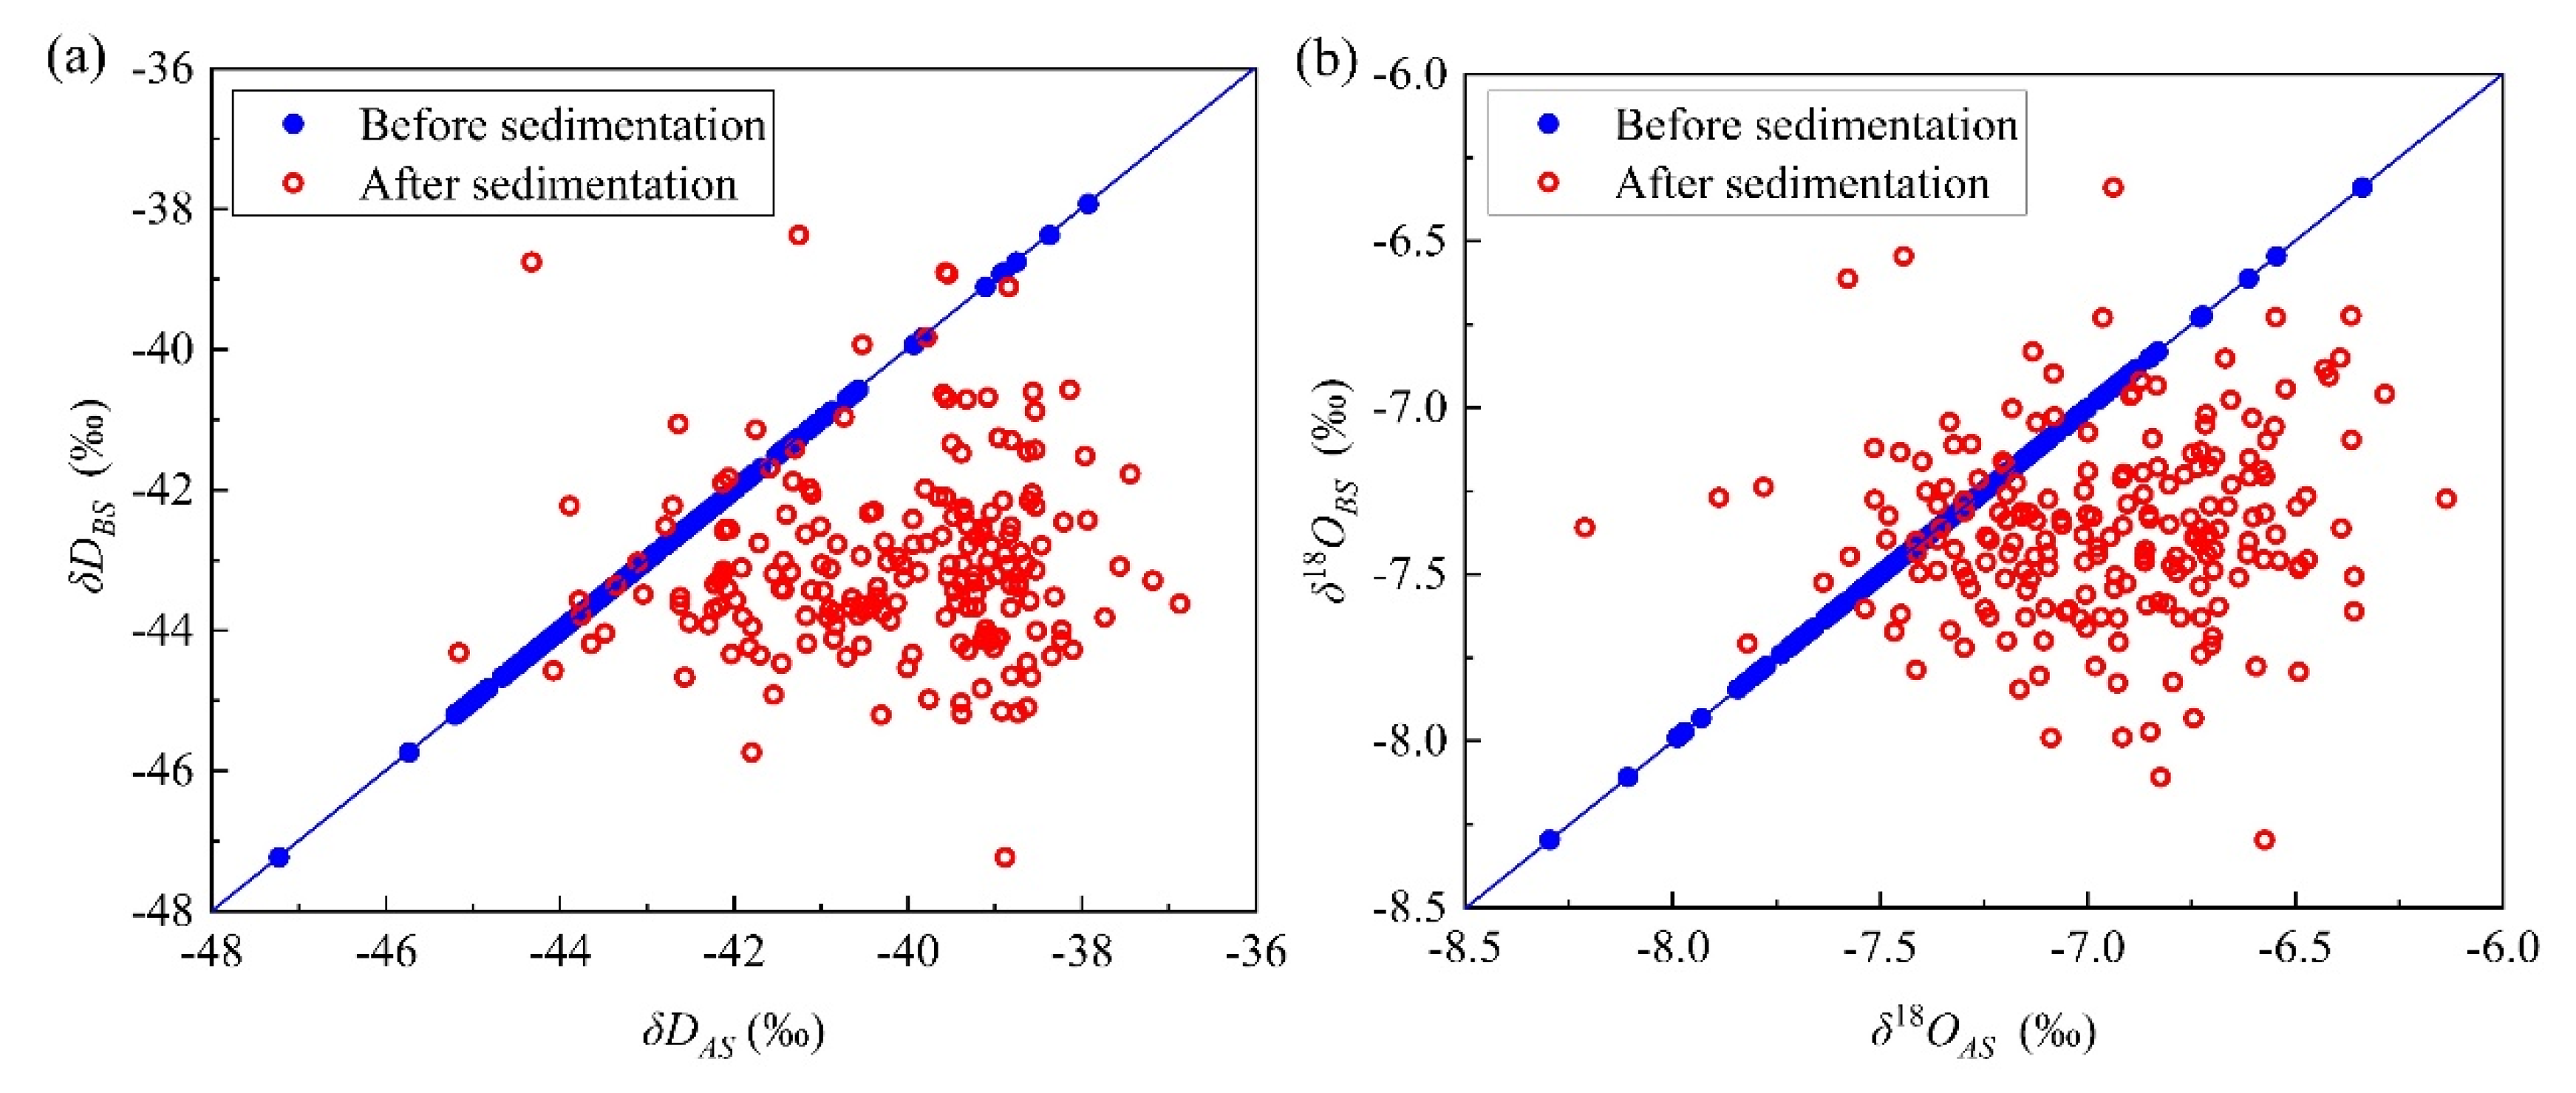
The variations in hydrogen and oxygen isotopes before and after micro-droplet group sedimentation are presented in Figure 3. The δD and δ18O values showed an increasing trend, and the increase in δD values was larger than that of δ18O. This is because the molecular weight of HDO is smaller than that of H218O, and its molecular activity is more intense. The average values of δD and δ18O before sedimentation were −43.03‰ and −7.36‰, respectively. The corresponding ranges for δD and δ18O were −47.23 to −37.93‰ and −8.30 to −6.34‰, respectively. After air chamber sedimentation, the average values of δD and δ18O increased by 2.81‰ and 0.40‰, respectively.

Figure 3.
(a) Relationships of δD before and after micro-droplet groups’ settlement and (b) relationships of δ18O before and after settlement.
Isotope exchange occurred between micro-droplets and environmental water vapor in the air chamber during the sedimentation process, resulting in the hydrogen and oxygen isotopic values increasing after sedimentation. In this study, the total input mass of the micro-droplets in the air chamber was 21,511 g, the total amount of water collected was 20,208 g, the water closure error was −1303 g, and the relative error of the collected water was only 6%. The total duration of the experiment was 60,000 s, and the average water loss rate was only 0.02 g/s. The micro-droplets were generally conserved in the sedimentation process, excluding small micro-droplets that adhered to the inner wall and those that escaped from the particle size observation window. Therefore, the isotopes of the micro-droplets must have been exchanged with those of the environmental water vapor of the air chamber, resulting in a large number of heavy isotope molecules in the micro-droplets. Thus, the δD and δ18O values increased after deposition, which is consistent with observations in previous studies [27,28].
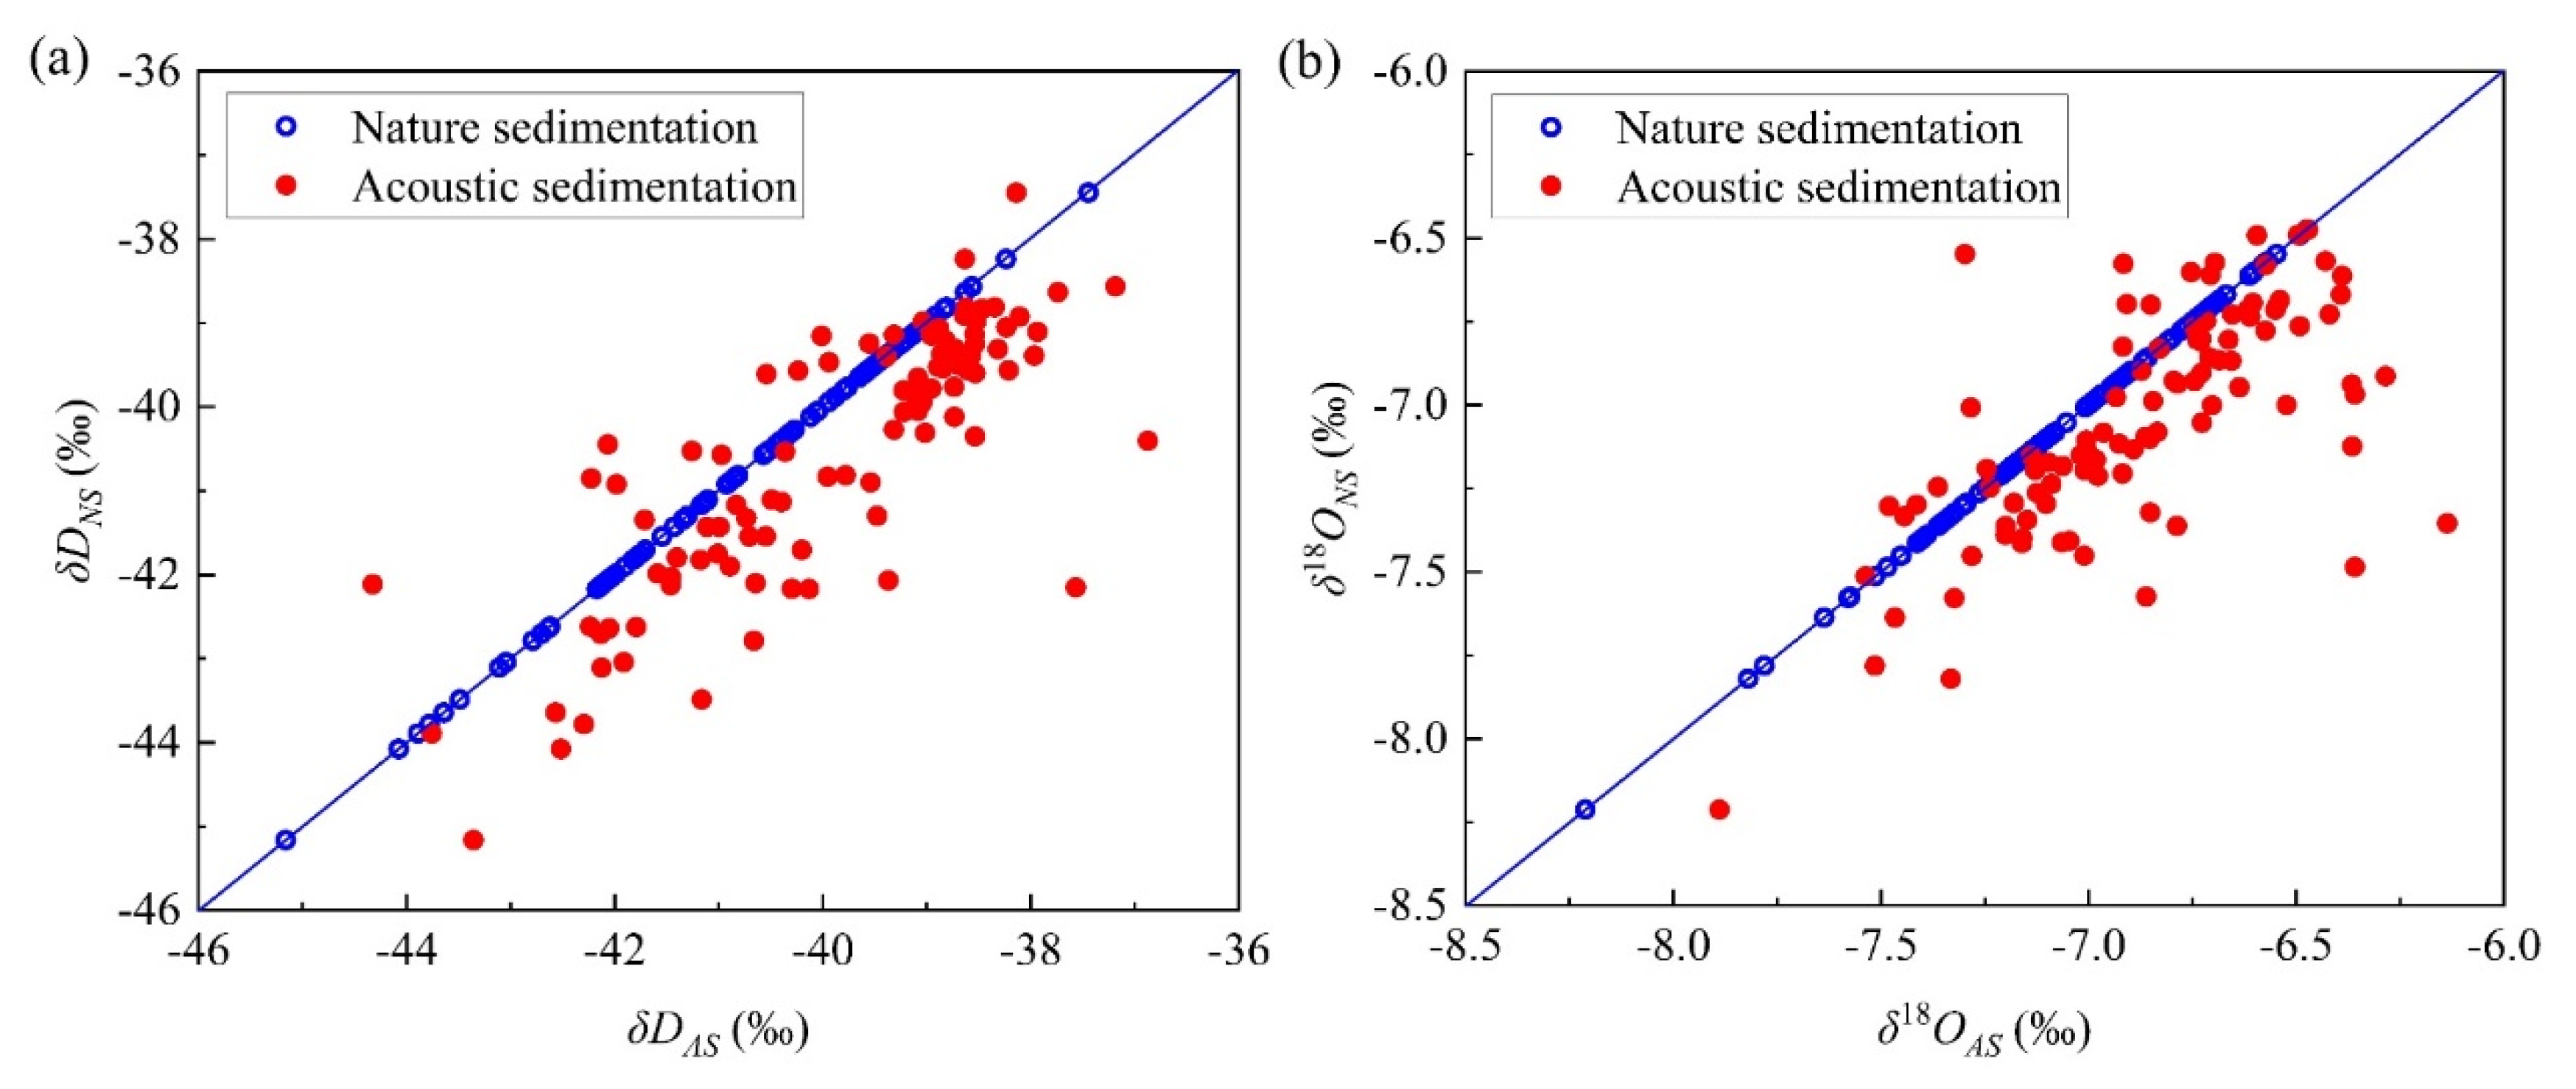
A comparison between hydrogen and oxygen isotope values of the micro-droplet groups with an acoustic field sedimentation and natural sedimentation is shown in Figure 4. The hydrogen and oxygen isotopic values showed a significant increasing trend. The δD value increment was larger than that of δ18O. For natural sedimentation conditions, δD values ranged between −45.16‰ and −37.44‰, with an average value of −40.57‰. The δ18O values ranged from −8.21‰ to −6.47‰, and were concentrated near −7.05‰. For acoustic sedimentation conditions, the δD and δ18O values increased by 0.69‰ and 0.17‰ on average, respectively, after being exposed to acoustic waves. The significance level of the influence of acoustic waves on the hydrogen and oxygen isotopes exchange exceeded 0.01 (Table 1).
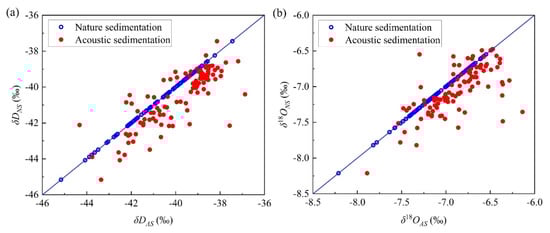
Figure 4.
Comparison of (a) δD and (b) δ18O values of the micro-droplet groups with different deposition conditions.

Table 1.
Significant test results.
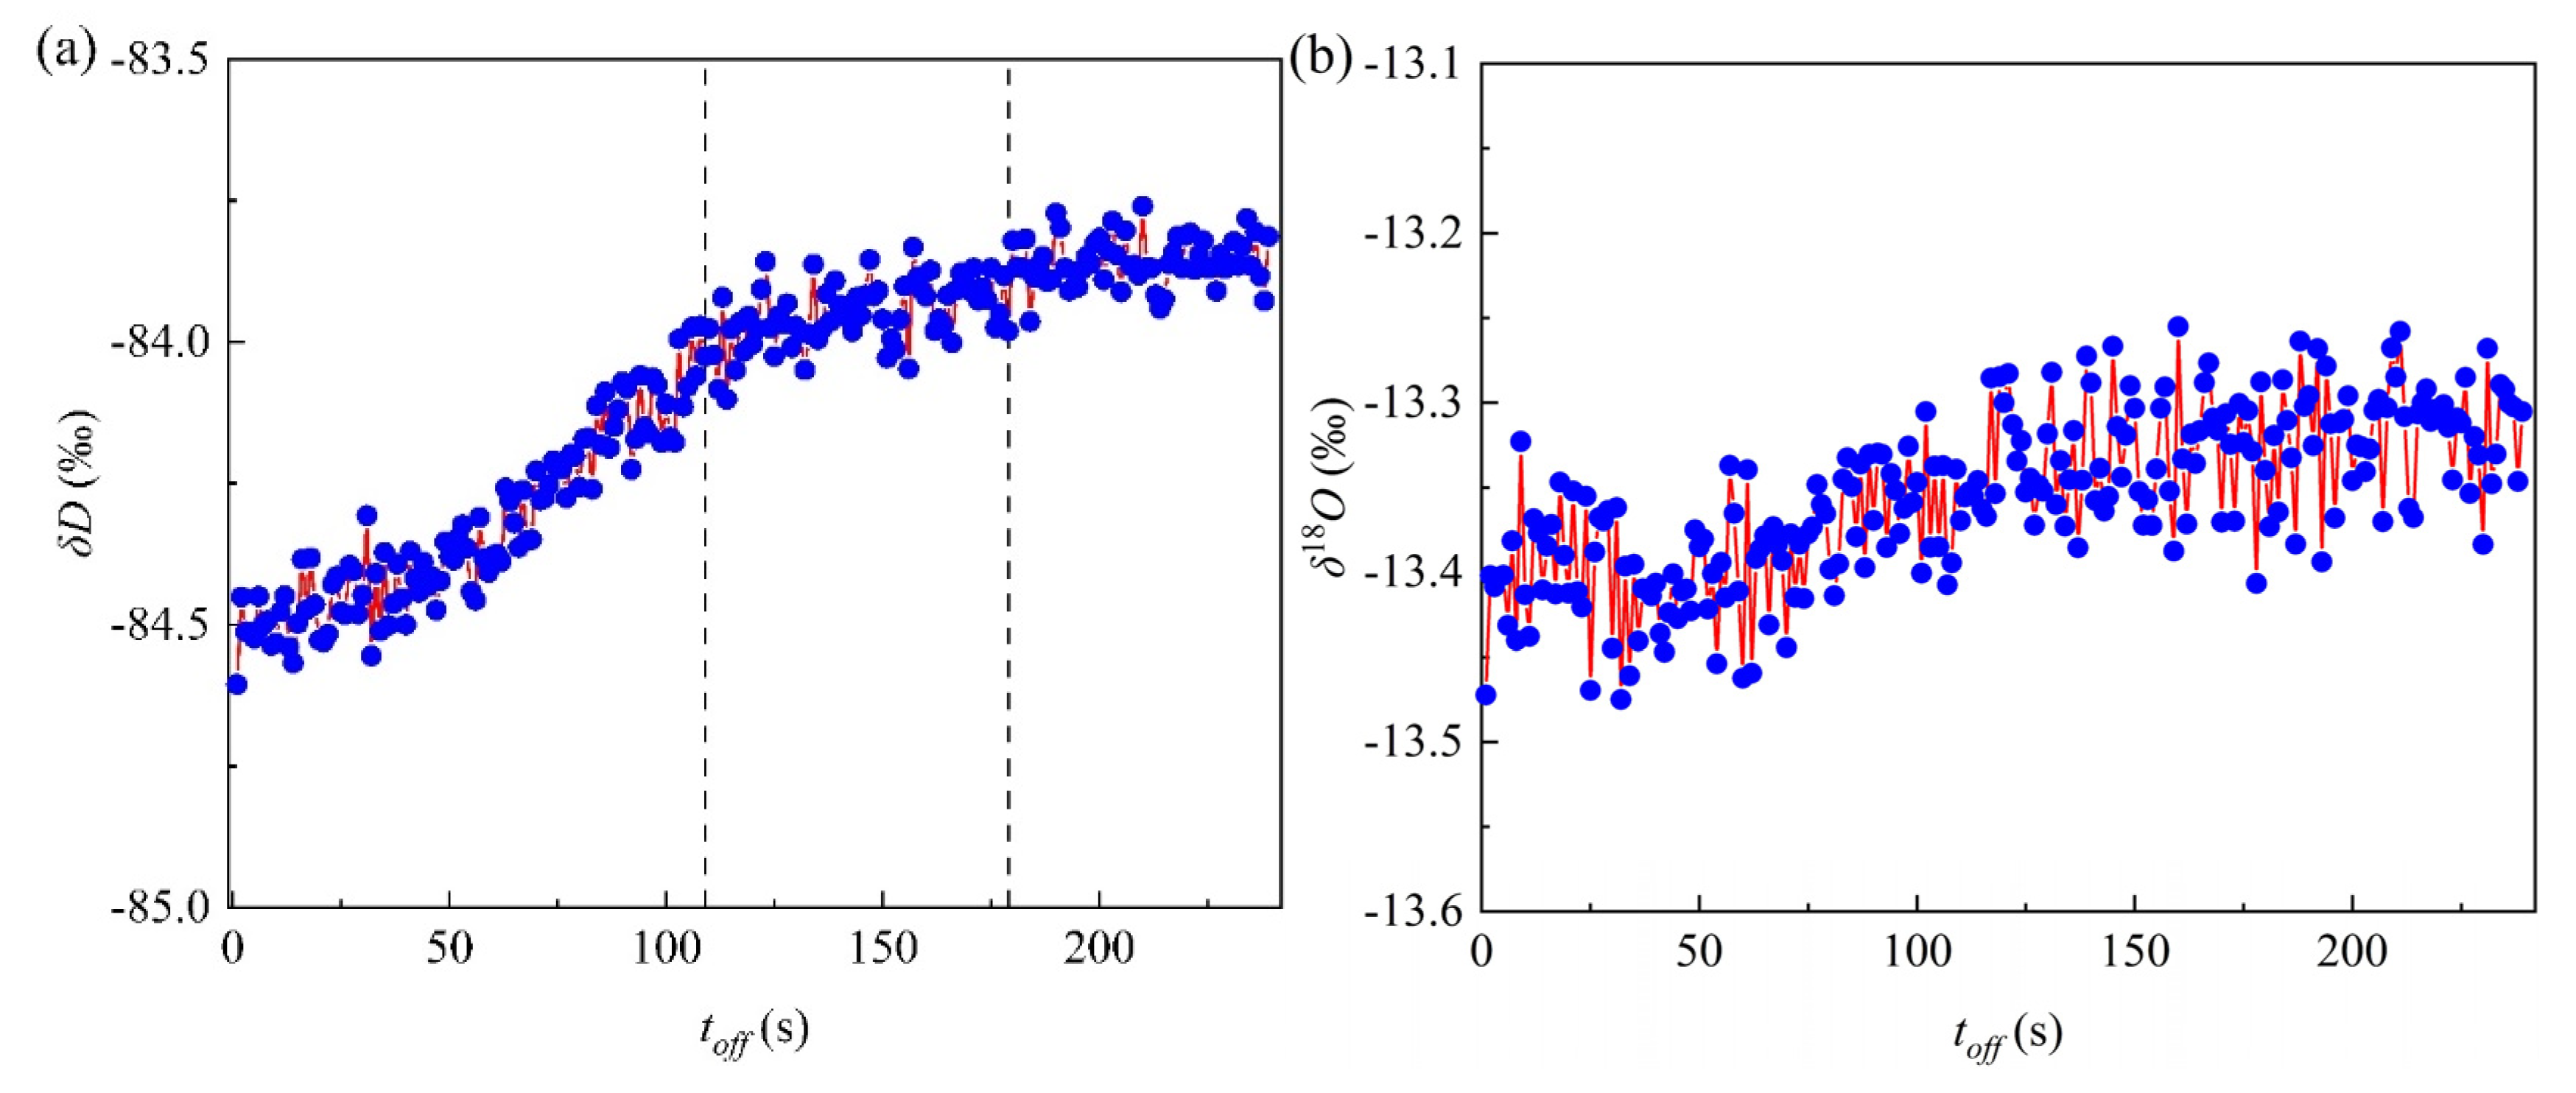
The isotope values of the environmental water vapor were also influenced by acoustic waves, and the temporal variations in δD and δ18O of environmental water vapor of 93 control groups were statistically analysed after stopping the acoustic waves (Figure 5). The isotope values of the environmental water vapor first increased and then stabilised with time when the acoustic waves were stopped. Isotope values of the environmental water vapor in the air chamber were influenced by the exchange rate, exchange surface area, and exchange state (equilibrium state or unbalanced state). As the surface area of the micro-droplet groups changed under acoustic operation, the isotope exchange balance was affected by the external energy of the acoustic waves. After the acoustic devices were stopped, the energy of the air chamber system decreased, and the equilibrium of isotope exchange on the acoustic field sedimentation condition was broken. Within the first 109 s of stopping the acoustic devices, the surface area of the micro-droplet groups increased, but the isotope exchange rate decreased. Thus, the δD of environmental water vapor increased gradually owing to the destruction of the equilibrium exchange state and the decrease in the exchange rate. Between 109–179 s, the variation in micro-droplet size stabilised, and the surface area and the δD of water vapor changed slightly. After stopping the acoustic operation for approximately 179 s, the equilibrium exchange between the micro-droplets and environmental water vapor was re-established, and the isotope exchange reached a dynamic equilibrium.
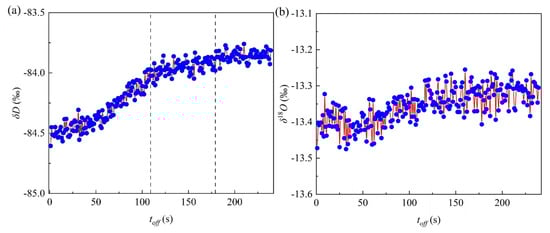
Figure 5.
The (a) δD and (b) δ18O value temporal variations in environmental water vapor after the acoustic waves operation was stopped.
The environmental water vapor isotope values increased without acoustic wave operation. The average values of δD and δ18O of environmental water vapor under natural sedimentation were −84.32‰ and −13.33‰, respectively, and −84.44‰ and −13.37‰ under acoustic field sedimentation, respectively. After the acoustic wave action, the δD and δ18O values decreased by 0.12‰ and 0.04‰, respectively, with a reduction ratio of 3, which is close to the increment ratio of 4 for the micro-droplet groups (δD increased by 0.69‰ and δ18O increased by 0.17‰).
4. Discussion
4.1. Linear Fitting Relationship between δD and δ18O Values before and after Sedimentation and Its d Change
The linear relationship between the hydrogen and oxygen isotope values before and after the sedimentation of the micro-droplet groups is shown in Figure 6a. It was observed that the slope (k) and intercept (b) of the linear relationship increased after the air chamber sedimentation. Before sedimentation of the micro-droplet groups, the linear relationship was δD = (3.10 ± 0.26) δ18O+ (−20.21 ± 1.92) (R2 = 0.42, N = 200). After sedimentation, the linear relationship was δD = (3.80 ± 0.19) δ18O + (−13.76 ± 1.33) (R2 = 0.67, N = 200). The linear relationship changed after sedimentation. According to the process of isotope exchange and its corresponding molecular types, assuming that the exchange process was a single-molecule exchange, the exchange rate of HDO was greater than that of H218O, and the intercept (b) increased, which indicated that there was dynamic fractionation in the process of air chamber sedimentation [26].
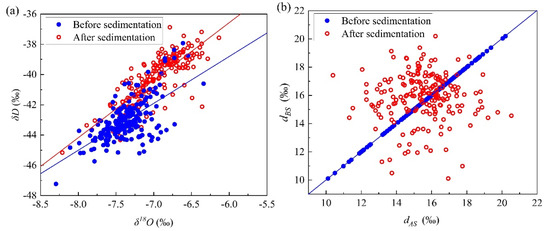
Figure 6.
(a) Variation in linear fitting relationship between δD and δ18O and (b) d value before and after micro-droplet groups deposition.
The variation in the d values before and after sedimentation is shown in Figure 6b, where the d values of the micro-droplet groups fluctuated after sedimentation, but the average value decreased. The average values of d before and after settlement were 15.88‰ and 15.48‰, respectively, which decreased by 0.40‰ after sedimentation. The d value is sensitive to the relative humidity of water vapors and is related to isotope exchange [26]. As presented in Section 3.3, the average increments of δD and δ18O were 2.81‰ and 0.40‰, respectively, after air chamber sedimentation, and the increment ratio was 7:1, which is less than 8:1, leading to a decrease in the d value of the micro-droplet groups.
4.2. Influence of Acoustic Waves on Particle Number and Surface Area of the Micro-Droplet Groups
The particle number and surface area of the micro-droplet groups are key parameters of isotope exchange between the micro-droplet groups and environmental water vapors. The volume distribution was determined using a laser particle size analyser. The number distribution of the droplets can be calculated as follows:
where N(Di) represents the number of micro-droplets with diameter Di (absolute value), and V(Di) represents the volume of micro-droplet with diameter Di (absolute value). The total micro-droplet number (Kd) can be obtained as shown below.
where ρ is the density of the micro-droplets and ki is the particle number proportion of Di.
The surface area of the micro-droplet groups is:
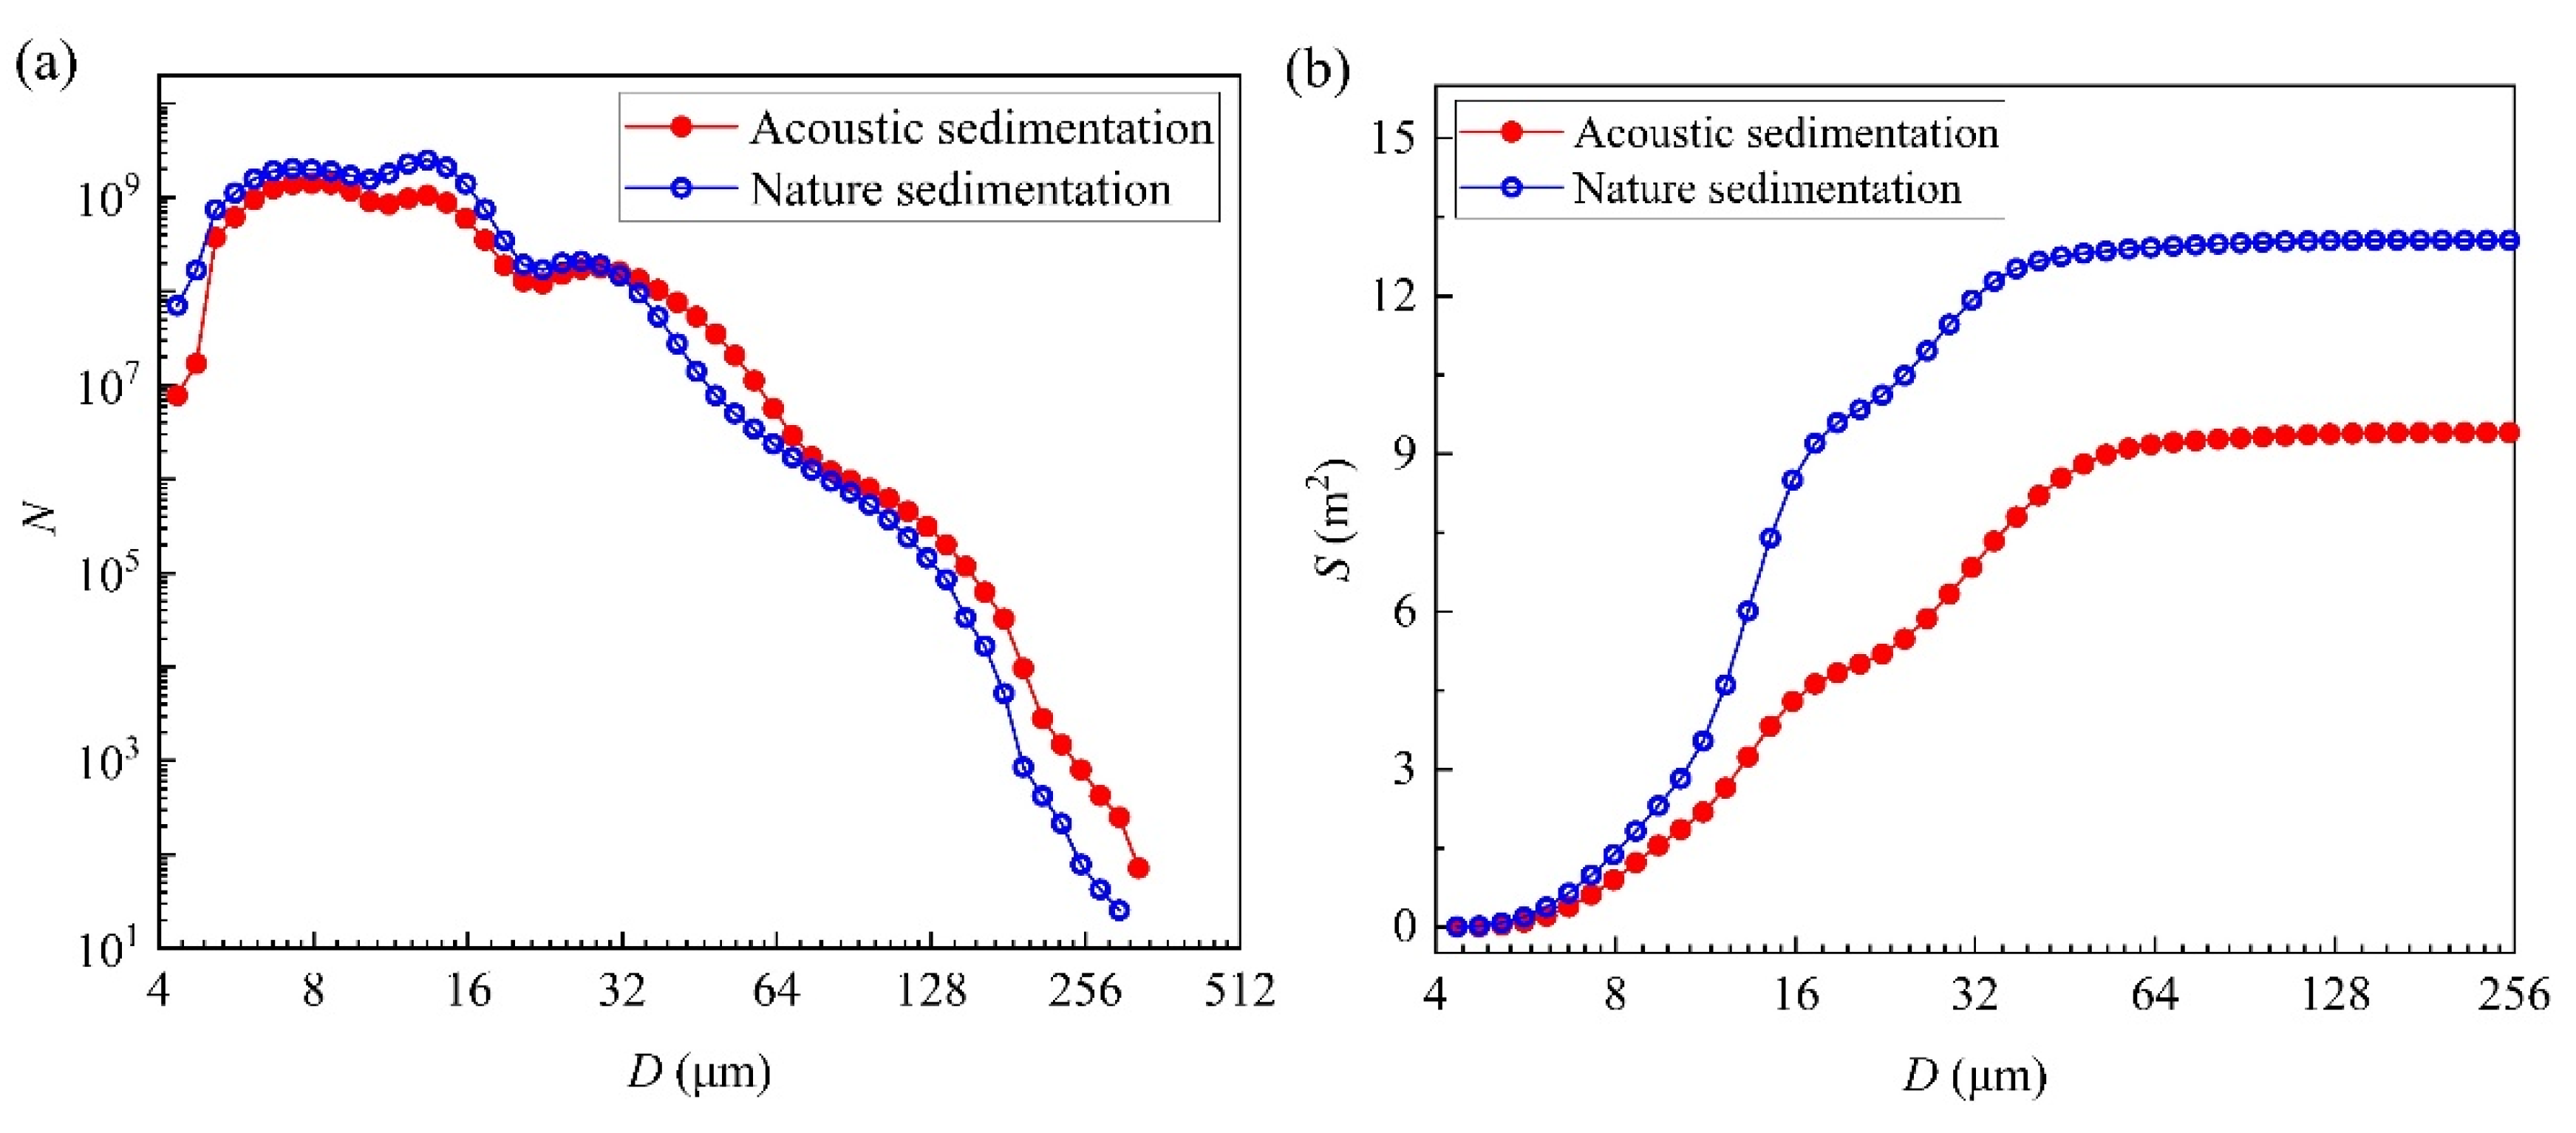
The micro-droplets input in the experiment was 0.36 g/s, and the sedimentation time was approximately 109 s. The distribution curve of the particle number and cumulative curve of the surface area are shown in Figure 7a,b, respectively. The smaller sizes dominated, and the number of droplets decreased with the increase in particle size, particularly for larger droplets (D > 64 μm). During the acoustic operation, the number of relatively smaller droplets (D < 29 μm) decreased, whereas that of larger droplets increased (D > 29 μm). After the action of acoustic waves, the number of smaller and larger droplets varied significantly, indicating that the acoustic waves caused the relatively smaller droplets to collide, agglomerate, and generate larger droplets [14,15,16,17]. As shown in Figure 7b, the surface area of the micro-droplet groups on the acoustic field settlement and natural settlement conditions were 9.41 and 13.06 m2, respectively, and decreased by 3.65 m2 after being exposed to the acoustic waves. As mentioned in Section 3.3, although the acoustic waves caused the contact area between the micro-droplet groups and environmental water vapor to decrease by 3.65 m2, the exchange rate of isotopes increased, resulting in an average increase of 0.69‰ for δD and 0.17‰ for δ18O.
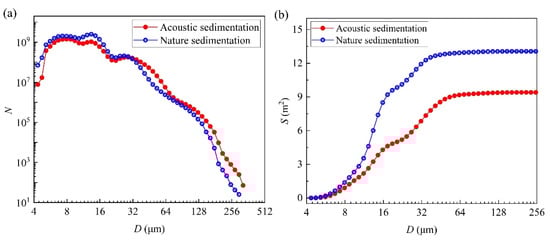
Figure 7.
(a) Curve of the micro-droplet group numbers and (b) their cumulative surface area.
4.3. Theoretical Calculation and Analysis of Isotope Exchange
4.3.1. Isotope Exchange Equation
The isotope exchange equation was established between the micro-droplet groups and environmental water vapor to explain the phenomenon of isotope exchange. The following assumptions were made:
- (1)
- The composition types of water molecules in the micro-droplets and environmental water vapor are H2O, HDO, and H218O, and there are no other types of water molecules.
- (2)
- The isotope exchange between the micro-droplets and the environmental water vapor is equal to the molecular exchange, and the influence of the increase in heavy molecule content on the mass of micro-droplets is negligible.
- (3)
- The initial isotopic values of the micro-droplets with different particle sizes are the same.
- (4)
- The air temperature and saturated water content in the air chamber remain unchanged.
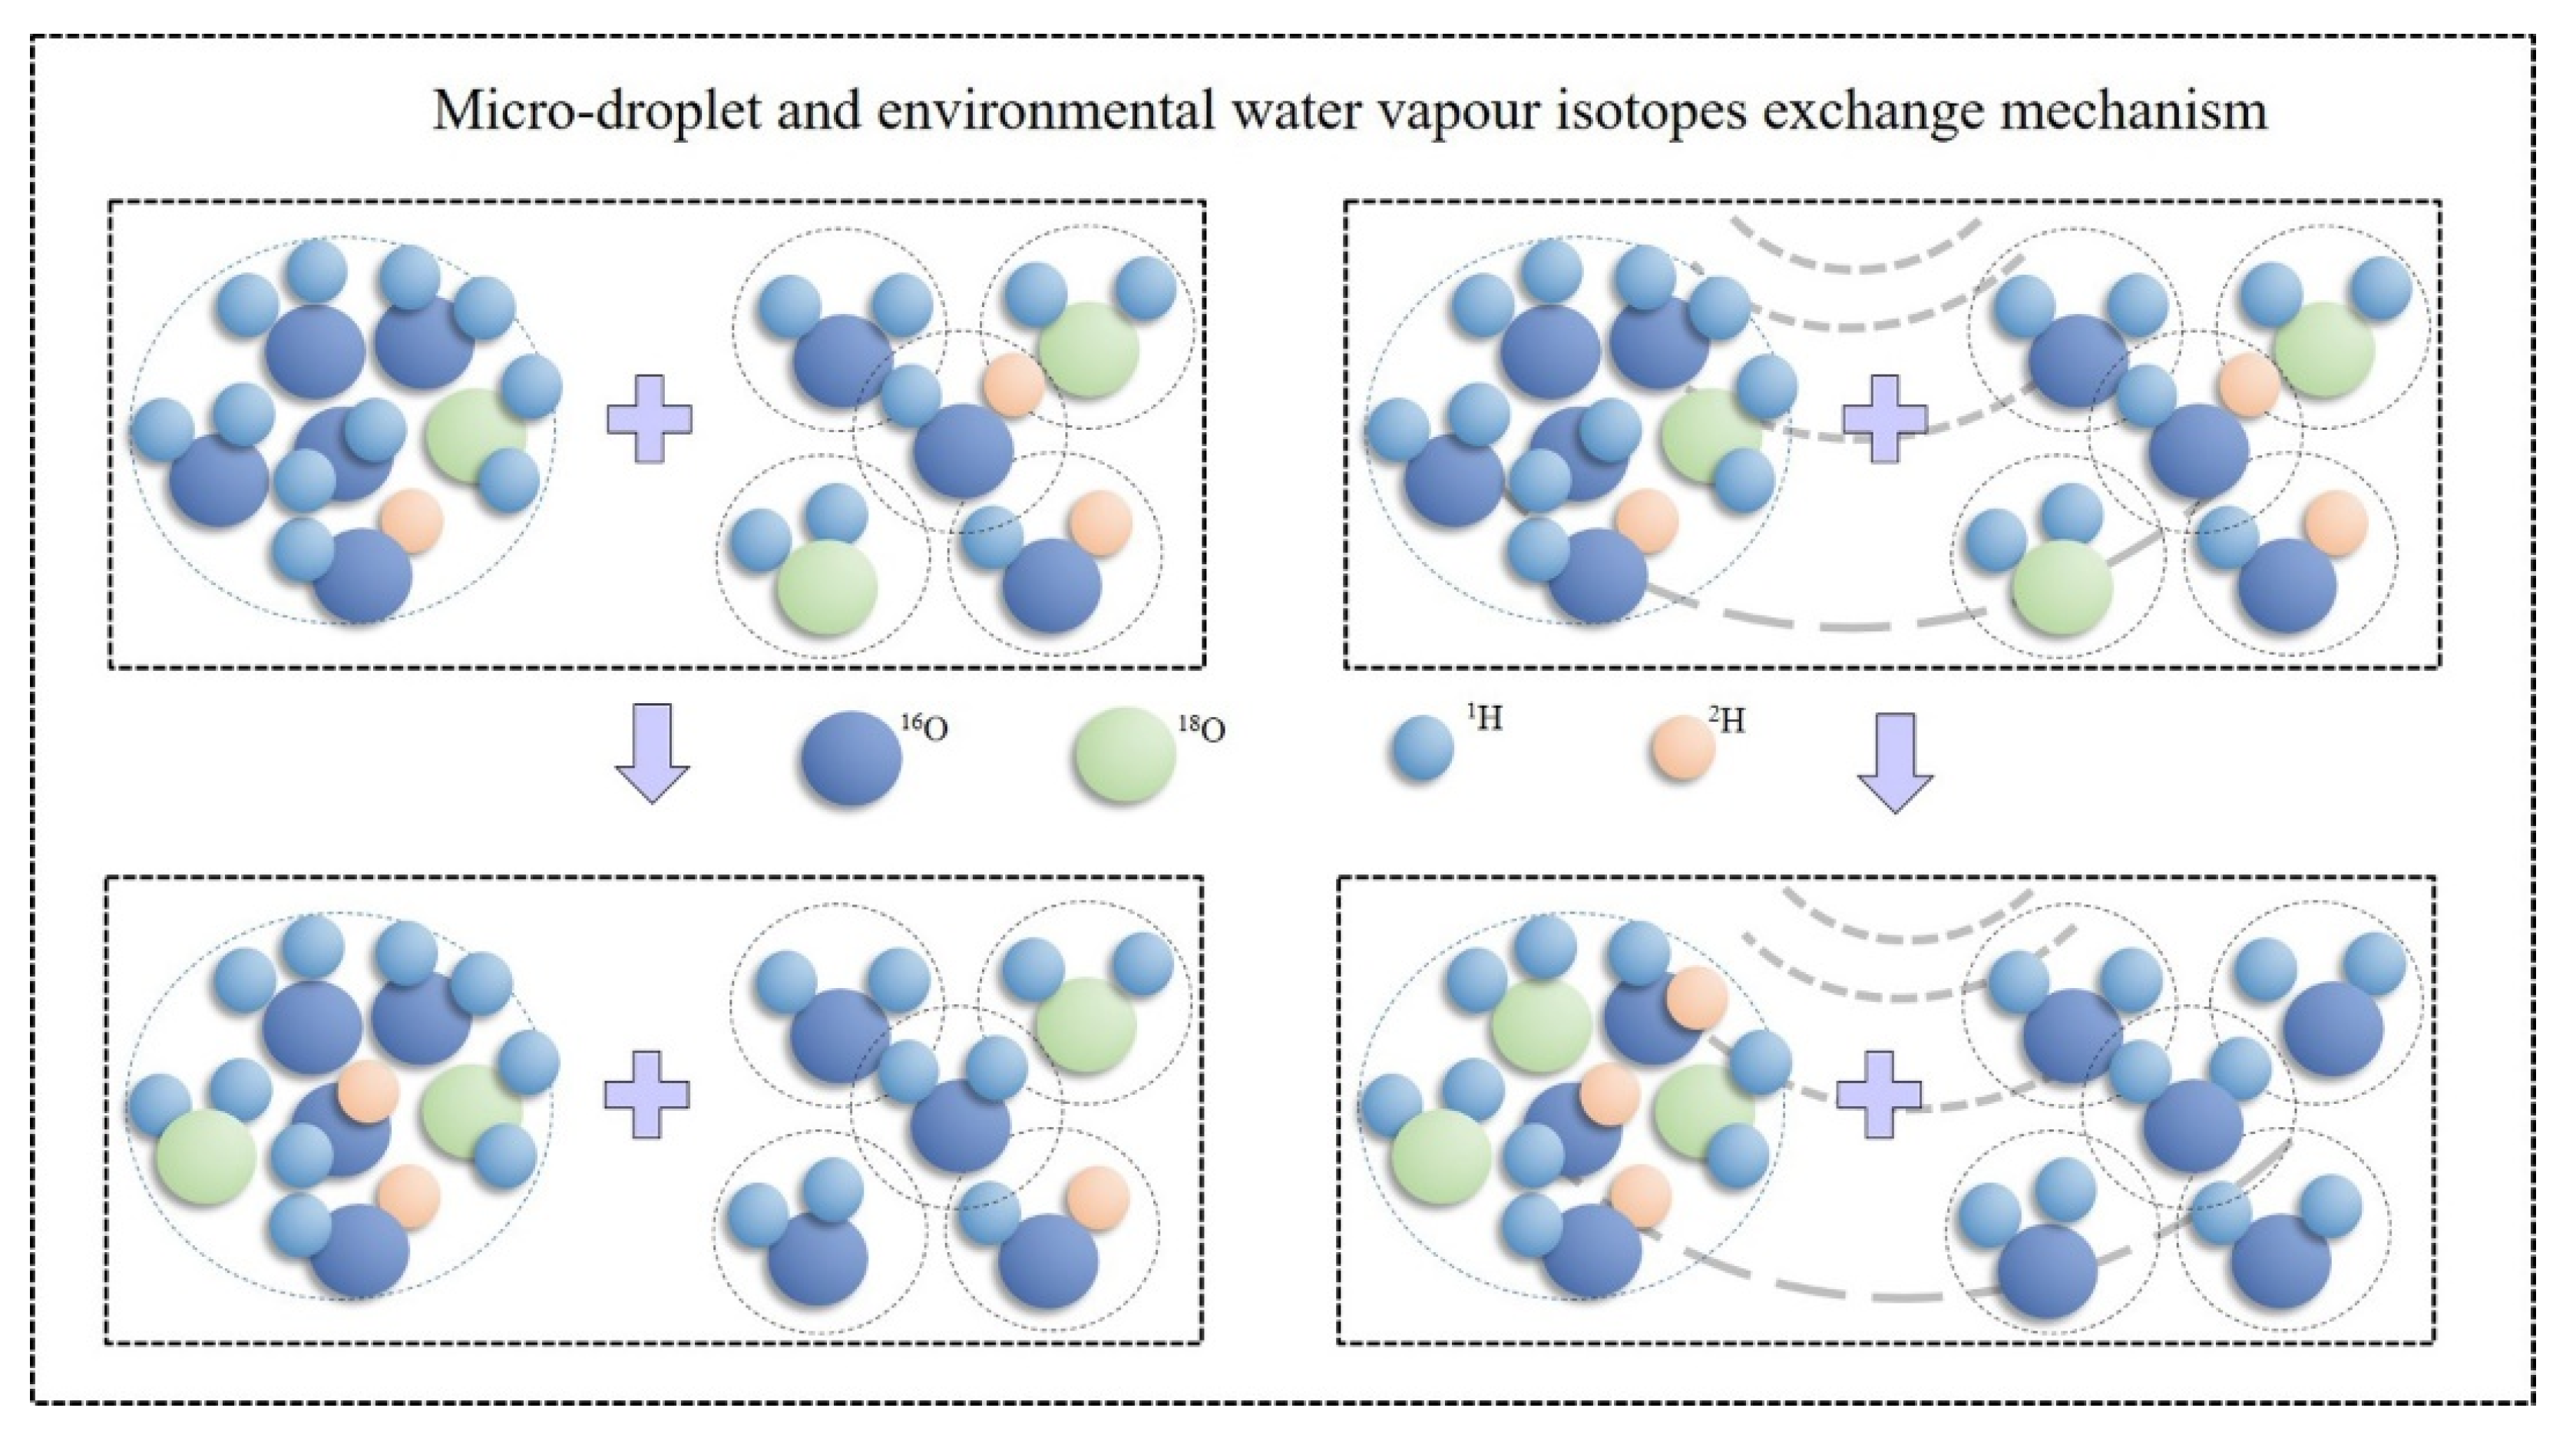
As shown in Figure 8, the isotope exchange process between the micro-droplet groups and environmental water vapor is a dynamic and equal exchange process. Lighter molecules are relatively more active and tend to remain in the gas phase, whereas heavier molecules are inactive and tend to remain in the liquid phase, and acoustic waves can accelerate exchange rate. Therefore, lighter molecules are continuously lost and heavier molecules are captured during the exchange process, resulting in an increase in the heavy isotope content of the micro-droplets.
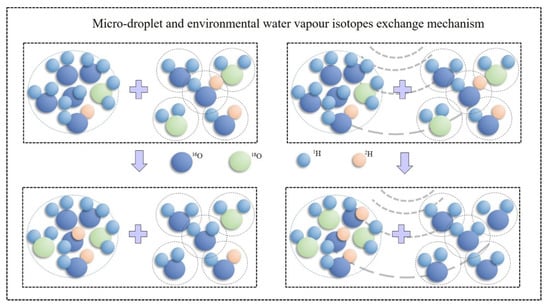
Figure 8.
Schematic diagram of isotope exchange processes between the micro-droplet groups and environment water vapor.
Let m′, mH′, and mO′ denote the mass of H2O, HDO, and H218O molecules, respectively, in a droplet entering the air chamber. Then, the total mass is:
If the mass of H2O, HDO, and H218O molecules in the droplet after sedimentation and accumulation in the conical bottom plate is m, mH, and mO, respectively, then:
According to the conservation of mass:
As a result, we obtain the following:
According to the isotope ratio, the following equation is obtained:
where mw* and mw represent the mass of rare and abundant isotope molecules in water, respectively, Mw* and Mw represent the molar mass of the rare and abundant isotope molecules in water, respectively, and Rr is the isotopic ratio of the standard mean ocean water. Equation (17) was first multiplied by m′H/mH and m′O/mO, and then combined with Equation (18) to obtain the following equations.
where δD′ and δD are the stable isotopic compositions of the 2H elements of the droplet before and after deposition, respectively, δ18O′ and δ18O are stable isotopic compositions of 18O elements of the droplet before and after deposition (‰), respectively, and RH and RO are the hydrogen and oxygen isotope ratios of the standard mean ocean water, which are (2005.2 ± 0.45) × 10−6 and (155.6 ± 0.12) × 10−6, respectively. By omitting the higher-order infinitesimal, Equations (19) and (20) can be simplified as follows.
In the process of isotope exchange between the droplet and environmental water vapor, the mass loss of conventional water molecules satisfies the following equation [27,28].
where r is the radius of the droplet, ρd is the density of the water vapor on the droplet surface, ρe is the water vapor density of the environment, β is the diffusion coefficient of the light molecules, γ is related to the droplet diameter, and λ is the coefficient calculated using the following formula:
where ε is the ventilation coefficient (usually between 0.8 and 2.2) and v is the droplet velocity. The time rate of change in Equations (21) and (22) was calculated, with Equation (23) replacing the parameters with those of the heavy isotopes and then substituted in, resulting in the following equations.
where ρd19 and ρd20 are the densities of HDO and H218O on the droplet surface, respectively, ρe19 and ρe20 are the densities of HDO and H218O of the environmental water vapor, respectively, and β19 and β20 are the diffusion coefficients of the HDO and H218O molecules, respectively.
As it is difficult to measure the mass of heavy isotope molecules, Equation (18) was transformed and substituted in Equations (25) and (26), and the results are as follows.
As the molecular density of heavy isotopes on the surface of droplet and environmental water vapor is difficult to measure, they were characterised by saturated water vapor density and isotope ratio [28] in combination with Equations (27) and (28). The equations for calculating the isotope value of droplet after air chamber sedimentation were obtained as follows.
where ρs is the saturated water vapor density of the environmental water vapor in the air chamber, δDdp and δ18Odp are the hydrogen and oxygen isotope values of the droplet, respectively, and δDen and δ18Oen are the hydrogen and oxygen isotope values of environmental water vapor, respectively.
For a single droplet, the isotope value of the air chamber after sedimentation can be obtained as follows.
where t is the settling time of the droplet in the air chamber, dδ/dt can be calculated using Equation (29) or (30), and δBS can be calculated using Equation (31) by substituting the initial conditions.
As there are a large number of micro-droplets in the air chamber, the measured isotope values are the liquid water isotope values formed by the mixing of a large number of micro-droplets after the air chamber settles. Therefore, the isotope values of the micro-droplet groups after they settle in the air chamber are as follows.
where fi is the frequency of the volume of the droplet with radius ri, the sum of which is equal to 1. Equations (32) and (33) are the hydrogen and oxygen isotope exchange equations between the micro-droplet groups and the environmental water vapor of the air chamber, which can be used to calculate the hydrogen and oxygen isotope values of the micro-droplet groups after exchange.
4.3.2. Calculation Parameters
In Table 2, m is represented by the micro-droplets input recorded in the experiment. There is no measured value of the ventilation coefficient under different settlement conditions, and its value is between 0.8 and 2.2. To reflect different settlement conditions, the ventilation coefficient was taken as 2.0 for natural settlement and 2.2 for acoustic field settlement. The velocity (v) of the micro-droplet groups was calculated by dividing the settlement distance by the settlement time, which is given in Section 4.2. Other parameters can be obtained from the literature [28,36].
Table 2.
Calculation parameters.
4.3.3. Theoretical Calculation and Analysis
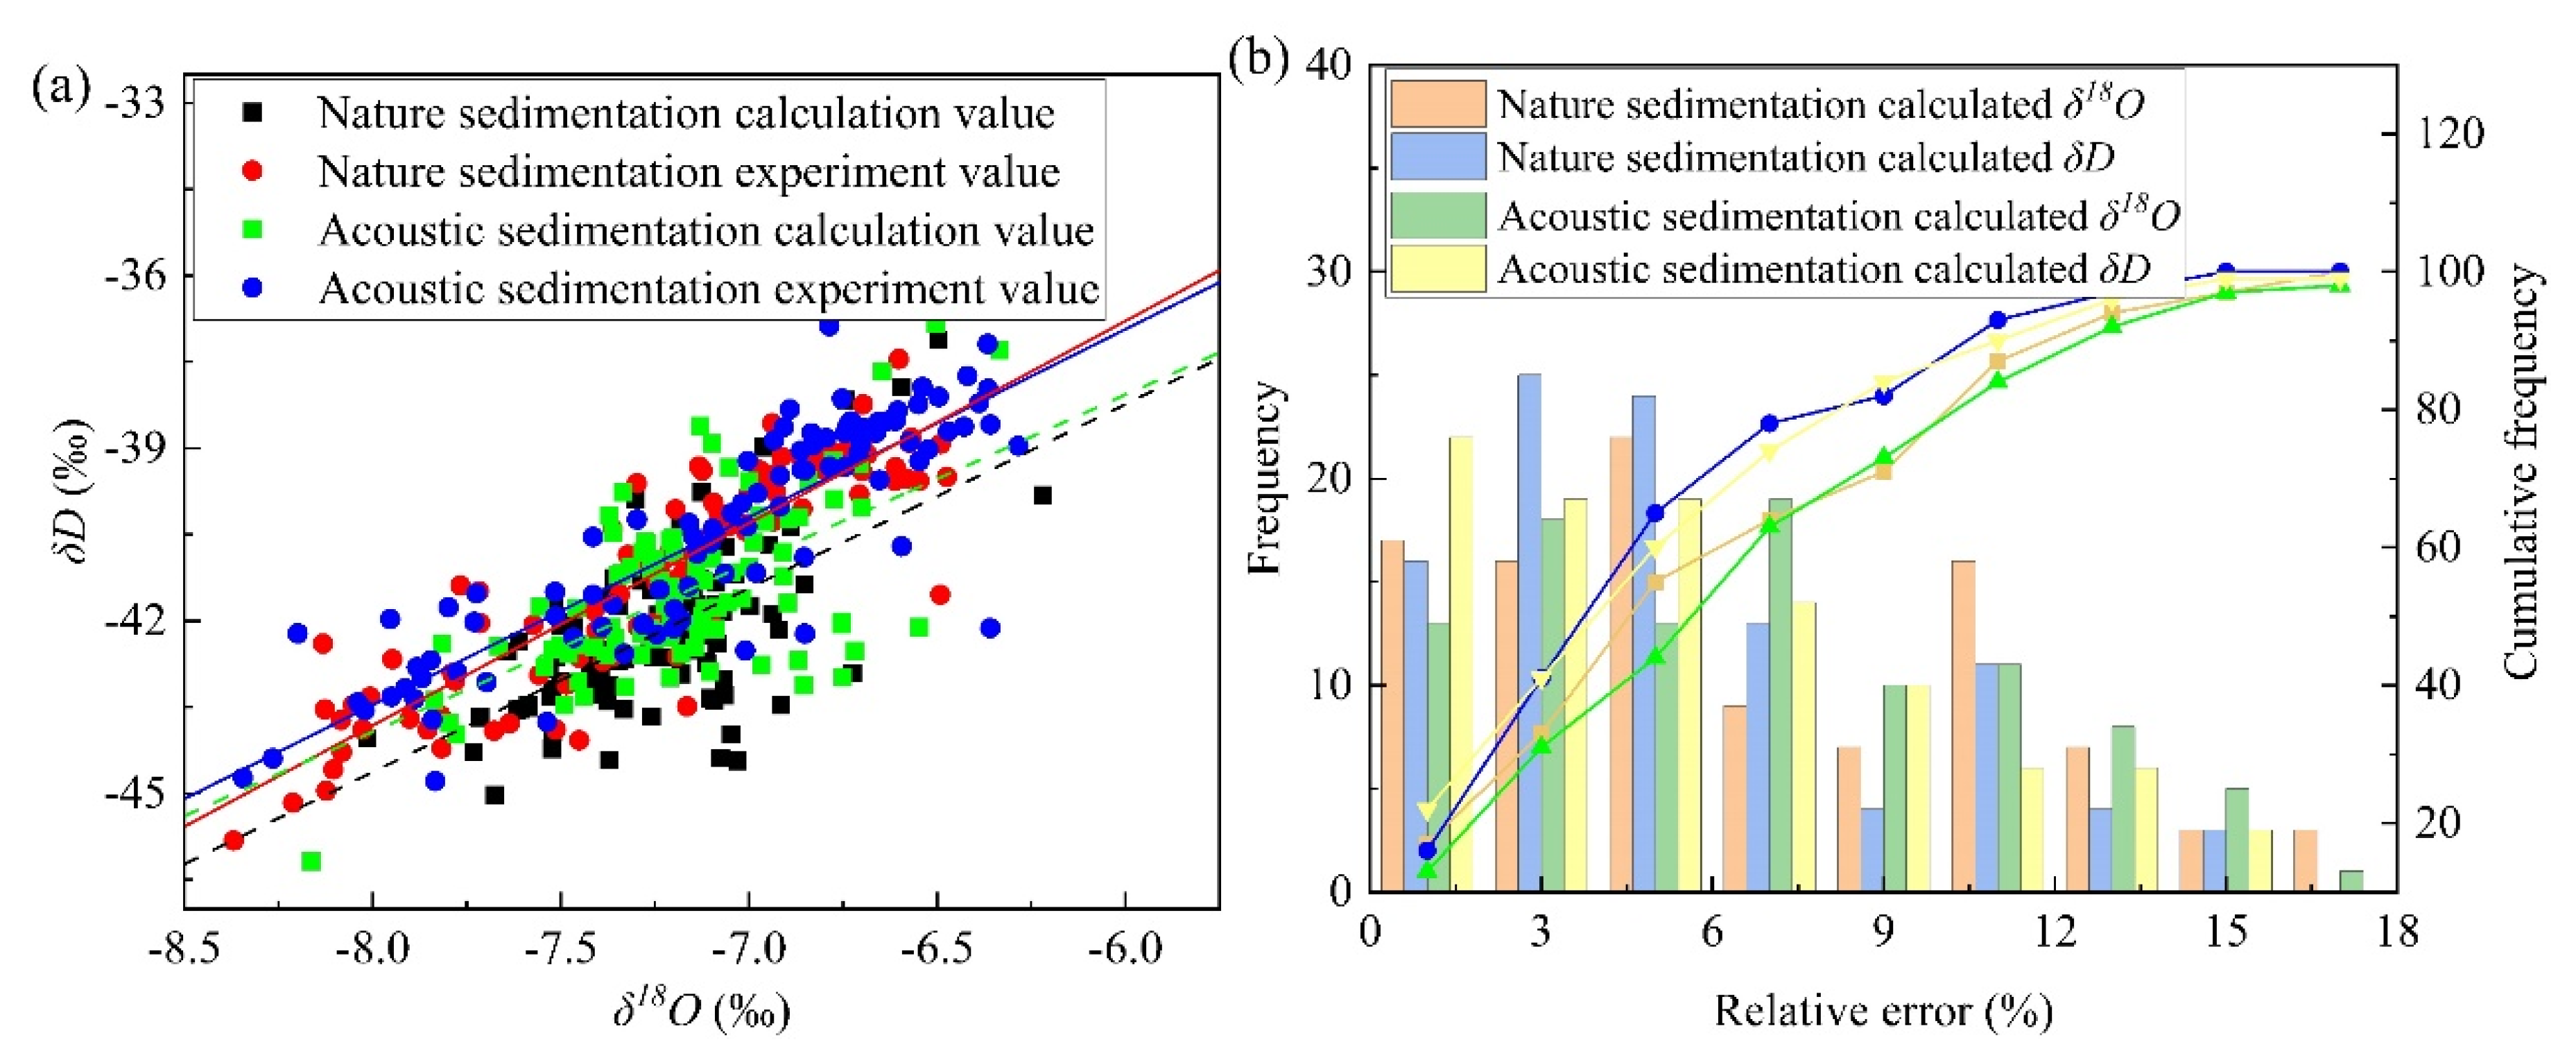
Based on the established isotope exchange equation between the micro-droplet groups and environmental water vapor, the isotope values of the micro-droplets were calculated theoretically using the calculation parameters listed in Table 1. Figure 9a shows that the calculated values of δ18O and δD were generally underestimated, but the isotope variation trends under different sedimentation conditions were consistent with the experimental trends. δD values under natural settlement conditions were in the range of −45.02‰ to −37.12‰, with an average value of −42.20‰, and the δ18O values were in the range of −8.02‰ to −6.22‰, with an average value of −7.24‰. The δD values under acoustic field settlement conditions were in the range of −46.19‰ to −36.84‰, with an average value of −41.50‰, and those for δ18O were in the range of −8.16‰ to −6.33‰, with an average value of −7.17‰. The calculated values of δD and δ18O increased by 0.70‰ and 0.07‰, respectively, under the action of acoustic waves, which is similar to the experimental values of δD that increased by 0.69‰.
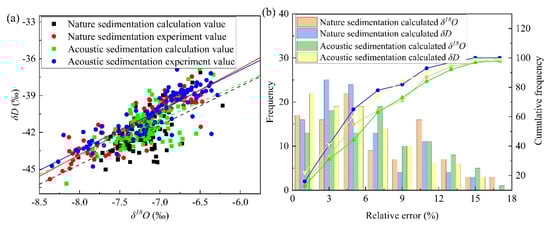
Figure 9.
(a) Comparison of theoretical and experimental values of the micro-droplet isotopes inside the air chamber and (b) their relative error distribution.
Taking the experimental values as standard, the relative error frequencies of δ18O and δD are shown in Figure 9b. It was observed that the relative error was mainly concentrated within 15% and the δD frequency of the relative error within 6% was higher than that of δ18O. For natural settlement conditions, the cumulative frequencies of δD and δ18O of the relative error less than 11% were 87 and 93, respectively (the total frequency was 100). For the acoustic field settlement conditions, the cumulative frequencies of δD and δ18O of the relative error less than 11% were 84 and 90, respectively.
The linear relationships of hydrogen and oxygen isotope values under different sedimentation conditions are shown in Table 3 and variations in the linear relationships are shown in Figure 9a. The fitting slope (k) and intercept (b) between the experimental and calculated values were similar, and the corresponding k and b trends were consistent under the action of acoustic waves. The k and b of the experimental values decreased by 0.25 and 1.65, respectively, and the k and b of the calculated values decreased by 0.27 and 1.44, respectively, which indicated that the isotope exchange equation can accurately reveal the mechanism of isotope exchange. Based on the isotope exchange equation established in this experiment, the micro-droplets collision combination and position can be calculated by selecting accurate parameters. Additionally, a reference value can be obtained for understanding the isotope particle size effect of field precipitation.
Table 3.
Linear fitting parameters.
5. Conclusions
In this study, the microphysical characteristics and environmental isotope effects of micro-droplet groups in an air chamber exposed to acoustic waves were studied through indoor experiments, the variations in size and isotopes of the micro-droplets on the acoustic field and natural conditions were compared, and the isotope exchange equation between the micro-droplet groups and environmental water vapor were established. The main findings are as follows:
- (1)
- The micro-droplets could agglomerate under the influence of acoustic waves and could accelerate the isotope exchange rate. Isotope exchange continuously occurred during the sedimentation process. The acoustic waves had a “trigger effect” on D90. The acoustic waves only reduced and transferred the peak volume frequency, but did not change the peak shape.
- (2)
- The relative variations in the theoretical values for different sedimentation conditions were consistent with the experimental results. The cumulative frequencies of the relative error less than 11% of δD and δ18O were more than 84, indicating high precision. There were some shortcomings, such as the narrow frequency range of acoustic waves and the lack of experimental support for accurate parameters, such as velocity and ventilation coefficient, which will be continuously improved in future studies.
Author Contributions
W.B.: Conceptualisation, methodology, and writing—original draft preparation; J.W.: Supervision, funding acquisition, methodology, writing—review and editing; Y.S.: Investigation, formal analysis, writing—review and editing; Z.Z.: data curation, and Q.L.: Visualisation. All authors have read and agreed to the published version of the manuscript.
Funding
This research was funded by National Natural Science Foundation of China (grant number 52009059); National Key Research and Development Program of China (grant number 2017YFC0403600); China Postdoctoral Science Foundation (grant number 2018M641372); Young and Middle Aged Fund Project of Qinghai University (grant number 2018-QGY-08; 2018-QGY-09; 2020-QGY-13); The Open Research Foundation supported by State Key Laboratory of Hydroscience and Engineering-Tsinghua University (grant number sklhse-2019-A-04); Natural Science Foundation of Technology Department of Qinghai Province (grant number 2019-ZJ-968Q).
Institutional Review Board Statement
Not applicable.
Informed Consent Statement
Not applicable.
Data Availability Statement
The data cannot be shared temporarily.
Conflicts of Interest
The authors declare that there are no conflict of interest regarding the publication of this article.
References
- Cai, A.; Zhang, H.; Wang, L.; Wang, Q.; Wu, X. Source Apportionment and Health Risk Assessment of Heavy Metals in PM2.5 in Handan: A Typical Heavily Polluted City in North China. Atmosphere 2021, 12, 1232. [Google Scholar] [CrossRef]
- Zhang, S.; Tang, H.; Li, Q.; Li, L.; Ge, C.; Li, L.; Feng, J. Secondary Organic Aerosols in PM2.5 in Bengbu, a Typical City in Central China: Concentration, Seasonal Variation and Sources. Atmosphere 2021, 12, 854. [Google Scholar] [CrossRef]
- Wang, S.; Liu, W.; Li, J.; Sun, H.; Qian, Y.; Ding, L.; Ma, H.; Li, J. Seasonal Variation Characteristics of Bacteria and Fungi in PM2.5 in Typical Basin Cities of Xi’an and Linfen, China. Atmosphere 2021, 12, 809. [Google Scholar] [CrossRef]
- Maciejczyk, P.; Chen, L.C.; Thurston, G. The Role of Fossil Fuel Combustion Metals in PM2.5 Air Pollution Health Associations. Atmosphere 2021, 12, 1086. [Google Scholar] [CrossRef]
- Yang, S.Q.; Xing, J.; Chen, W.Y.; Li, F.; Zhu, Y. Rapid Evaluation of the Effects of Policies Corresponding to Air Quality, Carbon Emissions and Energy Consumption: An Example from Shenzhen, China. Atmosphere 2021, 12, 1221. [Google Scholar] [CrossRef]
- Jiang, X.; Luo, Y.; Zhang, B. Prediction of PM2.5 Concentration Based on the LSTM-TSLightGBM Variable Weight Combination Model. Atmosphere 2021, 12, 1211. [Google Scholar] [CrossRef]
- Park, S.W.; Choi, S.Y.; Byun, J.Y.; Kim, H.; Kim, W.J.; Kim, P.R.; Han, Y.J. Different Characteristics of PM2.5 Measured in Downtown and Suburban Areas of a Medium-Sized City in South Korea. Atmosphere 2021, 12, 832. [Google Scholar] [CrossRef]
- Zhang, J.; Wang, H.; Yan, L.; Ding, W.; Liu, R.; Wang, H.; Wang, S. Analysis of Chemical Composition Characteristics and Source of PM2.5 under Different Pollution Degrees in Autumn and Winter of Liaocheng, China. Atmosphere 2021, 12, 1180. [Google Scholar] [CrossRef]
- Lee, K.; Lee, K.I.; Jeon, S.Y.; Kim, S. Preparation of monodisperse charged droplets via electrohydrodynamic device for the removal of fine dust particles smaller than 10 μm. Adv. Powder Technol. 2019, 30, 190–198. [Google Scholar] [CrossRef]
- Yu, H.; Cheng, W.; Peng, H.; Xie, Y. An investigation of the nozzle’s atomization dust suppression rules in a fully-mechanized excavation face based on the airflow-droplet-dust three-phase coupling model. Adv. Powder Technol. 2018, 29, 941–956. [Google Scholar] [CrossRef]
- Kan, H.; Nakamura, H.; Watano, S. Effect of collision angle on particle-particle adhesion of colliding particles through liquid droplet. Adv. Powder Technol. 2018, 29, 1317–1322. [Google Scholar] [CrossRef]
- Shi, Y.; Wei, J.; Qiu, J.; Chu, H.; Bai, W.; Wang, G. Numerical study of acoustic agglomeration process of droplet aerosol using a three-dimensional CFD-DEM coupled model. Powder Technol. 2020, 362, 37–53. [Google Scholar] [CrossRef]
- Zu, K.; Yao, Y.; Cai, M.; Zhao, F.; Cheng, D. Modeling and experimental study on acoustic agglomeration for dust particle removal. J. Aerosol Sci. 2017, 114, 62–76. [Google Scholar] [CrossRef]
- Cheng, M.T.; Lee, P.S.; Berner, A.; Shaw, D.T. Orthokinetic agglomeration in an intense acoustic field. J. Colloid Interface Sci. 1983, 91, 176–187. [Google Scholar] [CrossRef]
- Dong, S.; Lipkens, B.; Cameron, T.M. The effects of orthokinetic collision, acoustic wake, and gravity on acoustic agglomeration of polydisperse aerosols. J. Aerosol Sci. 2006, 37, 540–553. [Google Scholar] [CrossRef]
- González, I.; Hoffmann, T.L.; Gallego, J.A. Precise measurements of particle entrainment in a standing-wave acoustic field between 20 and 3500 Hz. J. Aerosol Sci. 2000, 31, 1461–1468. [Google Scholar] [CrossRef]
- Song, L.; Koopmann, G.; Hoffmann, T. An improved theoretical model of acoustic agglomeration. J. Vib. Acoust. 1994, 116, 208–214. [Google Scholar] [CrossRef]
- Hoffmann, T.L.; Koopmann, G.H. Visualization of acoustic particle interaction and agglomeration: Theory and experiments. J. Acoust. Soc. Am. 1996, 99, 2130–2141. [Google Scholar] [CrossRef]
- Shaw, D.; Tu, K. Acoustic particle agglomeration due to hydrodynamic interaction between monodisperse aerosols. J. Aerosol. Sci. 1979, 10, 317–328. [Google Scholar] [CrossRef]
- Tiwary, R.; Reethof, G. Hydrodynamic interaction of spherical aerosol particles in a high intensity acoustic field. J. Sound Vib. 1986, 108, 33–49. [Google Scholar] [CrossRef]
- Chen, H.; Zhao, B.; Xu, J.; Shen, X. Experimental study on acoustic agglomeration of ultrafine fly ash particles. Proc. CSEE 2007, 27, 28–32. (In Chinese) [Google Scholar]
- Chang, H.; Kan, C.; Wei, Y.T. Sonic dissipation of water fog-A preliminary experimental study. J. Nanjing Univ. Nat. Sci. 1963, 2, 21–28. (In Chinese) [Google Scholar]
- Hou, S.; Wu, J.; Xi, B. Experiments on acoustic dissipation of water fog at low frequency. Exp. Meas. Fluid Mech. 2002, 16, 52–56. (In Chinese) [Google Scholar]
- Bai, W.; Wei, J.; Ni, S.; Shi, Y. Experimental study on micro-droplet sedimentation under the action of low-frequency acoustic wave. J. Basic Sci. Eng. 2020, 28, 247–258. (In Chinese) [Google Scholar]
- Shi, Y.; Wei, J.; Bai, W.; Wang, G. Numerical investigations of acoustic agglomeration of liquid droplet using a coupled CFD-DEM model. Adv. Powder Technol. 2020, 31, 2394–2411. [Google Scholar] [CrossRef]
- Gu, W.; Pang, Z.; Wang, J. Isotope Hydrology; Science Press: Beijing, China, 2011. (In Chinese) [Google Scholar]
- Friedman, I.; Machta, L.; Soller, R. Water-vapor exchange between a water droplet and its environment. J. Geophys. Res. 1962, 67, 2761–2766. [Google Scholar] [CrossRef]
- Stewart, M.K. Stable isotope fractionation due to evaporation and isotopic exchange of falling waterdrops: Applications to atmospheric processes and evaporation of lakes. J. Geophys. Res. 1975, 80, 1133–1146. [Google Scholar] [CrossRef]
- Wei, J.; Qiu, J.; Li, T.; Huang, Y.; Qiao, Z.; Cao, J.; Zhong, D.; Wang, G. Cloud and precipitation interference by strong low-frequency sound wave. Sci. China Tech. Sci. 2021, 64, 261–272. [Google Scholar] [CrossRef]
- Shi, Y.; Wei, J.; Ren, Y.; Qiao, Z.; Li, Q.; Zhu, X.; Kang, B.; Pan, P.; Cao, J.; Qiu, J.; et al. Investigation of Precipitation Characteristics under the Action of Acoustic Waves in the Source Region of the Yellow River. J. Appl. Meteorol. Climatol. 2021, 60, 951–966. [Google Scholar]
- Wei, J.; Shi, Y.; Ren, Y.; Li, Q.; Qiao, Z.; Cao, J.; Ayantobo, O.O.; Yin, J.; Wang, G. Application of Ground-Based Microwave Radiometer in Retrieving Meteorological Characteristics of Tibet Plateau. Remote Sens. 2021, 13, 2527. [Google Scholar] [CrossRef]
- Shi, Y.; Wei, J.; Li, Q.; Yang, H.; Qiao, Z.; Ren, Y.; Ni, S.; He, J.; Shen, W.; Cao, S.; et al. Investigation of vertical microphysical characteristics of precipitation under the action of low-frequency acoustic waves. Atmos. Res. 2021, 249, 105283. [Google Scholar] [CrossRef]
- Bai, W.; Wei, J.; Li, Q.; Shi, Y.; Ni, S.; Lei, F. The hydrogen and oxygen isotope characteristic of droplet collision and deposition under the action of acoustic wave. J. Appl. Acoust. 2021, 40, 1–11. (In Chinese) [Google Scholar]
- Yang, J.; Chen, B.; Yin, Y. Cloud Precipitation Physics; China Meteorological Press: Beijing, China, 2011. (In Chinese) [Google Scholar]
- Han, X.; Xie, Y. Probability Theory and Mathematical Statistics; Peking University Press: Beijing, China, 2018. (In Chinese) [Google Scholar]
- Beard, K.V.; Pruppacher, H.R. A wind tunnel investigation of the rate of evaporation of small water drops falling at terminal velocity in air. J. Atmos. Sci. 1971, 28, 1455–1464. [Google Scholar] [CrossRef] [Green Version]


Publisher’s Note: MDPI stays neutral with regard to jurisdictional claims in published maps and institutional affiliations. |
© 2021 by the authors. Licensee MDPI, Basel, Switzerland. This article is an open access article distributed under the terms and conditions of the Creative Commons Attribution (CC BY) license (https://creativecommons.org/licenses/by/4.0/).