Article

The Multi-Time Scale Changes in Air Pollutant Concentrations and Its Mechanism before and during the COVID-19 Periods: A Case Study from Guiyang, Guizhou Province

School of Management Science, Guizhou University of Finance and Economics, Guiyang 550025, China
*
Author to whom correspondence should be addressed.
Atmosphere 2021, 12(11), 1490; https://doi.org/10.3390/atmos12111490
Submission received: 20 September 2021 / Revised: 27 October 2021 / Accepted: 5 November 2021 / Published: 11 November 2021
(This article belongs to the Section Air Pollution Control)

Abstract

:
The lockdown during the coronavirus disease 2019 (COVID-19) pandemic provides a scarce opportunity to assess the efficiency of air pollution mitigation. Herein, the monitoring data of air pollutants were thoroughly analyzed together with meteorological parameters to explore the impact of human activity on the multi-time scale changes of air pollutant concentrations in Guiyang city, located in Southwest China. The results show that the COVID-19 lockdown had different effects on the criteria air pollutants, i.e., PM2.5 (diameter ≤ 2.5 μm), PM10 (diameter ≤ 10 μm), sulfur dioxide (SO2), nitrogen dioxide (NO2), carbon monoxide (CO), and ozone (O3) concentrations. The lockdown caused a significant drop in NO2 concentration. During the first-level lockdown period, the NO2 concentration declined sharply by 8.41 μg·m−3 (45.68%). The decrease in NO concentration caused the “titration effect” to weaken, leading to a sharp increase in O3 concentration. Although human activities resumed partially and the “titration effect” enhanced certainly during the second-level lockdown period, the meteorological conditions became more conducive to the formation of O3 by photochemical reactions. Atmosphere oxidation was enhanced to promote the generation of secondary aerosols through gas–particle transitions, thus compensating for the reduced primary emission of PM2.5. The implication of this study is that the appropriate air pollution control policies must be initiated to suppress the secondary generation of both PM2.5 and O3.

1. Introduction

The coronavirus disease 2019 (COVID-19) pandemic has caused unprecedented socioeconomic impact around the world [1]. In order to curb the viral transmission among humans, the State Council of China issued the National Emergency Plan for Public Emergencies, which set out the strictest lockdown measures and almost completely stagnated economic activities related to transportation and movement [2]. The lockdown measures included the partial or total closure of international borders, schools, and non-essential businesses, in addition to the restriction on non-essential movement of citizens [3]. Wuhan, the capital city of Hubei Province, announced the closure on 23 January 2020. Subsequently, other major Chinese cities/counties also followed suit. Localities determined the level of early warning according to the severity of harm, urgency, and developmental degree that may be caused by COVID-19, inclusive of four levels, which are level I (particularly serious), level II (serious), level III (more serious), and level IV (general) [4]. COVID-19 lockdown caused a reduction in the levels of human activities, which is essentially similar to the temporary emission control imposed on pollution sources during major conferences or sporting events. The difference is that COVID-19 lockdown had a wider impact and lasted longer [5]. Anthropogenic activities and the emissions from their pollution sources were substantially reduced during the lockdown period, thus creating a rare “natural laboratory” to evaluate the response of air quality to the reduction of anthropogenic emissions [6].
The effects of COVID-19 lockdown on the changes in air pollutant concentrations were profoundly different. The nitrogen dioxide (NO2) concentration during COVID-19 was reduced substantially worldwide due to the exceptionally strict traffic controls [7]. The emission of sulfur dioxide (SO2) is mainly affected by coal-burning enterprises such as steel and petrochemical industry, with SO2 concentration even showing an increase rather than a decline during COVID-19 period owing to the particularity of the production process [8,9,10,11]. A wide range of traffic control measures reduced nitric oxide (NO) emissions substantially and weakened the “titration effect” on ozone (O3) [12], thus causing a general rise in O3 concentrations during the COVID-19 pandemic [10,11,13]. As for the source of particulate matter PM2.5 (diameter ≤ 2.5 μm) and PM10 (diameter ≤ 10 μm), it includes not only the primary direct emissions from coal combustion, vehicle exhaust, and road dust, but also the secondary aerosols generated by particle conversion, showing some significant regional differences in their response to the lockdown measures [6,14]. Due to the differences in various regions caused by factors such as pollutant emission intensity, meteorological conditions, and atmospheric oxidizability, the improvement of air quality failed to show any consistent spatiotemporal trend between the cities in the same country and in different countries [15]. For example, the highly humid weather in the North China Plain during the COVID-19 pandemic, coupled with the persistent emissions from power plants and the petrochemical industry, still caused serious haze events [6,16].
The different energy structures, industrial compositions, transportation facilities, and meteorological conditions in each region can lead differences in the concentrations of air pollutants to the lockdown measures. The multi-time scale analysis of air pollutant concentrations conducted before and during the COVID-19 periods is conducive to gaining an in-depth understanding the effects of COVID-19 lockdown on air quality and its underlying mechanism. Guiyang, located in Southwest China, is a national big data industry development cluster and an important ecological leisure tourism city. Its special industrial composition has high requirements for excellent air quality. The annual mean concentrations of PM2.5, PM10, SO2, NO2, O3, and CO in Guiyang in recent years are (42.53 ± 24.52), (67.56 ± 34.32), (20.78 ± 19.71), (28.32 ± 9.59), (107.59 ± 27.54) μg/m3, and (0.74 ± 0.22) mg/m3, respectively. Except for SO2 concentration close to or higher than that of cities in central and eastern China, other pollutants are all at a relatively clean level. Although the average level of other air pollutants has been declining, the O3 concentration on the ground has increased significantly year by year [17]. When solar radiation was relatively high in summer, the concentrations of PM2.5 and O3 were high at the same time, leading to compound pollution [18,19]. It is essential to study the effect of anthropogenic emission reduction on the concentration changes of air pollutants, clarify the process and mechanism of pollution changes, and thus take effective countermeasures to address air pollution. Therefore, Guiyang city was selected in this paper as the study area. On this basis, the concentrations of air pollutant PM2.5, PM10, SO2, NO2, carbon monoxide (CO), and O3 with meteorological parameters at different stages before and during the COVID-19 periods in Guiyang city were compared by multiple time scales. Additionally, the effects of COVID-19 lockdown on the changes in air quality in Guiyang city were explored to provide a sensible reference for the formulation of future policies on air pollution control.

2. Materials and Methods

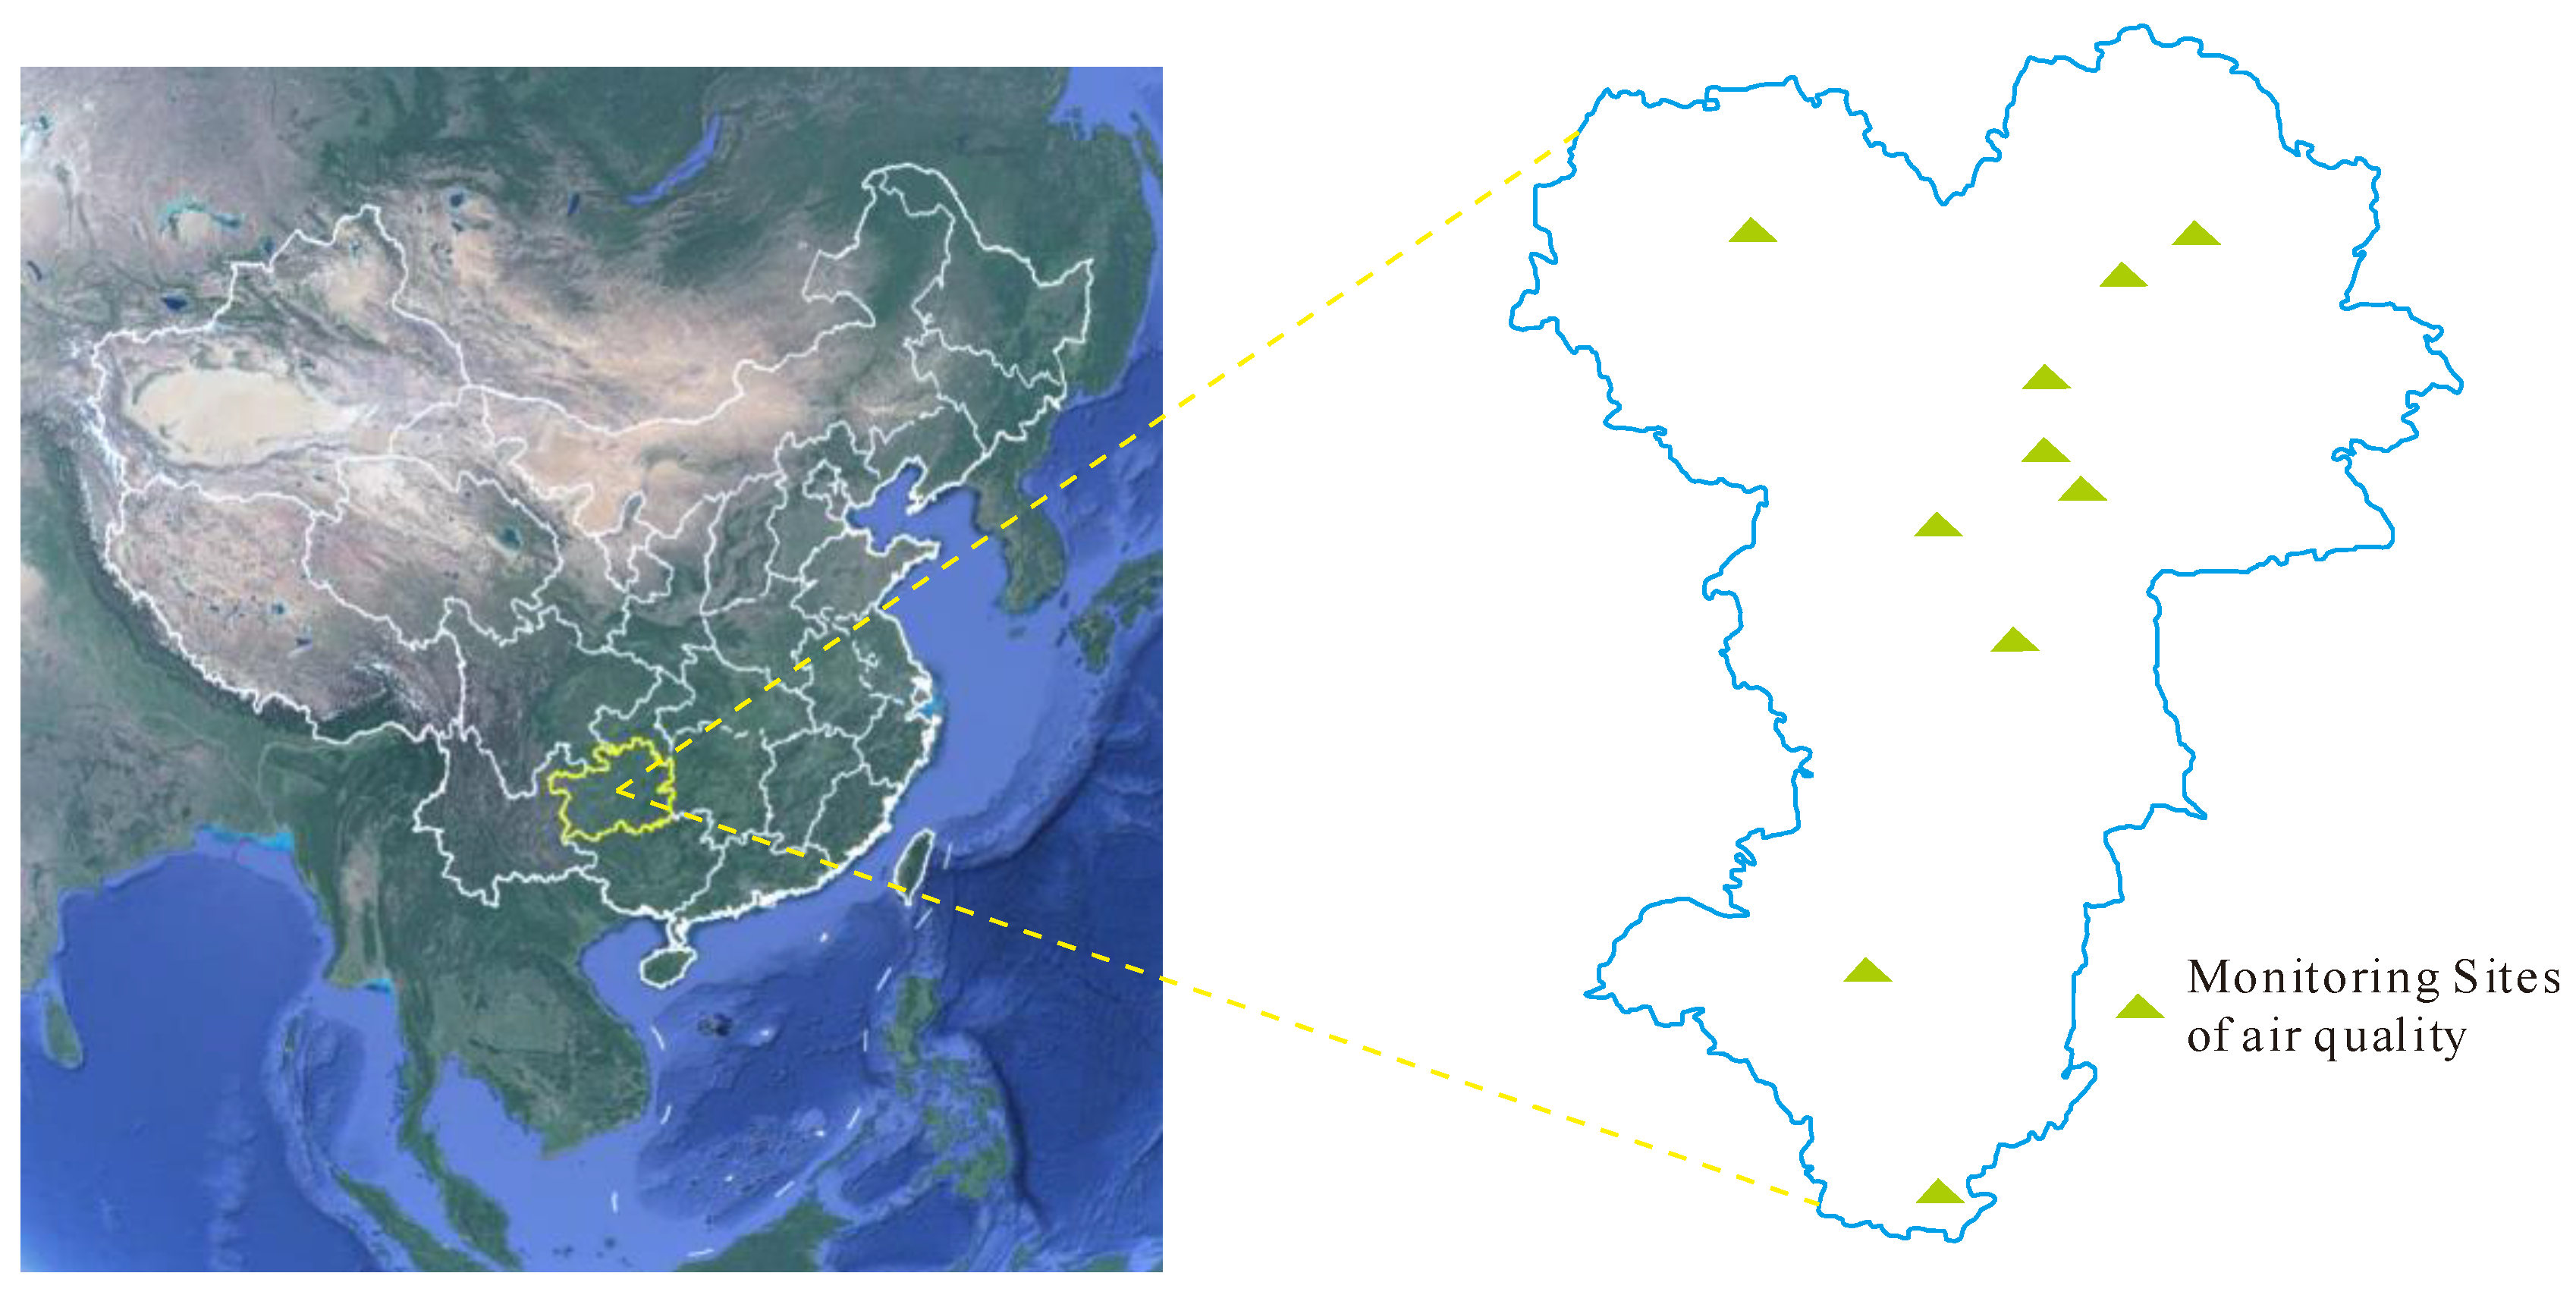
2.1. Regional Overview and Data Sources

Guiyang is situated in the central part of Guizhou Province in the Yunnan-Guizhou Plateau in Southwest China, between 106°07′–107°17′ E and 26°11′–26°55′ N. As of November 2020, Guiyang has a resident population of 497.14 million and an urban population of 378.47 million, with its urbanization rate reaching 76.13%. At present, 10 national control sites dedicated to ambient air monitoring (Figure 1) have been set up in Guiyang city by the China Environmental Monitoring General Station, so as to monitor the concentrations of air pollutants and the changes in air quality. The method of air quality monitoring is practiced according to the Environmental Quality Standard (GB3095-2012). The monitoring instrument is calibrated regularly according to the Technical Specification for Automatic Monitoring of Environmental Quality (HJ/T193-2005) in order to ensure the accuracy of monitoring data. The data of pollutant concentrations as monitored at each station were published online in real time (http://www.aqistudy.cn/ (accessed on 9 March 2020); http://data.epmap.org/ (accessed on 9 March 2020)). The criteria air pollutants chosen for this study include PM2.5, PM10, SO2, NO2, CO, and O3. The advantage of using ground-based observational data is that they are more sensitive to the changes in emission sources and more relevant to human exposure and health risks [20]. In addition, meteorological observation data were collected to study the effect of meteorological changes on the concentrations of air pollutants. Meteorological parameters including sunshine duration (SD), temperature (T), wind speed (WS), relative humidity (RH), precipitation (P), and atmospheric pressure (AP) were obtained from the National Basic Meteorological Station of Guiyang City (WMOID = 57816) (http://data.cma.cn/user/toLog in.html/ (accessed on 9 March 2020)).

2.2. The Definition of Lockdown Stage and Research Methods

On 24 January 2020, the Guizhou provincial government decided to initiate the first-level response to public health emergencies. Subsequently, a series of preventative measures were taken in Guiyang, including the closure of all cultural entertainment venues, tourism sites, and other public places; the close-looped management of urban communities; the limit on each household to designate one family member for purchase of daily necessities every 2 days; and the comprehensive implementation of “contactless” distribution of daily necessities at the designated places. On the afternoon of 15 February 2020, Guizhou Province announced that the “checkpoints” between cities, prefectures, counties, and villages would be withdrawn, and the restriction on transportation and circulation would be lifted, marking that the lockdown rating had been lowered. Based on the changes made to the epidemic prevention policy enforced in Guiyang City, the spell from 25 January to 15 February 2020 (22 days in total) is defined as the first-level lockdown period (Fir-Lockdown), the spell from 3 January to 24 January 2020 (22 days in total) is treated as the pre-lockdown period (Pre-Lockdown), and the spell from 15 February to 8 March 2020 (22 days in total) is regarded as the second-level lockdown (Sec-Lockdown) period. Upon a comparison of the concentration changes in air pollutants at different stages on multiple time scales, meteorological parameters were used to explore the effect of lockdown on the changes in air quality, and to analyze the pollution process. On this basis, targeted countermeasures were proposed for pollution control. Data of pollutant concentrations used in this paper are all based on hourly concentrations, while the mean mass concentrations on different time scales were calculated using the data of hourly concentrations, including the Pre-Lockdown stage, the Fir-Lockdown stage, the Sec-Lockdown stage, day, and hour. The research methods used in this article include chart description, time series analysis, and correlation matrix analysis (with Pearson correlation coefficients).

3. Results

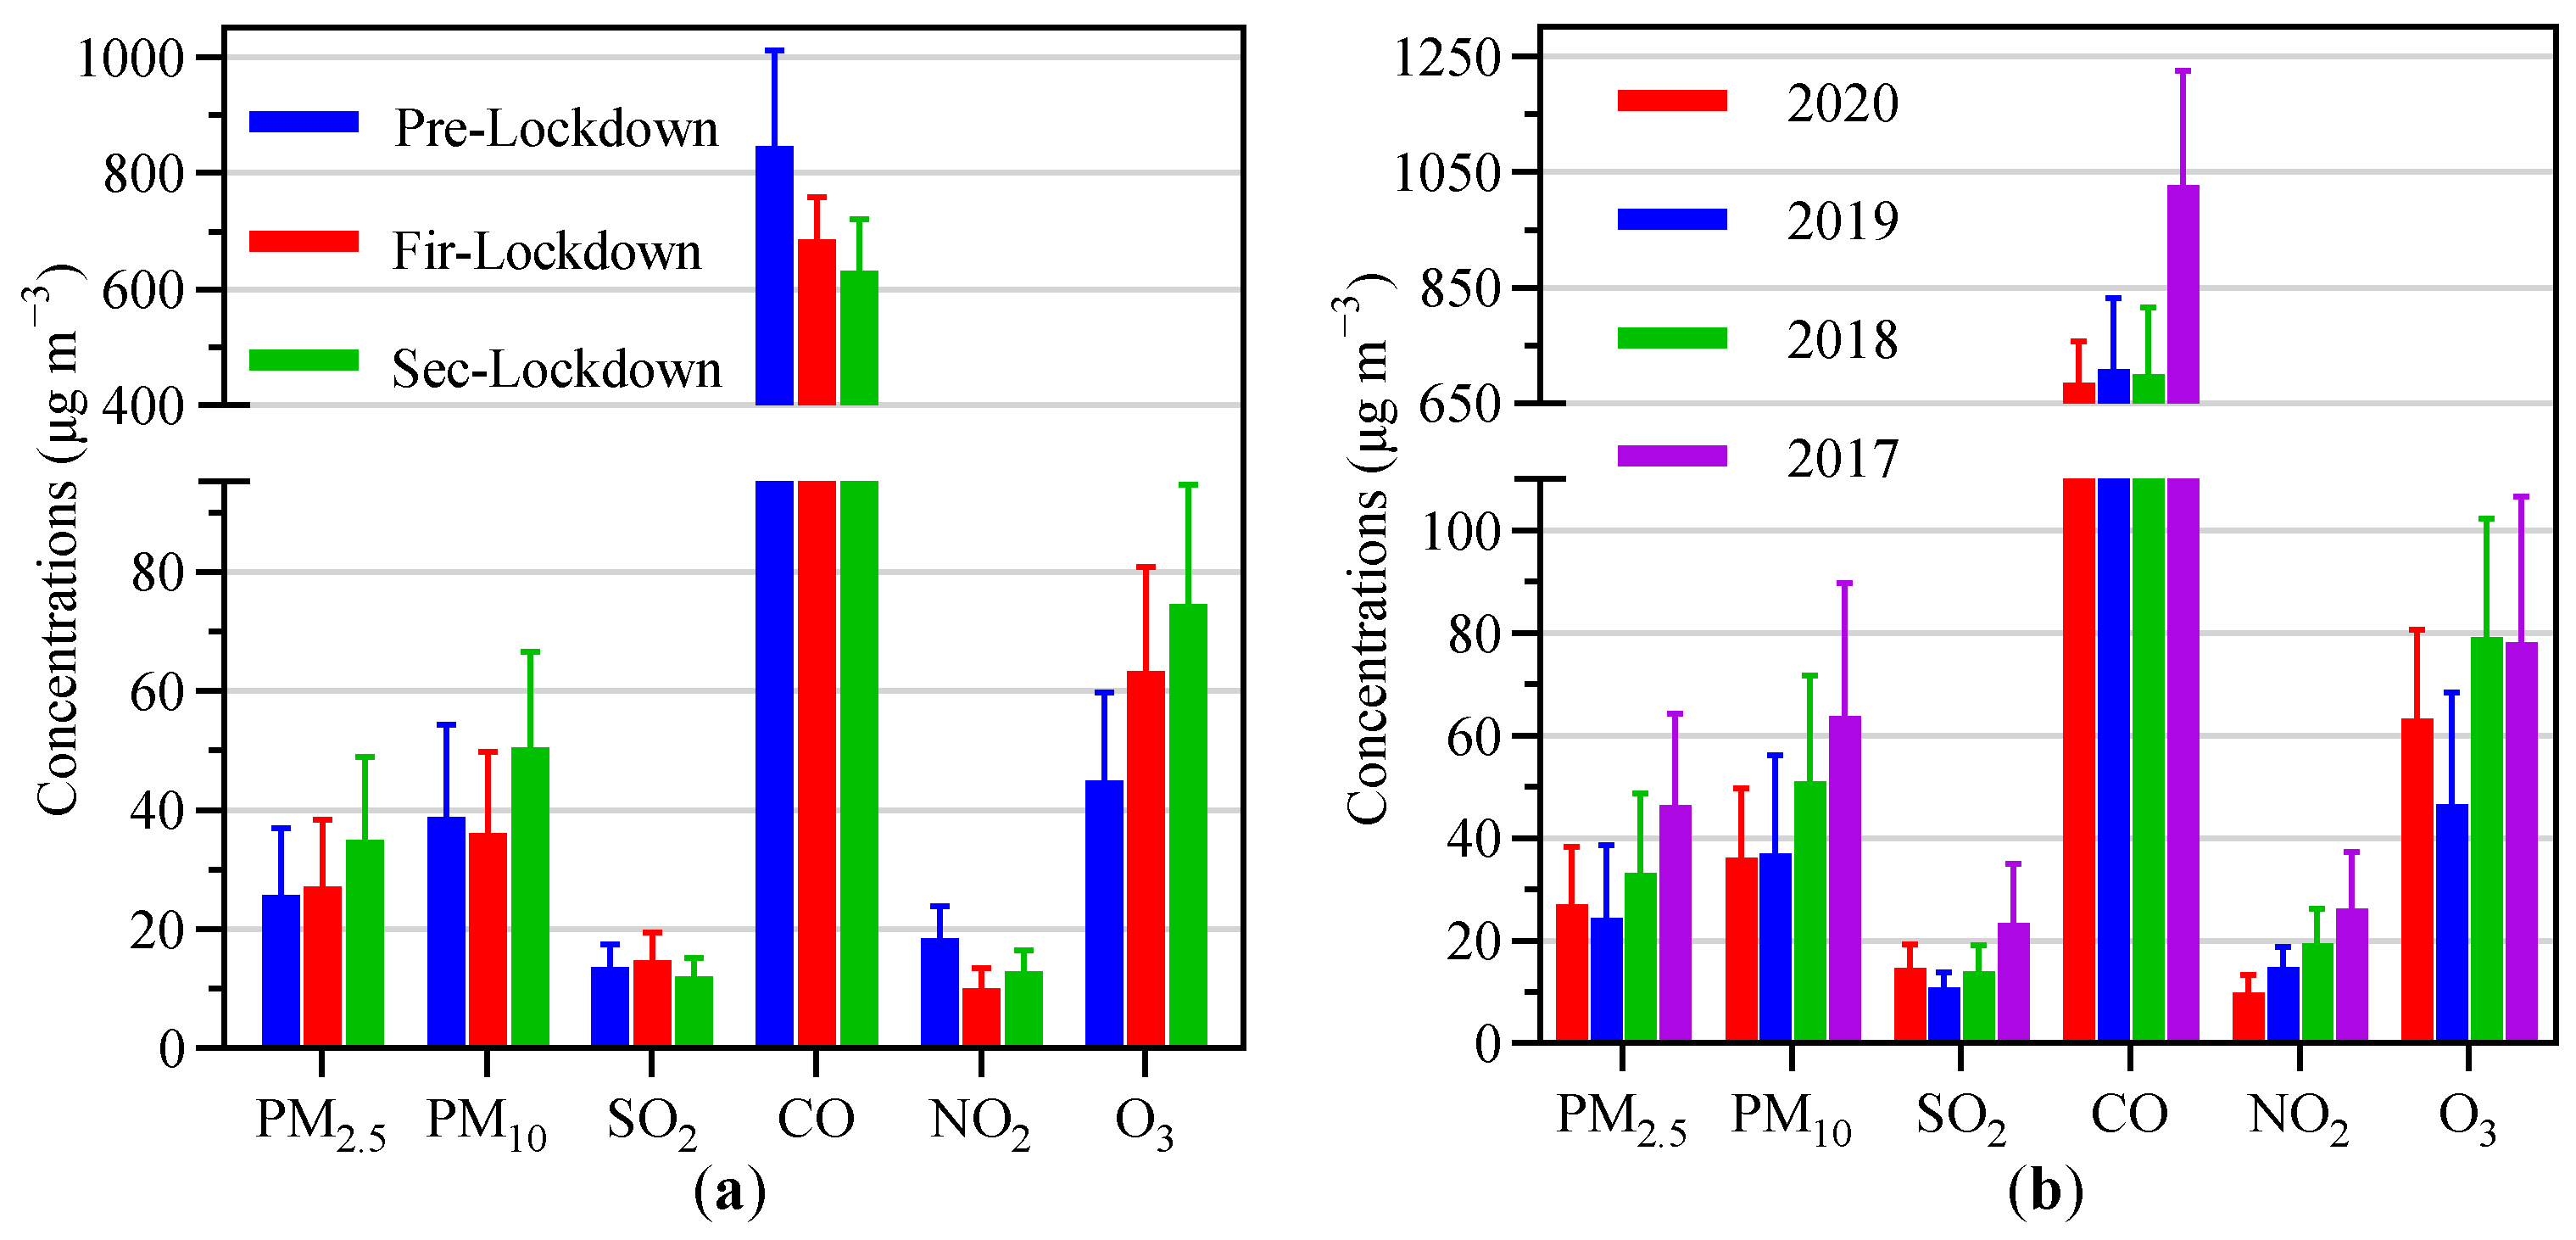
3.1. Change Characteristics of the Mean Concentrations of Air Pollutants during the Three Stages

As shown in Figure 2a, the stage changes of PM2.5, PM10, SO2, NO2, CO, and O3 concentrations were significantly different. As compared with the Pre-Lockdown period, the mean concentrations of PM10, NO2, and CO during the Fir-Lockdown period decreased by 2.59 μg·m−3 (6.67%), 8.41 μg·m−3 (45.68%), and 159.09 μg·m−3 (18.82%), respectively, with the mean concentration of NO2 decreasing the most, by nearly 50%. However, the mean concentration of O3 increased by 18.36 μg·m−3 (40.85%), and the mean concentrations of PM2.5 and SO2 changed less significantly or were slightly higher. Compared with the Fir-Lockdown period, the mean concentrations of PM2.5, PM10, NO2, and O3 were significantly increased during the Sec-Lockdown period, by 7.91 μg·m−3 (29.15%), 14.23 μg·m−3 (39.27%), 2.91 μg·m−3 (29.09%), and 11.23 μg·m−3 (17.73%), respectively. In comparison, the mean concentrations of SO2 and CO dropped slightly. During the Sec-Lockdown period, there was a significant increase in the concentration of major pollutants due to the lowered lockdown intensity and human activities such as the resumption of work and production that increased the emission of pollutants, coupled with the meteorological conditions conducive for pollutants to build up (which we will analyze in Section 4.1). Since SO2 mainly comes from coal-fired enterprises such as steel and power plants, its production cannot be interrupted due to the production particularity and process equipment [8]. Therefore, the mean SO2 concentration increased rather than decreased during the lockdown period. The most significant source of NOx emission is transportation [7], and the sharp reduction in NO2 mean concentration during the Fir-Lockdown period is associated with a significant decrease in vehicle activity caused by strict traffic control. During the Sec-Lockdown period, vehicle emissions increased due to the partial resumption of human activities, which increased the mean concentration of NO2 to some extent (Figure 2a).
Compared with the same lunar periods in 2019, 2018, and 2017, the mean concentration of NO2 during the Fir-Lockdown period in 2020 decreased by 4.90 μg·m−3 (32.92%), 9.54 μg·m−3 (48.83%), and 16.27 μg·m−3 (61.94%), respectively (Figure 2b), again indicating that the COVID-19 lockdown was very effective in reducing transportation activities. The lockdown measures had greatly reduced the emission of nitrogen oxides and significantly reduced the NO2 concentration in the air. The NO concentration usually changes synergistically with the NO2 concentration [15]. Decreased NO concentration weakened the “titration effect”, resulting in a significant increase in the O3 concentration by 19.59 μg·m−3 (35.5%) during the Fir-Lockdown period in 2020 compared with the same lunar calendar in 2019 [6]. However, the concentration of PM2.5, PM10, and SO2 did not decrease significantly compared with the previous year—there was even a phenomenon of not decreasing but increasing, which may reflect the influence of other factors on the concentrations of pollutants.

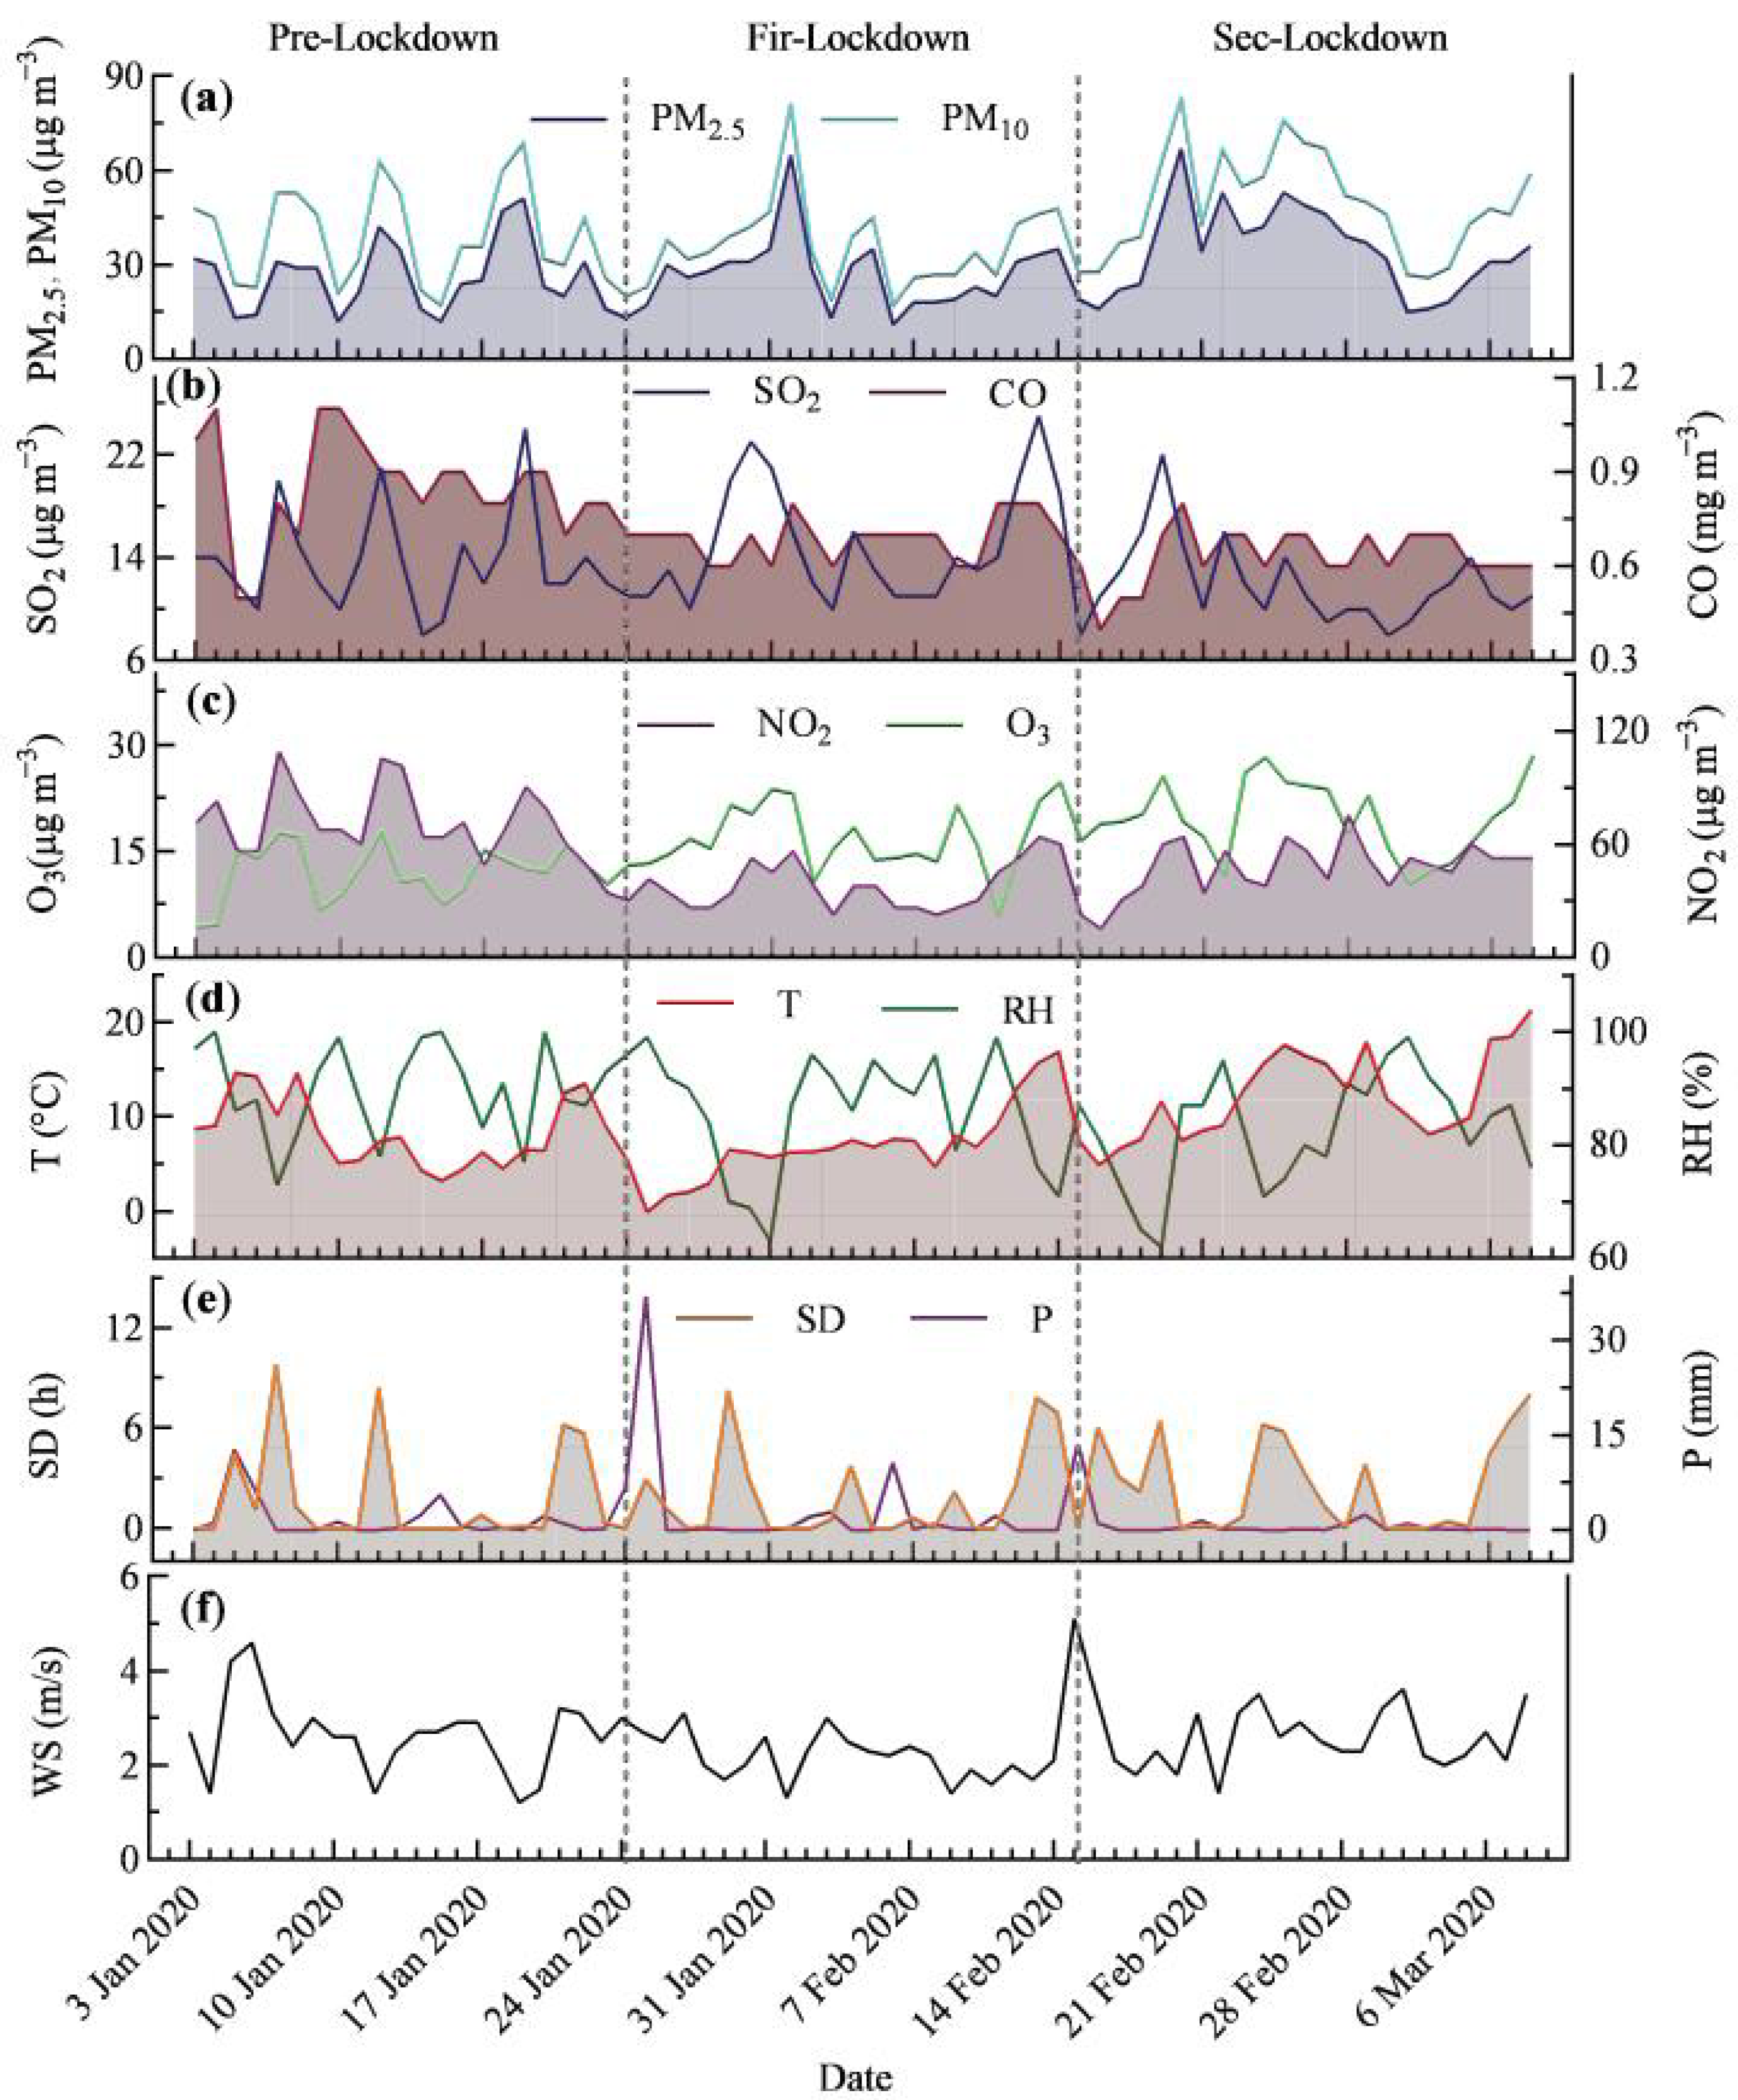
3.2. Change Characteristics of Daily Mean Concentration of Air Pollutants

Meteorological conditions had a significant effect on pollutant concentrations. As shown in Figure 3, the daily concentrations of PM2.5, PM10, SO2, NO2, CO, and O3 fluctuated significantly and persistently with the changes of meteorological parameters. The peak values of SD and T, as well as the valley values of RH and WS, always coincided with the peak values of various pollutant concentrations. Conversely, the valley values of SD and T, as well as the peak values of RH and WS, always corresponded to the valley values of various pollutant concentrations. It is suggested that long sunshine time, increased temperature, decreased relative humidity and reduced wind speed facilitate pollutants to accumulate, thus causing air pollution. Conversely, it is conducive to the diffusion of pollutants, thus alleviating air pollutions. In addition, the “large” peak value of precipitation corresponded to the valley value of pollutant concentrations, while the “small” peak value corresponded to the peak value of pollutant concentrations (Figure 3e), indicating that the effect of precipitation on pollutant concentrations is more complex. Additionally, large precipitation has a scouring effect on pollutants, which is conducive to the wet deposition of pollutants, while small and medium-sized precipitation will promote the accumulation of pollutants, thereby exacerbating pollution [10].
The stage differences in daily mean concentrations of PM2.5, PM10, and SO2 are not obvious, while the daily mean concentrations of NO2 and CO decreased to some extent during both Fir-Lockdown and Sec-Lockdown periods, with NO2 concentrations decreasing most significantly during the Fir-Lockdown period (Figure 3c). A wide range of traffic restrictions enforced during the lockdown period was the main reason for the decrease in NO2 concentrations [7], while the decrease in CO concentrations was related to its source contribution composition, its own chemical stability, and the significant reduction in vehicle travel rates [21]. The “titration effect” was reduced by the decrease in NO concentration [12], as a result of which there was a significant rise in O3 concentrations during the Fir-Lockdown period (Figure 3c). In addition, there was a drastic fluctuation in O3 concentrations during the lockdown periods, indicating that photochemical reactions played a crucial role in the change in O3 concentrations. The trend of O3 concentrations was not synchronized with other pollutants, while its peak and valley values did not correspond well to PM2.5, PM10, SO2, NO2, and CO, indicating that O3, as a secondary pollutant, was also affected by precursor concentrations and photochemical reactions [22].

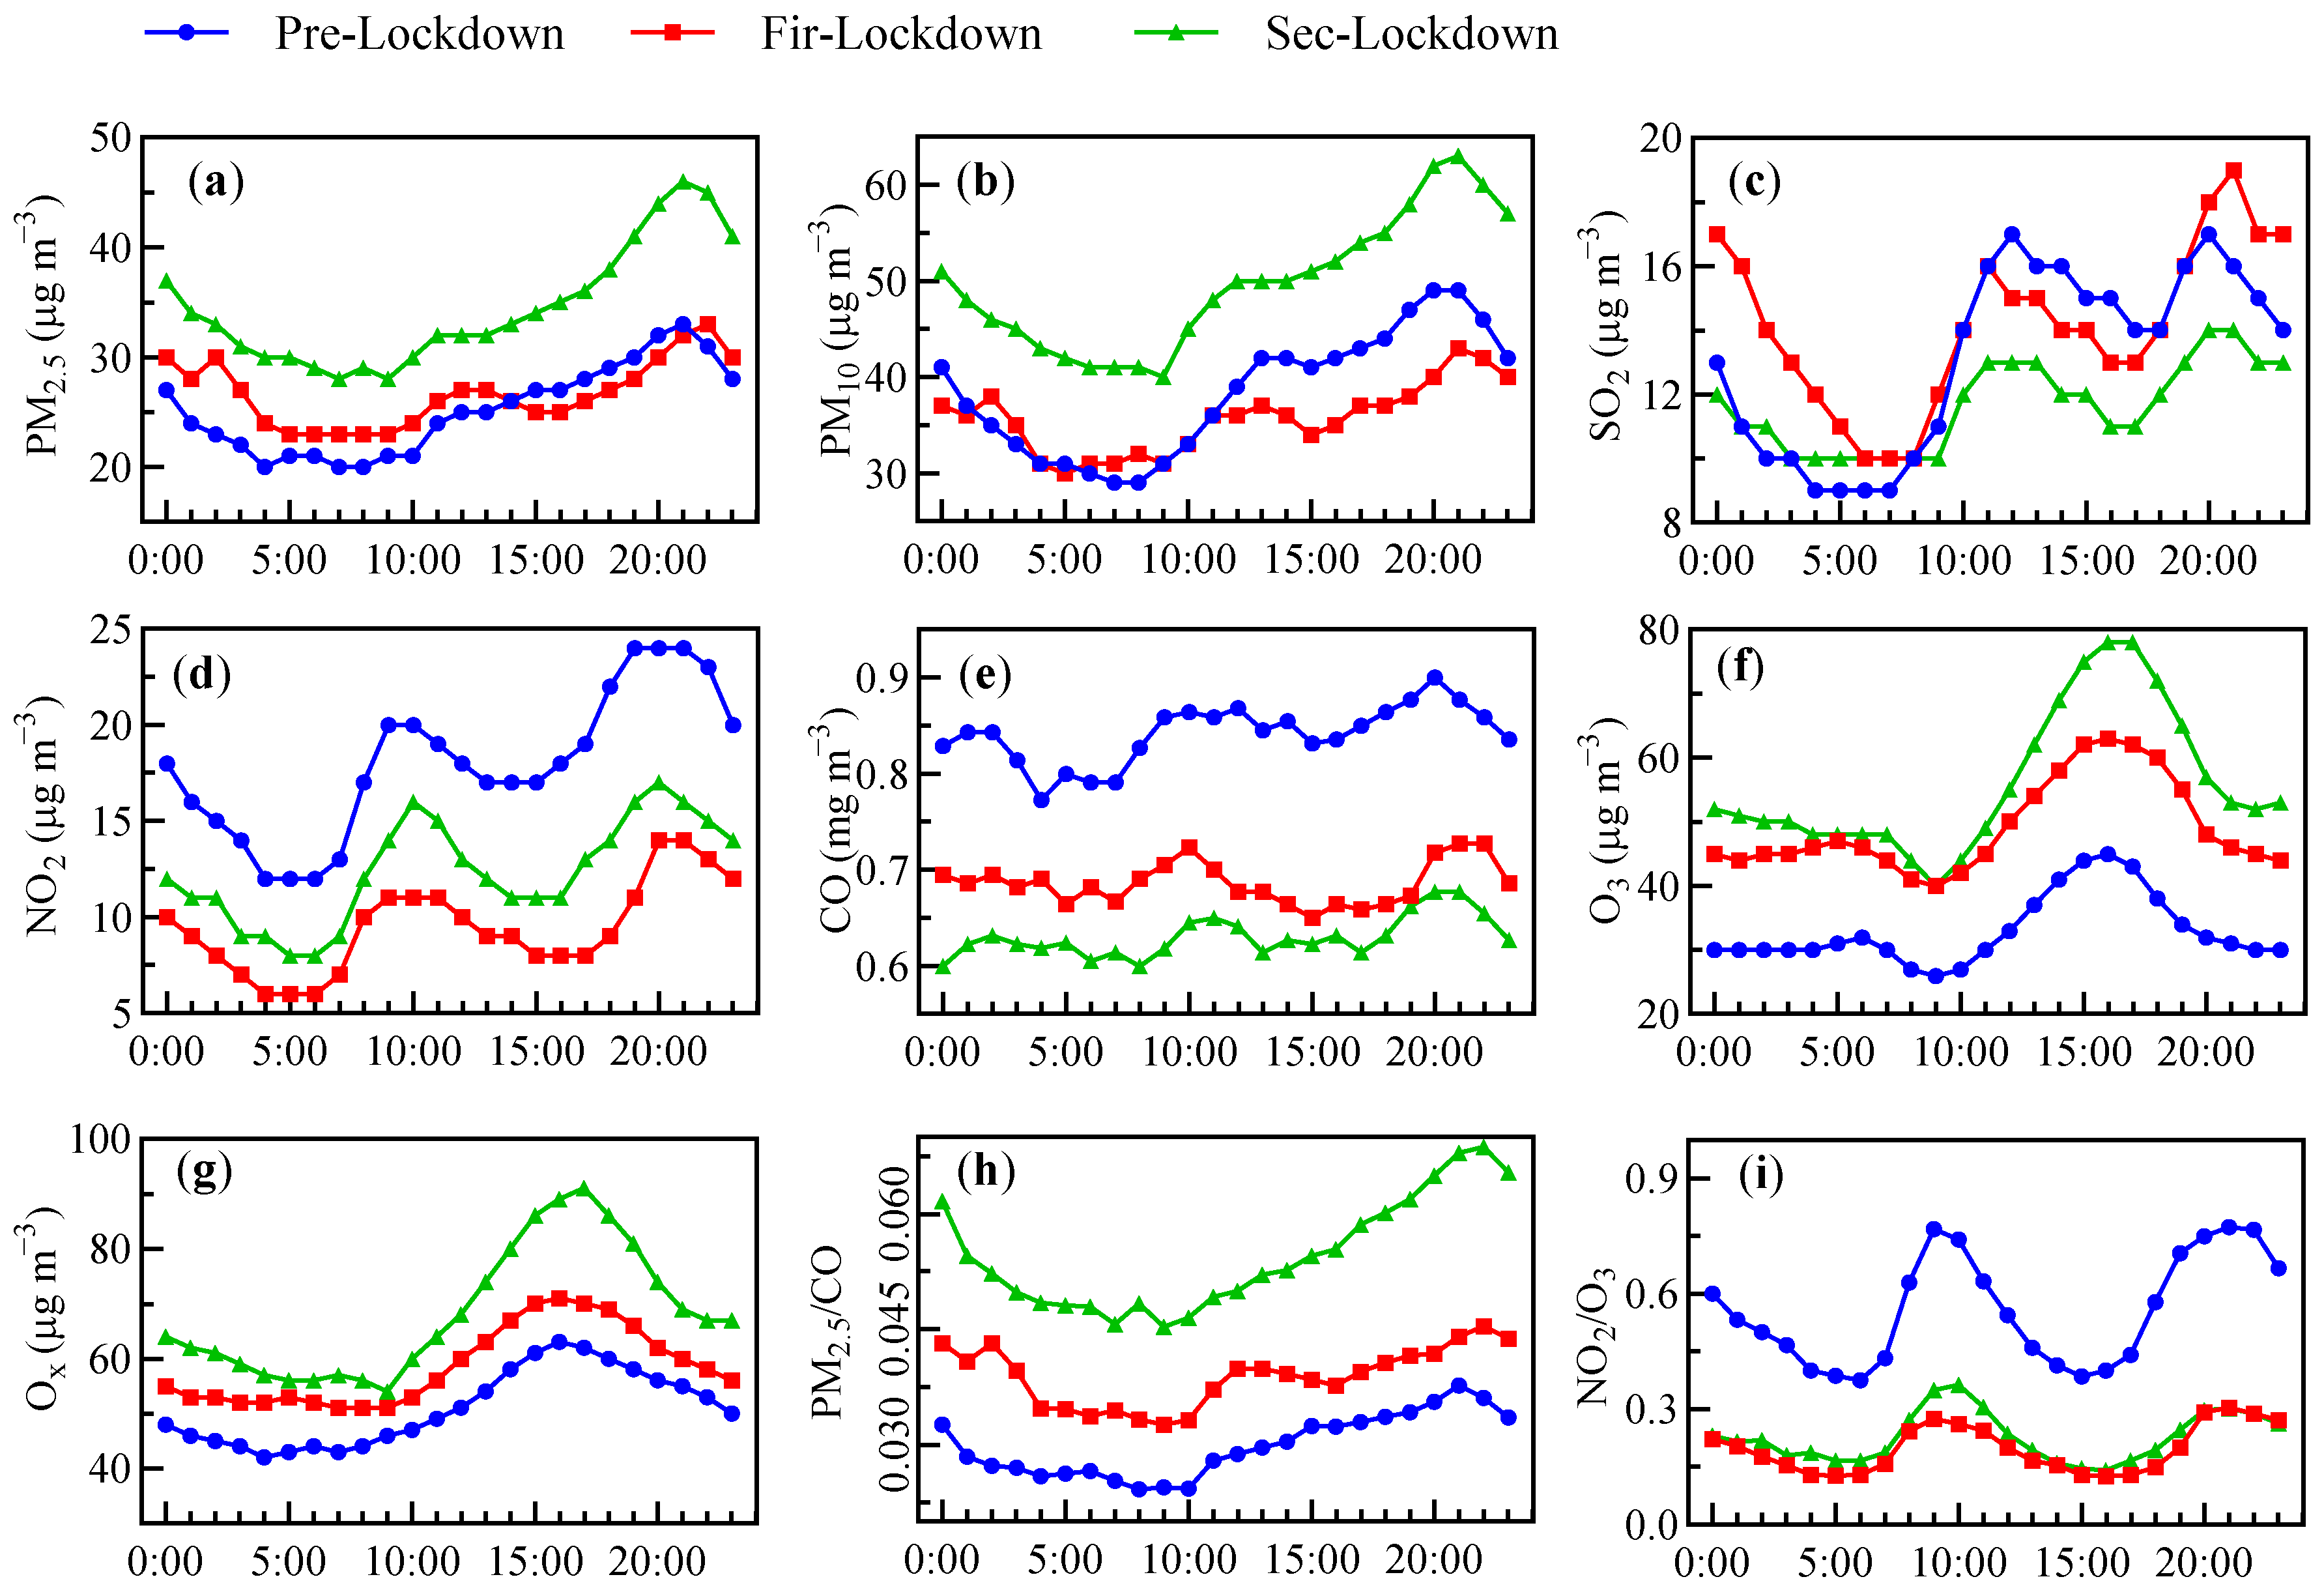
3.3. Change Characteristics of Hourly Mean Concentrations of Air Pollutants

Figure 4 shows that the diurnal variation curves of PM2.5, PM10, SO2, NO2, and CO concentrations all conformed to the “bimodal” distribution. The first peak occurred between 10:00 and 13:00, mainly caused by early-morning traffic peaks. NO2 concentration peaked at 10:00, which is the earliest, indicating that the changes in NO2 concentration were most affected by traffic sources. The concentrations of SO2 and CO reached their peak relatively late due to the different sources of pollution than NO2. The first peak characteristics of particulate PM2.5 and PM10 were not obvious, indicating that early-morning peak traffic emissions contributed insignificantly to particulate matter concentrations. The second peak occurred between 20:00 and 21:00, which was associated with the vertical transfer of airflow, the accumulation of pollutants caused by the lower height of the boundary layer at night, and the influence of the late peak emission of traffic [23]. Due to the variation in solar radiation and photochemical reactions, the diurnal variation curve of O3 concentration showed a “unimodal” type, which was high during the day and low at night, with the peak appearing at 16:00 in the afternoon.
The hourly mean concentration of PM2.5 during the Fir-Lockdown period was comparable with that during the Pre-Lockdown period, but the hourly mean concentration of PM10 in the daytime (11:00–20:00) during the Fir-Lockdown period was significantly lower. These results show that COVID-19 lockdown significantly reduced the PM10 concentration during the day, but had little effect on the PM10 concentration at night, and it had little effect on the change of PM2.5 concentration throughout the day. The differences in the diurnal variation characteristics of SO2 concentrations across the three stages were insignificant, reflecting the marginal effect of lockdown on SO2 concentrations. Unlike PM2.5, the concentrations of PM10, SO2, NO2, CO during lockdown periods were significantly lower than in the Pre-Lockdown period, indicating that they were most affected by lockdown. During the Fir-Lockdown period, the peak characteristics of NO2 and CO concentrations were clearly inconspicuous, which is related to the fact that there were barely any commuting traffic peaks appearing during the strict control period of COVID-19. Due to the decrease in NO concentrations, the “titration effect” diminished and the O3 concentrations rose significantly during lockdown periods (Figure 4f,i).

4. Discussion

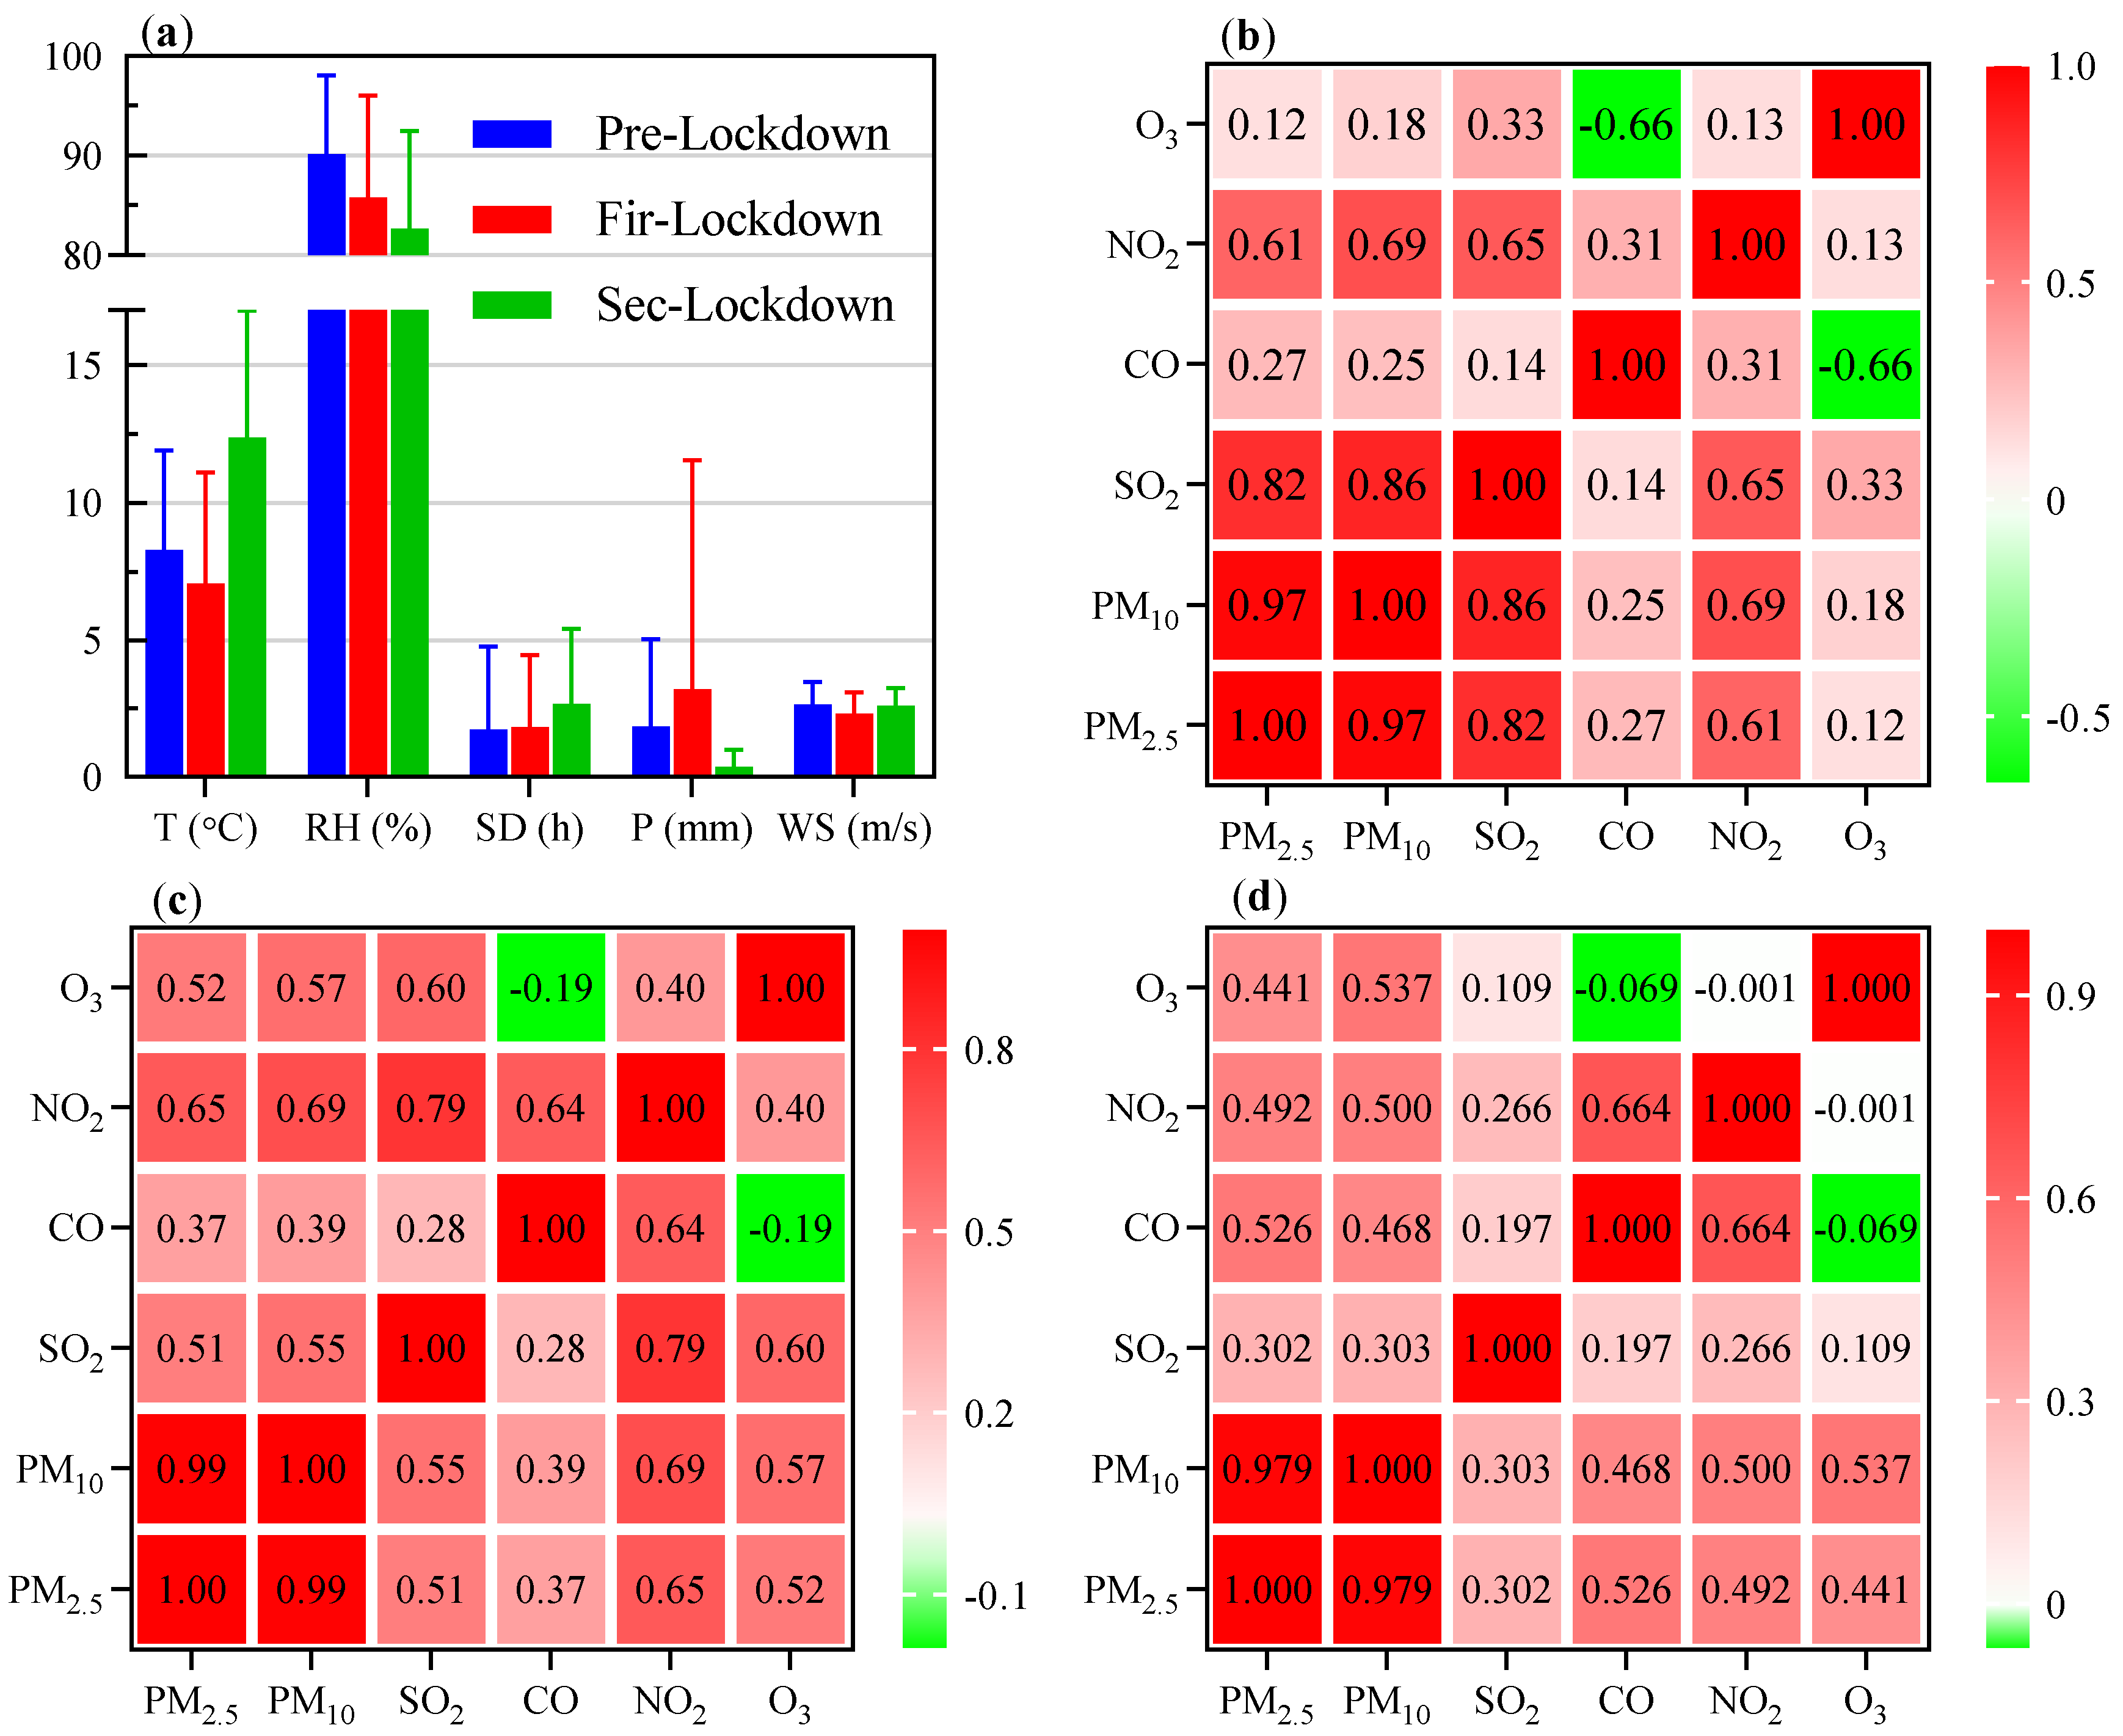
4.1. Effect of Meteorological Conditions on Air Pollutant Concentrations

The mean concentrations of PM2.5 and PM10 during the Sec-Lockdown period were significantly higher compared with those during the Pre-Lockdown period (Figure 2a). According to the diurnal variation results, the hourly mean concentrations of PM2.5 and PM10 during the Sec-Lockdown period were significantly higher compared with those during the previous two periods (Figure 4a,b), and the increase in particulate matter concentrations occurred during the Sec-Lockdown period under the conditions of reduced emissions as compared with those during the Pre-Lockdown period. In addition, during the Sec-Lockdown period, the levels of vehicle activity increased the concentrations of ambient NO2 (Figure 4d) due to the resumption of production, thereby increasing the “titration” consumption of O3 [12]. However, the O3 concentration increased significantly (Figure 2 and Figure 4f). Obviously, anthropogenic emission alone is inadequate to explain the above phenomena. Photochemical oxidation processes, sulfate–nitrate–ammonium systems, plus PM2.5 secondary generation also had an important contribution to the increased concentrations of particulate matter and O3 during the Sec-Lockdown period [24,25]. Figure 4f shows that the hourly mean concentration of O3 increased synchronously at all times during the Fir-Lockdown period compared with that during the Pre-Lockdown period. However, the hourly mean concentration of O3 increased significantly only in the daytime (11:00–20:00: photochemical reaction period) during the Sec-Lockdown period, the O3 concentration showed no significant variations at night. It is obvious that the increase in O3 concentration during the Fir-Lockdown period was mainly attributed to the decrease in NO concentration and the diminishing “titration effect”. In comparison, the increase in O3 concentration during the Sec-Lockdown period was more affected by photochemical reaction dominated by meteorological conditions [22].
The meteorological condition has significantly different effects on the changes in the concentrations of various air pollutants. Table 1 shows the relationship between daily mean concentrations of air pollutants and meteorological parameters from 3 January 2020 to 8 March 2020 in Guiyang city. Among them, the Pearson correlation coefficients of O3 and T, RH, and SD were 0.51, −0.77, and 0.58, respectively. The correlation coefficients were the largest, indicating that temperature, relative humidity, and sunshine hours had a significant effect on the change in O3 concentration. Temperature and sunshine hours were positively correlated with O3 concentration, and relative humidity was inversely correlated with O3 concentration, indicating that the longer the sunshine time, the higher the temperature and the lower the relative humidity, which was more conducive to the photochemical reaction to produce O3. The Pearson correlation coefficients of relative humidity and wind speed with SO2 were −0.58 and −0.51, respectively, showing a moderate negative correlation, which may indicate that small winds and high humidity weather was not conducive to the diffusion of SO2. In addition, T, RH, WS, SD, P, PM2.5, and PM10 also showed a certain degree of correlation, which comprehensively reflected the effects of diffusion and secondary generation of particulate pollutants. The Pearson correlation coefficients between the remaining meteorological parameters and the pollutant concentrations were relatively small, indicating that they had little effect on changes in air quality.
We compared the mean meteorological conditions of the three stages before and after the lockdown in 2020. The results show that the mean temperature and sunshine hours increased significantly, the relative humidity and precipitation decreased significantly, and the wind speed varied insignificantly during the Sec-Lockdown period compared with those during the previous stages (Figure 5a). It is evident that the meteorological conditions during the Sec-Lockdown period are more conducive to the occurrence of photochemical reaction, thus generating more O3 to increase its concentration in the air. In addition, due to the increase in sunshine hours during the Sec-Lockdown period, the temperature rose, the surface became too dry, and the dust on the surface was more likely to rise into the air, thus increasing the concentration of coarse particulate matter PM10 in the air (Figure 4b).

4.2. Generation of Secondary Aerosols and Its Impact on Air Quality

The diurnal variation of PM2.5 concentration during the Fir-Lockdown period was basically consistent with that during the Pre-Lockdown period, while the hourly concentration of PM10 decreased to some extent in the daytime (12:00–21:00) during the Fir-Lockdown period compared with the Pre-Lockdown period (Figure 4a,b), indicating that there are other potential sources of PM2.5 in the daytime during the Fir-Lockdown period to compensate for the reduction in emissions. The different degrees of variation in PM2.5 and PM10 concentrations before and after lockdown suggested that pollution variations cannot be fully explained by primary emissions, as the secondary aerosols generated by gas–particle transitions play an equally crucial role in the pollution process [26]. During the Sec-Lockdown period, meteorological conditions facilitated photochemical reactions to generate O3, thus increasing O3 concentrations (Figure 4f) and enhancing atmospheric oxidizing OX (Figure 4g). This is conducive to the secondary aerosols generated by gas–particle transitions, thus compensating for the reduced primary emission of PM2.5 [15]. PM2.5/CO is an effective indicator of the intensity of secondary aerosols generated, the value of which represents the efficiency of secondary aerosols generation [27]. The PM2.5/CO ratio was higher during the Sec-Lockdown period than that during the previous two stages (Figure 4h), indicating that the secondary generation of aerosols during the Sec-Lockdown period may contribute significantly to the high concentrations of PM2.5. As revealed by the analysis of the average particle number size distribution and chemical mass fraction of PM2.5 before and after the Spring Festival in Beijing, the generation of secondary aerosols during the Spring Festival offset the reduction in regional PM2.5 concentrations [27], which is consistent with our research records.
During the Pre-Lockdown period, the Pearson correlation coefficient between O3 and PM2.5 was 0.12 (Figure 5b), which was relatively weak. However, the Pearson correlation coefficients between O3 and PM2.5 during the first- and second-level lockdown periods were 0.52 and 0.44, respectively (Figure 5c,d), both showing a moderately positive correlation. The correlation difference before and during the lockdown periods reflects that the PM2.5 concentrations were significantly affected by the changes in the O3 concentration during the two lockdown periods, which may indicate that the O3 has increased the atmospheric oxidation, which in turn facilitated the conversion of gas to particulate matter to generate secondary aerosols. It has been pointed out in some prior studies that SO2 and NOx can be oxidized to generate sulfate and nitrate, respectively, through a variety of chemical pathways. Additionally, the secondary inorganic compounds in particulate matter are usually dominated by sulfate and nitrate [28,29,30]. The secondary aerosol formation of sulfate and nitrate is often the primary cause of the sharp rise in the PM2.5 concentrations [31]. During the Fir-Lockdown period, NO2 concentrations decreased substantially, while PM2.5 concentrations remained the same as the Pre-lockdown period, which may be attributed to SO2 reacting with OH radicals to generate more sulfate aerosols [32], thus replacing nitrate aerosols. Therefore, the PM2.5 concentration did not change much during the Fir-Lockdown period. During the Pre-Lockdown period, the Pearson correlation coefficient between SO2 and PM2.5 was 0.82 (Figure 5b), which was relatively strong. However, the Pearson correlation coefficients between SO2 and PM2.5 during the first and second level lockdown periods were 0.51 and 0.30, respectively (Figure 5c,d). The correlation degree between SO2 and PM2.5 decreased significantly, which may indicate that SO2 was more consumed to generate more sulfate aerosols during the two lockdown periods. The newly generated secondary aerosols are usually small in particle size and have almost no effect on the changes in PM10 concentration. Therefore, the PM10 concentration was low in the daytime during the Fir-Lockdown period. Sun et al. [33] conducted a study on the effect of lockdown on PM concentration and composition in Beijing, China, and obtained the results suggesting that the main varieties of PM associated with traffic, cooking, and coal-burning emissions were reduced by an average of 30–50% during the lockdown period. However, secondary inorganic aerosol (SIA) and secondary organic aerosol (SOA) increased by 60–110% and 52–175%, respectively, due to the enhanced regional delivery of air masses and generation of secondary aerosol.

4.3. Policy Implications for Quality Prevention and Control

Policy decisions are the most effective solution to reducing the emission of air pollutants and improving air quality, which is beneficial to human health and the environment. However, the emission reduction alone contributes only to reducing the primary pollutants in the air. Additionally, the chemical process of the atmosphere can be changed. Anthropogenic emission reduction would reduce NO concentration and diminish the “titration effect”, thus increasing O3 concentrations. Alternatively, the enhancement of atmospheric oxidizability would promote the generation of secondary aerosols through gas–particle conversion, thus compensating for the reduction in PM2.5 concentrations. Therefore, it is practically significant to develop appropriate air pollution control policies for suppressing the secondary generation of both PM2.5 and O3.

4.4. Existing Problems and Deficiencies

In this paper, we discussed only the effect caused by the generation of secondary aerosols on the concentration of various pollutants according to the characteristics of multi-time scale changes in air pollutant concentrations, the changes in atmospheric oxidizability at each stage, and the values of PM2.5/CO. However, there is a lack of understanding as to the generation of secondary aerosols and mechanisms of gas–particle conversion. Therefore, it is necessary to further observe the practical changes in the chemical composition of PM2.5 before and after lockdown, which will serve as a supplement to the research conducted in the future.

5. Conclusions

The effects of COVID-19 lockdown on the changes in concentrations of criteria air pollutants were significantly different. Compared with the Pre-Lockdown period, the mean concentrations of PM10, NO2, and CO decreased during the Fir-Lockdown period by 2.59 μg·m−3 (6.67%), 8.41 μg·m−3 (45.68%), and 159.09 μg·m−3 (18.82%), respectively. Due to the decrease in NO concentration and the weakening of “titration effect”, the mean concentration of O3 increased by 18.36 μg·m−3 (40.85%) compared with the Pre-Lockdown period. The mean concentration of PM2.5 and SO2 was slightly higher than that of the Pre-Lockdown period. Meteorological conditions had a significant effect on the pollutant concentrations, while the daily mean concentrations of PM2.5, PM10, SO2, NO2, CO, and O3 varied significantly with meteorological parameters in Guiyang city. The reduction in the lockdown level, the resumption of production, and other human activities have increased anthropogenic emissions, and the meteorological conditions are conducive to the formation of O3 by photochemical reactions and the accumulation of pollutants, resulting in the concentration of main pollutants PM2.5, PM10, and O3 increasing significantly during the Sec-Lockdown period. O3 concentrations increased and atmospheric oxidizability enhanced during the lockdown period, which is favorable to the generation of secondary aerosols by means of gas–particle transitions, thus compensating for the reduced PM2.5 concentrations. These results suggest the necessity to initiate appropriate policies on air pollution control while suppressing the secondary generation of both PM2.5 and O3.

Author Contributions

Conceptualization, Z.S.; investigation, Y.L.; methodology, B.D.; writing—original draft, X.L. and Z.S.; writing—review and editing, Z.S. All authors have read and agreed to the published version of the manuscript.

Funding

This work was supported by the National Natural Science Foundation of China (no. 41964005).

Institutional Review Board Statement

Not applicable.

Informed Consent Statement

Not applicable.

Data Availability Statement

Data are contained within the article.

Conflicts of Interest

The authors declare no conflict of interest. The funders had no role in the design of the study; in the collection, analyses, or interpretation of data; in the writing of the manuscript, or in the decision to publish the results.

References

  1. Rajbhandari, B.; Phuyal, N.; Shrestha, B.; Thapa, M. Air Medical Evacuation of Nepalese Citizen during Epidemic of COVID-19 from Wuhan to Nepal. J. Nepal Med. Assoc. 2020, 58, 125–133. [Google Scholar] [CrossRef]
  2. Cohen, J.; Kupferschmidt, K. Strategies shift as coronavirus pandemic looms. Science 2020, 367, 962–963. [Google Scholar] [CrossRef] [PubMed] [Green Version]
  3. Pepe, E.; Bajardi, P.; Gauvin, L.; Privitera, F.; Lake, B.; Cattuto, C.; Tizzoni, M. COVID-19 outbreak response: A first assessment of mobility changes in Italy following national lockdown. Sci. Data 2020, 7, 230. [Google Scholar] [CrossRef] [PubMed]
  4. Li, L.; Li, Q.; Huang, L.; Wang, Q.; Zhu, A.; Xu, J.; Liu, Z.; Li, H.; Shi, L.; Li, R.; et al. Air quality changes during the COVID-19 lockdown over the Yangtze River Delta Region: An insight into the impact of human activity pattern changes on air pollution variation. Sci. Total Environ. 2020, 732, 139–282. [Google Scholar] [CrossRef] [PubMed]
  5. Xu, C.; Wu, S.; Liu, Y.; Zhong, X. Response of Air Quality to COVID-19 Lockdown in Xiamen Bay. Environ. Sci. 2021, 42, 4650–4659. (In Chinese) [Google Scholar]
  6. Le, T.; Wang, Y.; Liu, L.; Yang, J.; Yung, Y.L.; Li, G.; Seinfeld, J.H. Unexpected air pollution with marked emission reductions during the COVID-19 outbreak in China. Science 2020, 369, 702–706. [Google Scholar] [CrossRef]
  7. Bray, C.D.; Nahas, A.; Battye, W.H.; Aneja, V.P. Impact of lockdown during the COVID-19 outbreak on multi-scale air quality. Atmos. Environ. 2021, 254, 118386. [Google Scholar] [CrossRef]
  8. Chen, J.; Feng, X.; Li, Y.; Wang, S. Analysis of Air Quality and Influencing Factors in Sichuan Basin during the COVID-19. Environ. Sci. 2021, 1–12. (In Chinese). Available online: https://kns.cnki.net/kcms/detail/detail.aspx?dbcode=CAPJ&dbname=CAPJLAST&filename=HJKZ2021061000C&uniplatform=NZKPT&v=xQUCJGvGRRGjisa01h7n4jmUlfGKfAa6nfJP2PVQBztmGpX7l3BUGiZmWDewuSKd (accessed on 4 November 2021).
  9. Lee, J.D.; Drysdale, W.S.; Finch, D.P.; Wilde, S.E.; Palmer, P.I. UK surface NO2 levels dropped by 42% during the COVID-19 lockdown: Impact on surface O3. Atmos. Chem. Phys. 2020, 20, 15743–15759. [Google Scholar] [CrossRef]
  10. Su, Z.; Duan, Z.; Deng, B.; Liu, Y.; Chen, X. Impact of the COVID-19 Lockdown on Air Quality Trends in Guiyang, Southwestern China. Atmosphere 2021, 12, 422. [Google Scholar] [CrossRef]
  11. Shi, X.; Brasseur, G.P. The Response in Air Quality to the Reduction of Chinese Economic Activities during the COVID-19 Outbreak. Geophys. Res. Lett. 2020, 47, e2020GL088070. [Google Scholar] [CrossRef] [PubMed]
  12. Levy, M.; Zhang, R.; Zheng, J.; Zhang, A.; Xu, W.; Gomez Hernandez, M.; Wang, Y.; Olaguer, E.P. Measurements of nitrous acid (HONO) using ion drift-chemical ionization mass spectrometry during the 2009 SHARP field campaign. Atmos. Environ. 2014, 94, 231–240. [Google Scholar] [CrossRef]
  13. Shi, Z.; Song, C.; Liu, B.; Lu, G.; Xu, J.; Van Vu, T.; Elliott, R.J.R.; Li, W.; Bloss, W.J.; Harrison, R.M. Abrupt but smaller than expected changes in surface air quality attributable to COVID-19 lockdowns. Sci. Adv. 2021, 7, eabd6696. [Google Scholar] [CrossRef] [PubMed]
  14. Hammer, M.S.; van Donkelaar, A.; Martin, R.V.; McDuffie, E.E.; Lyapustin, A.; Sayer, A.M.; Hsu, N.C.; Levy, R.C.; Garay, M.J.; Kalashnikova, O.V.; et al. Effects of COVID-19 lockdowns on fine particulate matter concentrations. Sci. Adv. 2021, 7, eabg7670. [Google Scholar] [CrossRef] [PubMed]
  15. Adam, M.G.; Tran, P.T.M.; Balasubramanian, R. Air quality changes in cities during the COVID-19 lockdown: A critical review. Atmos. Res. 2021, 264, 105823. [Google Scholar] [CrossRef]
  16. Wang, P.; Chen, K.; Zhu, S.; Wang, P.; Zhang, H. Severe air pollution events not avoided by reduced anthropogenic activities during COVID-19 outbreak. Resour. Conserv. Recycl. 2020, 158, 104814. [Google Scholar] [CrossRef]
  17. Shu, Z.; Zhao, T.; Zheng, X.; Qiu, Y.; Shi, R.; Jia, M. Air quality variations and meteorological drivers of Guiyang city in clean atmospheric environment. China Environ. Sci. 2017, 37, 4460–4468. (In Chinese) [Google Scholar]
  18. Shang, Y.; Shu, Z.; Zheng, X.; Zhao, T.; Liao, Y.; Jia, M. Interaction Mechanism between PM2.5 and O3 in Winter and Summer in Yunnan-Guizhou Plateau: A Case Study of Guiyang. Ecol. Environ. Sci. 2018, 27, 2284–2289. (In Chinese) [Google Scholar]
  19. Su, Z.; Han, H.; Chen, B. Spatial and temporal variation and combined pollution characteristics of atmospheric pollutants in urban Guiyang. Carsologica Sin. 2020, 39, 442–452. (In Chinese) [Google Scholar]
  20. Venter, Z.S.; Aunan, K.; Chowdhury, S.; Lelieveld, J. COVID-19 lockdowns cause global air pollution declines. Proc. Natl. Acad. Sci. USA 2020, 117, 18984–18990. [Google Scholar] [CrossRef]
  21. Li, R.; Mei, X.; Wei, L.; Han, X.; Zhang, M.; Jing, Y. Study on the contribution of transport to PM2.5 in typical regions of China using the regional air quality model RAMS-CMAQ. Atmos. Environ. 2019, 214, 116856. [Google Scholar] [CrossRef]
  22. Wang, Z.; Li, Y.; Chen, T.; Zhang, D.; Sun, F.; Wei, Q.; Dong, X.; Sun, R.; Huan, N.; Pan, L. Ground-level ozone in urban Beijing over a 1-year period: Temporal variations and relationship to atmospheric oxidation. Atmos. Res. 2015, 164–165, 110–117. [Google Scholar] [CrossRef]
  23. Cheung, V.T.F.; Wang, T. Observational study of ozone pollution at a rural site in the Yangtze Delta of China. Atmos. Environ. 2001, 35, 4947–4958. [Google Scholar] [CrossRef]
  24. Shah, V.; Jaegle, L.; Thornton, J.A.; Lopez-Hilfiker, F.D.; Lee, B.H.; Schroder, J.C.; Campuzano-Jost, P.; Jimenez, J.L.; Guo, H.; Sullivan, A.P.; et al. Chemical feedbacks weaken the wintertime response of particulate sulfate and nitrate to emissions reductions over the eastern United States. Proc. Natl. Acad. Sci. USA 2018, 115, 8110–8115. [Google Scholar] [CrossRef] [Green Version]
  25. Pozzer, A.; Tsimpidi, A.P.; Karydis, V.A.; de Meij, A.; Lelieveld, J. Impact of agricultural emission reductions on fine-particulate matter and public health. Atmos. Chem. Phys. 2017, 17, 12813–12826. [Google Scholar] [CrossRef] [Green Version]
  26. Chen, H.; Huo, J.; Fu, Q.; Duan, Y.; Xiao, H.; Chen, J. Impact of quarantine measures on chemical compositions of PM2.5 during the COVID-19 epidemic in Shanghai, China. Sci. Total Environ. 2020, 743, 140758. [Google Scholar] [CrossRef] [PubMed]
  27. Wang, Y.; Li, Z.; Wang, Q.; Jin, X.; Yan, P.; Cribb, M.; Li, Y.; Yuan, C.; Wu, H.; Wu, T.; et al. Enhancement of secondary aerosol formation by reduced anthropogenic emissions during Spring Festival 2019 and enlightenment for regional PM2.5 control in Beijing. Atmos. Chem. Phys. 2021, 21, 915–926. [Google Scholar] [CrossRef]
  28. Heintzenberg, J. Fine particles in the global troposphere: A review. Tellus B 1989, 41, 149–160. [Google Scholar] [CrossRef]
  29. Wang, G.; Zhang, R.; Gomez, M.E.; Yang, L.; Zamora, M.L.; Hu, M.; Lin, Y.; Peng, J.; Guo, S.; Meng, J.; et al. Persistent sulfate formation from London Fog to Chinese haze. Proc. Natl. Acad. Sci. USA 2016, 113, 13630–13635. [Google Scholar] [CrossRef] [PubMed] [Green Version]
  30. Gen, M.; Zhang, R.; Huang, D.D.; Li, Y.; Chan, C.K. Heterogeneous SO2 Oxidation in Sulfate Formation by Photolysis of Particulate Nitrate. Environ. Sci. Technol. Lett. 2019, 6, 86–91. [Google Scholar] [CrossRef]
  31. Sun, W.; Wang, D.; Yao, L.; Fu, H.; Wang, H.; Li, Q.; Wang, L.; Yang, L.; Xian, A.; Wang, G.; et al. Chemistry-triggered events of PM2.5 explosive growth during late autumn and winter in Shanghai, China. Environ. Pollut. 2019, 254, 112864. [Google Scholar] [CrossRef] [PubMed]
  32. Wang, G.; Zhang, F.; Peng, J.; Duan, L.; Ji, Y.; Marrero-Ortiz, W.; Wang, J.; Li, J.; Wu, C.; Cao, C.; et al. Particle acidity and sulfate production during severe haze events in China cannot be reliably inferred by assuming a mixture of inorganic salts. Atmos. Chem. Phys. 2018, 18, 10123–10132. [Google Scholar] [CrossRef] [Green Version]
  33. Sun, Y.; Lei, L.; Zhou, W.; Chen, C.; He, Y.; Sun, J.; Li, Z.; Xu, W.; Wang, Q.; Ji, D.; et al. A chemical cocktail during the COVID-19 outbreak in Beijing, China: Insights from six-year aerosol particle composition measurements during the Chinese New Year holiday. Sci. Total Environ. 2020, 742, 140739. [Google Scholar] [CrossRef] [PubMed]
Figure 1. Geographical location of Guiyang city and its distribution of air quality stations (based on Google Earth).
Atmosphere 12 01490 g001
Figure 2. (a) Stage mean concentrations of air pollutants before and during the COVID-19 periods in 2020. (b) comparison of pollutant concentrations during the Fir-Lockdown period in 2020 with previous year of 2019, 2018, and 2017. Error bars indicate the standard deviations over multiple days (2020: the Fir-Lockdown period in 2020; 2019–2017: the same lunar period in 2019, 2018 and 2017 compared with the Fir-Lockdown period in 2020, respectively).
Atmosphere 12 01490 g002
Figure 3. Daily mean pollutant concentrations and meteorological parameters from 3 January 2020 to 8 March 2020 in Guiyang city. (a) PM2.5, PM10, (b) SO2, CO, (c) NO2, O3, (d) T: temperature, RH: relative humidity, (e) SD: sunshine duration, P: precipitation, (f) WS: wind speed.
Atmosphere 12 01490 g003
Figure 4. Hourly mean values of air pollutants and its ratios in a day during the Pre-Lockdown, Fir-Lockdown, and Sec-Lockdown stage. (a) PM2.5, (b)PM10, (c) SO2, (d) NO2, (e) CO, (f) O3, (g) Ox, (h) PM2.5/CO, (i) NO2/O3.
Atmosphere 12 01490 g004
Figure 5. (a) Comparison of mean meteorological parameters during the Pre-Lockdown, Fir-Lockdown, and Sec-Lockdown stage, error bars indicate the standard deviations over multiple days. (bd) Correlation heat map among daily mean concentrations of pollutants during the Pre-Lockdown, Fir-Lockdown and Sec-Lockdown period, respectively.
Atmosphere 12 01490 g005
Table 1. Pearson correlation coefficients between daily mean concentrations of air pollutants and meteorological parameters from 3 January 2020 to 8 March 2020 in Guiyang city (T: temperature, SD: sunshine duration, WS: wind speed, RH: relative humidity, P: precipitation, AP: atmospheric pressure).
Pollutant ItemTRHWSSDPAP
PM2.50.29−0.36−0.350.17−0.33−0.05
PM100.41−0.42−0.300.25−0.36−0.12
SO2−0.02−0.58−0.510.38−0.240.09
CO−0.230.41−0.30−0.23−0.11−0.12
NO20.19−0.01−0.220.17−0.15−0.34
O30.51−0.770.040.58−0.15−0.16
Note: The confidence levels are all α = 0.01 (two-sided test).
Publisher’s Note: MDPI stays neutral with regard to jurisdictional claims in published maps and institutional affiliations.

