Article

VOCs Fugitive Emission Characteristics and Health Risk Assessment from Typical Plywood Industry in the Yangtze River Delta Region, China

1
Collaborative Innovation Center of Atmospheric Environment and Equipment Technology, Jiangsu Key Laboratory of Atmospheric Environment Monitoring and Pollution Control, School of Environmental Science and Engineering, Nanjing University of Information Science & Technology, Nanjing 210044, China
2
School of Environment and Chemical Engineering, Shanghai University, Shanghai 200444, China
3
Jiangsu Changhuan Environment Technology Co., Ltd., Changzhou 213002, China
4
Nanjing Intelligent Environmental Science and Technology Co., Ltd., Nanjing 211800, China
*
Author to whom correspondence should be addressed.
Atmosphere 2021, 12(11), 1530; https://doi.org/10.3390/atmos12111530
Submission received: 2 November 2021 / Revised: 17 November 2021 / Accepted: 17 November 2021 / Published: 20 November 2021
(This article belongs to the Special Issue VOC Sensing and Measurements)

Abstract

:
Volatile organic compounds (VOCs) emissions from the plywood manufacturing industry in China have received concerns during recent years. A total of 115 VOCs were measured in the adhesive-making, adhesive-coating, and hot-pressing workshops of the plywood manufacturing industry to investigate fugitive emission characteristics of VOCs and assess their health risks to workers. The average concentration of total VOCs in workshops of the plywood manufacturing industry is 467 ± 359 μg/m3, whereas the value for ambient air is 81.4 μg/m3. For specific processes, the adhesive-coating and hot-pressing processes show higher VOCs concentrations (501 μg/m3–519 μg/m3) than the adhesive-making process (340 μg/m3). Formaldehyde, ethyl acetate, and dichloromethane are the three most abundant VOCs in workshops, with relative contributions to total VOCs of 55.9–63.1%, 4.3–11.0%, and 1.7–4.4%, respectively. For ozone formation potential (OFP) of VOCs, formaldehyde is the largest contributor (86.1%), followed by toluene, xylenes, and propanal. The non-cancer toxic risks (HI) and cancer risks of total VOCs (T-LCR) for three processes are calculated as 2.93–3.94 and 2.86–4.17 × 10⁻⁴ using the US EPA recommended methods, both significantly higher than threshold values (1.0 for HI and 10−4 for LCR), suggesting the highly toxic and cancer risks to workers. Formaldehyde contributes 68.1–78.2% and 91.4–93.9% of HI and T-LCR, respectively. The designed risk reduction scheme of VOCs based on air ventilation suggests that air ventilation rates of formaldehyde need to reach 4–5 times in 8 h in three processes to reduce T-LCR to 10−5. These results are useful for developing VOCs control measures and evaluating VOCs occupational health risk for workers in the plywood manufacturing industry.

1. Introduction

In recent years, with the rapid development of the social economy and the continuous advancement of urbanization level, air quality in China has presented composite pollution characterized by fine particulate matter (PM2.5) and ground-level ozone (O3) [1,2]. As important precursors of PM2.5 and O3, ambient volatile organic compounds (VOCs) play a critical role in the formation of secondary air pollutants [3,4]. In addition, some studies have shown that many VOC species are hazardous air pollutants (HAPs) [5,6], such as formaldehyde, benzene, chloroform, etc., which are classified as carcinogens by the International Agency for Research on Cancer (IARC) [7,8].
According to the statistics from the Food and Agriculture Organization of the United Nations (FAO), China has become the largest producer of wood-based panels, accounting for 53.1% of the global yield in 2016 [9]. The plywood manufacturing industry is an important branch of the wood-based panels manufacturing industry. In 2019, the yield of plywood in China was 180.6 million m3, accounting for 58.3% of the total wood-based panel yield [10]. The plywood manufacturing industry usually uses organic adhesives as raw materials, and thus will emit extensive VOCs into the atmosphere [11,12]. According to the technical guidelines for the emission inventories of VOCs issued by the Ministry of Ecology and Environment of China, the recommended emission factor of VOCs from the plywood manufacturing industry is 0.5 g VOCs/m3 [13]. Therefore, VOCs emission of plywood industry in China is about 900 t per year. Plywood manufacturing factories in China are mainly small-sized and medium-sized [14]. The collection and treatment efficiencies of exhaust gas in these factories are still low, and thus fugitive emissions of VOCs are not ignorable. Some studies have reported the emission characteristics of VOCs from the plywood manufacturing industry, but most of them focused on organized emissions [12,14,15]. Few studies focus on fugitive VOCs emissions. The adhesives commonly used in plywood manufacturing mainly include urea-formaldehyde (UF) resin, phenol-formaldehyde (PF) resin, and melamine-formaldehyde (MF) resin. Formaldehyde is the most important raw material for these adhesives [11,14,16], and thus it can be emitted into the atmosphere through processes of adhesive-making, adhesive-coating, and hot-pressing in the plywood manufacturing industry [12]. The lack of formaldehyde measurement could lead to underestimation of VOCs emission and health risk assessment.
Long-term exposure to workshop air with high-level VOCs concentrations is harmful to human health [17,18]. The widely used health risk assessment methods of VOCs mainly include non-cancer risk and lifetime cancer risk methods developed by the Environmental Protection Agency of United States (US EPA) [7,19], as well as the threshold limit values (TLV) method recommended by the American Conference of Governmental Industrial Hygienists (ACGIH) [18,20]. Some studies have used these methods to evaluate the health risk of VOCs in petrochemical, chemical, and other industries [19,21,22]. Oxygenated VOCs (OVOCs), halocarbons, and aromatics were identified as major components resulting in health risk, but the specific VOC for different industries showed some discrepancies.
In this study, we collected VOCs samples in workshops (i.e., fugitive emission samples) in the typical plywood manufacturing factories using 2,4-dinitrophenylhydrazine (DNPH) and stainless steel canisters. A total of 115 VOC species were then quantitatively analyzed, including alkanes, alkenes, acetylene, aromatics, halocarbons, OVOCs, and organic sulfur. On this basis, we then analyzed the concentration levels and chemical compositions of VOCs emitted from different processes, then calculated the health risks of VOCs using US EPA and ACGIH-recommended methods for indoor air and the ozone formation potential (OFP) for outdoor air pollution. The research results will be helpful for understanding the characteristics of fugitive VOCs, developing VOCs control measures, and evaluating occupational health risks of VOCs for workers in the plywood manufacturing industry.

2. Methodology

2.1. VOCs Sampling

Figure 1 shows the typical manufacturing processes of the plywood industry. The adhesives are made and coated on the base materials (such as wood, particleboards, decorative paper, etc.), which are then compressed by rollers to remove excess adhesives. After sorting and assembling, these panels will be pressed at high temperatures (170–190 °C), and then trimmed and packaged into the final products. Previous studies suggested that VOCs are mainly released from processes related to the production and use of adhesives, such as adhesive making and adhesive coating [12]. Additionally, the process of hot pressing also emits VOCs due to the high temperature will vaporize adhesives that have been coated in panels [14].
In this study, six plywood manufacturing factories were selected to collect VOCs samples in workshops of adhesive making, adhesive coating, and hot pressing. A total of 39 samples were collected in workshops and 4 ambient background air samples were simultaneously collected for comparison. These ambient background samples were collected close to the factories, away from (>200 m) production workshops. Carbonyl compounds were collected using DNPH columns (ST03-0025, HuanCe Experiment Equipment, Ningbo, China). The flow rate of DNPH sampling was set as 600 mL/min, and the sampling duration time was 60 min. Whole air samples were collected using stainless steel canisters (3.2 L, Entech Instruments, Simi Valley, CA, USA). Before sampling, the stainless steel canisters were cleaned and vacuumed to internal pressure less than 6.67 Pa (i.e., 50 mTorr) using an automated canister cleaner (3100, Entech Instruments, Simi Valley, CA, USA) with high purity nitrogen (99.999%). A flow controller (cs2100e, Entech Instruments, Simi Valley, CA, USA) was used to keep the flow rate as 2 L/h during the 60-min sampling.

2.2. VOCs Instrumental Analyses

Thirteen carbonyl compounds were quantitatively analyzed using high-performance liquid chromatography (HPLC) (Waters 1260 infinity, Agilent Technologies, Santa Clara, CA, USA). These compounds were separated on the C18 column and then detected by an ultraviolet detector at 360 nm. A ternary mixture of water, acetonitrile, and tetrahydrofuran was used as the mobile phase of HPLC. The carbonyls measured in this study included formaldehyde, acetaldehyde, acetone, acrolein, propanal, n-butanal, 2-butanone, methacrylaldehyde, n-butyraldehyde, benzaldehyde, glutaraldehyde, m-methylbenzaldehyde, and n-hexanal. The determination coefficient values (R2) of the calibration curves for these target components were all larger than 0.999, and the method detection limits (MDLs) ranged from 0.1 μg/m3 to 0.6 μg/m3.
One hundred and two VOCs in the whole air samples were quantitatively analyzed using a cryogen-free automatic gas chromatograph system equipped with a mass spectrometer detector (MSD) and a flame ionization detector (FID) (5977B GC/MSD, Agilent Technologies, Santa Clara, CA, USA). Thirteen C2–C5 non-methane hydrocarbons (NMHCs) were trapped on a 15-cm PLOT column at −160 °C, separated using a 15-m PLOT column, and detected by the FID. The other VOCs, including 44 C5-C12 NMHCs, 35 halocarbons, nine OVOCs, and one organic sulfur were trapped on a 15-cm deactivated capillary column and separated using a 60-m DB-624 column, and detected by the MSD. The determination coefficient values (R2) of the calibration curves for these target species were all larger than 0.999. The MDLs were in the range of 0.01–0.38 μg/m3. Detailed descriptions of this system can be found in the literature [23].

2.3. Health Risk Assessment of VOCs Using the US EPA-Recommend Method

In this study, hazard index (HI) and lifetime cancer risk (LCR) for long-term exposure of VOCs were used to assess toxic (non-cancer) or carcinogenic effects of VOCs, respectively [24].
The HI is calculated as the sum of the non-cancer risk hazard quotient (HQi) for individual VOC species i, which can be calculated using Equations (1) and (2):
HQi= ECi/RfCi
ECi = (MCi × ET × EF × ED)/(AT × 365 days × 24 h)
where RfCi is the reference concentration for the compound i (mg/m3), which means the estimated daily inhalation exposure that has no significant harmful health risk throughout a person’s whole lifetime. The RfC values for individual VOC species are obtained from the Integrated Risk Information System (IRIS), the Provisional Peer Reviewed Toxicity Values of IRIS (PPRTV), the Agency for Toxic Substances and Disease Registry (ATSDR), the Office of Environmental Health Hazard Assessment (OEHHA), the International Agency for Research on Cancer (IARC), the Office of Air Quality Planning and Standards (OAQPS), or the US EPA Health Effects Assessment Summary Tables (HEAST) (Table S1). ECi is the inhalation exposure concentration of VOCs (μg/m3). MCi is the mass concentration of VOCs measured in workshops (μg/m3). ET and EF are the daily exposure time and exposure frequency, which are assumed as 8 h/day and 240 day/year, respectively. ED is the exposure duration years, which is assumed as 30 years according to the statutory retirement ages (50 for female workers and 55 for male workers) in China. AT means the average life expectancy, which is assumed as 70 years.
The total lifetime cancer risk (T-LCR) of VOCs refers to the sum of LCRi for individual VOC species i, which can be calculated based on ECi and the upper-bound of inhalation cancer risk (IURi) using Equation (3):
LCRi = ECi × IURi × 1000 μg/mg
The IURi data for individual VOCs are obtained from the IRIS, OEHHA, or IARC (Table S1).

2.4. Health Risk Assessment of VOCs Using the ACGIH-Recommend Method

The total occupational exposure cancer risk (T-OECR) of VOCs refers to the sum of OECRi for individual VOC species, which is calculated based on the time-weighted average (i.e., 8 working hours per day and 40 working hours per week) threshold limit values (TLV-TWAs) using Equation (4):
OECR i = i n MC i TLV TWA i
where MCi means the mass concentration of individual VOCs i measured in workshops (mg/m3). The TLV-TWA values (mg/m3) for individual VOC species are provided by the ACGIH [25] (Table S1).

3. Results and Discussion

3.1. Fugitive Emission Characteristics of VOCs

3.1.1. General Characteristics of VOCs

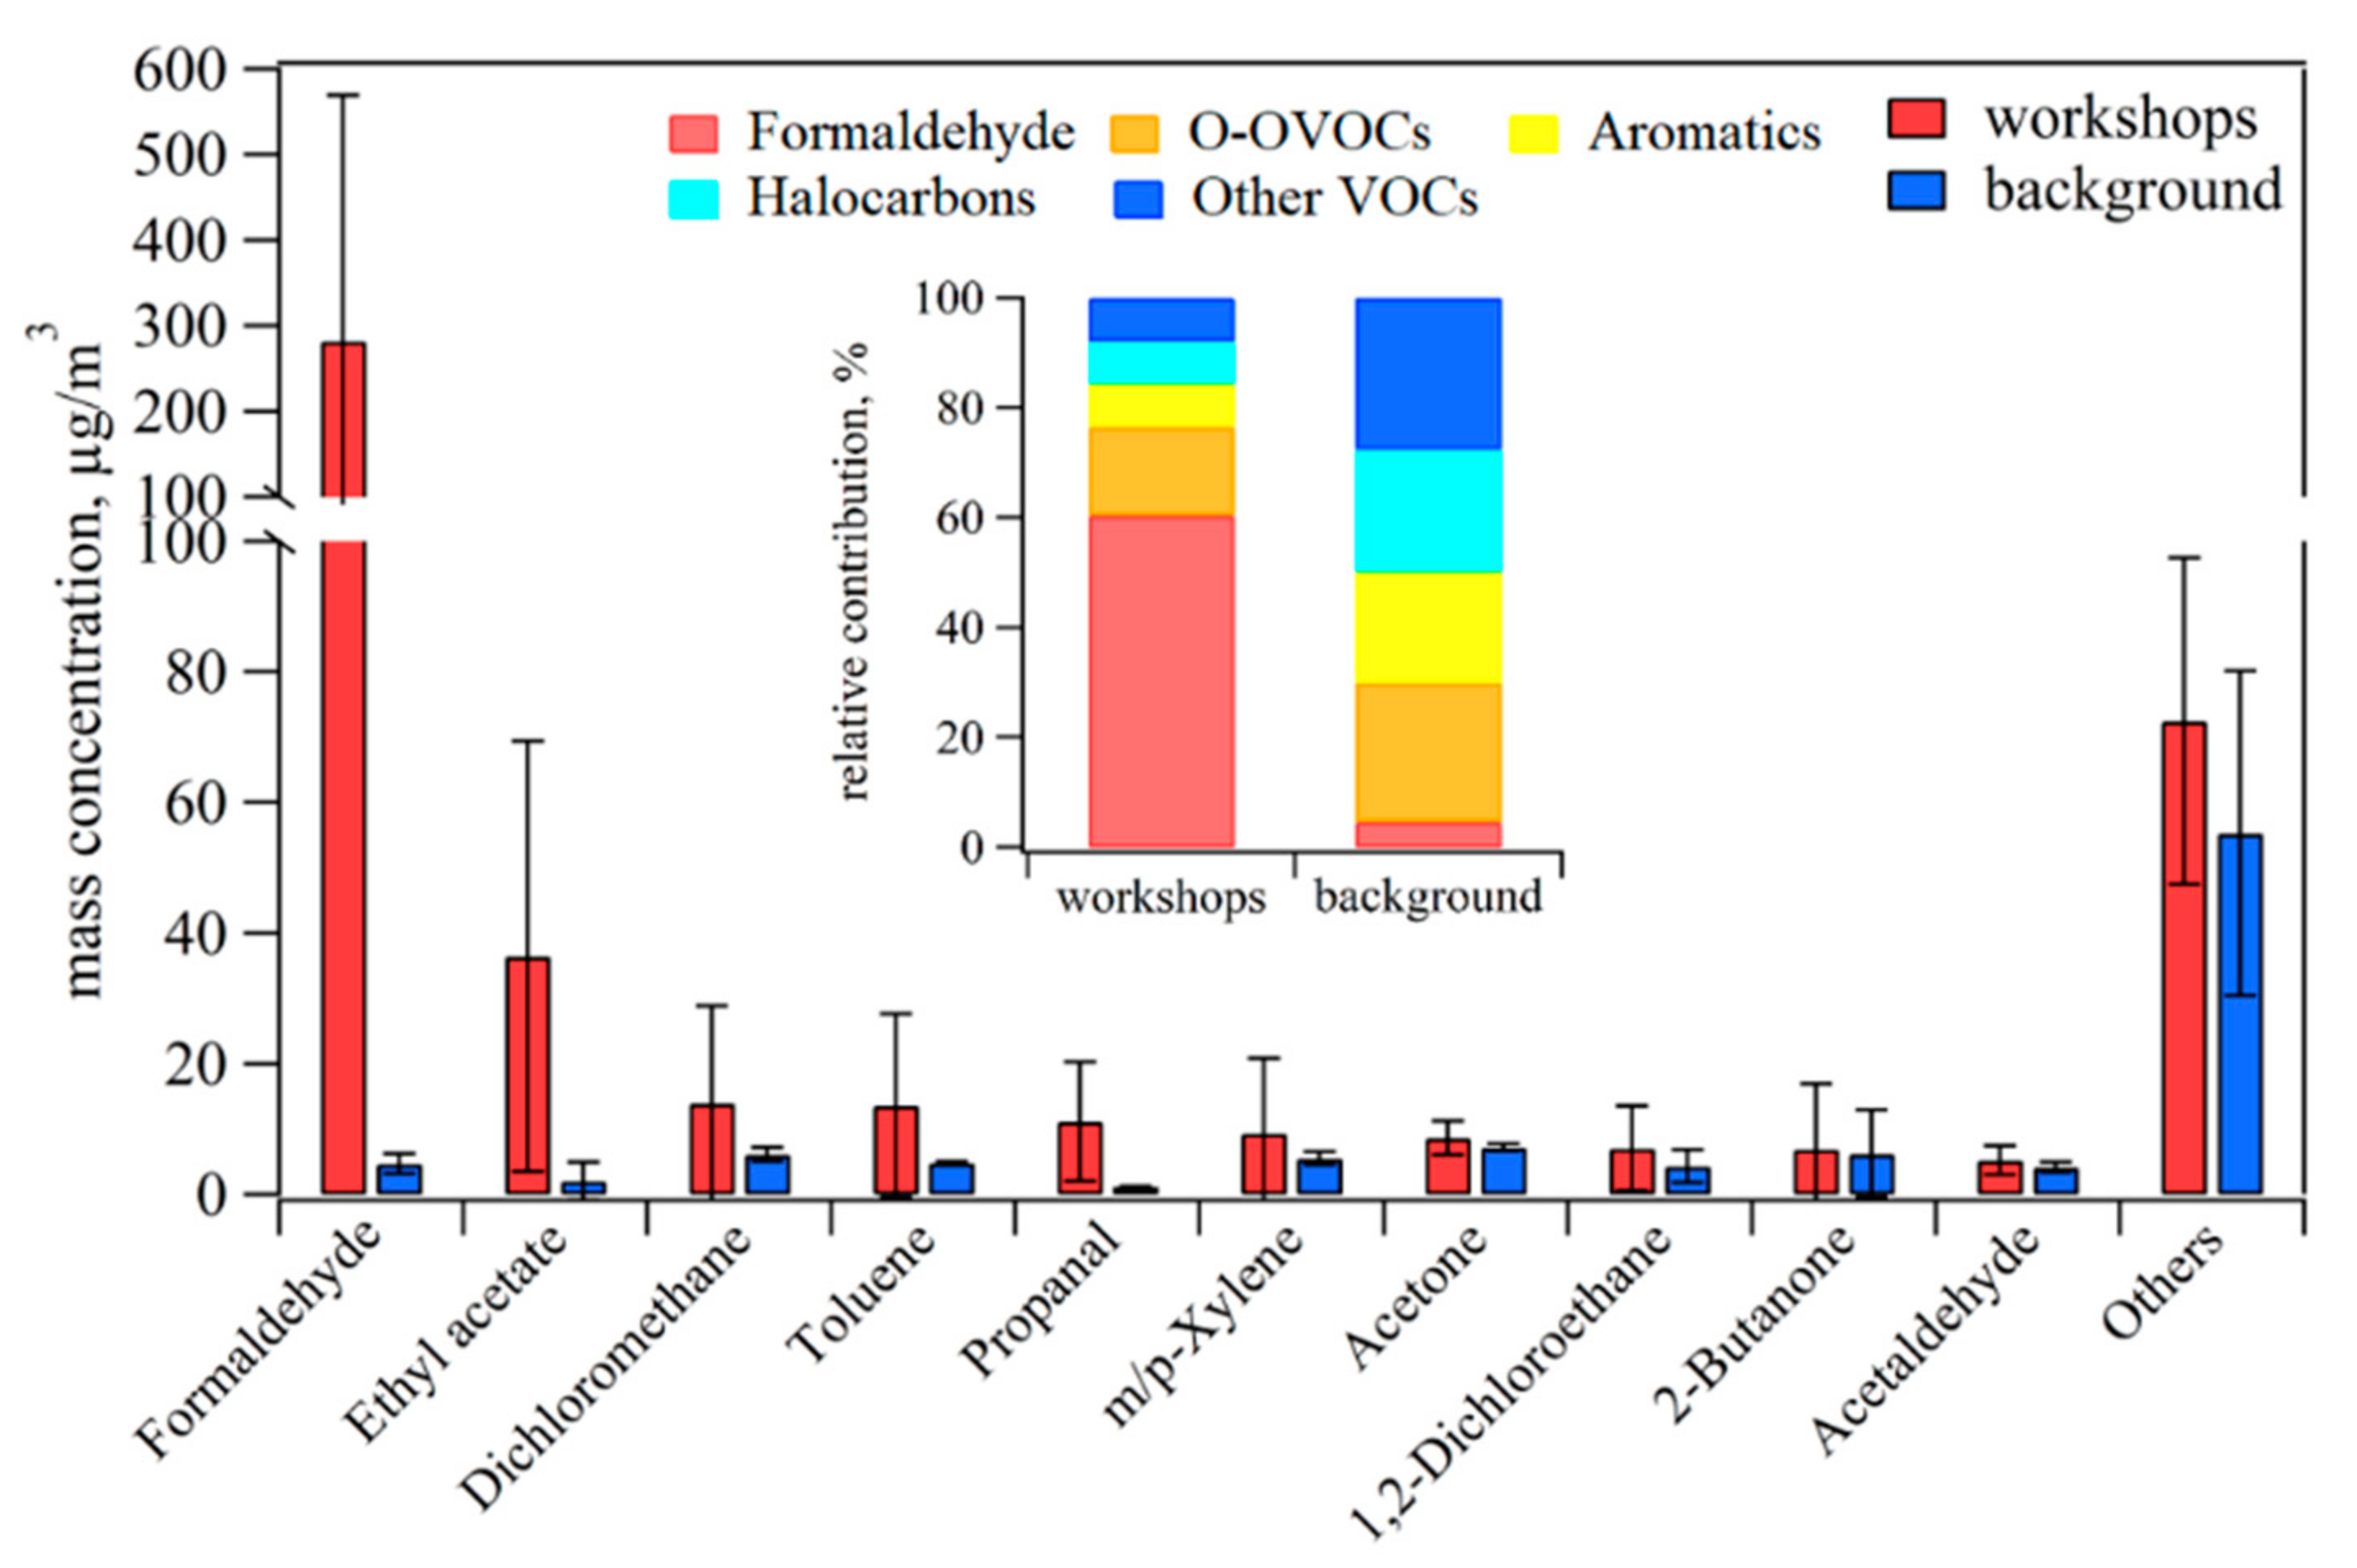
The total concentration of VOCs in workshops of the plywood manufacturing industry fluctuate from 134 μg/m3 to 1624 μg/m3, with the average VOCs concentration of 467 ± 359 μg/m3. Figure 2 compares the average concentrations of VOC species in the workshops of the plywood manufacturing industry and background ambient air. Formaldehyde, ethyl acetate, and dichloromethane are the three most abundant VOCs in workshop air, with average concentrations of 282 μg/m3, 36.5 μg/m3, and 14.0 μg/m3, about 60 times, 18 times, and 3 times of the average concentration of corresponding VOC species in ambient air, respectively. For the other VOC species, their concentrations in workshops are also higher than the corresponding concentrations in background ambient air.
Chemical compositions of VOCs also show significant differences between the workshops of the plywood manufacturing industry and ambient air. Formaldehyde is the most abundant VOC species in workshops, contributing 60.4% to the total mass concentration of VOCs, followed by other OVOCs (i.e., all OVOCs except formaldehyde, O-OVOCs) (16.1%), aromatics (7.9%), halocarbons (7.6%), and other VOCs (including alkanes, alkenes, acetylene, and sulfides) (7.9%). Meanwhile, the relative contribution of formaldehyde to total VOCs in background ambient air is only 4.6%. The relative contributions of O-OVOCs, halocarbons, aromatics, and other VOCs in background ambient air are 25.4%, 22.2%, 20.2%, and 27.6%, respectively.

3.1.2. Process-Specific VOC Concentrations and Chemical Compositions

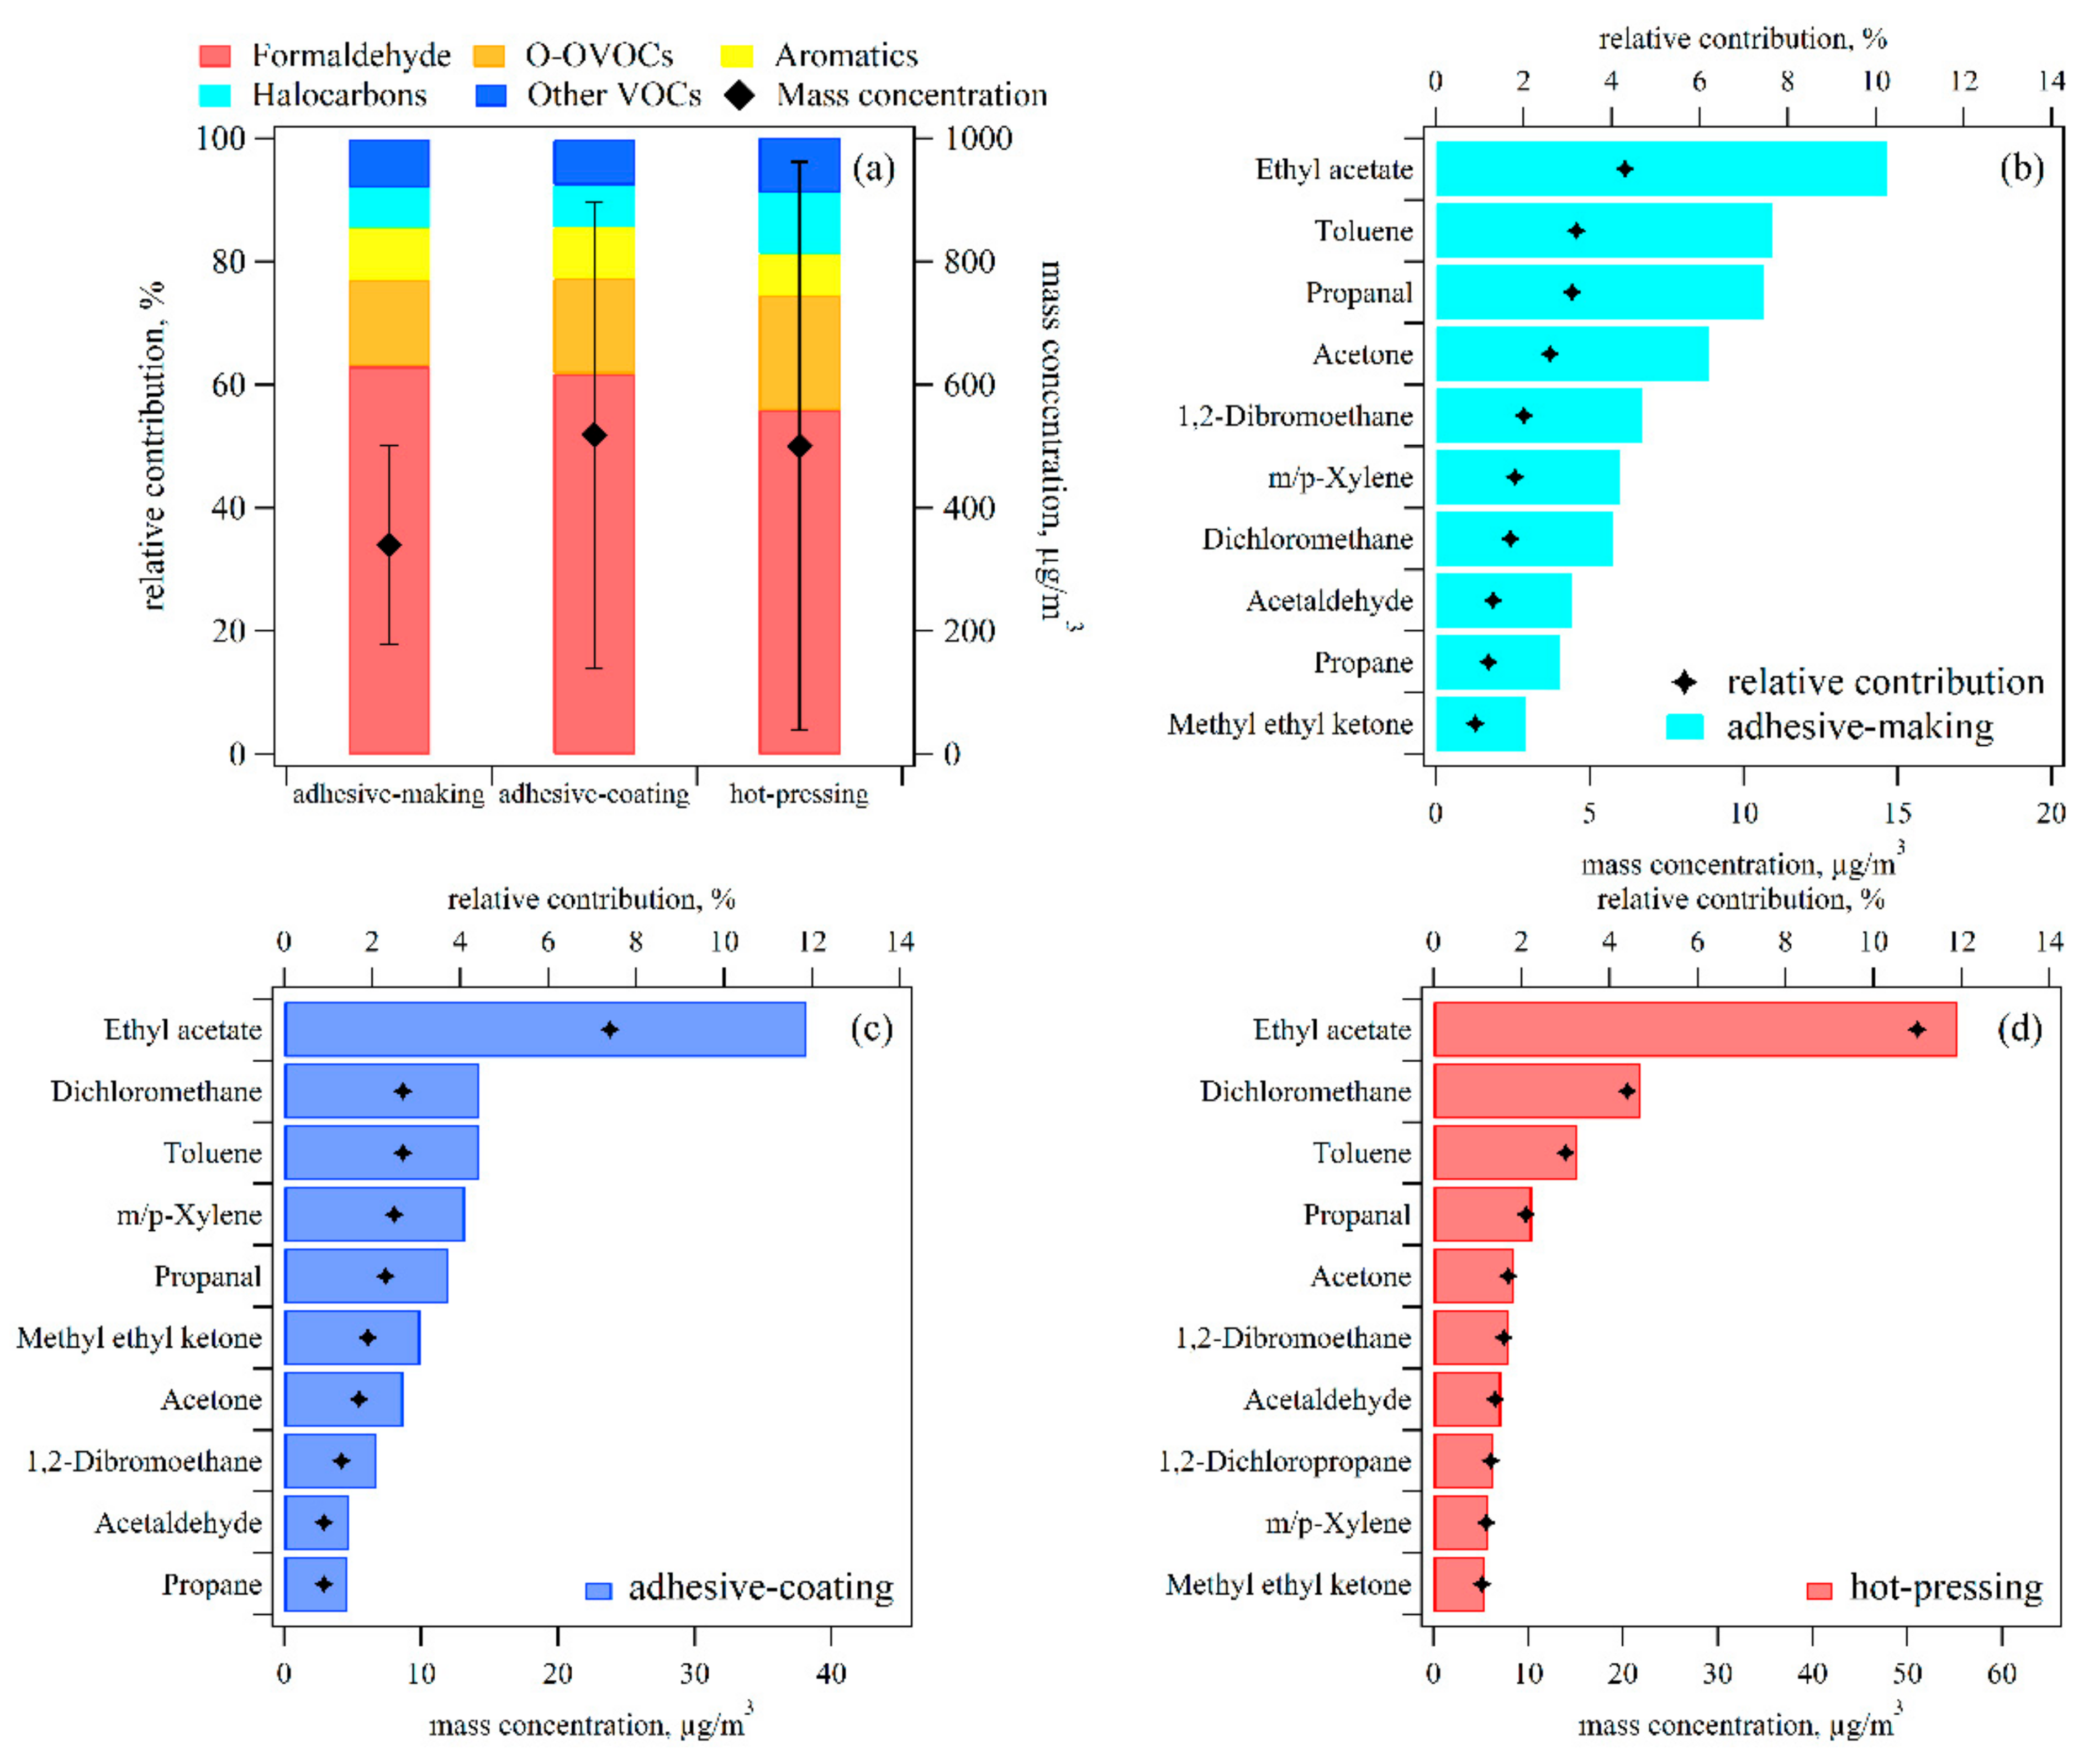
Figure 3a compares the average concentrations and chemical composition of VOCs emitted from the adhesive-making, adhesive-coating, and hot-pressing processes in the plywood manufacturing industry. The adhesive-coating process shows the highest average total VOCs concentration, with the value of 517 μg/m3, followed by the hot-pressing process (501 μg/m3) and the adhesive-making process (340 μg/m3). In these three processes, formaldehyde is the largest contributor to total VOCs, with relative contributions ranging from 55.9% to 63.1%. The relative contributions from O-OVOCs, aromatics, halocarbons, and other VOCs are in the ranges of 14.1–18.6%, 6.8–8.4%, 6.5–9.9%, and 7.4–8.9%, respectively. The high formaldehyde levels are related to the use of adhesives in the plywood manufacturing industry [26]. In the adhesive-coating workshops, the base materials of plywood are coated with adhesives in a semi-opening state (i.e., VOCs emissions from adhesives are not efficiently collected), resulting in the highest concentration of VOCs. In the hot-pressing process, the high temperature accelerates VOCs emissions from adhesive-coated panels [27]. The production of adhesives is usually carried out in a closed reaction kettle, and VOCs are mainly emitted from the storage and addition of raw materials, and therefore VOCs concentrations in the adhesive-making workshops show the lowest value among these three processes.
Figure 3b–d show the VOC species with the 10 highest concentrations except for formaldehyde in the adhesive-making, adhesive-coating, and hot-pressing processes. These species mainly included O-OVOCs (e.g., ethyl acetate, propanal, acetaldehyde, methyl ethyl ketone (MEK), and acetone), aromatics (e.g., toluene and m/p-xylene), and halocarbons (e.g., 1,2-dibromoethane, dichloromethane, and 1,2-dichloropropane). One possible explanation for these results is that ethyl acetate, toluene, dichloromethane, and 1,2-dichloroethane are also used in the production of adhesives [12,28].

3.1.3. Ozone Formation Potentials (OFP) of VOCs

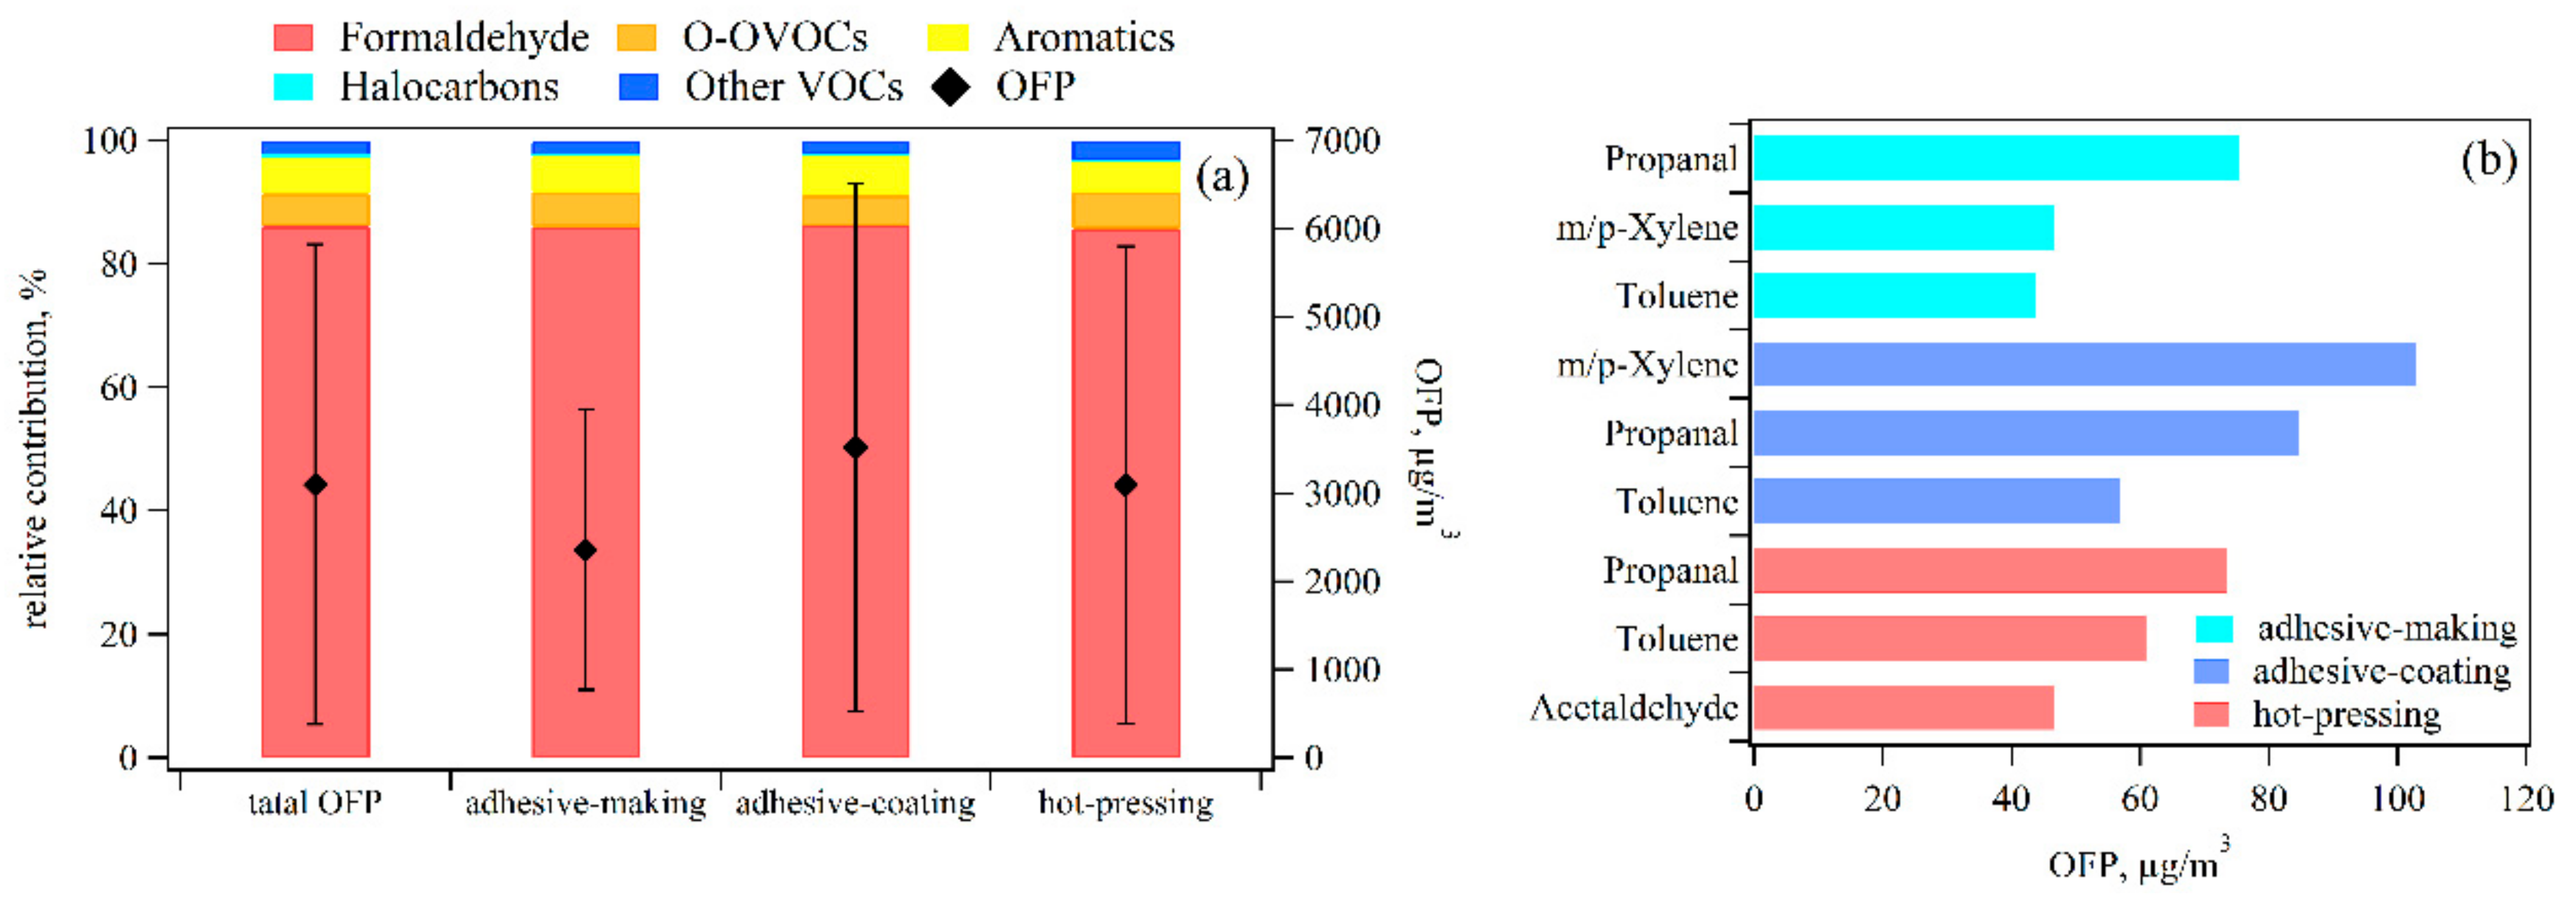
The fugitive emission of VOCs in workshops can release into the outdoor air, which could impact the secondary formation of ambient ozone. The OFP values for individual VOC species are calculated as the product of their concentration and maximum incremental reactivity (MIR) reported from the literature [29]. Figure 4a shows the OFP values and chemical composition of VOCs emitted from the adhesive-making, adhesive-coating, and hot-pressing processes in the plywood manufacturing industry. The average OFP value of VOCs from the plywood manufacturing industry is 3098 μg/m3. For specific processes, the average OFP from the adhesive-coating process is 3519 μg/m3, higher than the results for the hot-pressing process (3090 μg/m3) and the adhesive-making process (2358 μg/m3). Formaldehyde is the largest contributor to the total OFP of VOCs, with an average relative contribution of 86.1%. Figure 4b shows the VOC species with the top three OFP values except for formaldehyde in these three processes. Toluene, xylenes, propanal, and acetaldehyde are important contributors to the total OFP of VOCs, with OFP values ranging from 43.6 μg/m3 to 103 μg/m3.

3.2. Health Risk Assessment of VOCs

3.2.1. Non-Cancer Toxic Risk of VOCs

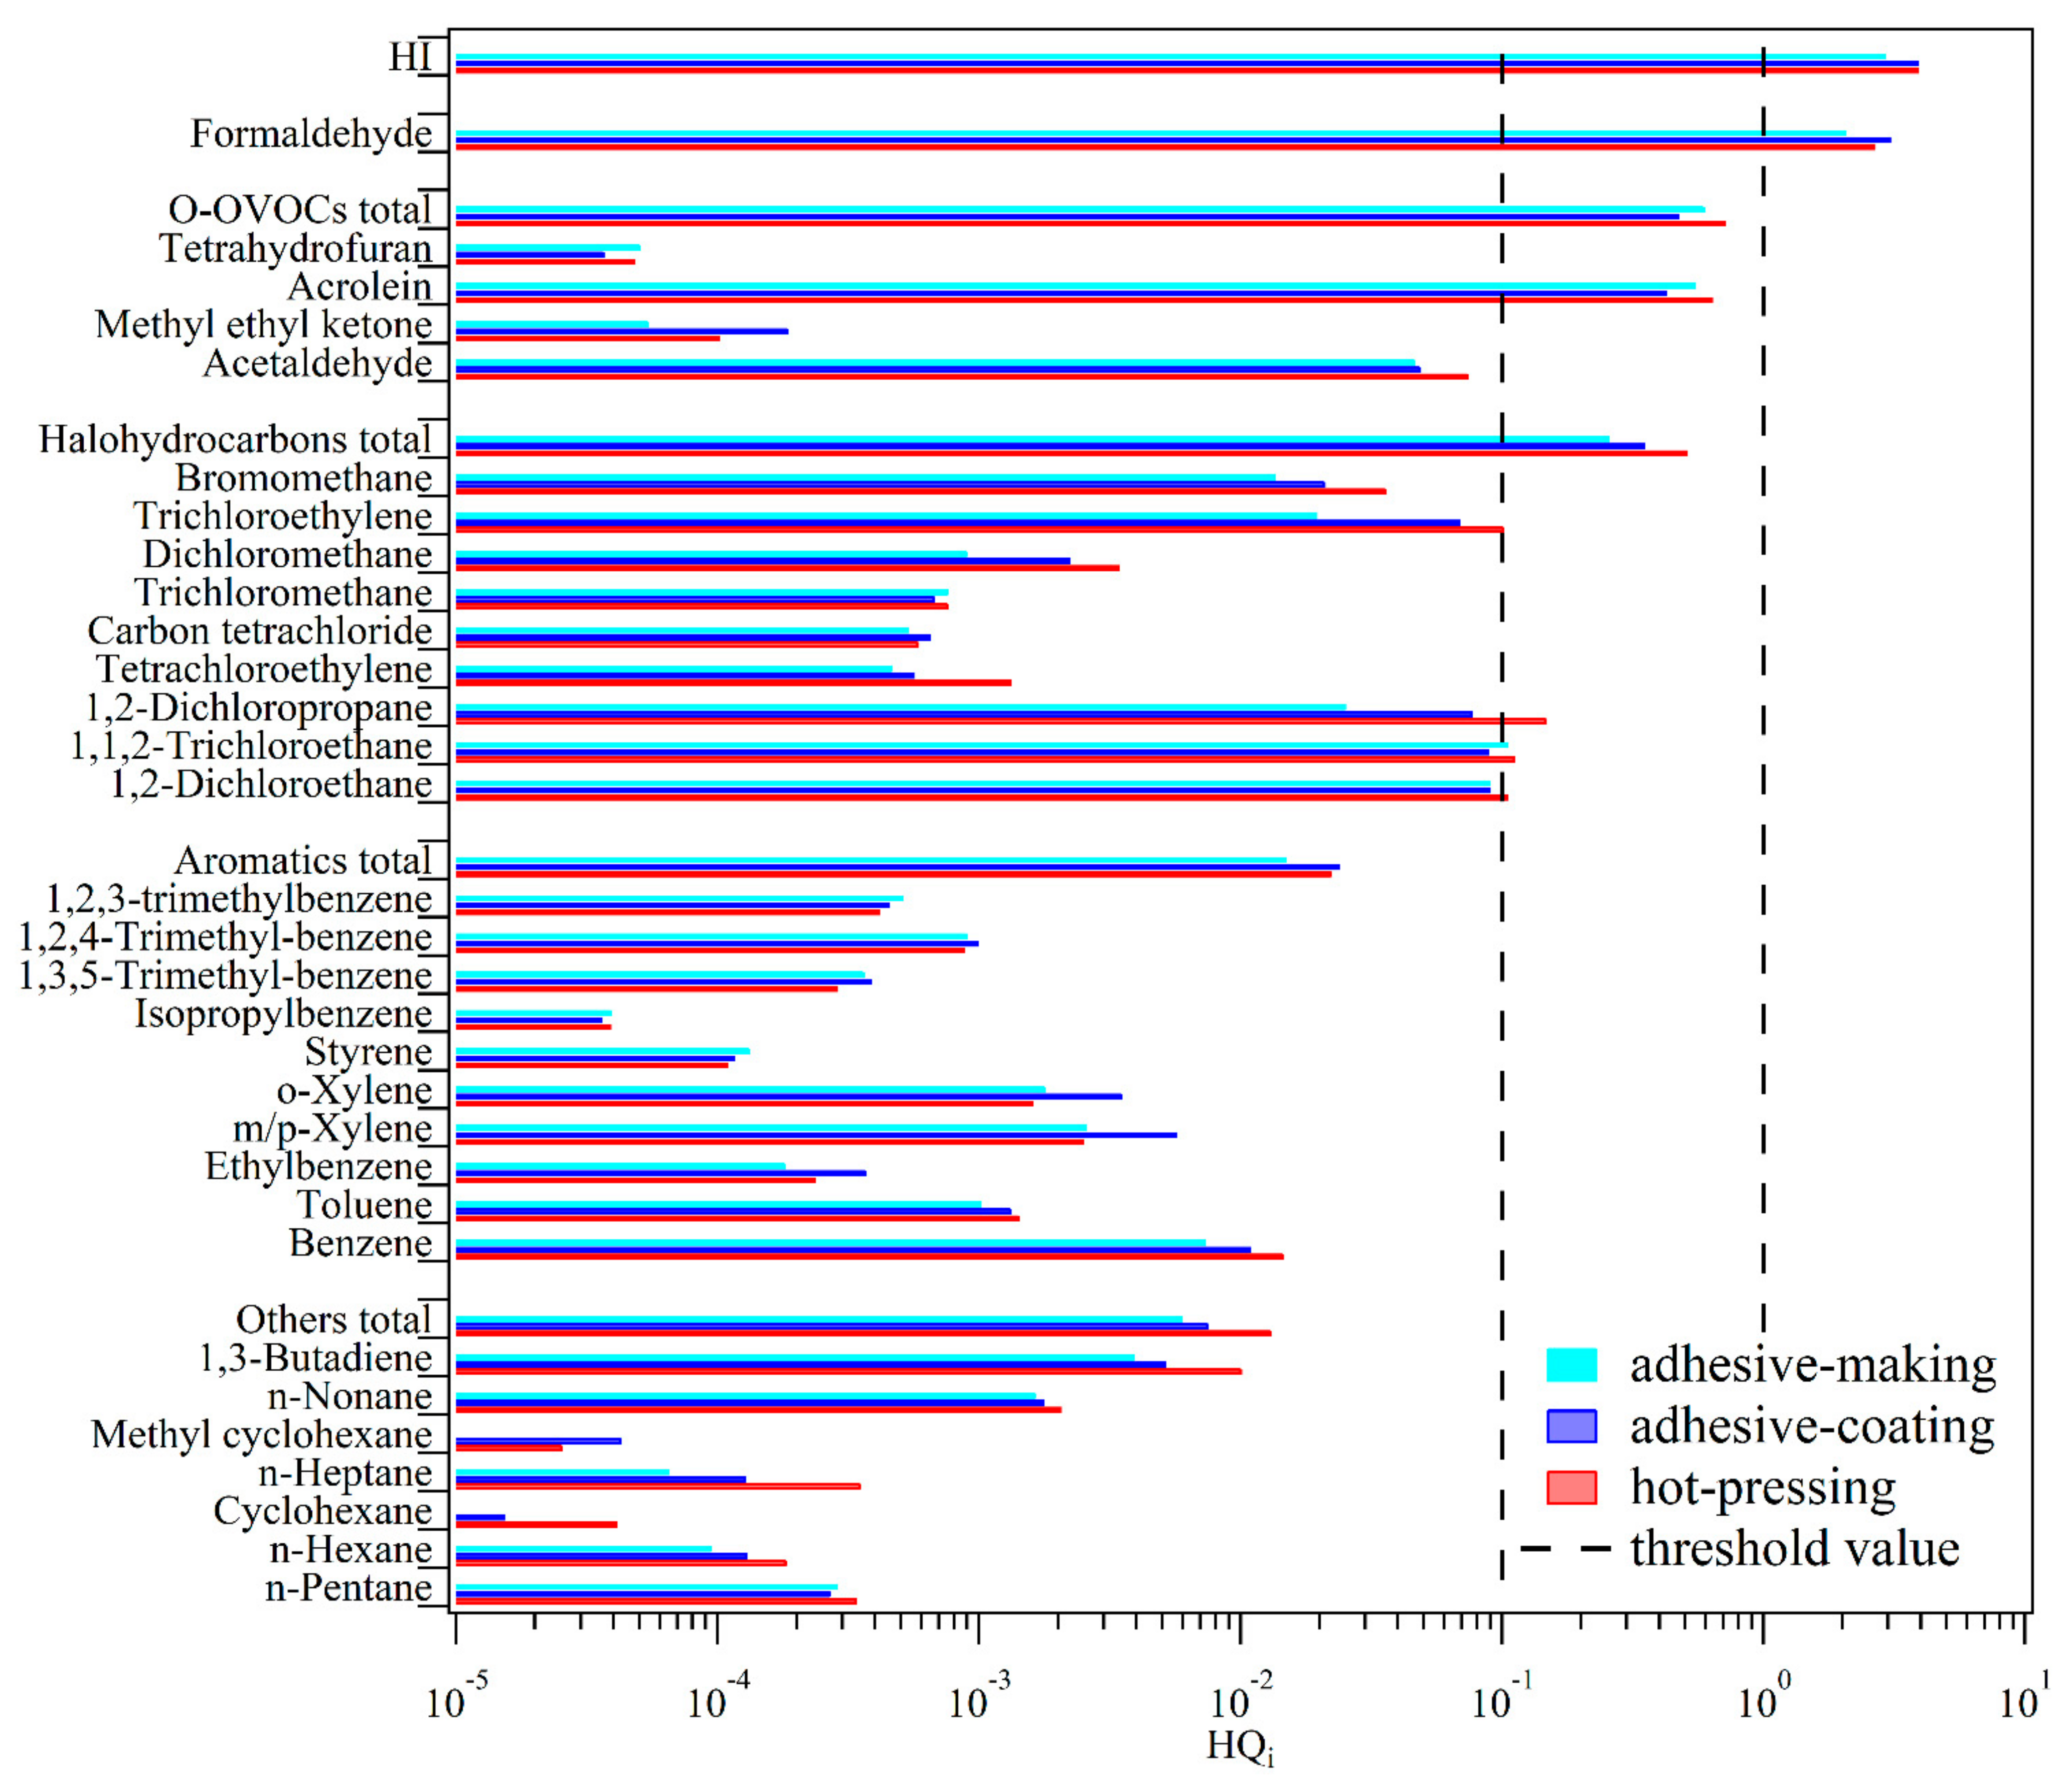
In this study, the non-cancer toxic risks of 31 VOC components, are calculated based on the health risk assessment method recommended by the US EPA (Equations (1) and (2)), including five OVOCs, 10 aromatics, nine halocarbons, six alkanes, and one alkene (Table S1). The HQ value for a certain VOC species greater than 1.0 indicates that this VOC species will cause toxic harm to human health, but non-cancer effects. The HQ value for a specific VOC lower than 1.0 indicates that it has a low toxic health risk.
Figure 5 shows the HI values of total VOCs and HQ values for individual VOCs from the plywood manufacturing industry and three processes. The HI values of total VOCs from the adhesive-coating process and the adhesive-pressing process are 3.93 and 3.94, respectively, higher than that for the adhesive-making process (2.93). The HI results of total VOCs indicate the high non-cancer toxic health risks of VOCs for the workers exposed to these environments. Formaldehyde is only the individual VOC species with an average HQ value greater than 1.0, indicating formaldehyde has non-cancer toxic health risks to workers. The HQ value of formaldehyde is 3.07 in the adhesive-coating process, followed by the hot-pressing process (2.68) and the adhesive-making process (2.06). In addition, it needs to be mentioned that there are four VOC species with HQ values between 0.1 and 1.0, including acrolein, 1,2-dichloroethane, 1,1,2-trichloroethane, 1,2-dichloropropane, and trichloroethylene, indicating that these VOC species need to be given non-cancer hazard concerns (i.e., potential non-cancer health risks) [7,19]. The HQ values of the other VOCs are all lower than 0.1, indicating that these VOC species have a low non-cancer toxic health risk.

3.2.2. Lifetime Cancer Risk of VOCs

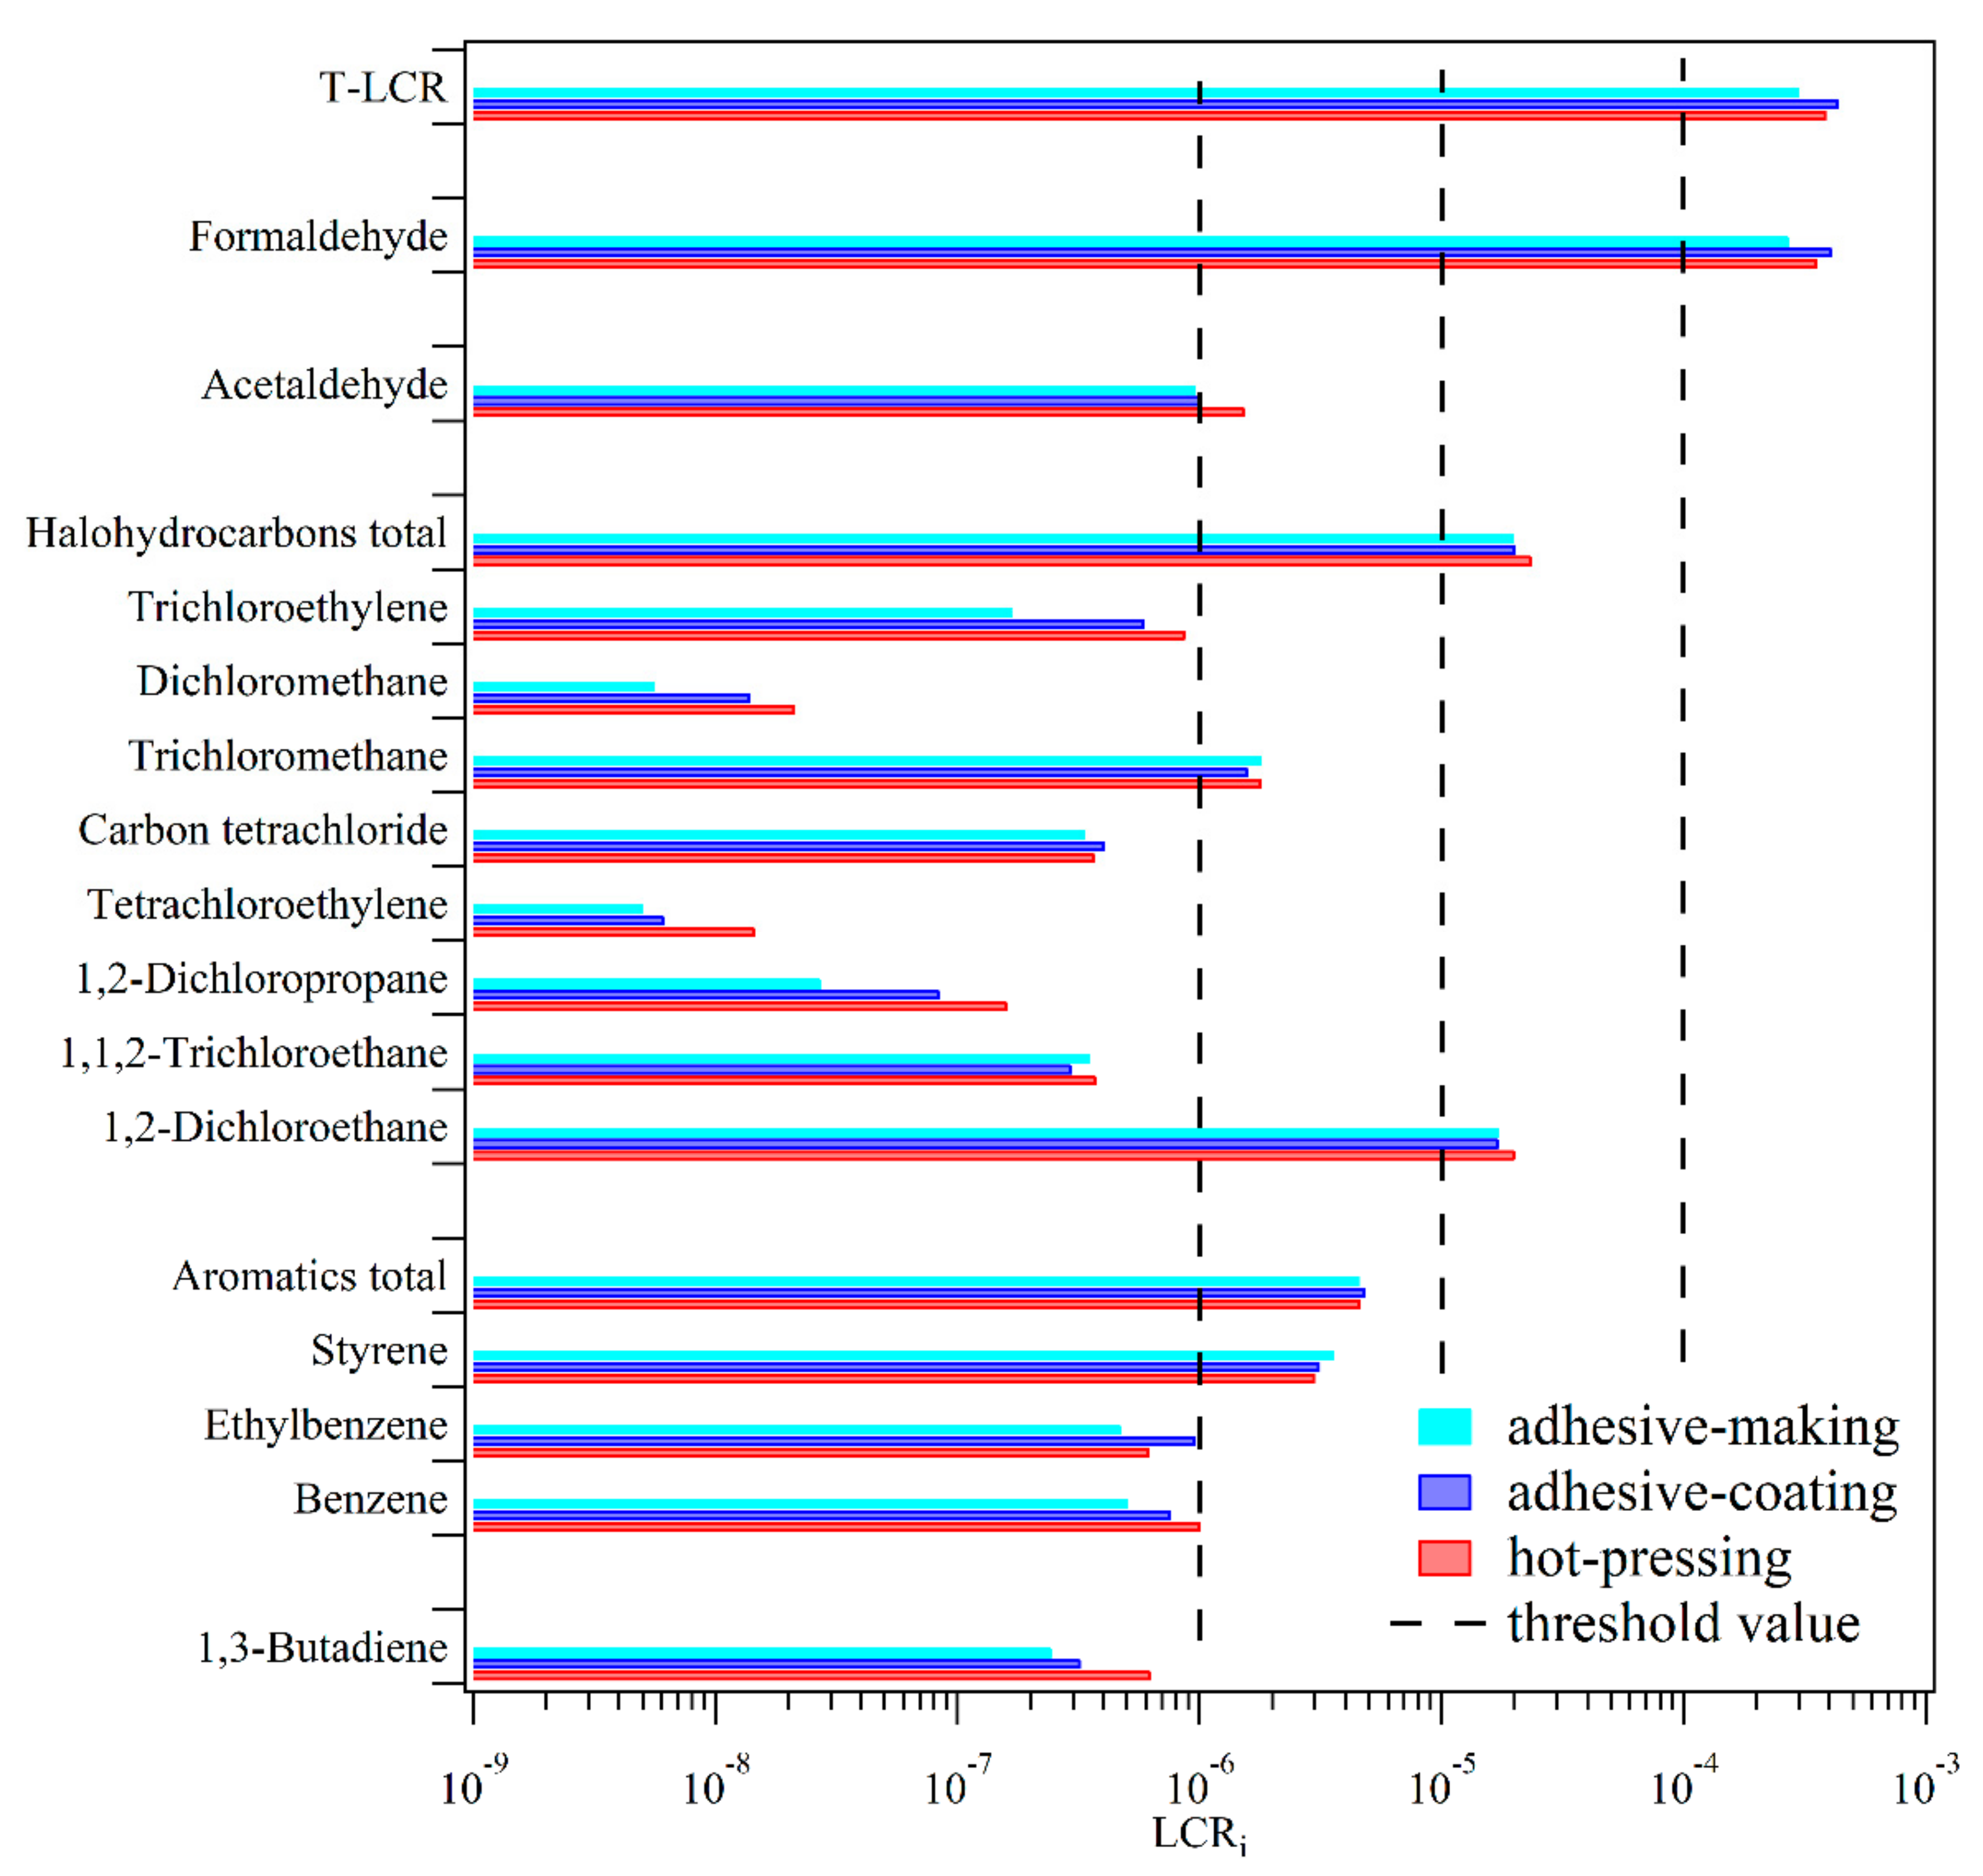
The lifetime cancer risk of total VOCs (T-LCR) calculated in this study includes 14 specific VOCs, including two OVOCs, three aromatics, eight halocarbons, and one alkene (Table S1). When the LCR values for specific VOCs are greater than 1.0 × 10⁻⁴, between 1.0 × 10⁻⁵ and 1.0 × 10⁻⁴, between 1.0 × 10⁻⁶ and 1.0 × 10⁻⁵, and lower than 1.0 × 10⁻⁶, the cancer health risks of these VOCs are considered definite, probable, possible, and negligible, respectively [18].
Figure 6 shows the T-LCR values of VOCs from the plywood manufacturing industry and three processes. The T-LCR values of VOCs from the three processes all exceed 1.0 × 10⁻⁴, indicating that long-term exposure in these environments will cause definite cancer risk. The T-LCR value of VOCs from the adhesive-coating process is 4.17 × 10⁻⁴, higher than the results for the hot-pressing process (3.71 × 10⁴) and the adhesive-making process (2.86 × 10⁻⁴). For specific VOCs, formaldehyde shows the highest LCR, with respective values of 2.62× 10⁻⁴, 3.92 × 10⁻⁴, and 3.42 × 10⁻⁴ in the adhesive-making process, adhesive-coating process, and hot-pressing process. Formaldehyde contributes 91.4–93.9% of T-LCR, indicating that formaldehyde will result in a definite cancer health risk to those workers in these three processes. 1,2-dichloroethane is the only VOC species with LCR values between 1.0 × 10⁻⁵ and 1.0 ×10⁻⁴, suggesting its probable cancer health risk. The LCR values of acetaldehyde, chloroform, and styrene are between 1.0 × 10⁻⁶ and 1.0 × 10⁻⁵, indicating that these VOC species have possible cancer health risks to workers. The LCR values for the other VOCs are lower than 1.0 × 10⁻⁶, indicating their negligible cancer health risks to those workers in these three processes.

3.2.3. Occupational Exposure Cancer Risk of VOCs

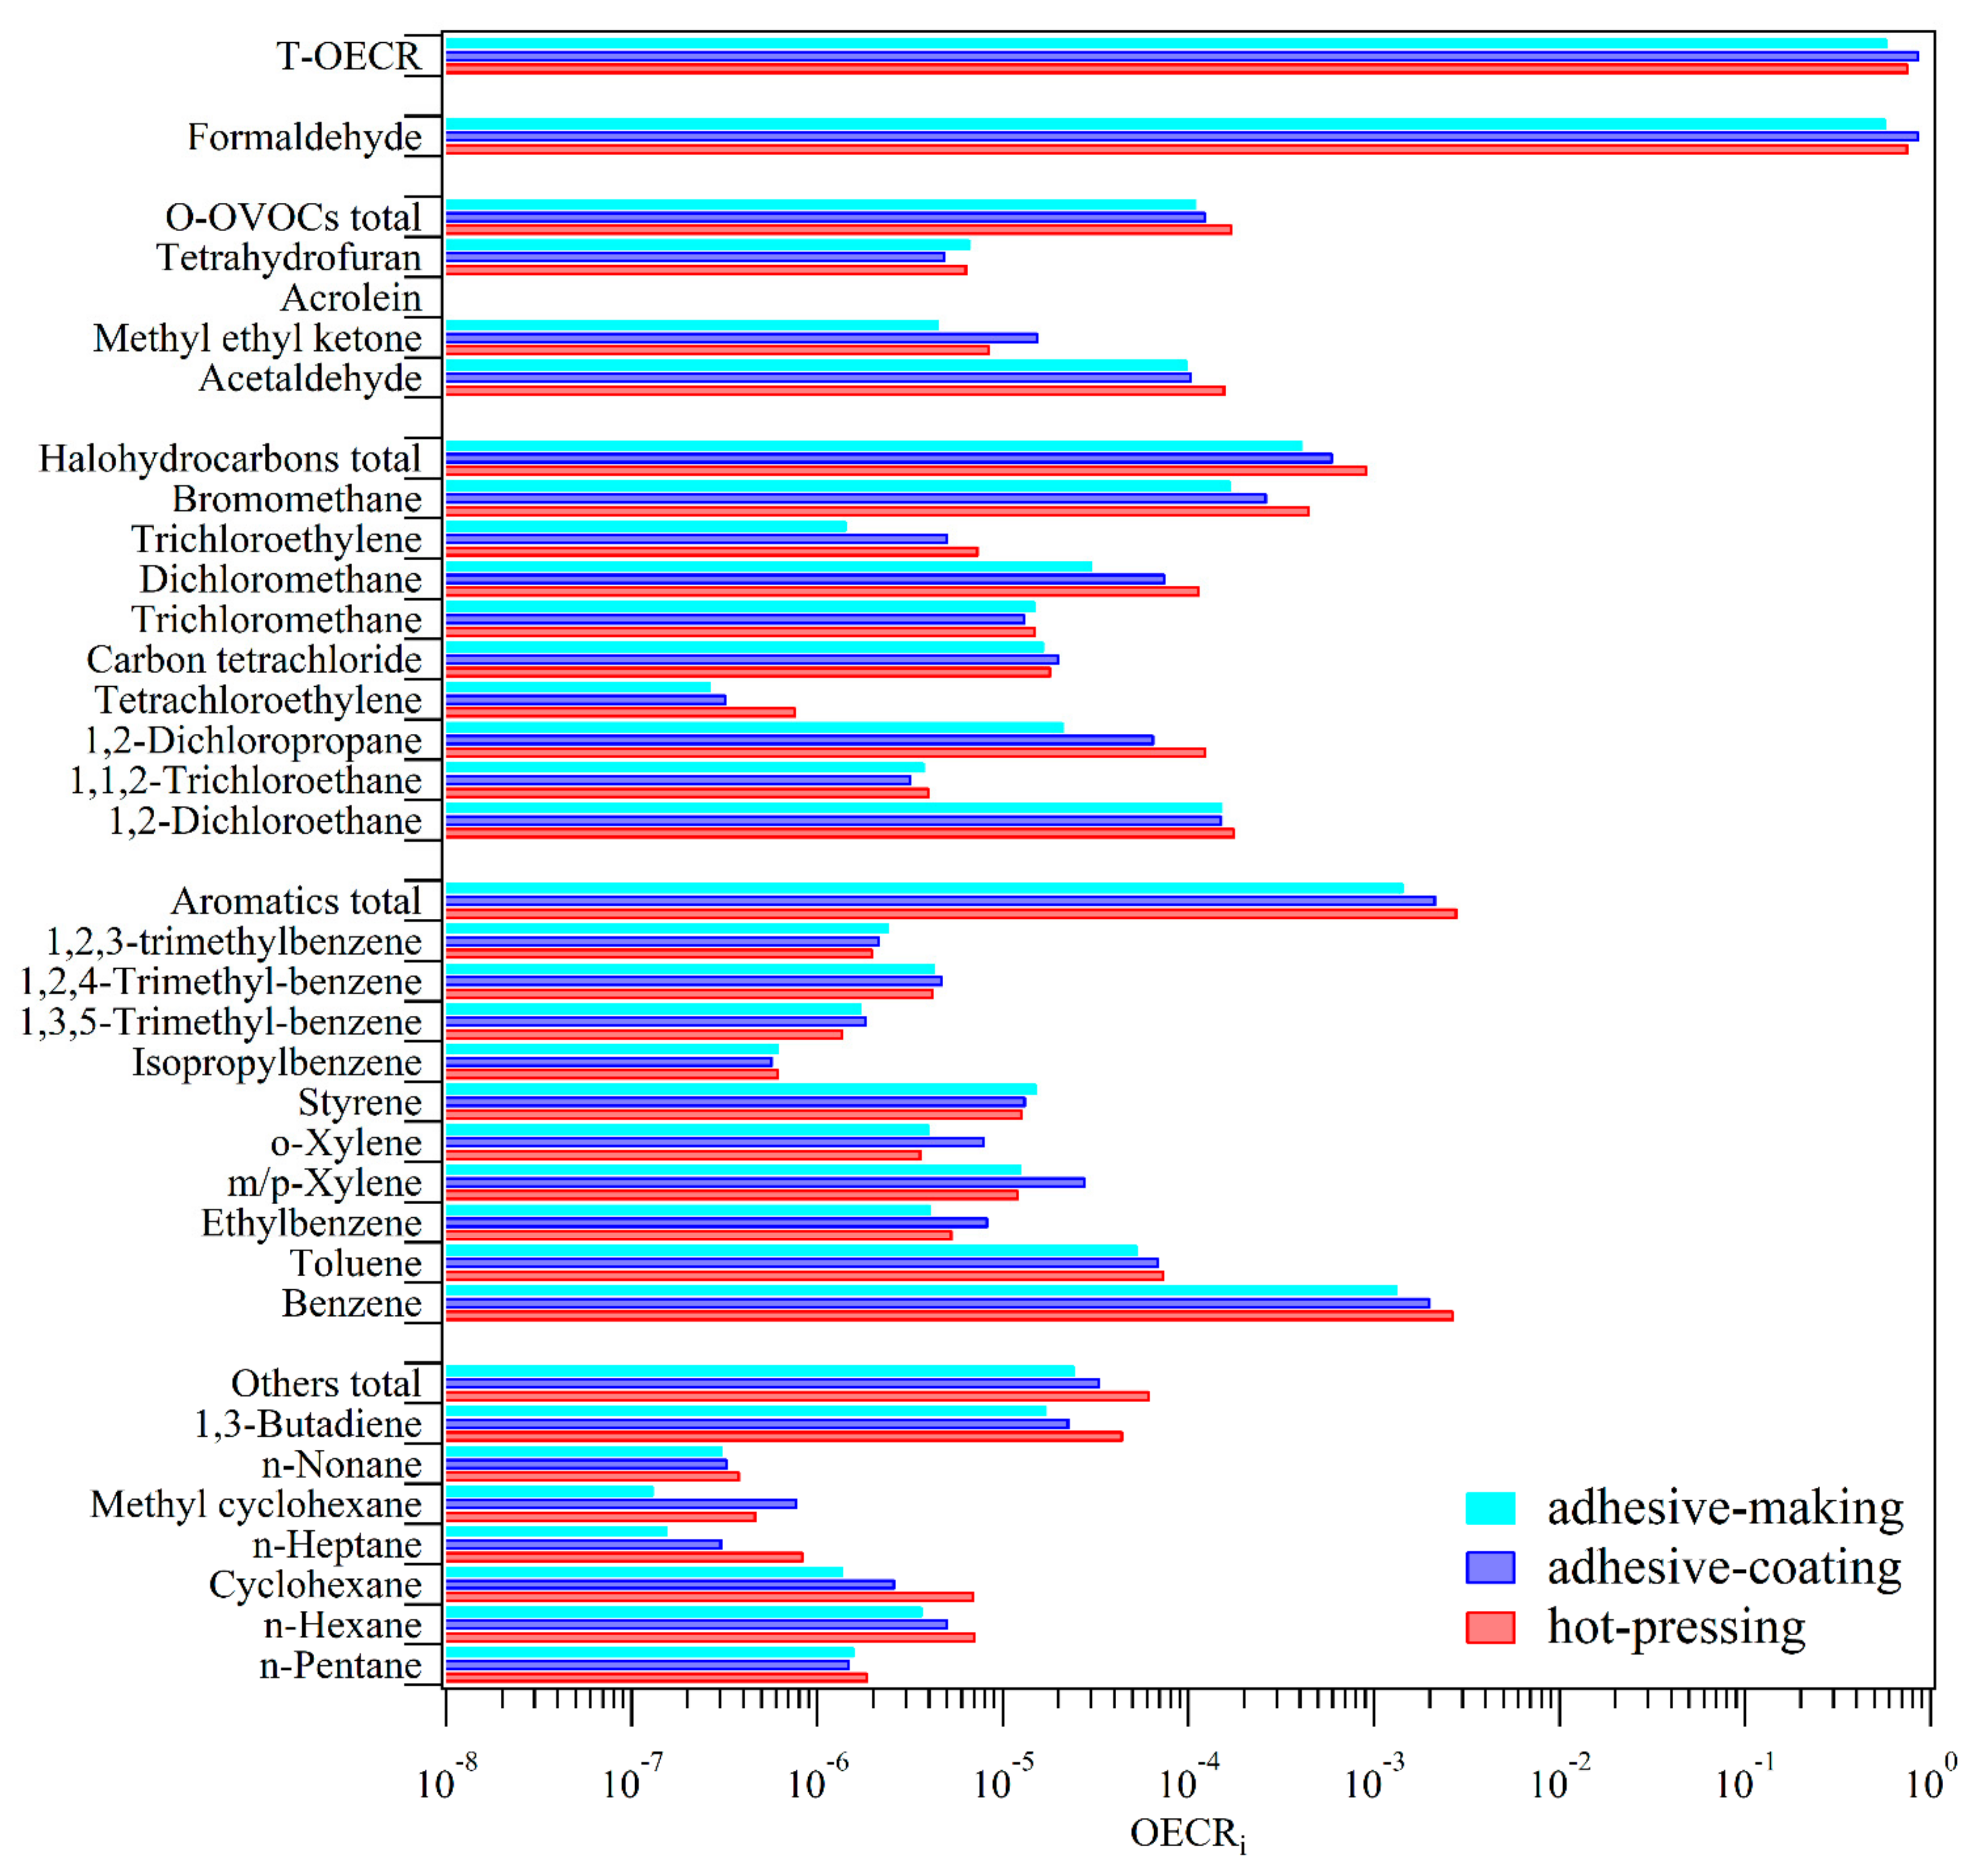
In this study, the OECR values of 30 VOC species are calculated using the method provided by ACGIH (Equation (4)), including formaldehyde, four O-OVOCs, 10 aromatics, nine halocarbons, six alkanes, and one alkene (Table S1). When the OECR value of a specific VOC is greater than 1.0, indicating that this species will lead to a potential occupational exposure cancer risk.
Figure 7 shows OECR values of total VOCs (T-OECR) from the plywood manufacturing industry and three processes. The T-OECR values of VOCs from the adhesive-coating, hot-pressing, and adhesive-making processes are ranging from 0.58 to 0.87. Formaldehyde shows the highest contribution to the T-OECR, while OECR values for other VOC species are all lower than 10−2. The cancer risk assessment results using ACGIH-recommended methods show a significant discrepancy with those based on US EPA. The T-LCR values suggest VOCs (especially formaldehyde) have infinite cancer risks to workers in these three processes, while the OECR values indicate that the occupational cancer risks of VOCs are low. However, all these results show the cancer risk of formaldehyde in the plywood manufacturing industry is much higher than those for the other VOC species. Therefore, formaldehyde should be paid more attention to VOCs control to reduce the health risk of VOCs to workers in plywood manufacturing.

3.2.4. A Cancer Health Risk Reduction Scheme Based on Air Ventilation

Considering the definite cancer health risk to workers in the plywood manufacturing factories, we attempt to design a risk reduction scheme based on air ventilation. The air supply volume (Q, m3/h) (JIS A 1406-1974 method for measuring amount of room ventilation) [30] and ventilation rates are calculated using the following equation:
Q = 2.303·V/t·lg[(MCi − BC0)/(TCi − BC0)]
where V is the volume of the workshop (m3), whose values for the hot-pressing, adhesive-coating, and adhesive-making workshops are assumed as 10,000 m3, 7000 m3, and 800 m3 according to local plywood manufacturing factories in the Yangtze River Delta regions, respectively. t is the working time (h), which is set as 8 h. MCi is the average VOCs mass concentration that is measured in each process (μg/m3). TCi is the threshold concentration (μg/m3) as ILCRi = 1 × 10⁻⁵. BC0 is the corresponding average concentration of VOCs in the background ambient air (μg/m3).
In the plywood manufacturing industry, the LCR values for formaldehyde and 1,2-dichloroethane are both greater than 1.0 × 10⁻⁵ (Figure 6), and therefore the cancer risk reduction scheme mainly considers these two VOC species. Figure 8 shows the Q values and ventilation rates (i.e., Qt/V) for formaldehyde and 1,2-dichloroethane from the plywood manufacturing industry and three processes. The Q values for these two species both show the highest value in the hot-pressing workshop with the largest V. The Q values for formaldehyde is higher than that of 1,2-dichloroethane due to the higher measured mass concentration of formaldehyde (271.77 μg/m3) than 1,2-dichloroethane (7.10 μg/m3). Therefore, the cancer health risk reduction scheme of formaldehyde is mainly considered when setting the air supply volumes. The air ventilation rates of formaldehyde need to reach 4 times in 8 h in the adhesive-making workshop, and 5 times in the adhesive-coating process and the hot-pressing process. Actually, this scheme of reducing the cancer risk of VOCs through air exchange could not reduce VOCs emission, further research on exhaust gas collection and VOCs treatment is needed in the future to control VOCs emission and reduce health risks to workers in the plywood manufacturing industry.

4. Conclusions

The concentration of total VOCs in workshops of the plywood manufacturing industry fluctuates from 134 μg/m3 to 1624 μg/m3, with an average concentration of 467 μg/m3. Formaldehyde is the most abundant VOC species, contributing 60.4% to the total mass concentration of VOCs, followed by O-OVOCs (16.1%), aromatics (7.9%), and halocarbons (7.6%). The adhesive-coating process shows the highest average total VOCs concentration (519 μg/m3), followed by the hot-pressing process (501 μg/m3) and the adhesive-making process (340 μg/m3). The OFP values of VOCs are ranged from 2358 μg/m3 to 3519 μg/m3 in three processes, with an average OFP value of 3098 μg/m3. Formaldehyde, toluene, and propanal are important contributors to total OFP.
The non-cancer toxic risk and lifetime cancer risk of VOCs in three processes of the plywood manufacturing industry are calculated using the US EPA-recommend method. The HI values of VOCs from the three processes of the plywood manufacturing industry are all greater than 1.0 (2.93–3.94), indicating the high non-cancer toxic health risks for the workers exposed in these environments. The T-LCR values of VOCs from three processes are ranging from 2.86 × 10⁻⁴ to 4.17 × 10⁻⁴ (higher than 1.0 × 10⁻⁴), suggesting a definite cancer health risk to workers. Formaldehyde is the largest contributor to HI and T-LCR, with respective relative contributions of 68.1–78.2% and 91.4–93.9%, indicating that formaldehyde is the major species that caused health risk to workers. Considering the definite cancer health risk to workers, a risk reduction scheme based on air ventilation is designed. The air ventilation rates of formaldehyde need to reach 4–5 times in 8 h in these three processes to reduce T-LCR to 10−5 (possible cancer risk). Further research on VOCs collection and treatment is needed to reduce VOCs emission and health risks to workers in the plywood manufacturing industry.

Supplementary Materials

The following are available online at www.mdpi.com/article/10.3390/atmos12111530/s1, Table S1: The values and sources of the reference concentration (RfC), inhalation cancer risk (IUR), and TLV-TWA for individual VOC species in this study.

Author Contributions

Conceptualization, M.W. and K.H.; methodology, M.W. and K.H.; software, M.W., W.C. and K.H.; resources, M.W. and Z.L.; data curation, X.L., B.Z. and H.L.; writing—original draft preparation, M.W., and K.H.; writing—review and editing, M.W. and W.C.; supervision, M.W.; funding acquisition, M.W. and Z.L. All authors have read and agreed to the published version of the manuscript.

Funding

This research was funded by the National Natural Science Foundation of China (grant number 41505113) and the National Key R&D Program of China (grant number 2016YFC0202200).

Institutional Review Board Statement

Not applicable.

Informed Consent Statement

Not applicable.

Data Availability Statement

The data generated or analyzed during the study are included in the article and its supplementary data file.

Acknowledgments

We are grateful for financial support from the National Natural Science Foundation of China (grant number 41505113) and the National Key R&D Program of China (grant number 2016YFC0202200).

Conflicts of Interest

The authors declare no conflict of interest.

References

  1. Fan, M.Y.; Zhang, Y.-L.; Lin, Y.C.; Li, L.; Xie, F.; Hu, J.; Mozaffar, A.; Cao, F. Source apportionments of atmospheric volatile organic compounds in Nanjing, China during high ozone pollution season. Chemosphere 2021, 263, 128025. [Google Scholar] [CrossRef]
  2. Zhu, J.; Cheng, H.; Peng, J.; Zeng, P.; Wang, Z.; Lyu, X.; Guo, H. O3 photochemistry on O3 episode days and non-O3 episode days in Wuhan, Central China. Atmos. Environ. 2020, 223, 117236. [Google Scholar] [CrossRef]
  3. Atkinson, R. Atmospheric chemistry of VOCs and NOx. Atmos. Environ. 2000, 34, 2063–2101. [Google Scholar] [CrossRef]
  4. Dorter, M.; Odabasi, M.; Yenisoy-Karakas, S. Source apportionment of biogenic and anthropogenic VOCs in Bolu plateau. Sci. Total Environ. 2020, 731, 139201. [Google Scholar] [CrossRef] [PubMed]
  5. Casset, A.; Marchand, C.; Purohit, A.; le Calve, S.; Uring-Lambert, B.; Donnay, C.; Meyer, P.; de Blay, F. Inhaled formaldehyde exposure: Effect on bronchial response to mite allergen in sensitized asthma patients. Allergy 2006, 61, 1344–1350. [Google Scholar] [CrossRef] [PubMed]
  6. Kanjanasiranont, N.; Prueksasit, T.; Morknoy, D.; Tunsaringkarn, T.; Sematong, S.; Siriwong, W.; Zapaung, K.; Rungsiyothin, A. Determination of ambient air concentrations and personal exposure risk levels of outdoor workers to carbonyl compounds and BTEX in the inner city of Bangkok, Thailand. Atmos. Pollut. Res. 2016, 7, 268–277. [Google Scholar] [CrossRef]
  7. Lerner, J.E.; Kohajda, T.; Aguilar, M.E.; Massolo, L.A.; Sanchez, E.Y.; Porta, A.A.; Opitz, P.; Wichmann, G.; Herbarth, O.; Mueller, A. Improvement of health risk factors after reduction of VOC concentrations in industrial and urban areas. Environ. Sci. Pollut. Res. Int. 2014, 21, 9676–9688. [Google Scholar] [CrossRef]
  8. McKeon, T.P.; Hwang, W.T.; Ding, Z.; Tam, V.; Wileyto, P.; Glanz, K.; Penning, T.M. Environmental exposomics and lung cancer risk assessment in the Philadelphia metropolitan area using ZIP code-level hazard indices. Environ. Sci. Pollut. Res. Int. 2021, 28, 31758–31769. [Google Scholar] [CrossRef]
  9. FAO. FAOSTAT System. Available online: https://www.fao.org/faostat/zh/#data/FO (accessed on 1 October 2021).
  10. Qin, L.; Liu, X.; Zhang, Z. Development Status and Trend of Plywood Industry in China. China For. Prod. Ind. 2020, 57, 1–3. (In Chinese) [Google Scholar] [CrossRef]
  11. Jia, L.; Chu, J.; Li, J.; Ren, J.; Huang, P.; Li, D. Formaldehyde and VOC emissions from plywood panels bonded with bio-oil phenolic resins. Environ Pollut. 2020, 264, 114819. [Google Scholar] [CrossRef]
  12. Wang, J.; Xiong, C.; Chen, J.; Han, L.; Xu, C. Study on emission characteristics and source composition spectrum of VOCs in typical wood-based panel manufacturing enterprises. Sichuan Environ. 2019, 38, 1–8. (In Chinese) [Google Scholar] [CrossRef]
  13. The Ministry of Ecology and Environment of China. The Technical Guidelines for the Emission Inventories of Volatile Organic Compounds (VOCs). 2014; (In Chinese). Available online: https://www.mee.gov.cn/gkml/hbb/bgg/201408/t20140828_288364 (accessed on 1 October 2021).
  14. Lv, D.; Lu, S.; Shao, M.; Wang, L.; Ren, J. Emission characteristics of volatile organic compounds (VOCs) from typical plywood industry. China Environ. Sci. 2020, 40, 1924–1931. (In Chinese) [Google Scholar] [CrossRef]
  15. Cao, T.; Shen, J.; Wang, Q.; Li, H.; Xu, C. Influence of loading factors on VOCs emission from veneered plywood. Eur. J. Wood. Wood. Prod. 2020, 78, 1287–1293. [Google Scholar] [CrossRef]
  16. He, Z.; Zhang, Y.; Wei, W. Formaldehyde and VOC emissions at different manufacturing stages of wood-based panels. Build. Environ. 2012, 47, 197–204. [Google Scholar] [CrossRef]
  17. Liu, Y.; Kong, L.; Liu, X.; Zhang, Y.; Li, C.; Zhang, Y.; Zhang, C.; Qu, Y.; An, J.; Ma, D.; et al. Characteristics, secondary transformation, and health risk assessment of ambient volatile organic compounds (VOCs) in urban Beijing, China. Atmos. Pollut. Res. 2021, 12, 33–46. [Google Scholar] [CrossRef]
  18. An, T.; Huang, Y.; Li, G.; He, Z.; Chen, J.; Zhang, C. Pollution profiles and health risk assessment of VOCs emitted during e-waste dismantling processes associated with different dismantling methods. Environ. Int. 2014, 73, 186–194. [Google Scholar] [CrossRef] [PubMed]
  19. Zheng, G.; Liu, J.; Shao, Z.; Chen, T. Emission characteristics and health risk assessment of VOCs from a food waste anaerobic digestion plant: A case study of Suzhou, China. Environ. Pollut. 2020, 257, 113546. [Google Scholar] [CrossRef]
  20. He, Z.; Li, G.; Chen, J.; Huang, Y.; An, T.; Zhang, C. Pollution characteristics and health risk assessment of volatile organic compounds emitted from different plastic solid waste recycling workshops. Environ. Int. 2015, 77, 85–94. [Google Scholar] [CrossRef]
  21. Zheng, H.; Kong, S.; Yan, Y.; Chen, N.; Yao, L.; Liu, X.; Wu, F.; Cheng, Y.; Niu, Z.; Zheng, S.; et al. Compositions, sources and health risks of ambient volatile organic compounds (VOCs) at a petrochemical industrial park along the Yangtze River. Sci. Total Environ. 2020, 703, 135505. [Google Scholar] [CrossRef]
  22. Nie, E.; Zheng, G.; Ma, C. Characterization of odorous pollution and health risk assessment of volatile organic compound emissions in swine facilities. Atmos. Environ. 2020, 223, 117233. [Google Scholar] [CrossRef]
  23. Wang, M.; Zeng, L.; Lu, S.; Shao, M.; Liu, X.; Yu, X.; Chen, W.; Yuan, B.; Zhang, Q.; Hu, M.; et al. Development and validation of a cryogen-free automatic gas chromatograph system (GC-MS/FID) for online measurements of volatile organic compounds. Anal. Methods 2014, 6, 9424–9434. [Google Scholar] [CrossRef]
  24. US EPA. Integrated Risk Information System (IRIS). Available online: https://iris.epa.gov/AtoZ/?list_type=alpha (accessed on 1 October 2021).
  25. ACGIH. TLV and BEI Documentation. Available online: http://www.acgih.org/ (accessed on 1 October 2021).
  26. Liu, Y.; Zhu, X. Measurement of formaldehyde and VOCs emissions from wood-based panels with nanomaterial-added melamine-impregnated paper. Constr. Build. Mater. 2014, 66, 132–137. [Google Scholar] [CrossRef]
  27. Cao, T.; Shen, J.; Wang, Q.; Li, H.; Xu, C.; Dong, H. Characteristics of VOCs released from plywood in airtight environments. Forests 2019, 10, 709. [Google Scholar] [CrossRef] [Green Version]
  28. Mo, Z.; Shao, M.; Lu, S. Compilation of a source profile database for hydrocarbon and OVOC emissions in China. Atmos. Environ. 2016, 143, 209–217. [Google Scholar] [CrossRef]
  29. Venecek, M.A.; Carter, W.P.L.; Kleeman, M.J. Updating the SAPRC Maximum Incremental Reactivity (MIR) scale for the United States from 1988 to 2010. J. Air Waste Manag. Assoc. 2018, 68, 1301–1316. [Google Scholar] [CrossRef] [Green Version]
  30. Ishikawa, A.; Ohira, T.; Miyamoto, K.; Inoue, A.; Ohkoshi, M. Emission of volatile organic compounds during drying of veneer: Red meranti (Shorea sect. Rubroshorea), larch (Larix sp.), and sugi (Cryptomeria japonica D. Don). Bull. For. For. Prod. Res. Inst. 2009, 8, 115–125. [Google Scholar]
Figure 1. The typical manufacturing processes of the plywood industry in this study.
Atmosphere 12 01530 g001
Figure 2. Average mass concentrations and chemical composition of VOCs in workshops of the plywood manufacturing industry (red bar) and background ambient air (blue bar). The errors bars indicate the standard deviations.
Atmosphere 12 01530 g002
Figure 3. (a) Average mass concentrations and chemical composition of VOCs in three processes, and the species with the 10 highest concentrations except for formaldehyde in (b) the adhesive-making, (c) the adhesive-coating, and (d) the hot-pressing processes of the plywood manufacturing industry. The errors bars indicate the standard deviations.
Atmosphere 12 01530 g003
Figure 4. (a) The average OFP values of total VOCs and their chemical composition from the plywood manufacturing industry and three processes; (b) the VOC species with top three OFP values except for formaldehyde in three processes. The errors bars indicate the standard deviations.
Atmosphere 12 01530 g004
Figure 5. Non-cancer toxic health risks for individual VOC species (HQ) and total VOCs (HI) from three processes of the plywood manufacturing industry. The dotted lines indicate the threshold values.
Atmosphere 12 01530 g005
Figure 6. Lifetime cancer risks for individual VOC species (LCR) and total VOCs (T-LCR) from three processes of the plywood manufacturing industry. The dotted lines indicate the threshold values.
Atmosphere 12 01530 g006
Figure 7. Occupational exposure cancer risk for individual VOC species (OECR) and total VOCs (T-OECR) from three processes of the plywood manufacturing industry.
Atmosphere 12 01530 g007
Figure 8. Air supply volume (Q) and ventilation rates of formaldehyde and 1,2-dichloroethane from three processes in the plywood manufacturing industry.
Atmosphere 12 01530 g008
Publisher’s Note: MDPI stays neutral with regard to jurisdictional claims in published maps and institutional affiliations.