Article

Mortality Sensitivity of Cardiovascular, Cerebrovascular, and Respiratory Diseases to Warm Season Climate in Japanese Cities

1
Faculty of Biosphere-Geosphere Science, Okayama University of Science, 1-1 Ridai-cho, Kita-ku, Okayama 700-0005, Japan
2
Graduate School of Frontier Sciences, The University of Tokyo, Chiba 277-0822, Japan
*
Author to whom correspondence should be addressed.
Atmosphere 2021, 12(12), 1546; https://doi.org/10.3390/atmos12121546
Submission received: 10 November 2021 / Revised: 20 November 2021 / Accepted: 22 November 2021 / Published: 24 November 2021
(This article belongs to the Special Issue Impacts of Hot and Cold Spells for Non-communicable Diseases)

Abstract

:
We investigated decadal (2010–2019) cardiovascular, cerebrovascular, and respiratory mortality sensitivity to annual warm temperatures in major Japanese cities: Sapporo, Tokyo (23 wards), and Osaka. The summer mortalities (June–August) increased with the monthly mean temperature for acute myocardial infarction, other acute ischemic heart diseases, cerebral infarction, and pneumonia in the three cities. Monthly mean temperatures were an indicator of these disease mortalities in Japan. However, similar responses were not found for cardiac arrhythmia and heart failure (excluding Sapporo), subarachnoid hemorrhage, and intracerebral hemorrhage. The decadal sensitivities and risk ratios between the maximum and minimum monthly mean temperatures were calculated using a linear regression model. In Sapporo, Tokyo, and Osaka, for example, the analyses of acute myocardial infarction showed summer positive responses of 0.19–0.25, 0.13–0.18, and 0.12–0.30, respectively, as the mortality rate (per 100,000 population) per 1 °C of monthly mean temperature, which estimated increased risks (between the coolest and hottest months) of 37–65% in Sapporo, 31–42% in Tokyo, and 35–39% in Osaka.

1. Introduction

Many studies have suggested a relationship between exposure to summer heat stress due to atmospheric warming and an increase in heat-related mortality or morbidity [1,2,3,4]. The recent heat-related mortality burden for global, regional, and rational scales was clarified by Zhao et al. (2021) [5]. Additionally, many researchers have revealed that a higher risk of developing cardiovascular diseases (CVD), cerebrovascular diseases (CBD), and respiratory diseases (RD) during the warm season is caused by global warming and urban heat islands [6,7,8,9]. For example, Li et al. (2015) [10] used the results of global atmospheric circulation models to predict that concerns regarding CVD and RD will increase in the future in Beijing.
Bunker et al., (2016) [11] conducted a meta-analysis on the epidemiological relationship between air temperature and heat-related deaths and illnesses in people who are older (over 65 years of age) worldwide. A 1 °C rise in temperature increased the CVD, CBD, and RD mortalities in summer months, as revealed by their results. Although Japanese data were not included in their analysis, some epidemiological studies investigating the influence of temperature on CVD, CBD, and RD mortality and morbidity have been reported in domestic Japanese papers [12,13,14]. However, no Japanese research has been reported on epidemiological data in recent years, especially in international journals. In this study, using recent decadal death data, the CVD, CBD, and RD mortalities in large Japanese cities were found to be associated with annual differences in warm season climates.

2. Materials and Methods

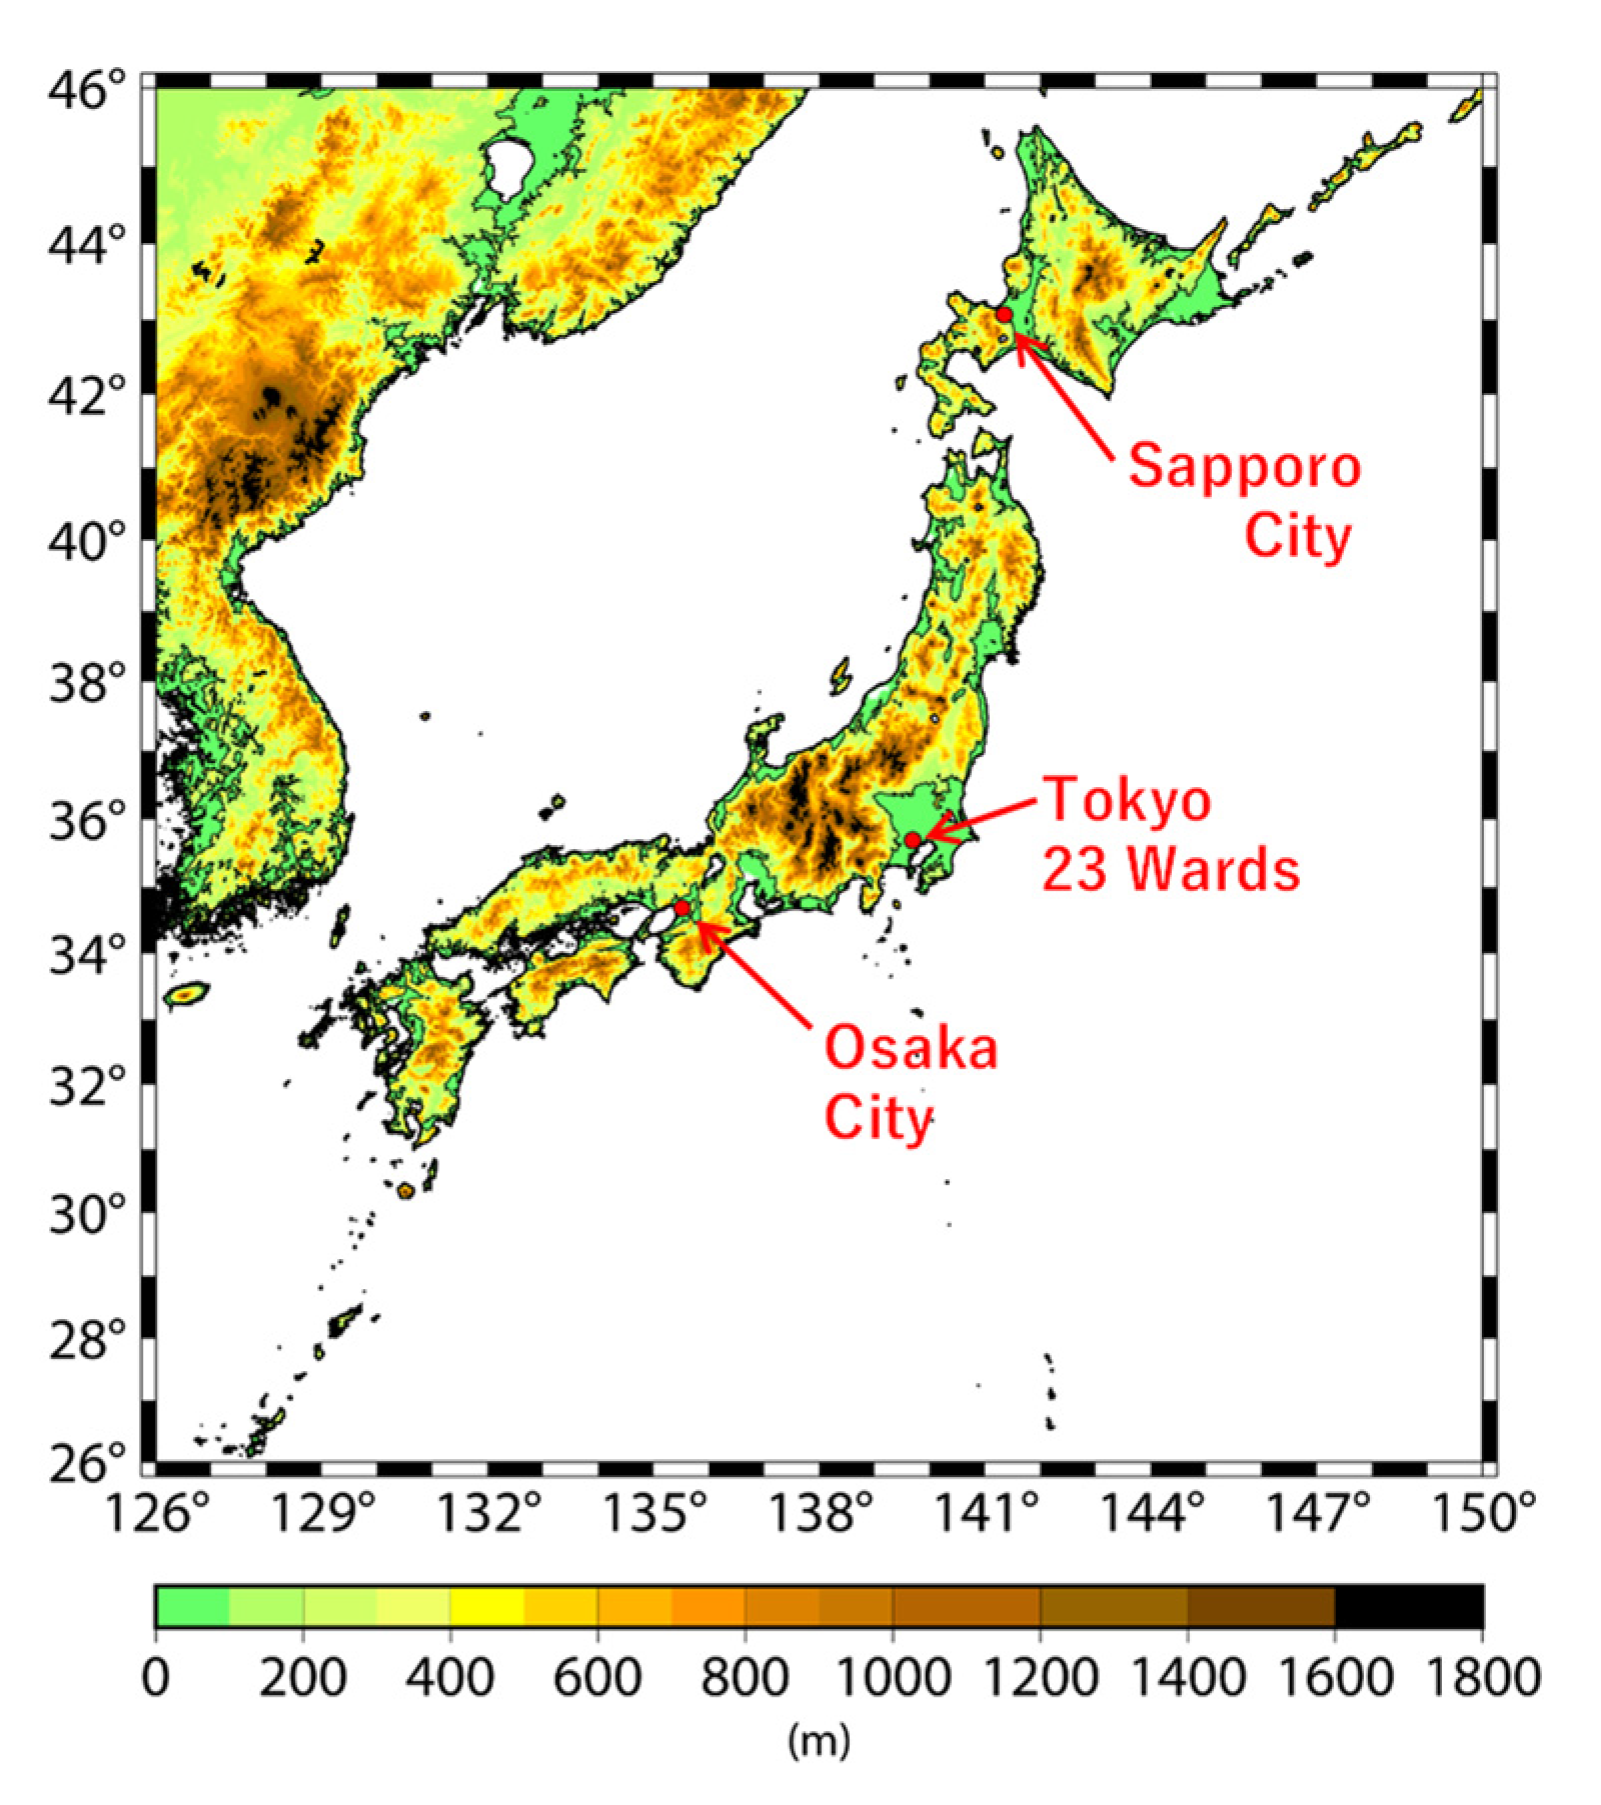
2.1. Epidemiological Data

This study investigated three densely populated cities in Japan: Sapporo, Tokyo (23 wards), and Osaka (Figure 1), which have populations of approximately 1.95, 9.27, and 2.69 million people, respectively, according to the 2015 national census. These cities rank as the top five most populous in Japan. Table 1 summarized the disease classification adopted in this study, which adheres to the Japanese Ministry of Health, Labor and Welfare (MHLW), based on the International Classification of Diseases, 10th revision (ICD-10) [15]. For CVD, four classifications were chosen for analysis: acute myocardial infarction (AMI), other ischemic heart disease (IHD), cardiac arrhythmia and conduction disorder (CACD), and heart failure (HF). For CBD, three classifications were chosen: subarachnoid hemorrhage (SAH), intracerebral hemorrhage (ICH), and cerebral infarction (CI). Moreover, pneumonia (PNA) was considered RD in this study.
The number of deaths is published as monthly data on the Japanese government website of e-Stat (https://www.e-stat.go.jp, accessed on 10 November 2021) for each cause of death in five-year age classifications of 0–4, 5–9, 10–14, …, 80–84, and over 85 groups. We used monthly mortality from May (spring) to October (autumn) because the features analyzed in the summer months from July to August are found by a comparison with spring and autumn data.

2.2. Age-Adjusted Mortality

To eliminate yearly changes and city differences in the population by age group, the age-adjusted mortality rate (MRadj) was used in this study.
M R a d j = k ( M R k · P k ) k P k
where k is the age group number separated into five years old. MRk and Pk correspond to the mortality rate and standard population for a specific age group k, respectively. Here, the population structure by age group in 2015 was adopted as Pk. The MRadj of each disease was calculated per 100,000 people in each city.

2.3. Climate Data

Table 2 shows the climatological temperatures in the three cities that were observed by the Japan Meteorological Agency (JMA). These temperatures correspond to the normal values averaged over the past 30 years (1981–2010) in Japan. Sapporo has a cool subtropical climate (Dfa), while Tokyo (23 wards) and Osaka have humid subtropical climates (Cfa), according to the Köppen–Geiger climate classification [16]. The temperature of Sapporo is lower than 30 °C during summer, even in the monthly averaged maximum. Osaka has the hottest summer of the three cities, reaching 33 °C according to the monthly averaged maximum temperature. As a reference, the decadal temperatures (2010–2019) observed in the three cities are displayed in Figure S1.
In this study, the monthly average of daily mean temperature (MMT) and the monthly number of days recording a daily maximum temperature over 25 °C (MN25), 30 °C (MN30), and 35 °C (MN35) in each year from 2010 to 2019 were used as indicators of mortality. The temperature data were sequentially measured by the JMA observational stations in each city and published on the JMA website (https://www.jma.go.jp/jma/index.html, accessed on 10 November 2021).

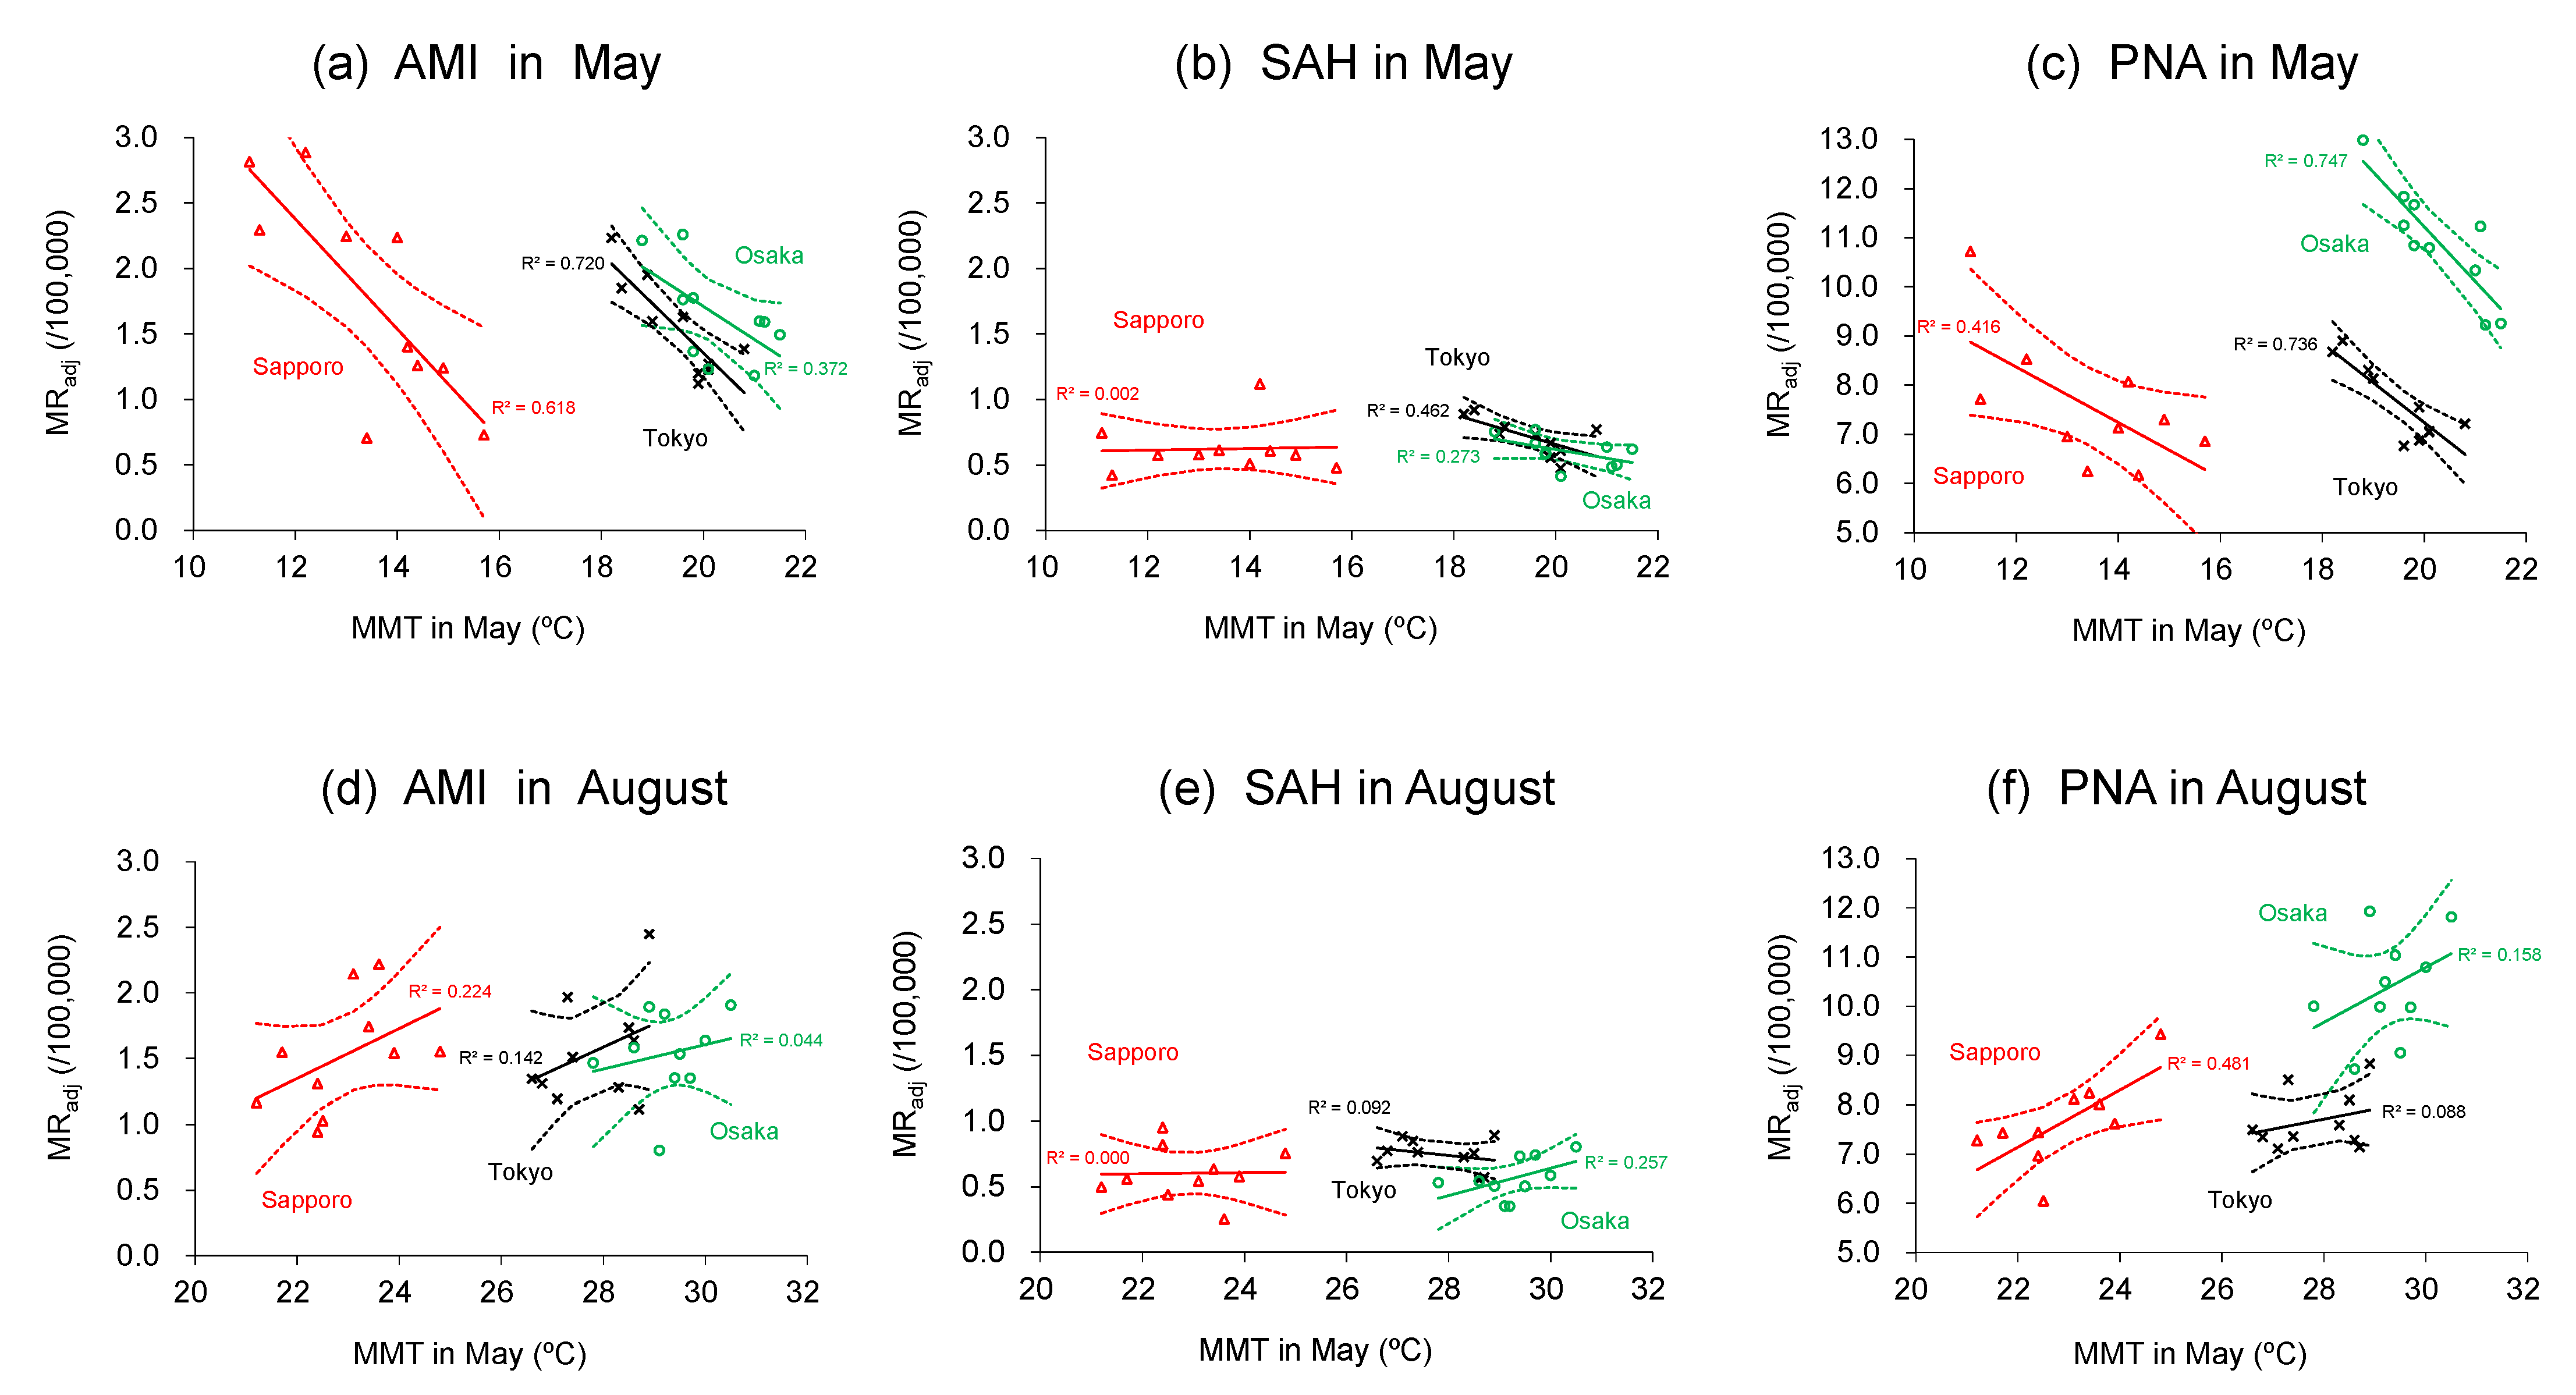
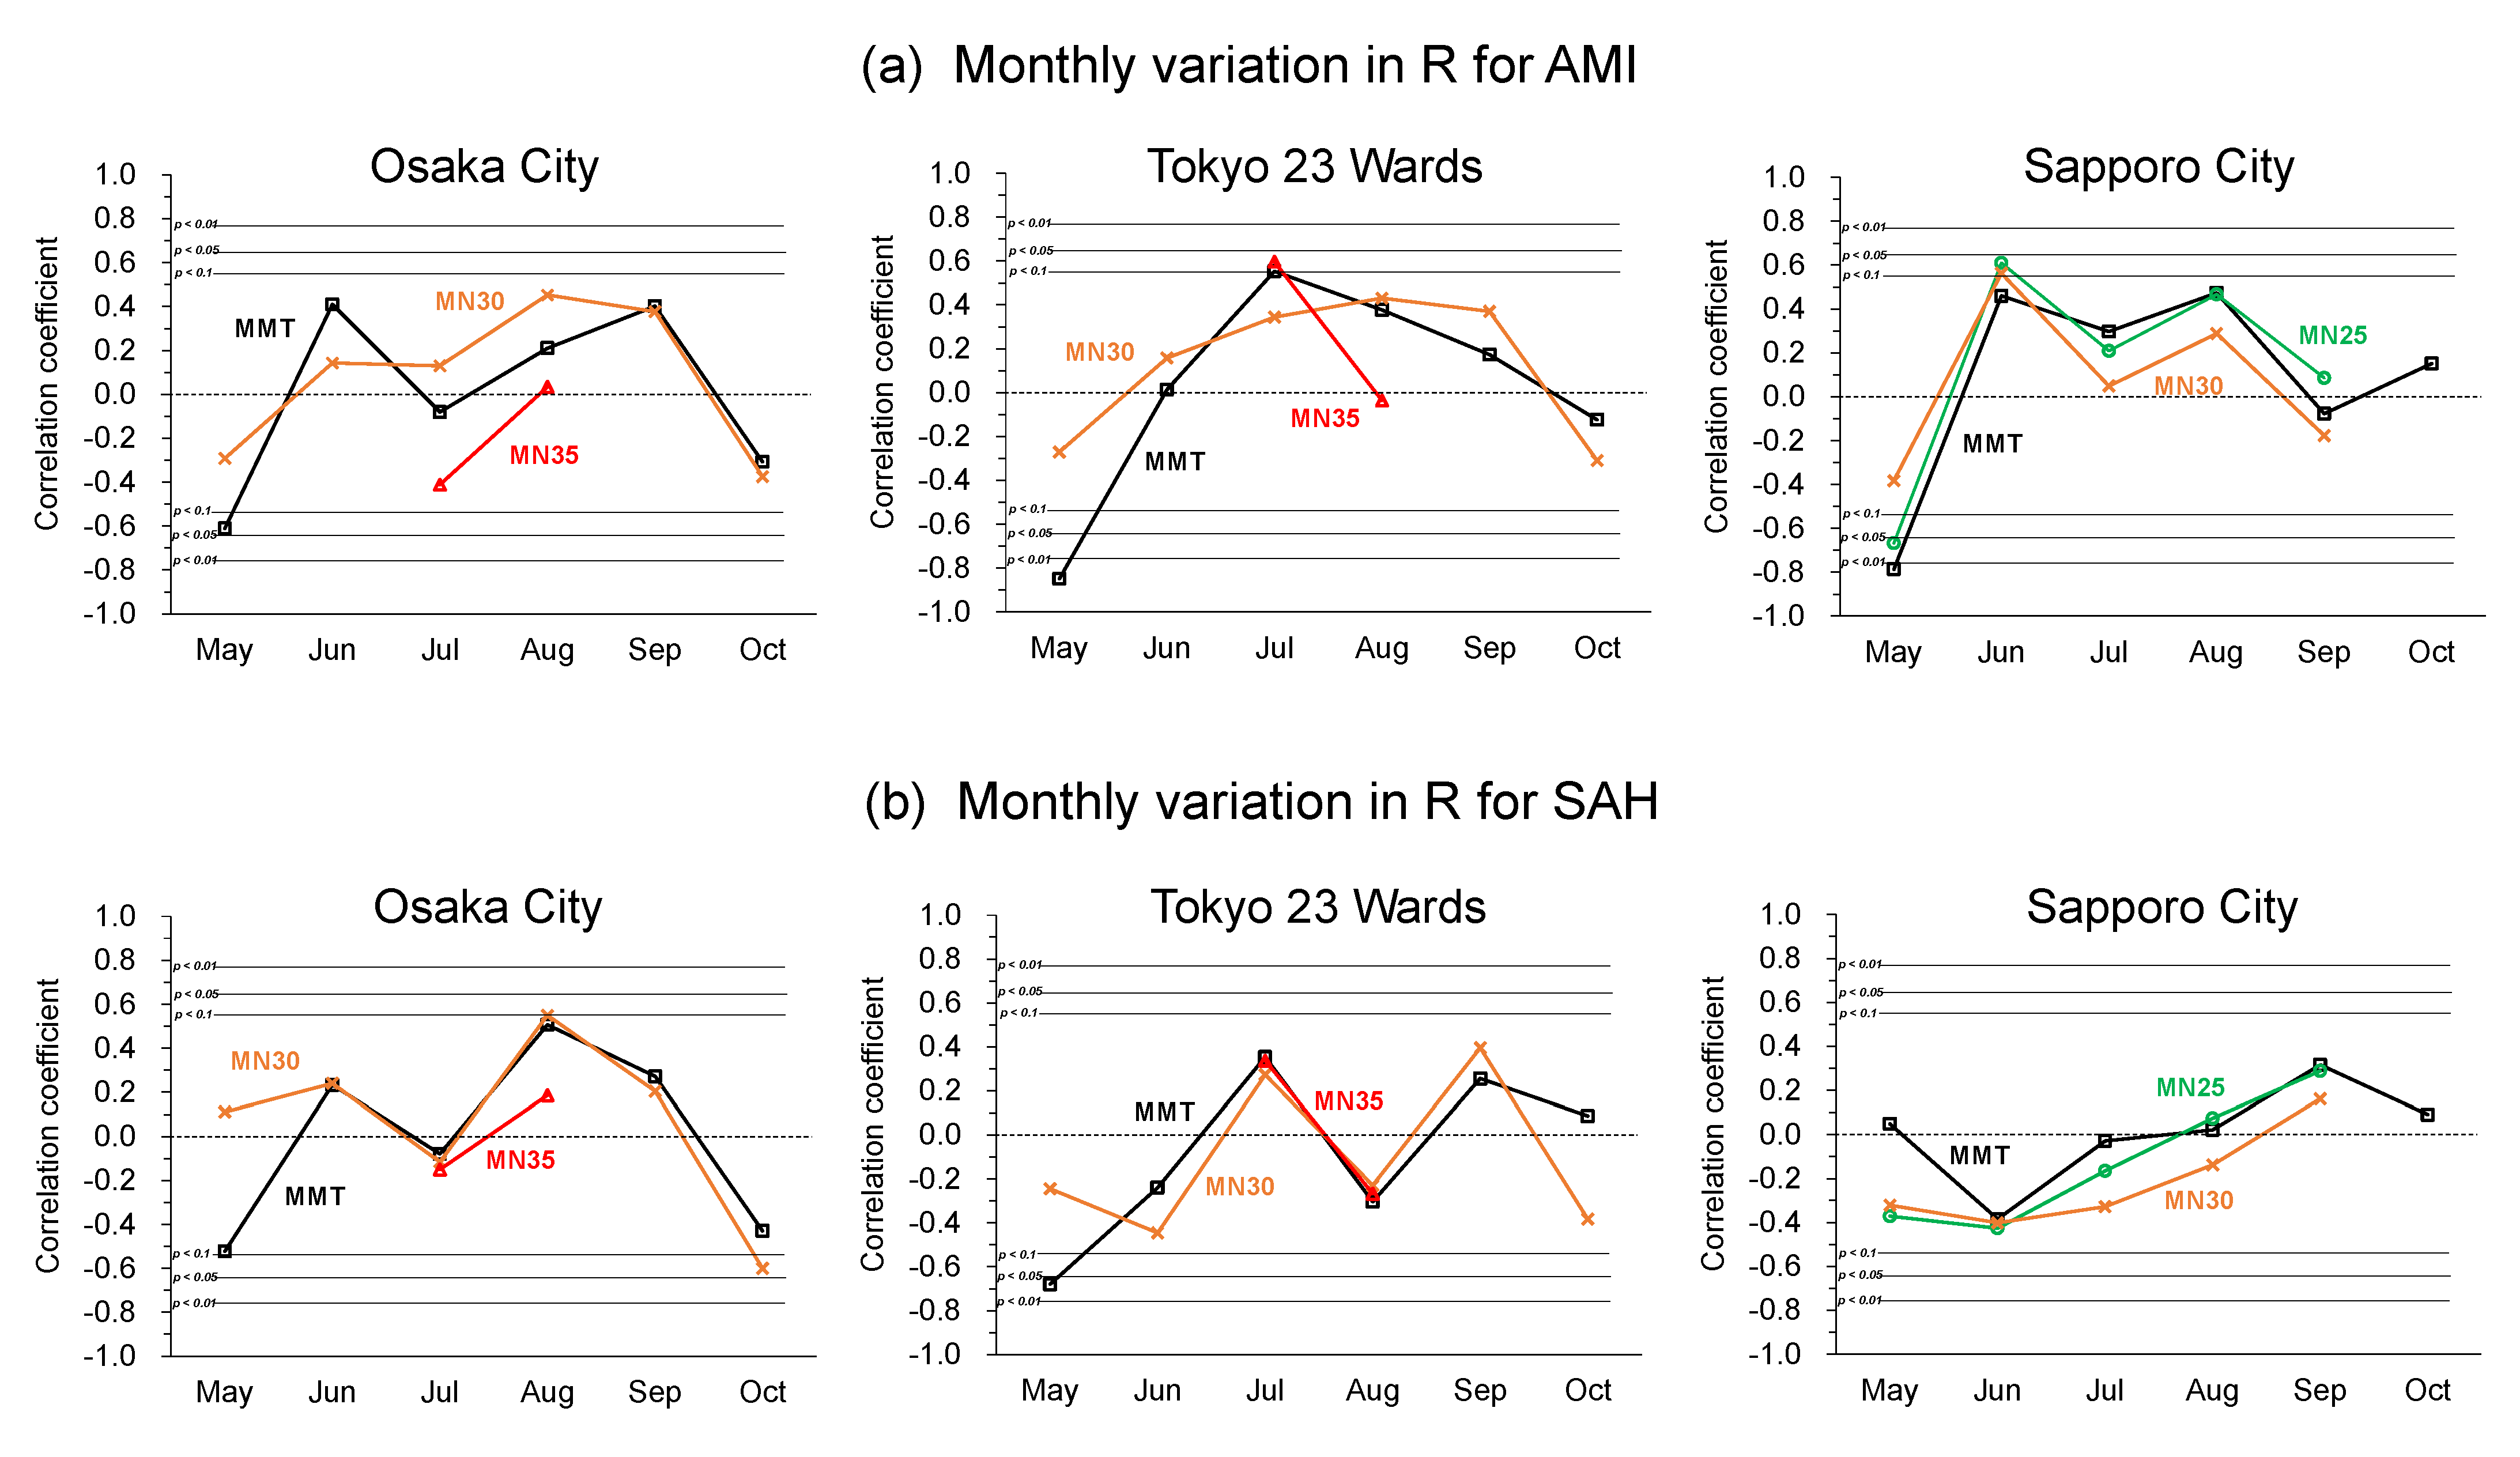
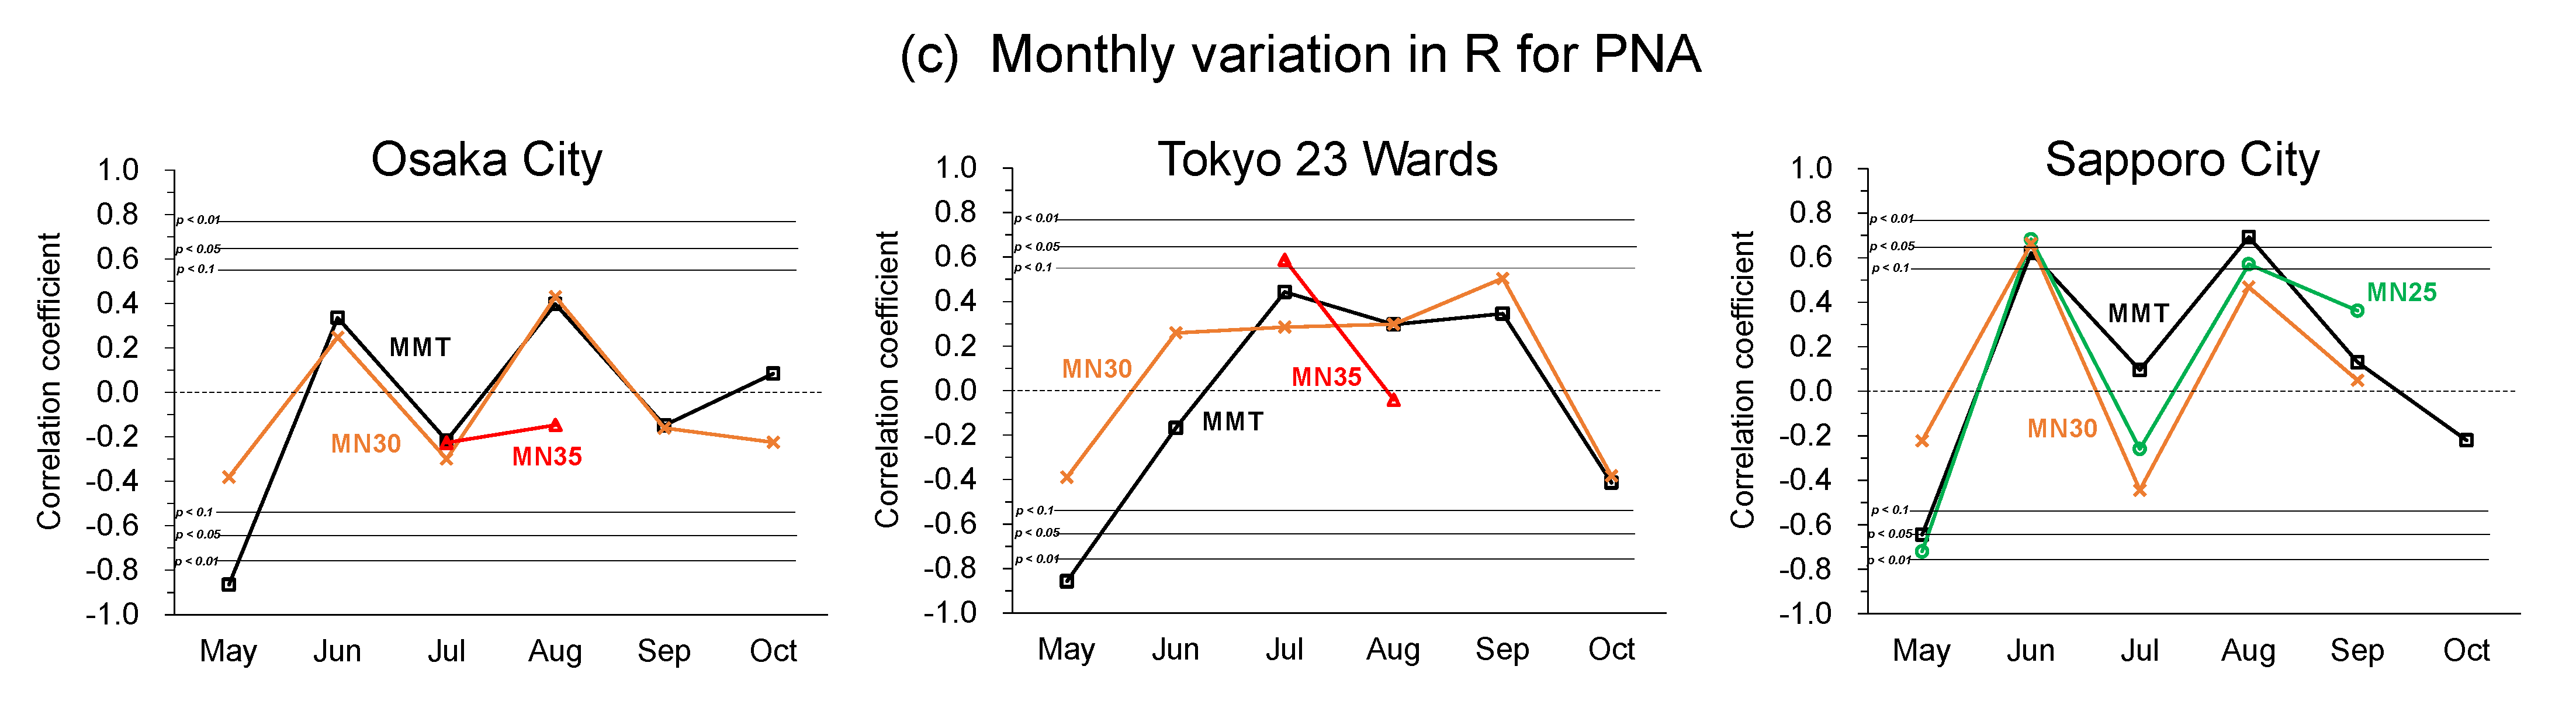
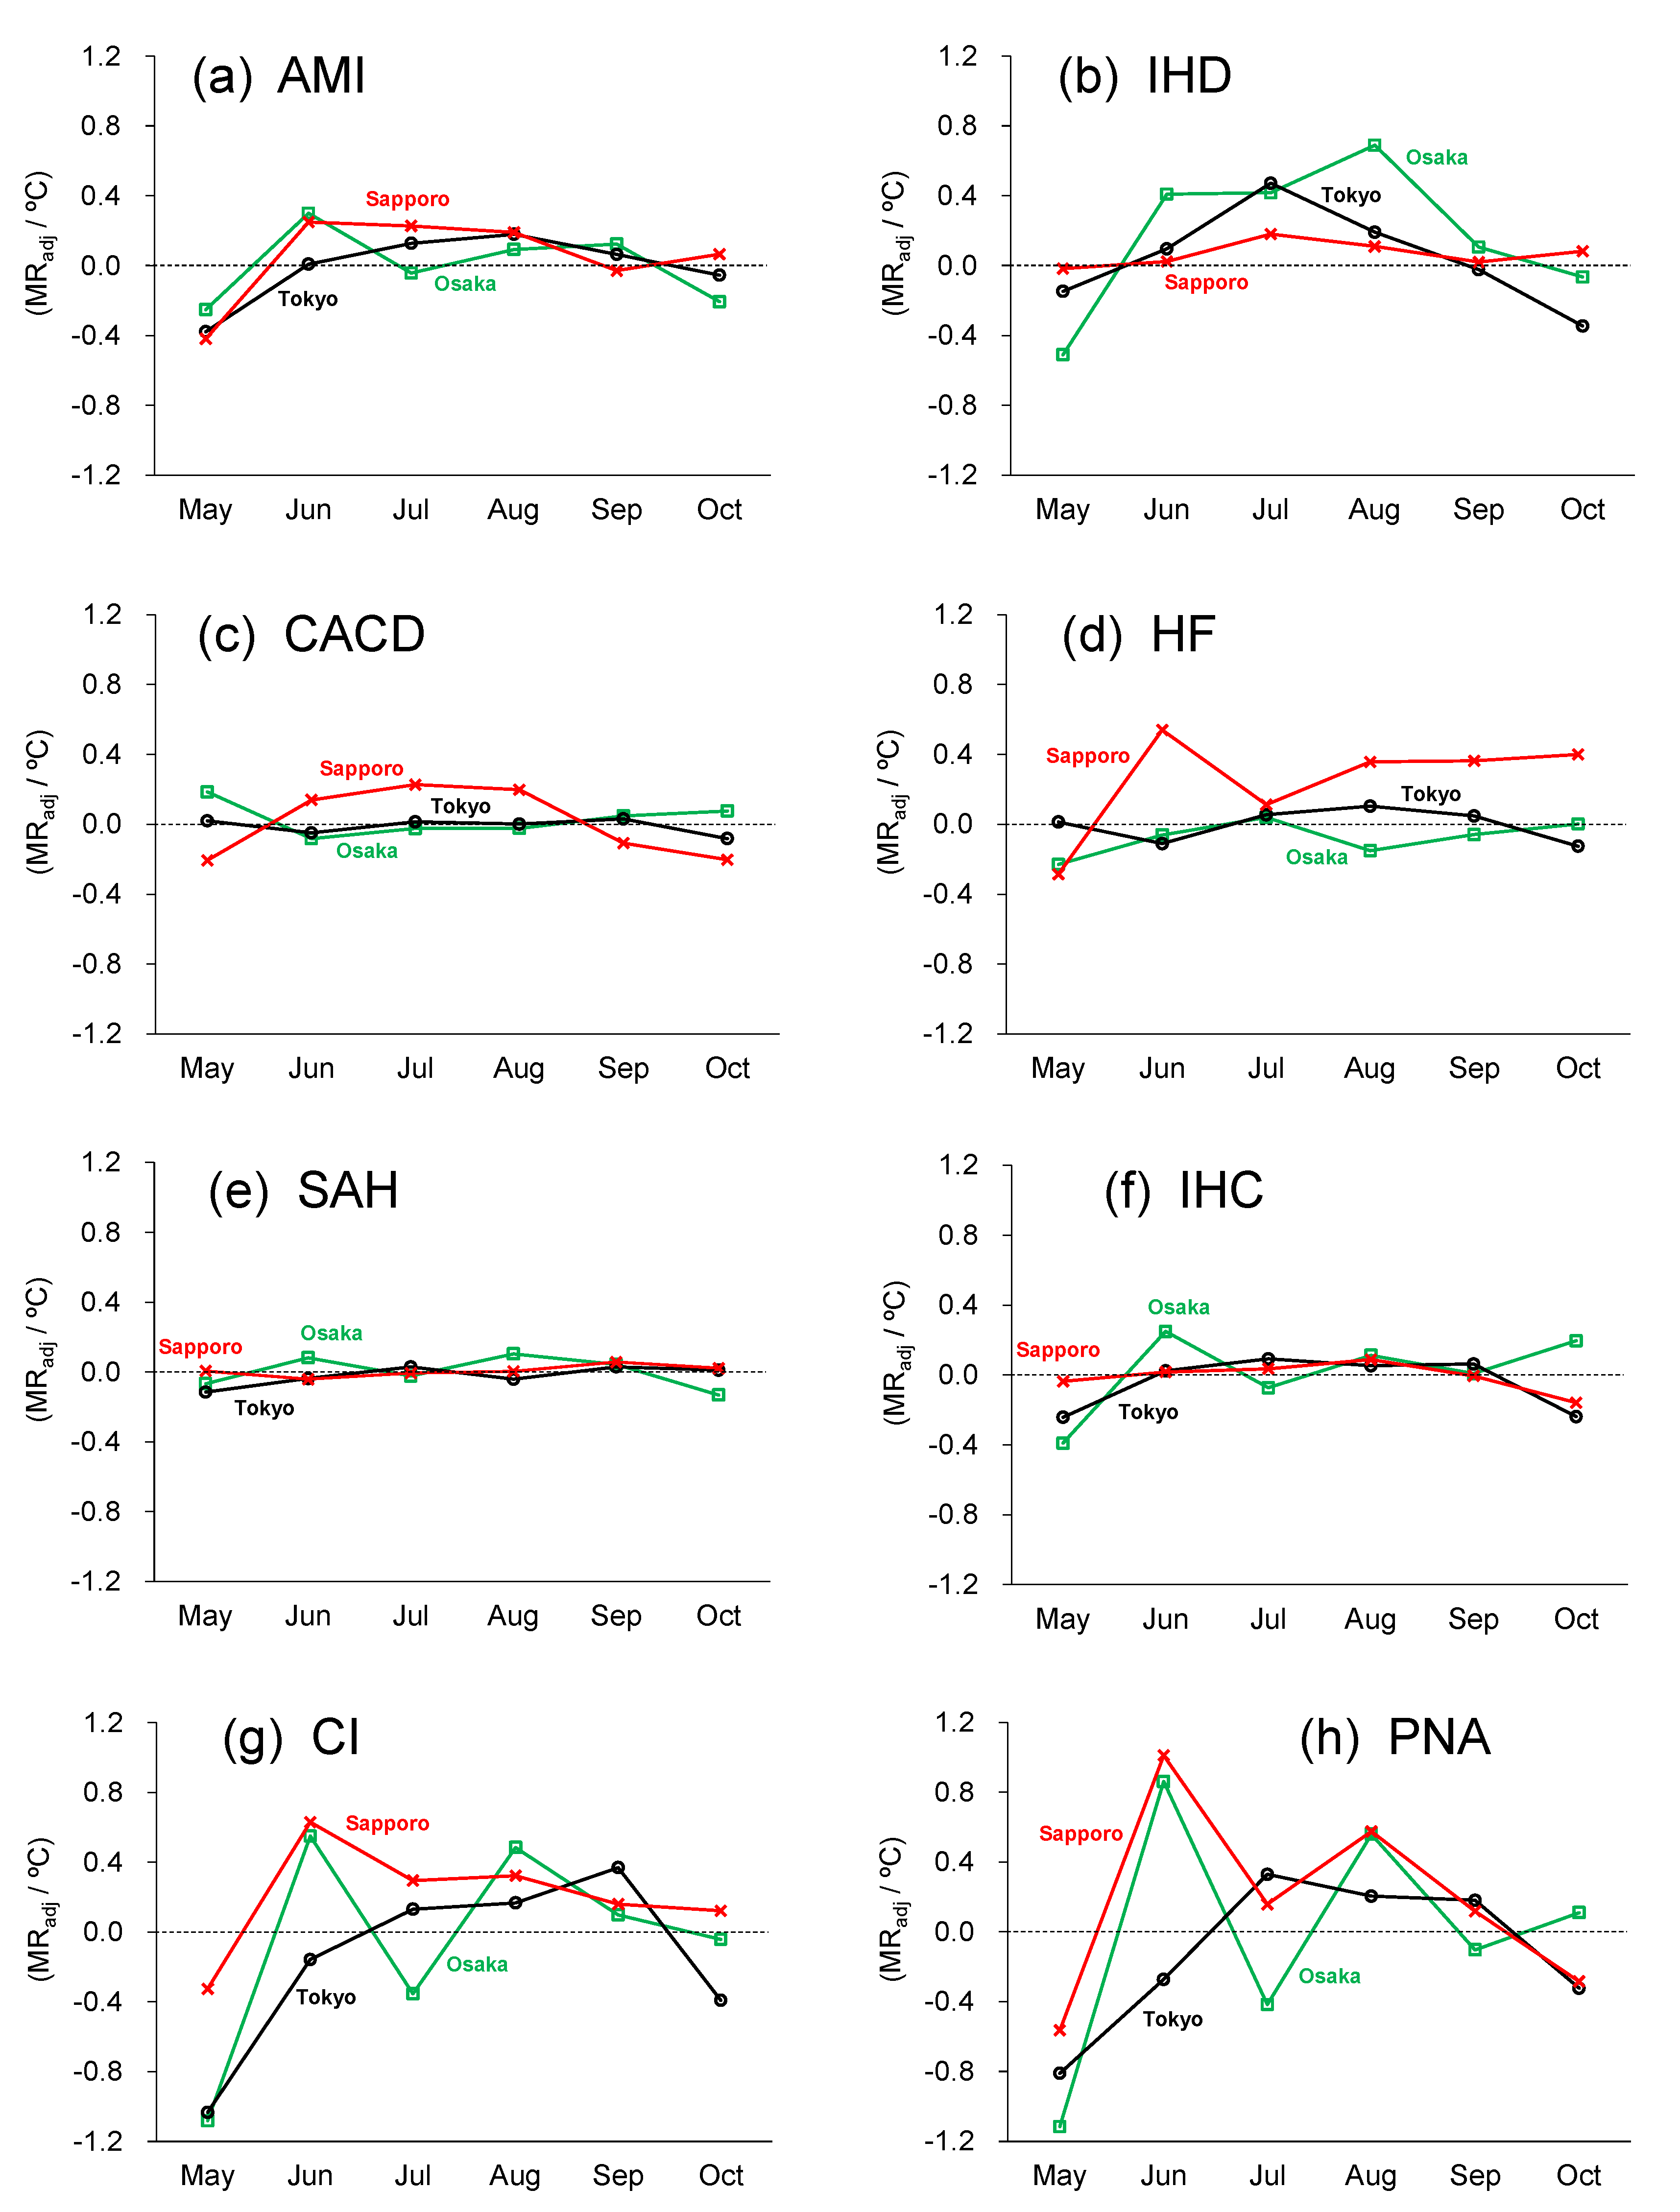
3. Results and Discussion

As a typical example, the response of each disease death rate to MMT was presented for AMI, SAH, and PNA (Figure 2), in which the yearly variations were analyzed for the decade. The MRadj of AMI in May (Figure 2a) had a negative response to MMT in all cities, suggesting that the AMI mortality rate increases more in a year when the May MMT is lower. Similar trends were found for the May PNA of RD in all cities (Figure 2c). Honda et al. [17,18] found the optimal temperature (defined by values ranging from 80 to 85 percentiles in daily maximum temperatures during one year), and the relative risk of mortality increased in a V-shaped curve if the daily maximum temperature was lower or higher than this optimal temperature. According to their analysis, the optimal temperatures in 2010–2019 can be estimated as the ranges of 30.2–32.0 °C, 28.0–29.6 °C, and 24.4–25.7 °C in Osaka, Tokyo, and Sapporo, respectively. As the monthly mean value of the daily maximum temperature in May had respective decadal ranges of 23.8–27.0 °C, 21.5–25.1 °C, and 15.4–21.8 °C in Osaka, Tokyo, and Sapporo, the negative responses found in May suggest a cold-related increase in MRadj.
In contrast, the MRadj due to AMI and PNA in August (Figure 2d) had a positive response to MMT in all cities despite a difference in the climate zone between Sapporo and the other cities. The monthly mean value of daily “maximum” temperature in Sapporo had the decadal range of 25.0–29.1 °C in August, which exceeded the optimal temperature range of 24.4–25.7 °C. The meta-analysis conducted by Moghadamnia et al. [19], which included 26 studies from around the world, demonstrated that the mortality risk of CVD statistically increased by 1.3% for heat exposure. They mentioned the possibility that the increase in CVD mortality was attributed to the increases in the viscosity of plasma, cholesterol levels in serum, and red blood cell and platelet counts, due to dehydration by high temperature exposure. Additionally, Alahmad et al. [20] suggested that the increase in core body temperature due to the exaggerated response of thermoregulatory processes triggered acute CVD. Meanwhile, a PNA mortality increase at hot temperatures was demonstrated by Bunker et al. [11], using a meta-analysis. Although the underlying physiological mechanisms by which heat triggers RD mortality are not well understood, they seem to be largely mediated by a thermoregulatory pathway [8]. Bunker et al. [11] noted that heat exposure could trigger the release of inflammatory factors and exacerbate chronic obstructive pulmonary disease (COPD).
Meanwhile, the MRadj of SAH was insignificant for MMT in both May and August (Figure 2b,e). Lavados et al. [21] indicated that the effects of ambient temperature on the SAH risk in summer were ambiguous compared to those in winter.
The monthly variations in Pearson’s correlation coefficients (R) between the MRadj and MMT, MN25, MN30, and MN35 for all diseases are exhibited in Figure 3 and Figure S2. According to the climate conditions of each city, the MN25 result was excluded in Osaka and Tokyo, while the MN35 was excluded from Sapporo in the graphs. The monthly variation of R in each disease can be roughly classified into three groups: (i) positive R values during summer from June to August (AMI in Tokyo and Sapporo, IHD and CACD in Sapporo, HF in Tokyo, ICH in Tokyo and Sapporo, CI in Tokyo, and PNA in Tokyo), (ii) the bimodal positive R during summer (AMI in Osaka, HF in Sapporo, SAH in Osaka and Tokyo, ICH in Osaka, CI in Osaka and Sapporo, and PNA in Osaka and Sapporo), and (iii) no signal of R in summer or ambiguity in seasonal variation of R (CACD in Osaka and Sapporo, HF in Osaka, and SAH in Sapporo).
The correlation of MRadj with MN35 in Osaka tended to be low or negative in July for many diseases and it was negative in Tokyo in August (Figure 3 and Figure S2). In Osaka, extremely hot days for MN35 began to appear in July (the decadal average was 4.6 days, and the yearly was 14 days at the maximum); however, the MN35 was 0–2 in July in Tokyo. One possible explanation is a behavioral change in which residents reduced their amount of individual extreme heat exposure, which is considered the reason for the abovementioned summer bimodal pattern (ii). In August, the MN35 increased in Tokyo, while the MN30 increased in Sapporo. Although the August MMT in Sapporo was 22.3 °C and the monthly average daily maximum temperature was lower than 30 °C (cf. Table 2), the MN30 (days exceeding 30 °C) was recorded as the decadal average of 5.5 days and an annual of 13 days at the maximum. Lim et al. [22] verified that dehydration markers in the blood (as indicators of cardiovascular burden) increased when the daily mean apparent temperature exceeded 27 °C. Days exceeding 30 °C in air temperature had a relative humidity of 40–60% in Sapporo, which corresponded to more than 30 °C in the apparent temperature.
Figure 4 displays mortality sensitivities to temperature for each disease denoted as the value of monthly MRadj/°C. HF in Tokyo and Osaka, and SAH and ICH in all cities showed little MRadj sensitivity during summer, in addition to the abovementioned group of (iii). Therefore, risks of these diseases are insignificant for a hot summer climate in cities. Significant sensitivities and risk ratios obtained from the decadal data are summarized in Table 3. Here, the decadal risk ratio was defined as a ratio of the MRadj (estimated by the regression line) in the highest MMT of the decade to that in the lowest MMT. As displayed in Figure 4, summer months from June to August presented a higher positive sensitivity of MRadj to the increase in MMT for many diseases in the cities. The results shown in Figure 4 and Table 3 clarified significant MRadj and risk increases in AMI and IHD of the CVD, CI of the CBD, and PNA of the RD. In Sapporo only, risk increases of CACD and HF of the CVD appeared. In all cities, for example, risk ratios in AMI suggested that the monthly MRadj increased by 30% (i.e., 1.3 in the risk ratio) at the minimum between the decadal lowest and highest MMTs in the decade. The maximum increase in MRadj risk was estimated in AMI in Sapporo (65% increase), IHD in Osaka (65% increase), CACD in Sapporo (63% increase), and CI in Sapporo (76% increase).
As shown in Table 3, the summer highly sensitive MRadj to MMT was IHD in Osaka (+0.41–0.69), HF in Sapporo (+0.36–0.54), CI in Sapporo (+0.16–0.63) and Osaka (+0.48–0.55), and PNA in Sapporo (+0.58–1.01) and Osaka (+0.56–0.86). As with the risk ratio, large values of MR sensitivity were found in many diseases in Sapporo. This result is probably attributed to the vulnerability of Sapporo residents to hot climate exposure. Keatinge et al. [23] demonstrated that heat-related mortality rapidly increased for lower temperatures in cities or countries with cool climate zones in summer compared with cities or countries with a hot climate. Consequently, the results of this study provide monthly mean temperatures as an indicator of several CVD, CBD, and RD mortalities for use in climate change evaluation in Japan.

4. Conclusions

We investigated decadal (2010–2019) cardiovascular, cerebrovascular, and respiratory mortality sensitivity to annual warm temperatures in major Japanese cities: Sapporo, Tokyo (23 wards), and Osaka. No Japanese research has been reported in epidemiological data in recent years. By analyses including spring and autumn months, a characteristic response of those mortalities to temperature was found in the summer months. The summer mortalities (June–August) increased with the monthly mean temperature (MMT) for acute myocardial infarction, other acute ischemic heart diseases, cerebral infarction, and pneumonia in the three cities. This result suggested MMTs could be a simple indicator of these disease mortalities in Japan. However, similar responses were not found for cardiac arrhythmia and heart failure (excluding Sapporo), subarachnoid hemorrhage, and intracerebral hemorrhage.
Using a linear regression analysis, the decadal sensitivities between the maximum (hottest) and minimum (coolest) MMTs showed, for acute myocardial infarction, as an example, summer positive responses of 0.19–0.25 in Sapporo, 0.13–0.18 in Tokyo, and 0.12–0.30 in Osaka, as the mortality rate (per 100,000 population) per 1 °C of MMT. Their risk ratios were estimated increased risks (between the coolest and hottest months) of 37–65% in Sapporo, 31–42% in Tokyo, and 35–39% in Osaka. As with the risk ratio, large values of MR sensitivity were found in many diseases in Sapporo. This result is probably attributed to the vulnerability of Sapporo residents to hot climate exposure.

Supplementary Materials

The following are available online at https://www.mdpi.com/article/10.3390/atmos12121546/s1, Figure S1: Monthly mean temperatures averaged from 2010 to 2019 (black line), the highest value for ten years (red line), and the lowest value for ten years (blue line) in (a) Sapporo City, (b) Tokyo (23 wards), and (c) Osaka City. Bars in the graphs indicate the temperature difference between the highest and the lowest years (i.e., red minus blue), Figure S2: Monthly variations in Pearson’s correlation coefficients (R) between the MRadj and MMT, the number of daily maximum temperatures over 25 °C (MN25), 30 °C (MN30), and 35 °C (MN35). The results are indicated for (a) IHD, (b) CACD, (c) HF, (d) ICH, and (e) CI, in Osaka City, Tokyo (23 wards), and Sapporo City. p-values for R are depicted for p < 0.1, 0.05, and 0.01.

Author Contributions

Conceptualization, Y.O.; methodology, Y.O.; formal analysis, Y.O. and A.M.; data curation, A.M.; writing—original draft preparation, Y.O.; writing—review and editing, Y.O. and T.I.; visualization, Y.O. and A.M.; supervision, Y.O. and T.I.; funding acquisition, Y.O. and T.I. All authors have read and agreed to the published version of the manuscript.

Funding

This research was funded by the Japan Society for the Promotion of Science, KAKENHI Grant-in-Aid for Scientific Research (B) number 20H03949.

Institutional Review Board Statement

Not applicable.

Informed Consent Statement

Not applicable.

Data Availability Statement

The original data analyzed in the current study are openly available in “e-Stat” (for the death data) at https://www.e-stat.go.jp (accessed on 10 November 2021) and the JMA repository (for the temperature data) at https://www.data.jma.go.jp/gmd/risk/obsdl/index.php (accessed on 10 November 2021).

Conflicts of Interest

The authors declare no conflict of interest.

References

  1. Ostro, B.; Barrera-Gómez, J.; Ballester, J.; Basagaña, X.; Sunyer, J. The impact of future summer temperature on public health in Barcelona and Catalonia, Spain. Int. J. Biometeorol. 2012, 56, 1135–1144. [Google Scholar] [CrossRef] [PubMed]
  2. Modarres, R.; Ghadami, M.; Naderi, S.; Naderi, M. Future heat stress arising from climate change on Iran’s population health. Int. J. Biometeorol. 2018, 62, 1275–1281. [Google Scholar] [CrossRef] [PubMed]
  3. Li, D.; Yuan, J.; Kopp, R.E. Escalating global exposure to compound heat-humidity extremes with warming. Environ. Res. Lett. 2020, 15, 064003. [Google Scholar] [CrossRef]
  4. Varquez, A.C.G.; Darmanto, N.S.; Honda, Y.; Ihara, T.; Kanda, M. Future increase in elderly heat-related mortality of a rapidly growing Asian megacity. Sci. Rep. 2020, 10, 9304. [Google Scholar] [CrossRef] [PubMed]
  5. Zhao, Q.; Guo, Y.; Ye, T.; Gasparrini, A.; Tong, S.; Overcenco, A.; Urban, A.; Schneider, A.; Entezari, A.; Vicedo-Cabrera, A.M.; et al. Global, regional, and national burden of mortality associated with non-optimal ambient temperatures from 2000 to 2019: A three-stage modelling study. Lancet Planet. Health 2021, 5, e415–e425. [Google Scholar] [CrossRef]
  6. Liu, L.; Breitner, S.; Pan, X.; Franck, U.; Leitte, A.M.; Wiedensohler, A.; von Klot, S.; Wichmann, H.E.; Peters, A.; Schneider, A. Associations between air temperature and cardio-respiratory mortality in the urban area of Beijing, China: A time-series analysis. Environ. Health 2011, 10, 51. [Google Scholar] [CrossRef] [Green Version]
  7. de Blois, J.; Kjellstrom, T.; Agewall, S.; Ezekowitz, J.A.; Armstrong, P.W.; Atar, D. The Effects of Climate Change on Cardiac Health. Cardiology 2015, 131, 209–217. [Google Scholar] [CrossRef]
  8. Achebak, H.; Devolder, D.; Ingole, V.; Ballester, J. Reversal of the seasonality of temperature-attributable mortality from respiratory diseases in Spain. Nat. Commun. 2020, 11, 2457. [Google Scholar] [CrossRef]
  9. Huang, H.; Deng, X.; Yang, H.; Zhou, X.; Jia, Q. Spatio-temporal mechanism underlying the effect of urban heat island on cardiovascular diseases. Iran. J. Pub. Health 2020, 49, 1455–1466. [Google Scholar] [CrossRef]
  10. Li, T.; Ban, J.; Horton, R.M.; Bader, D.A.; Huang, G.; Sun, Q.; Kinney, P.L. Heat-related mortality projections for cardiovascular and respiratory disease under the changing climate in Beijing, China. Sci. Rep. 2015, 5, 11441. [Google Scholar] [CrossRef] [Green Version]
  11. Bunker, A.; Wildenhain, J.; Vandenbergh, A.; Henschke, N.; Rocklöv, J.; Hajat, S.; Sauerborn, R. Effects of air temperature on climate-sensitive mortality and morbidity outcomes in the elderly; a systematic review and meta-analysis of epidemiological evidence. EBioMedicine 2016, 6, 258–268. [Google Scholar] [CrossRef] [PubMed] [Green Version]
  12. Yamanaka, S.; Nakamura, Y. Regional differences in the number of patients for circulatory and respiratory diseases and climatical condition. Jpn. J. Biometeor. 1996, 33, 137–145. (In Japanese) [Google Scholar]
  13. Xu, J.; Inaba, Y. Seasonal and weather influences on cerebrovascular disorder. Chikyu Kankyo 2003, 8, 201–209. (In Japanese) [Google Scholar]
  14. Hayama, H.; Kamazawa, Y.; Matsumura, R.; Kikuta, K. Influence of meteorological condition and death location on cause of death. Kousei Shihyo 2011, 58, 1–6. (In Japanese) [Google Scholar]
  15. World Health Organization. International Statistical Classification of Diseases and Related Health Problems 10th Revision. Available online: https://icd.who.int/browse10/2019/en (accessed on 7 November 2021).
  16. Beck, H.E.; Zimmermann, N.E.; McVicar, T.R.; Vergopolan, N.; Berg, A.; Wood, E.F. Present and future Koppen-Geiger climate classification maps at 1-km resolution. Sci. Data 2018, 5, 180214. [Google Scholar] [CrossRef] [Green Version]
  17. Honda, Y.; Kabuto, M.; Ono, M.; Uchiyama, I. Determination of optimum daily maximum temperature using climate data. Environ. Health Prev. Med. 2007, 12, 209–216. [Google Scholar] [CrossRef] [Green Version]
  18. Honda, Y.; Kondo, M.; McGregor, G.; Kim, H.; Guo, Y.-L.; Hijioka, Y.; Yoshikawa, M.; Oka, K.; Takano, S.; Hales, S.; et al. Heat-related mortality risk model for climate change impact projection. Environ. Health Prev. Med. 2014, 19, 56–63. [Google Scholar] [CrossRef]
  19. Moghadamnia, M.T.; Ardalan, A.; Mesdaghinia, A.; Keshtkar, A.; Naddafi, K.; Yekaninejad, M.S. Ambient temperature and cardiovascular mortality: A systematic review and meta-analysis. PeerJ 2017, 5, e3574. [Google Scholar] [CrossRef]
  20. Alahmad, B.; Khraishah, H.; Shakarchi, A.F.; Albaghdadi, M.; Rajagopalan, S.; Koutrakis, P.; Jaffer, F.A. Cardiovascular mortality and exposure to heat an inherently hot region: Implications for climate change. Circulation 2020, 141, 1271–1273. [Google Scholar] [CrossRef]
  21. Lavados, P.M.; Olavarría, V.V.; Hoffmeister, L. Ambient temperature and stroke risk. Stroke 2018, 49, 255–261. [Google Scholar] [CrossRef]
  22. Lim, Y.-H.; Park, M.-S.; Kim, Y.; Kim, H.; Hong, T.-C. Effects of cold and hot temperature on dehydration: A mechanism of cardiovascular burden. Int. J. Biometeorol. 2015, 59, 1035–1043. [Google Scholar] [CrossRef] [PubMed]
  23. Keatinge, W.R.; Donaldson, G.C.; Cordioli, E.; Martinelli, M.; Kunst, A.E.; Mackenbach, J.P.; Nayha, S.; Vuori, I. Heat related mortality in warm and cold regions of Europe: Observational study. BMJ 2000, 321, 670. [Google Scholar] [CrossRef] [PubMed] [Green Version]
Figure 1. Locations of Osaka, Tokyo (23 wards), and Sapporo in Japan.
Atmosphere 12 01546 g001
Figure 2. Relationships between the monthly averaged daily mean temperatures (MMT) and the age-adjusted mortality rate (MRadj) of (a,d) acute myocardial infarction (AMI), (b,e) subarachnoid hemorrhage (SAH), and (c,f) pneumonia (PNA) in (ac) May and (df) August from 2010 to 2019 in Osaka (green), Tokyo (23 wards, black), and Sapporo (red). Solid straight lines indicate the regression line for the corresponding plots. Dashed curves represent the range of 95% confidence interval for the regression line.
Atmosphere 12 01546 g002
Figure 3. Monthly variations of Pearson’s correlation coefficients (R) between the MRadj and MMT, with the number of daily maximum temperatures over 25 °C (MN25), 30 °C (MN30), and 35 °C (MN35). The results are indicated for (a) AMI, (b) SAH, and (c) PNA in Osaka, Tokyo (23 wards), and Sapporo. p-values for R are depicted for p < 0.1, 0.05, and 0.01.
Atmosphere 12 01546 g003aAtmosphere 12 01546 g003b
Figure 4. MRadj sensitivities (MRadj/°C) of each disease to MMT from May to October. Results of (a) AMI, (b) IHD, (c) CACD, (d) HF, (e) SAH, (f) IHC, (g) CI, and (h) PNA for three cities.
Atmosphere 12 01546 g004
Table 1. Disease classification adopted in this study, which adhered to the Japanese Ministry of Health, Labor and Welfare (MHLW), based on the International Classification of Diseases, 10th revision (ICD-10). Abbreviation names indicate the notation used in this study.
ICD-10 CodeDisease NameAbbreviation
Cardiovascular diseases
(CVD)
I21–I22Acute myocardial infarctionAMI
I20, I23–I25Other ischemic heart diseaseIHD
I44–I49Cardiac arrhythmia and conduction
disorder
CACD
I50Heart failureHF
Cerebrovascular diseases
(CBD)
I60, I69.0Subarachnoid hemorrhageSAH
I61, I69.1Intracerebral hemorrhageICH
I63, I69.3Cerebral infarctionCI
Respiratory diseases
(RD)
J12–J18PneumoniaPNA
Table 2. Normal values of temperature (1981–2010) in Osaka, Tokyo (23 wards), and Sapporo from May (spring) to October (autumn). All numerals have a unit of °C and are monthly averaged for daily maximum, mean, and minimum temperatures.
MayJunJulAugSepOct
max/mean/minmax/mean/minmax/mean/minmax/mean/minmax/mean/minmax/mean/min
Osaka 24.5/19.7/15.627.8/23.5/20.031.6/27.4/24.333.4/28.8/25.429.3/25.0/21.723.3/19.0/15.5
Tokyo (23 wards)22.9/18.2/14.025.5/21.4/18.029.2/25.0/21.830.8/26.4/23.026.9/22.8/19.721.5/17.5/14.2
Sapporo 17.3/12.4/8.321.5/16.7/12.924.9/20.5/17.326.4/22.3/19.122.4/18.1/14.216.2/11.8/7.5
Table 3. The significant sensitivity of MRadj to MMT (“Sen” of the upper value with a unit of MRadj/°C) and that risk ratio for decade (“Risk” of the lower value) in each disease. These values are obtained from months presenting positive sensitivities (MRadj/°C) and only indicated with the risk ratio of 1.10 and over.
Osaka Tokyo (23 Wards)Sapporo
Cardiovascular diseases
(CVD)
AMISen: +0.12–0.30
Risk: 1.35–1.39
Sen: +0.13–0.18
Risk: 1.31–1.42
Sen: +0.19–0.25
Risk: 1.37–1.65
IHDSen: +0.41–0.69
Risk: 1.25–1.65
Sen: +0.19–0.47
Risk: 1.10–1.54
Sen: +0.11–0.18
Risk: 1.28–1.32
CACD----Sen: +0.14–0.23
Risk: 1.39–1.63
HF----Sen: +0.36–0.54
Risk: 1.28–1.41
Cerebrovascular diseases
(CBD)
SAH------
ICH------
CISen: +0.48–0.55
Risk: 1.26–1.41
Sen: +0.13–0.37
Risk: 1.10–1.34
Sen: +0.16–0.63
Risk: 1.19–1.76
Respiratory diseases
(RD)
PNASen: +0.56–0.86
Risk: 1.15–1.16
Sen: +0.33
Risk: 1.21
Sen: +0.58–1.01
Risk: 1.31–1.54
Publisher’s Note: MDPI stays neutral with regard to jurisdictional claims in published maps and institutional affiliations.

