Article

Present and Future High-Resolution Climate Forcings over Semiarid Catchments: Case of the Tensift (Morocco)

1
L3G Laboratory, Earth Sciences Department, Faculty of Sciences and Techniques, Cadi Ayyad University, BP 459, Marrakech 40000, Morocco
2
Direction Génerale de la Meteorologie, Casablanca 8106, Morocco
3
Centre for Remote Sensing and Application, Mohammed VI Polytechnic University (UM6P), Ben Guerir 43150, Morocco
4
HydroSciences Montpellier, University Montpellier, CNRS, IRD, CEDEX, 34090 Montpellier, France
5
CESBIO (UPS/CNRS/INRA/IRD/CNES), 18 Avenue Edouard Belin, CEDEX 9, 31401 Toulouse, France
6
Research Institute Development (IRD), 44 Boulevard de Dunkerque, CEDEX, 13002 Marseille, France
7
ProcEDE, Department of Applied Physique, Faculty of Sciences and Technologies, Cadi Ayyad University, Marrakech 40000, Morocco
*
Author to whom correspondence should be addressed.
Atmosphere 2021, 12(3), 370; https://doi.org/10.3390/atmos12030370
Submission received: 17 December 2020 / Revised: 22 February 2021 / Accepted: 23 February 2021 / Published: 11 March 2021
(This article belongs to the Special Issue Climatological and Hydrological Processes in Mountain Regions)

Abstract

:
In semiarid areas, the climate is characterized by strong spatiotemporal variability while the meteorological ground network is often very sparse. In this context, the spatial distribution of meteorological variables is thus a real issue for watershed hydrology, agronomy and the study of surface–atmosphere retroaction in these regions. The aim of this study is twofold: (1) to evaluate and to adapt a reanalysis system “Système d’Analyse Fournissant des Renseignements Adaptés à la Nivologie” (SAFRAN) to map the meteorological variables on the Tensift catchment (Morocco) between 2004 and 2014; (2) to project temperature and precipitation for the 2041–2060 horizon at high-resolution based on the Euro-CORDEX database at 12 km resolution (using two Representative Concentration Pathway -RCPs- scenarios and four Regional Climate Models), on the SAFRAN reanalysis and on a network of meteorological stations. SAFRAN was assessed: (1) based on leave-one-out for a station located in the plain and another in the mountains; (2) by comparison to another re-analysis system named the Meteorological Distribution System for High-Resolution Terrestrial Modeling (MicroMet); (3) by comparison to in situ measurements of snowfall at one station and to the daily Snow Cover Area derived from the Moderate-Resolution Imaging Spectroradiometer (MODIS) product at the catchment scale. The evaluation of the SAFRAN reanalysis showed that an irregular grid up to 1 km resolution is better for reproducing meteorological variables than the regular version of SAFRAN at 8 km, especially in mountains. The projection of the SAFRAN forcing is conducted in three steps corresponding to the three subsections below: (1) disaggregation of the Euro-CORDEX climate scenarios using the Q–Q approach based on stations data; (2) computation of the spatialized delta-change between historical and future Euro-CORDEX runs after Q–Q correction; (3) futurization of SAFRAN using the spatialized delta change values. The mountainous area is expected to face a higher increase in air temperature than the plains, reaching +2.5 °C for RCP8.5 and +1.71 °C for RCP4.5 over 2041–2060. This warming will be accompanied by a marked decrease in precipitation (−16% for RCP8.5). These present and future spatialized data sets should be useful for impact studies, in particular those focusing on water resources.

1. Introduction

In semiarid areas, most of the available water resources for the production of hydro-electric energy, for drinking water, as well as for irrigated agriculture located downstream in the surrounding plains [1,2,3,4], comes from the mountainous regions [5]. This role of the water tower is nowadays threatened by the increase in water needs due to population growth and higher standards of living, as well as by the intensification of irrigated agriculture [6] and by climate change. The south Mediterranean region is now well known as a “hot-spot” for the latter [7,8,9] and there is reasonable evidence indicating that mountainous regions should be more impacted than their surrounding plains [10]. Within this context, the development of monitoring systems of climate variability and change in the higher elevation area of the southern Mediterranean regions are not only crucial for studying the climate variability and trends but also for proper water resource management.
The climate of the south Mediterranean mountain ranges faces a high spatiotemporal variability owing to steep precipitation and temperature gradients associated with a marked orography, to a strong seasonality of climate with most of the precipitation concentrated during the winter months [11,12] and, for the western regions, to the joint and complex influence of the synoptic flow originating from the Atlantic Ocean, from the Mediterranean sea and from the Sahara [13]. This high spatiotemporal variability, in addition to the inherent difficulty of access and the hard measuring conditions in mountainous regions, leads to strong observational issues: gauge network and radar observation are poor or nonexistent. This has led the scientific community to new developments, including new observation concepts based on remote sensing data and reanalysis systems merging atmospheric modelling with the available observations [14].
There are various data sets of precipitation estimates originating from different sources of remote sensing observation, both with and without gauge data, which have recently become available (see Sun et al. 2018 [15] and Levizzani and Cattani, 2019 [16] among others for a review). They are even sometimes preferred to the gauge network data thanks to their global coverage [17]. The methods of precipitation estimates are based on Visible-Infrared (IR) observations sensing cold cloud with a high vertical development associated with convection and/or on passive and active (radar) microwave (MW) data directly sensitive to precipitation particles [18]. The most accurate products merging IR and MW data [19] includes TRMM Multi-satellite Precipitation Analysis [17], PERSIANN [20] and CMORPH [21] among others. Despite the continuous improvement of the retrieval algorithms, several studies indicate that although these products perform reasonably well at monthly and larger time scales, they also display large uncertainties in complex terrain [22,23,24,25,26]. A few studies dedicated to the evaluation of these satellite products over the Mediterranean area draw very close conclusions [27,28,29].
Another appealing tool providing high-resolution gridded precipitation data together with other meteorological variables that cannot be observed directly using space-borne sensors is the reanalysis system merging atmospheric model prediction with available ground observations (see Table S1 for a non-exhaustive review of the different existing systems in the Supplementary Materials). Despite a continuous increase in spatial resolution, the reanalysis data sets freely available for the whole world (NCEP, [30] or ERA-5, [31]) or at the regional level like MESAN [32,33] still do not meet the resolution requirement for mapping the high spatial variability of the climate in these complex terrains. By contrast, several tools were proposed for the spatialization of climate variables based on the merging of a “background”, usually the forecast of an atmospheric model, and observations from the ground network. The MESCAN system [34] provides gridded precipitation only over the French territory. By contrast, the SAFRAN [35,36] system, a French acronym standing for “Système d’Analyse Fournissant des Renseignements Adaptés à la Nivologie”, analyses temperature, specific humidity, wind speed, precipitation and cloud cover. In addition, it was initially developed for providing gridded meteorological variables at a high-resolution of 8 km [37] for the operational forecast of avalanche risks in mountainous areas. SAFRAN was also successfully implemented and evaluated in different geographical areas characterized by a dense network of ground observations: in France [38,39,40,41], in Spain [42] and in Tunisia [43]. A first question arises about the performance of such a system when the ground network is scarce, a very likely situation for numerous catchments in the south Mediterranean region such as in Morocco and Algeria. Many watersheds in these regions are also characterized by a very steep orography while its representation in the atmospheric models is often a key issue [44]. Indeed, a large part of the discrepancies between reanalysis and observations in complex terrain can be attributed to the large differences of elevation between a grid cell and the ground station [40,45]. Within this context, which spatial resolution should be chosen to properly predict the rainfall/snowfall partition in the higher elevation areas? MicroMet is also a quasiphysical system designed to produce high-resolution atmospheric forcing up to 30 m in mountainous areas [1]. Nevertheless, by contrast with SAFRAN, it is based on extrapolations from meteorological station data only. It was also positively assessed in regions where observational data do not exist, and where precipitation quantities are generally very important: Arctic Alaska, central Norway, Svalbard, Greenland and Antarctica, Wyoming, Colorado, and Idaho [46,47,48,49,50,51,52,53].
The objective of this study is twofold: (1) to evaluate and adapt the SAFRAN analysis system to a complex catchment typical of the south Mediterranean region, including an area of water production in the mountain with a marked orography and a downstream plain—the comparison to the MicroMet data-driven approach is also carried out; (2) to disaggregate the future climate scenarios to provide spatially explicit fields of precipitation and temperature.

2. Data and Method

2.1. Study Area

The study was carried out on the Tensift watershed (in the region of Marrakech, Morocco). Due to its location and geographical characteristics as well as its semiarid to arid climate, the Tensift catchment area is considered to be representative of many basins in the Southern Mediterranean. It has been the subject of meteorological, micrometeorological and hydrological monitoring since the early 2000s within the framework of the Tensift observatory co-led by the Cadi Ayyad University of Marrakech and the CESBIO (Toulouse).
The Tensift catchment is located in central Morocco (Figure 1) and extends over 19,800 km2. The climate is governed by the complex orography, the Western flows bringing humid and cold air from the Atlantic Ocean, and is locally modulated by convective situations.
The basin can be separated into two zones with contrasted hydrological functioning:
  • The southern part includes the northern slope of the High Atlas; its highest point (Jbel Toubkal) is located at 4167 meters above sea level. Average annual precipitation varies between 600 and 700 mm/year [54,55] and snowfall is localized in the highest elevation areas above 1800m [3,56]. The melting of the snow stored in winter contributes to the shift of flows towards spring and the support of base flows during summer.
  • The second part is the Haouz plain, characterized by average annual precipitation varying between 200 and 400 mm/year, located towards the west of the reliefs. The climate of this zone is semiarid. This part supports intensive irrigated agriculture, whose main crops are olives, citrus fruits, and wheat.

2.2. Data

2.2.1. Meteorological Observations

The ground network in the Tensift catchment is sparse. Within this study, several data sets originating from different institutions have been gathered. The location of the stations is provided in Figure 1. Table 1 displays its characteristics. The stations provide either daily data including cumulative rainfall RR, minimum Tmin and maximum Tmax temperatures or 6-hourly observations of rainfall, pressure, relative humidity, wind (strength, direction), temperature and cloud cover. These data cover a hydrological period of 10 years from 1 August 2004 to 31 July 2014. The period was chosen to optimize for data availability.
The data was quality-controlled [57,58,59,60] to detect outliers. Note that most of the stations in the mountains are installed in a subcatchment of the Tensift named the Rheraya because it has been the support of several hydrological experiments since the beginning of the 2000s [12,54]. Finally, daily snowfall (mm/day)acquired at the Oukaimeden station from 1 August 2004 to 8 June 2011 are also used for the evaluation of the rainfall/snowfall partition by SAFRAN and MicroMet.

2.2.2. Climate Scenarios

In this study, Euro-CORDEX [61] climate change scenarios are used. They were designed to provide high-resolution scenarios (12 km) over a large Mediterranean window. A comprehensive evaluation of the Euro-CORDEX scenarios confirmed the ability of the Euro-CORDEX to reproduce the basic characteristics of the Mediterranean climate [61]. We selected four regional climate model (RCM) simulations from the Euro-CORDEX initiative with a 12 km horizontal resolution based on two contrasted representative concentration pathways (RCPs) (4.5 and 8.5). RCP4.5 is characterized by an atmospheric CO2 concentration that peaks in 2040 and decreases thereafter, while the CO2 concentration in the RCP8.5 scenario continues to increase throughout the 21st century. These simulations are provided by different institutes: the CNRM (ALADIN5.3 regional climate model driven by CNRM-CM5 general circulation model), KNMI (RACMO2.2 driven by EC-EARTH), IPSL (WRF3.3.1 driven by IPSL-CM5) and MPI (REMO2009 driven by MPI-ESM). Each model has two types of climate simulations: (1) historical runs (HIST) or control period available from 1960 to 2005; (2) scenario runs: forced simulations by General Circulation Models (GCMs) according to the selected emission scenario (RCP4.5, RCP8.5) available from 2006 to 2100 with RCMs. For our study, the chosen control period is 1988-2005 which will then be compared with the 2041–2060 horizon.
The variables processed in this study are maximum temperature (Tmax), minimum temperature (Tmin) and precipitation (pr). They are extracted with a daily time step at 12 km resolution for the Tensift catchment. The reanalysis of SAFRAN was also aggregated to a daily time step in line with Euro-CORDEX by a simple average or accumulation for precipitation in order to have a futuristic projection of SAFRAN forcing at the 2041–2060 horizon for the two scenarios.
For illustration purposes, the historical runs are compared to the observations from the stations of Marrakech and of Oukaimeden_CAF (see Figure S1 of the Supplementary Materials) during the historical period through average yearly cycles. The seasonal variability of temperature is well represented by all RCMs apart from some biases that can reach several degrees (see Oukaimeden during the winter month for instance). For precipitation, by contrast, stronger discrepancies are observed between the different RCM and between the RCM prediction and the observations. Some of the RCMs (CNRM) are not even able to reproduce the winter peak of precipitation. Those discrepancies have already been observed and have motivated several studies [62,63] to apply a bias correction approach.

2.2.3. Daily Snow-Covered Area MODIS

In order to evaluate the ability of MicroMet and SAFRAN to predict snowfalls, the daily snow-covered fraction (SCF) product MOD10A1 at 500 m resolution version 6 derived from the TERRA satellite data is used. The daily products provided by the National Snow and Ice Data Center (NSIDC) are extracted from August 2004 to July 2014 on the Tensift and on the Rheraya sub-basin. Version 6 of MOD10A1 does not include the snow-covered fraction anymore. In this study, the Normalized Difference Snow Index (NDSI (1); [64]) is used following (Hall et al. [65]; Baba et al. [66]) to compute SCF as follows:
S C F = 0.01 + 1.45   N D S I
In a second step, a filter that searches for clear neighbors in space and in time is applied to decrease the number of cloudy images and to minimize the problem of cloud/snow misclassification following Marchane et al. [56]. The total Snow Cover Area (SCA) at the scale of the basin is then obtained by adding up the SCF and multiplying by the area of the MOD10A1 pixel (500 × 500 m2).

2.3. Method

2.3.1. Analysis Systems

SAFRAN

SAFRAN analyses the low level of 2 m temperature, 2 m specific humidity, 10 m wind speed, precipitation, and cloud cover. The analysis between the observations and the first estimate field is carried out based on the Optimal Interpolation (OI) of a forecast and observations. The forecast was extracted from the weather forecast system used operationally at the Direction Générale de la Météorologie (DGM) named ALADIN-MOROCCO METEO model [67]. The analysis is carried out at 6-hourly time steps and then interpolated at hourly time steps according to different extrapolation methods. The precipitation is analyzed at the daily time steps and then redistributed throughout the day using the diurnal specific humidity cycle. The partition between rain and snow is carried out using the 0.5 °C isotherm. The analysis is performed on climatologically homogeneous areas, which are determined based on the elevation. SAFRAN assumes that within these climatic zones, the meteorological variables vary according to topography only. Stated differently, only one vertical profile of the meteorological variables for each climatic zone is analyzed and the variables are distributed on a regular grid of 8 km according to topography [38]. The main limitation of this zonal approach is the creation of artificial discontinuities at the borders of the zones [42]; these discontinuities are particularly strong for the precipitation variable. Incoming radiation in the visible and infrared range is predicted following the model of Ritter and Geleyn (2002) [68] because observations are often lacking for these two variables. For more details, please see Quintana-Segui et al. (2008) [39].

MicroMet

MicroMet [1] has been developed to produce high-resolution weather data of air temperature, surface pressure, relative humidity, incoming solar radiation, incoming longwave radiation, precipitation, wind speed and direction based on ground observations. It is part of the distributed snow model package developed by Liston et al. (2018) [69]. Unlike SAFRAN, MicroMet is “data-driven”: it relies on the spatial interpolation of observations using the Barnes objective analysis scheme [1,70,71,72] and the spatial distribution of variables is then corrected using values of temperature–elevation, wind–topography, humidity–cloudiness, and radiation–cloud–topography relationships. The system assumes that there is at least one observation for each of the meteorological variables (air temperature, relative humidity, precipitation, wind direction and strength) somewhere in the study area, for each time step, except for the incoming short-wave and long-wave radiation and for pressure. For these latter variables, MICROMET uses simple models described in Liston et al. (2006) [1] for the spatialization.

2.3.2. Implementation and Assessment

SAFRAN and MicroMet Implementation

SAFRAN’s 23 climatologically homogeneous zones, ranging from 306 km2 to 1457 km2, were identified based on elevation using the Digital Elevation Model (DEM) 30m (Figure 1). Figure 1 clearly illustrates the scarcity of the network with only 20 stations, mostly located in the southwest of the area: 17 zones among 23 have no observation available, though a minimum of 2 stations per zone is recommended for the implementation of SAFRAN [39]. Two implementations of SAFRAN are performed: one based on the projection on a regular grid of 8 km and another one with a variable grid to better represent the orography and assess the impact on the rain/snow partition and the temperature fields. Indeed, with a regular grid of 8 km, the elevation range within one grid cell can reach up to 3726 m. The variable grid is built up as follows: the grid size is divided by two as long as the elevation range is higher than 300 m down to a 1 km grid size.
MicroMet is implemented for the purpose of evaluating SAFRAN on the Rheraya mountainous subcatchment only with a 1 km resolution. Regarding the dense network on the catchment, including measurements of shortwave and longwave incoming radiation, it can be considered as a reference field for SAFRAN. The default value of the lapse rate and the precipitation gradient were replaced by those computed from the observation network.

SAFRAN Assessment

The SAFRAN assessment is carried out in three ways: (1) by a station-level validation based on the leave-one-out (LOO) approach [73] from August 2004 to July 2014. It consists of removing a station from the database, running SAFRAN without this station and evaluating the SAFRAN reanalysis at it. This validation method is used for a mountain station (Aremd) and the plain station (Chichaoua). Both stations were chosen due to data availability; (2) via a comparison with MicroMet monthly averages over the Rheraya catchment; (3) by comparing the rain/snow partition to the snow surface area derived from the daily MODIS product and to the in situ snow depth measurements.

2.3.3. Scenario Downscaling

The main spatiotemporal patterns of precipitation and temperature of the Mediterranean region are reasonably well reproduced by the Euro-CORDEX runs as shown by [74,75]. Nevertheless, some systematic discrepancies between RCM runs and local observations are also highlighted because of the inherent error in the model parameterization or in the representation of orography. The reduction of biases through the implementation of downscaling methods is thus a prerequisite for impact studies. Our objective is to provide high-resolution future climate scenarios spatially explicit for the 2041–2060 period. Only precipitation and temperature are considered for downscaling in this study. The quantile–quantile (Q–Q) approach was chosen [76]. The Q–Q is a nonlinear bias correction method aiming to correct the biases between the quantiles of the distribution of the RCM outputs and the observations. Note that this method has been applied with success, including for our study region [62,77,78].
As the period of availability of SAFRAN is too short (10 years [79]), the Q–Q approach was first applied to the Marrakech (elevation: 464 m) and the Oukaimeden_CAF (elevation: 2687 m) stations that provide daily data from 1988 to 2005 (control period of Euro-CORDEX). The correction was applied to each season (3 month periods) separately and each model was corrected independently, in order to evaluate the scattering between the different RCMs. Based on an elevation threshold equal to 1000 m, the grid points of Euro-CORDEX scenarios are separated into plains and mountains. The correction function obtained at the Marrakech station was then applied to the plain grid points while the one obtained at the Oukaimeden_CAF was used to correct the mountain grid points. Finally, the “Delta change” approach [80,81,82] is used to project the SAFRAN forcing at the 2041–2060 horizon for the two scenarios. The delta change simply consists in computing the monthly differences between the disaggregated Euro-CORDEX scenarios using the Q–Q approach and the history runs of Euro-CORDEX and applying these changes (delta) to SAFRAN considering the nearest Euro-CORDEX grid point.

3. Results and Discussion

3.1. Assessment of SAFRAN Analysis

3.1.1. At the Station Level

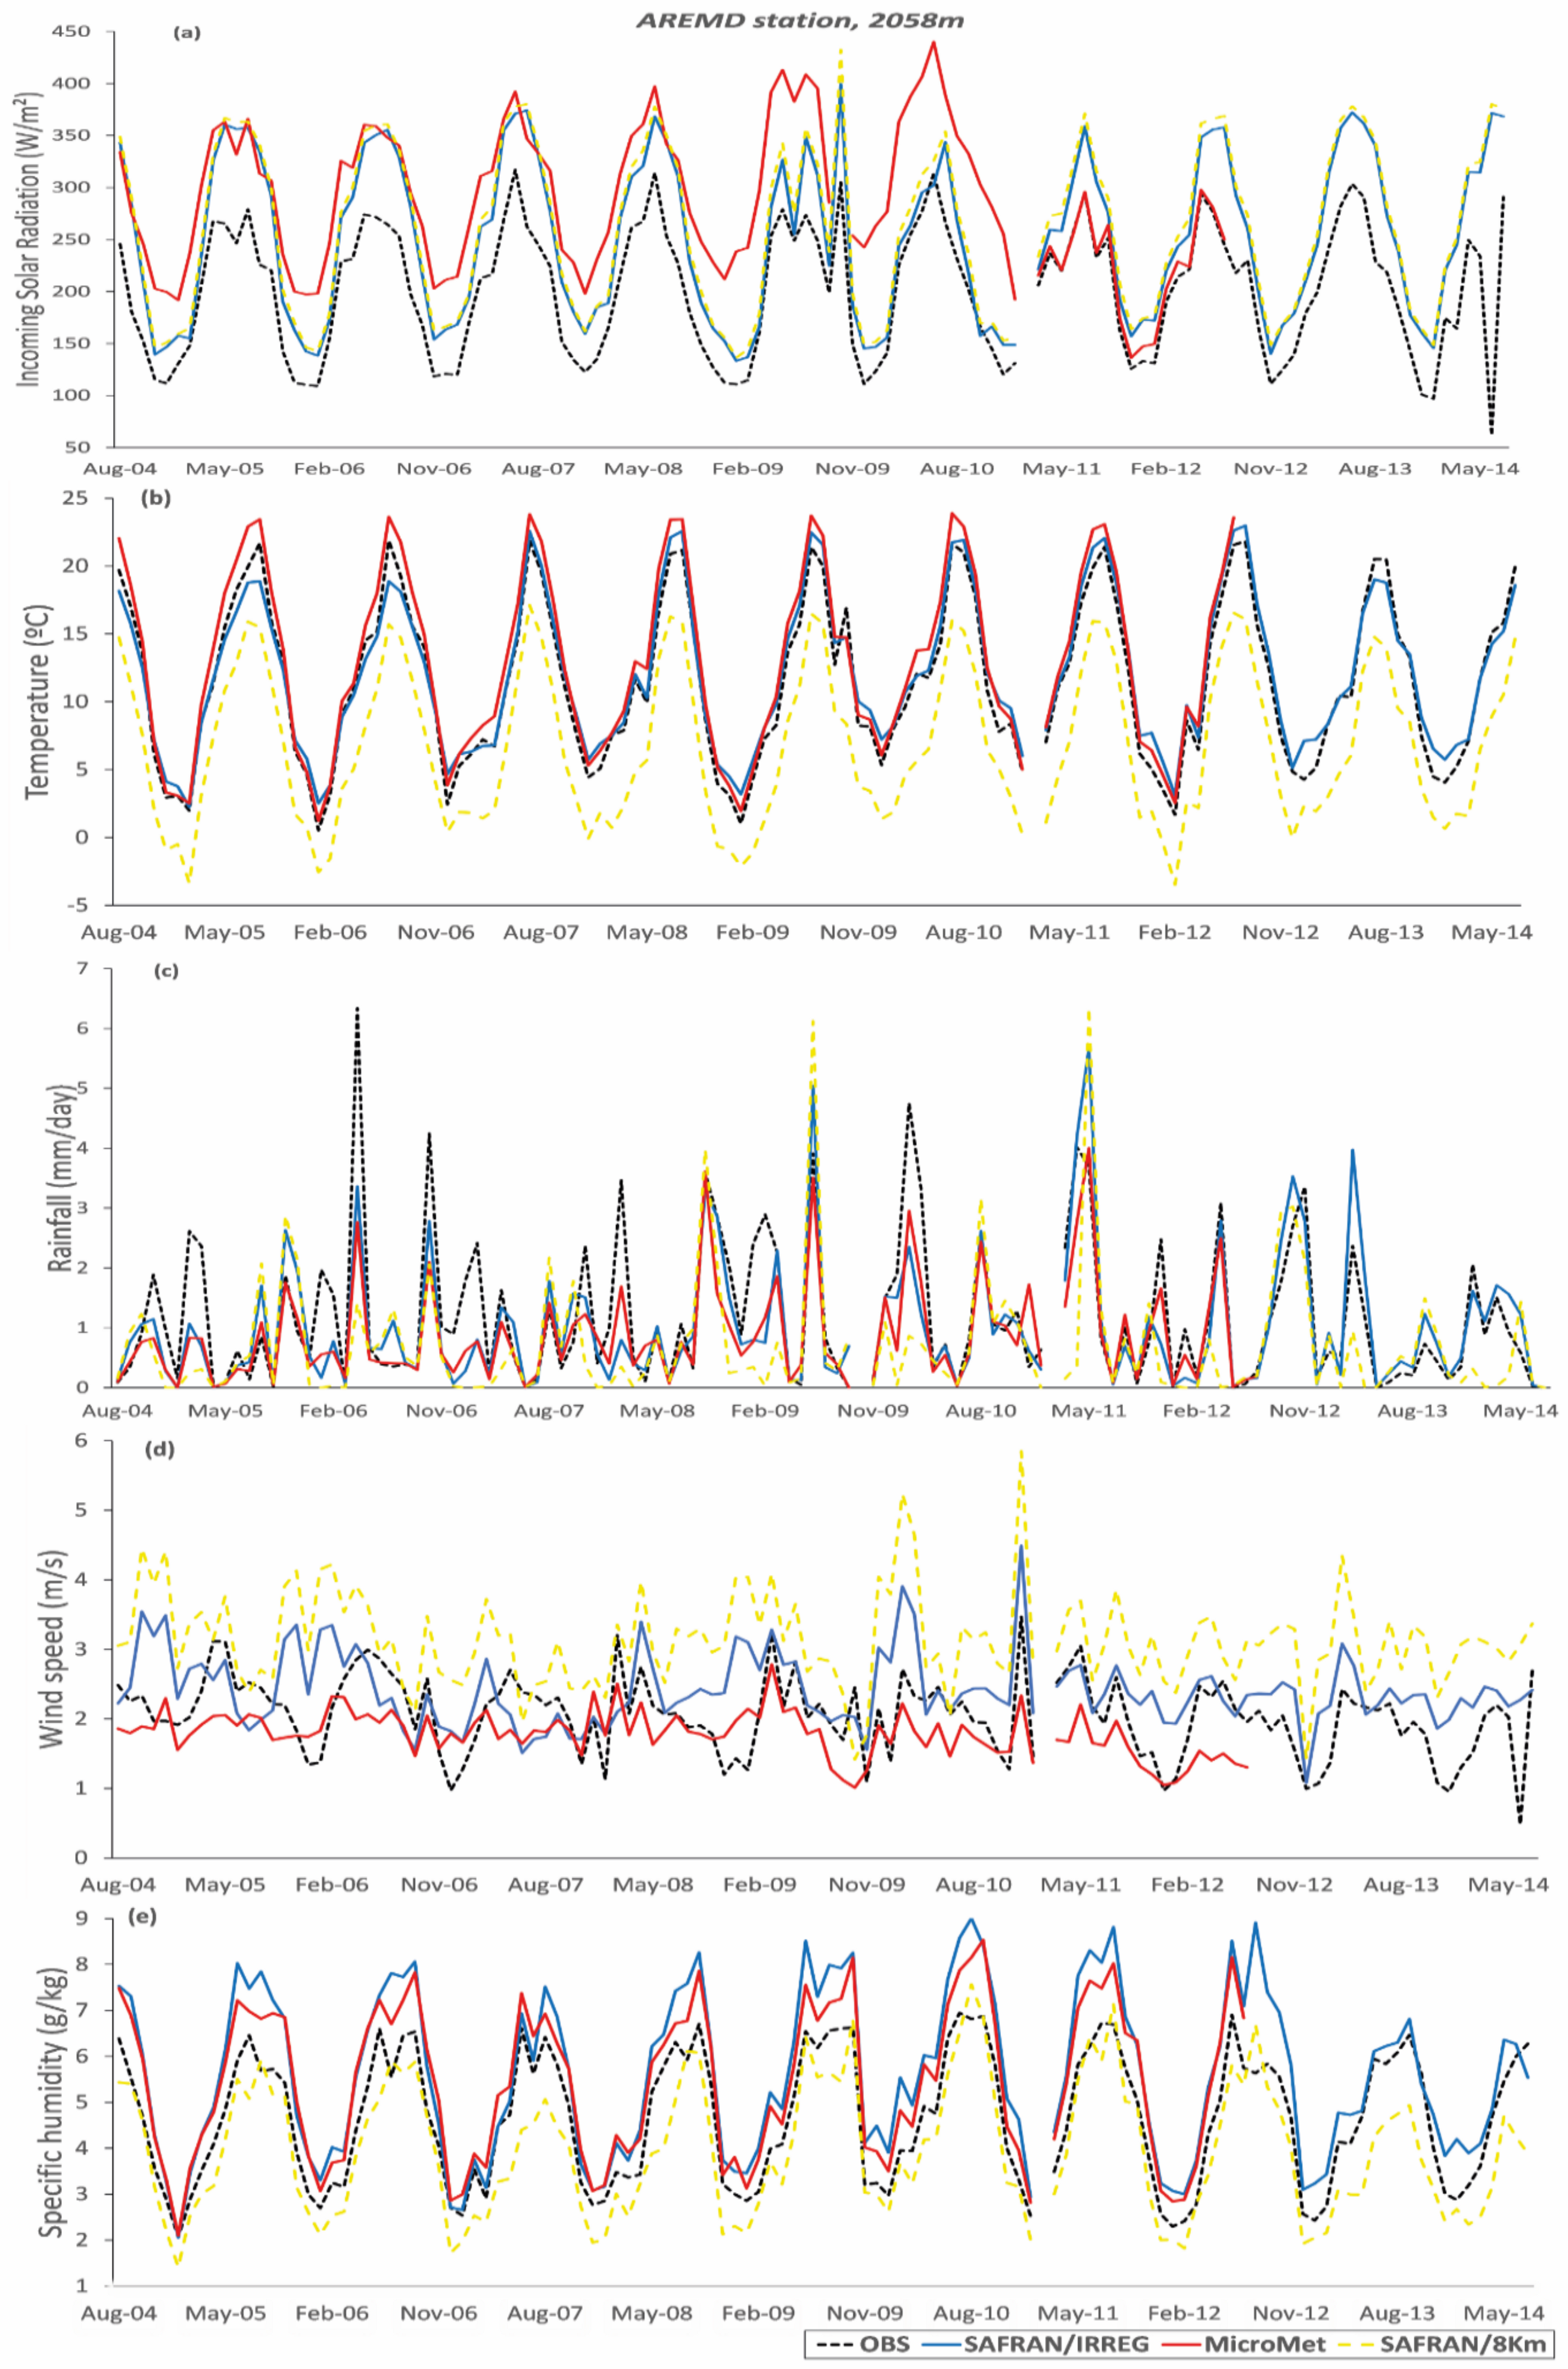
The results of the LOO approach are shown for the 8 km regular grid and for the new irregular grid. Figure 2 and Figure S2 (in the Supplementary Materials) display the monthly time series of incoming shortwave radiation, 2 m air temperature and precipitation for the Aremd and the Chichaoua stations, respectively. Table 2 and Table S2 (Supplementary Materials) report the statistical metrics for both stations.

Chichaoua Station (503 m)

At the plain level, the variable grid mesh based on orography has almost no impact on the SAFRAN reanalysis. Indeed, the results of the 8 km grid and of the irregular grid superimposed almost perfectly for the three variables (Figure S2). Both are also in very good agreement with the observations of the station, even considering rainfall. This probably means that the ALADIN forecast used as a first guess is good, at least with regards to monthly cumulative rainfall, as there is no station in the surrounding area that could have been used by the SAFRAN system to supplement the removed station of Chichaoua. Some rainfalls predicted by SAFRAN during summer in 2009, 2010 and 2013 are not observed by the Chichaoua station. They probably originates from localized convection events that were well caught by the ALADIN model. The incoming solar radiation (ISR) is also perfectly reproduced with a correlation coefficient of R = 0.96 for both implementations of SAFRAN apart from a small bias in summer. This is remarkable as it is not analyzed in SAFRAN but calculated by a radiation scheme. In line with the results obtained by [42] over Spain, close conclusions can be drawn here for the air temperature with a bias lower than 0.5 °C and a reasonable RMSE of 2.8 °C on average over the 2004/2014 period over this station surrounded by a flat terrain, although a significant positive bias can be observed during winter 2010–2011 and 2011–2012. By contrast, the statistical metrics for wind speed are significantly worse, with a strong negative bias above 2 m/s and RMSE reaching 3.5 m/s. The wind is known to be highly variable in space and the metrics are close to Quintana-Seguí et al. (2008) [39] who also found an overall trend to under-estimation attributed to the linear interpolation at the hourly time scale that could mask some important atmospheric phenomenon such as breeze effects.

Aremd Station (2058 m)

A different behavior can be observed at the Aremd station. Although SAFRAN for both implementations reproduced the seasonal cycle of ISR, air temperature and rainfall rather well, the amplification of the error on this mountainous station with regards to Chichaoua appeared clearly for all variables (see Figure 2 and Table 2). First, a strong positive bias reaching almost 60 W/m2 is observed for ISR with higher biases in summer. This stands for both implementations of SAFRAN with no clear added-value of the irregular grid on this variable. MicroMet overestimation of ISR is even higher than SAFRAN, with a bias and an RMSE of 86.2 W/m2 and 351.7 W/m2, respectively. Interestingly enough, a positive bias was also highlighted on SAFRAN reanalysis for a mountainous station located in the French Alps by Quintana-Seguí et al. (2008) [39] while plain stations were characterized by slight negative biases. It is well known that shortwave radiation is strongly influenced by topography including slope [83] and this effect is not taken into account in SAFRAN. The large bias of ISR could also suffer from poor prediction of cloudiness by SAFRAN, as highlighted by several authors [39,40,42,84]. By contrast, the irregular grid outperformed the 8 km grid for air temperature, precipitation, wind speed and, to a lesser extent, specific humidity (Table 2). The lower bias and RMSE for precipitation and temperature when using the irregular grid was expected as the grid cell elevation is closer to the station elevation. MicroMet provided slightly better statistical metrics in terms of the RMSE and the correlation coefficient, but the results are close to the SAFRAN irregular grid results.

3.1.2. Catchment Scale (Rheraya)

As the irregular grid outperformed the regular grid, only the results obtained with the variable mesh grid will be compared to MicroMet. The comparison over the Rheraya catchment is shown in Figure 3 (cumulative values for precipitation and the annual average for the other variables) for the period 2004–2012. Table 3 displays the annual average of the meteorological variables for SAFRAN and MicroMet.
The most striking feature is that SAFRAN provided significantly smoother fields than MicroMet. This has been already observed and attributed by several authors to the use of zones that are assumed to be climatologically homogeneous [39,42,84]. For temperature, the spatial patterns of SAFRAN and MicroMet differed slightly, with a stronger altitudinal gradient for MicroMet, while the average air temperatures are close at the scale of the Rheraya (11.3 °C versus 11.7 °C for SAFRAN and MicroMet, respectively). The larger discrepancies are observed for the ISR with significantly higher values of about 30 W/m2 on average over the catchment (Table 3) predicted by MicroMet and very variable spatial patterns. This is probably due to the representation of the slope and aspect effects in MicroMet, while these effects are not considered by SAFRAN. This difference could have significant impacts for snow prediction studies including the partition between snowmelt and sublimation [2,84].
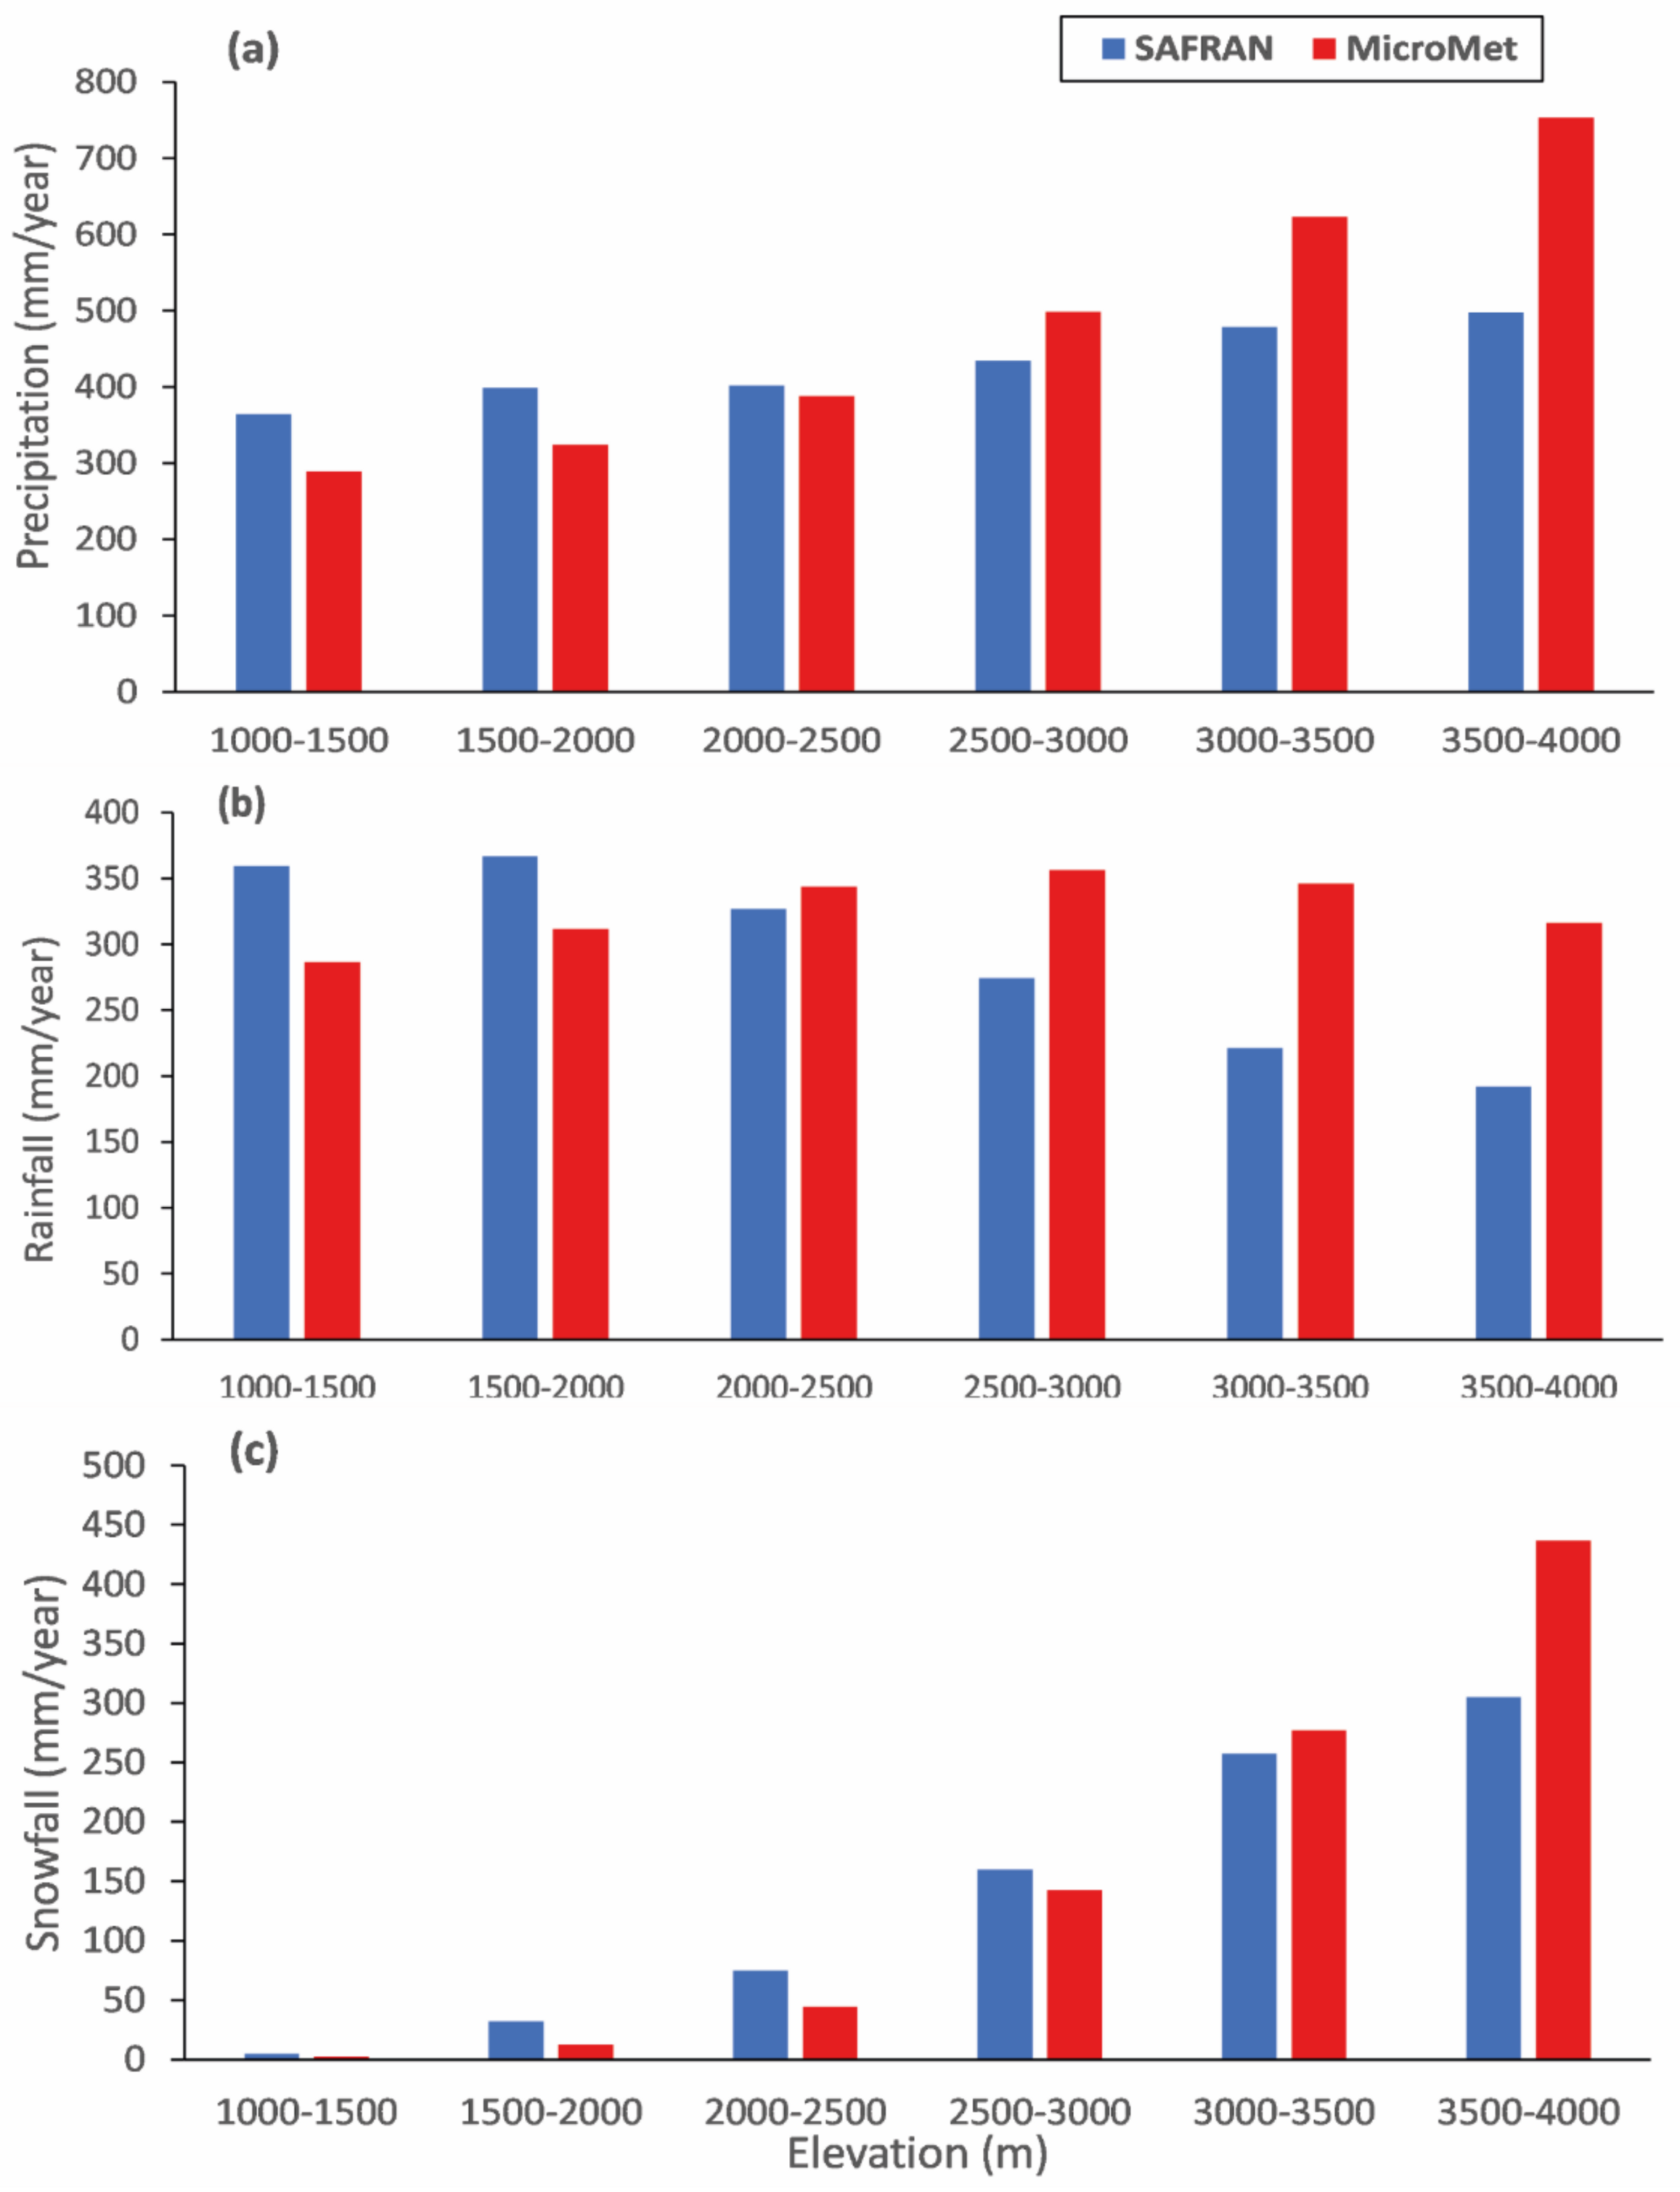
The average yearly amounts of rainfall and snowfall by elevation range are displayed in Figure 4. On average over the catchment, the differences in the precipitation amounts are highly variable between the two models; MicroMet systematically predicts higher precipitation than SAFRAN, except for in the lowest elevation ranges. There is also a significant difference in the partition between solid and liquid precipitation between the two models. MicroMet predicted significantly more rainfall than SAFRAN on the highest part of the catchment, while the opposite is true for the lowest elevation area to the north. By contrast, SAFRAN recorded a significant amount of snow spread over the southern half of the basin, while the snow prediction of MicroMet followed a very steep elevation gradient: a very high yearly snowfall of around 450 mm/year is observed for the extreme highest part above 3500 m, but the average amount decreased significantly when going northwards towards lower elevations.

3.1.3. Snow Assessment

In this section, we will focus on assessing the snowfall/rainfall partition prediction by comparing the predicted snowfall to the snow covered area derived from MODIS and to the in situ snow depth. Note that this is a very indirect validation, as the snow covered area (SCA) and snow depth result from complex processes of accumulation, melt and possibly sublimation in this semiarid area. The Snow Covered Area derived from SAFRAN and MicroMet obtained by summing up the area of all the pixels where snowfall occur is compared to the daily MODIS products on the Rheraya sub-basin (Figure 5a). Figure 5b is the same but over the Tensift catchment and considering SAFRAN only. The snowfall amount from SAFRAN and MicroMet is then compared with in situ data recorded at the Oukaimeden_CAF station from 2004 to 2011 (Figure 5c). The way SCA is computed (i.e., with no representation of the accumulation and melting processes) probably explains why both systems failed on average to properly reproduce the observed snow cover fraction during the core of winter. For instance, the high observed SCA in 2006–2007 or 2007–2008 probably originated from continuous accumulation of snow thanks to regular events and low melt since the beginning of the snow season. By contrast, the SCA peak predicted by both systems in 2004–2005, 2008–2009 and, to a lesser extent, in 2013–2014 (SAFRAN only), may result from several abundant snowfalls during the month, while the mild temperature may have favored melting, explaining the low observed monthly SCA. Nevertheless, for the remaining years, the results remain very good, with low discrepancies between the models (SAFRAN-irregular and MicroMet) and the observations. In particular, the beginning and the end of the snowy season are properly reproduced by both systems. The biases are around +0.3% for SAFRAN and −0.2% for MicroMet, while the correlation coefficient is equal to R = 0.74 for SAFRAN compared to R = 0.72 for MicroMet (both are significant at the 99% level). At the scale of Tensift (Figure 5b), similar conclusions can be drawn, with a slight overestimate in some hydrological years (2004–2005, 2005–2006 and 2008–2009) as already discussed. The snow fraction estimated by SAFRAN is still highly correlated with MODIS observations (R = 0.73) at this scale with a very low bias (+0.4% over the entire study period).
Finally, snowfall in mm/day from MicroMet and SAFRAN is compared to daily observations gathered at the Oukaimeden station in Figure 5c. The overall monthly dynamic is reasonably reproduced by both systems (R = 0.54 and 0.75 for SAFRAN and MicroMet, respectively) considering the difference of scale [56] between the 1 km grid point of SAFRAN and MicroMet and the point scale observations. In particular, the start and the end of the snowy season predicted by both systems are in line with the observations. Nevertheless, large negative biases are observed during the winter months, particularly in 2005–2006 and 2008–2009. This is attributed to the location of the grid points of both systems exhibiting an average elevation of 2676 m and 2373 m for SAFRAN and MicroMet, respectively, while the elevation of the station is of 2687 m. This is in agreement with the results obtained at the scale of the Rheraya catchment showing that MicroMet predicted a significantly higher amount of snowfall than SAFRAN. Indeed, by considering a grid point with an elevation closer to the station, it is likely that the strong bias observed for MicroMet would be significantly reduced.
In conclusion, despite the identified limitations mainly attributed to the complex orography, SAFRAN and MicroMet predict the snowfall reasonably well.

3.2. Downscaling of Climate Change Scenarios

The projection of SAFRAN forcing is conducted in three steps corresponding to the three subsections below: (1) disaggregation of the climate scenarios using the Q–Q approach based on stations data; (2) computation of the spatialized delta-change between historical and future Euro-CORDEX runs after Q–Q correction; (3) futurization of SAFRAN using the spatialized delta change values.

3.2.1. Projection of Euro-CORDEX Based on the Q–Q Approach

As a first step, the Q–Q debiasing functions are determined on the historical period for the two stations of Marrakech in the plains and Oukaimeden_CAF in the mountains. Future projections are then derived for the two stations using the Q–Q functions and the nearest grid point of Euro-CORDEX for RCP4.5 and RCP8.5 at the horizon 2041–2060. The Q–Q functions are applied to the Euro-CORDEX predictions by separating plains and mountainous grid points.
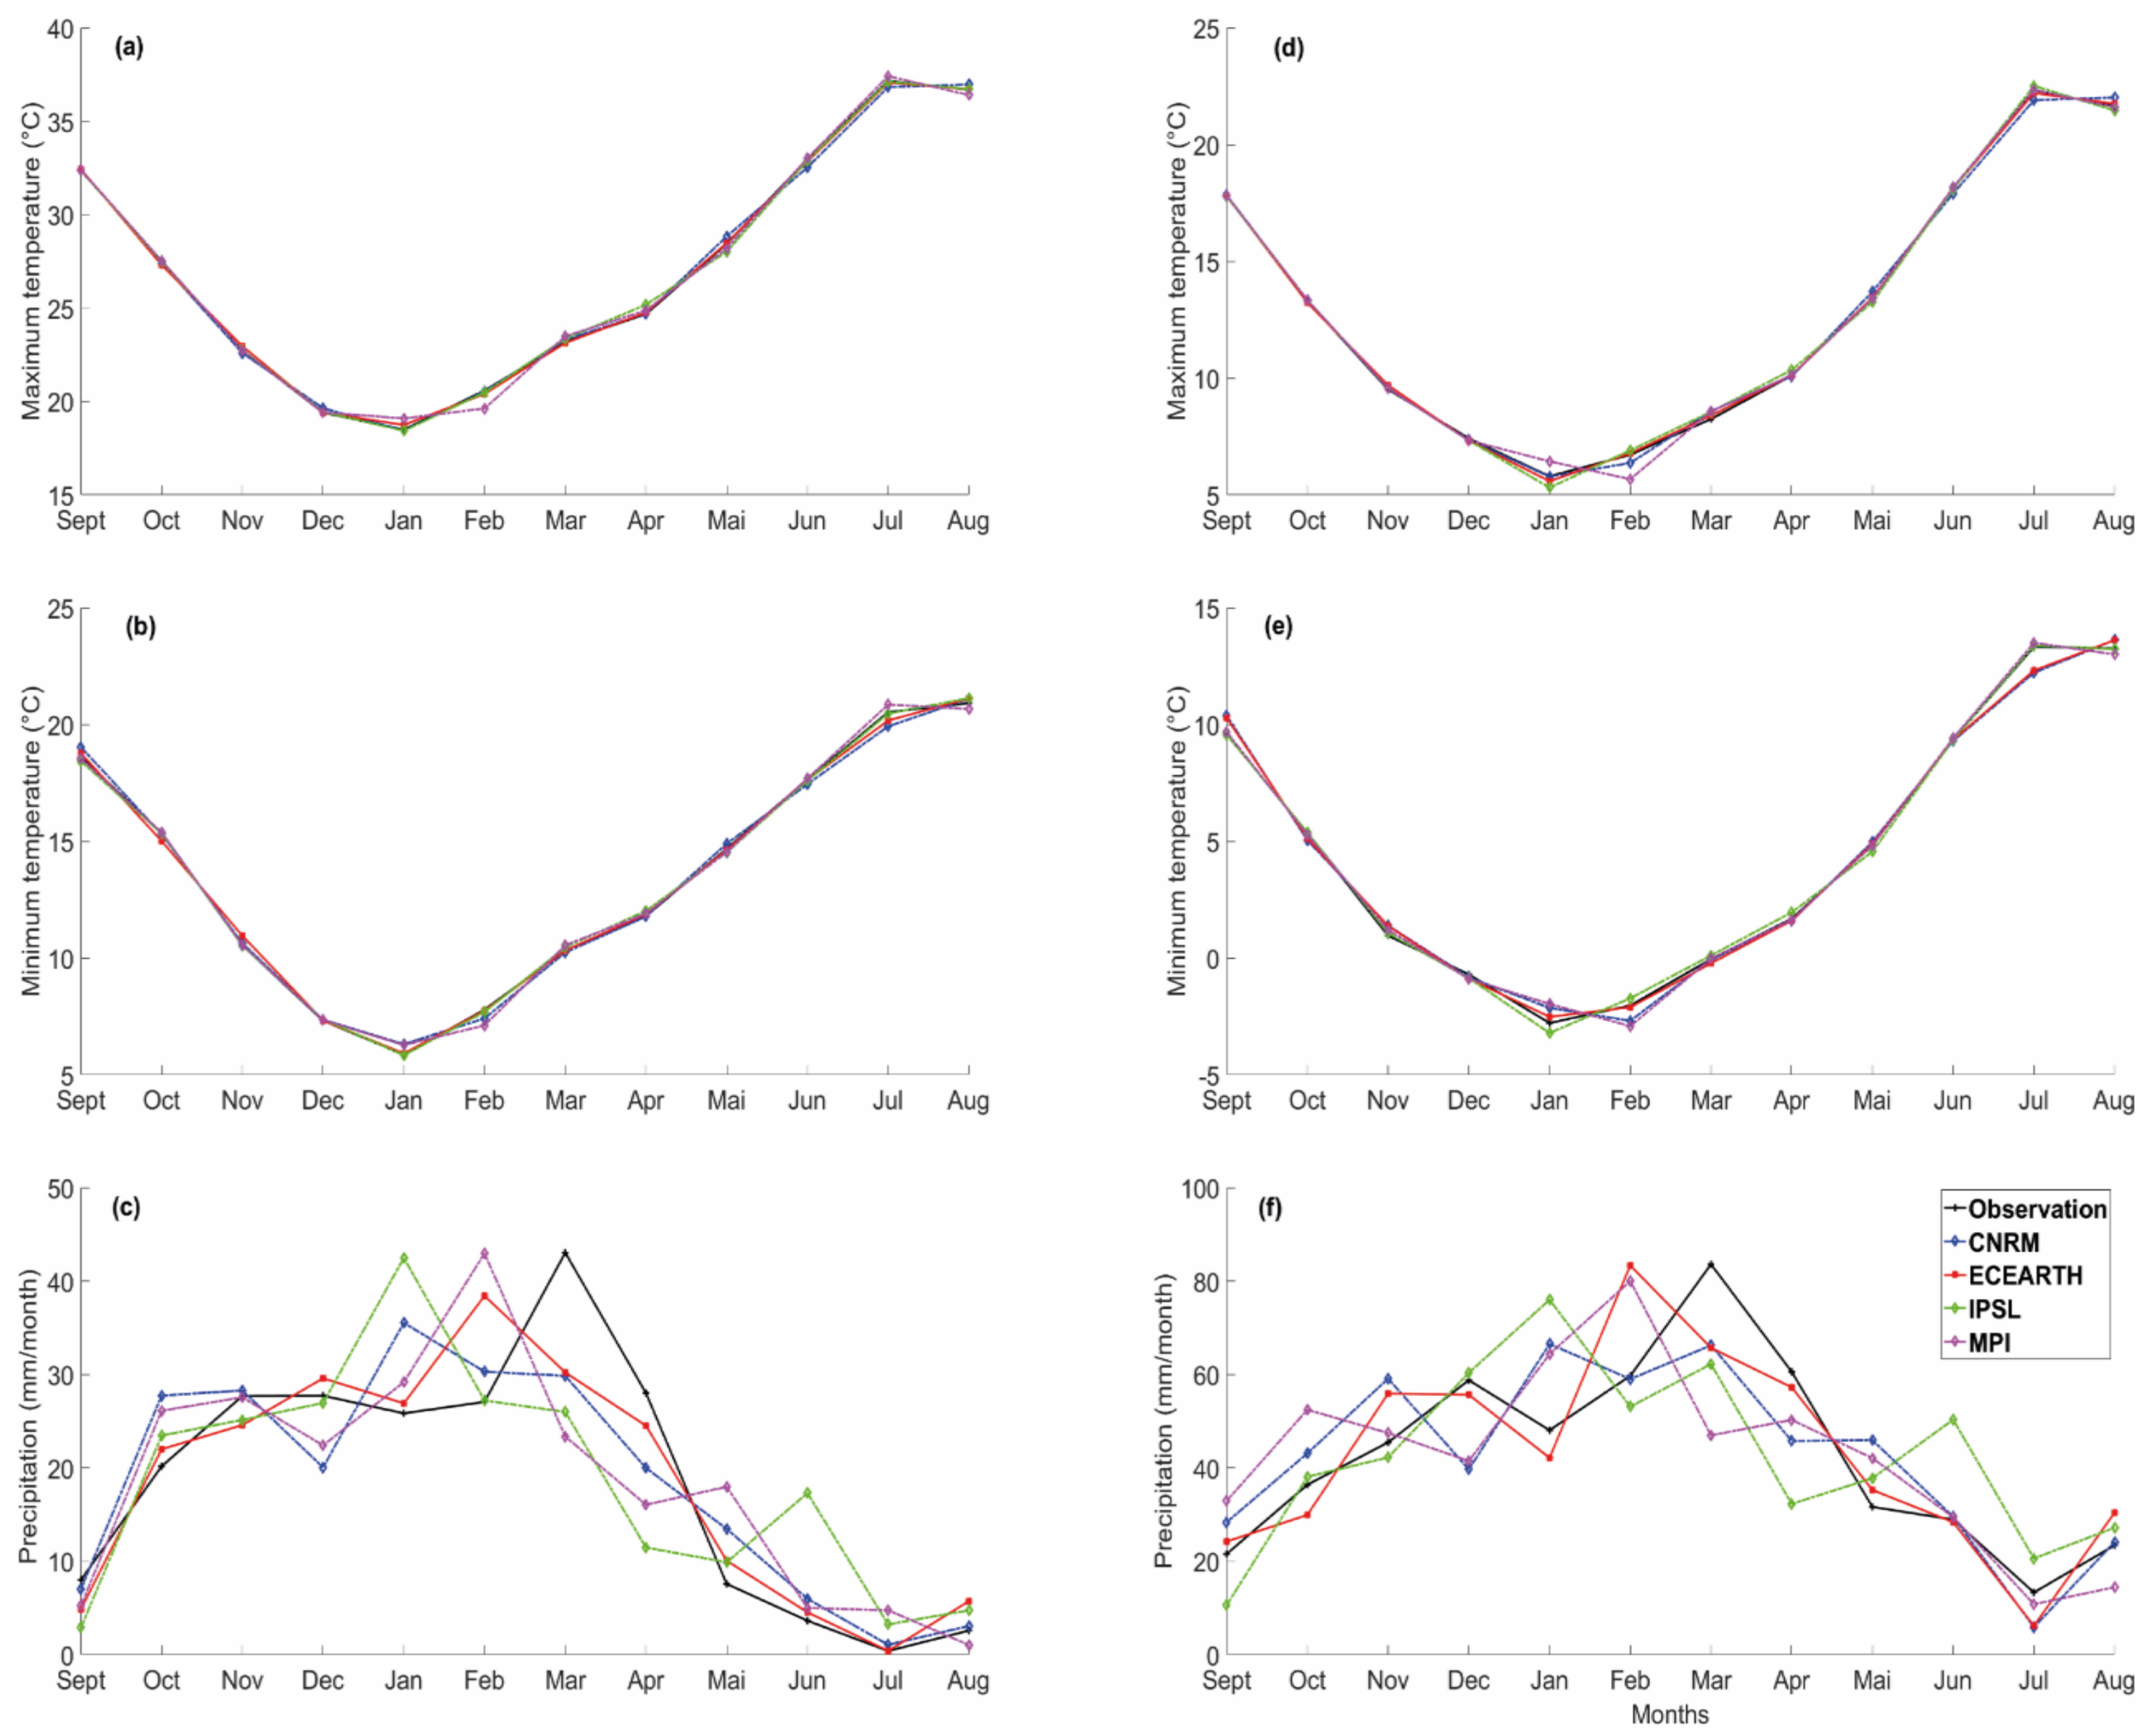
Figure 6 displays the Euro-CORDEX run during the historical period after debiasing using the Q–Q approach superimposed with the in situ observations gathered at the plain station of Marrakech and at the mountain station of Oukaimeden_CAF. The nearest grid point of the two stations is used for Euro-CORDEX. The discrepancies between Euro-CORDEX temperatures (Figure S1) are almost perfectly corrected by the Q–Q approach even if some limited biases lower than 1 °C remain for some winter months (January and February), in particular for the mountainous station (Figure 6d,e). Interestingly enough, scattering disappears between the different RCMs. These results are in line with other studies that also highlighted the good performance of the Q–Q approach for the temperature variable [62,77,78].
By contrast, for precipitation, there is still a significant scattering between the different RCM after Q–Q debiasing and between the RCM and the observations (Figure 6c,f). For instance, monthly amounts ranged between 26 mm/month and 43 mm/month for January at the Marrakech station while observations are slightly lower with 25 mm/month recorded on average during the period from 1988–2005. Likewise, the precipitation peak was observed in March while the RCM runs after the Q–Q correction exhibit peaks occurring earlier in the season, either in February (ECEARTH, MPI) or in January (CNRM, IPSL). Nevertheless, the Q–Q approach is efficient in providing RCM runs with monthly precipitation amounts reasonably close to the observations compared to the raw predictions (see, for instance, IPSL in Figure S1). Likewise, the seasonal dynamic is in much better agreement with the observations (see, for instance, CNRM before debiasing in Figure S1).
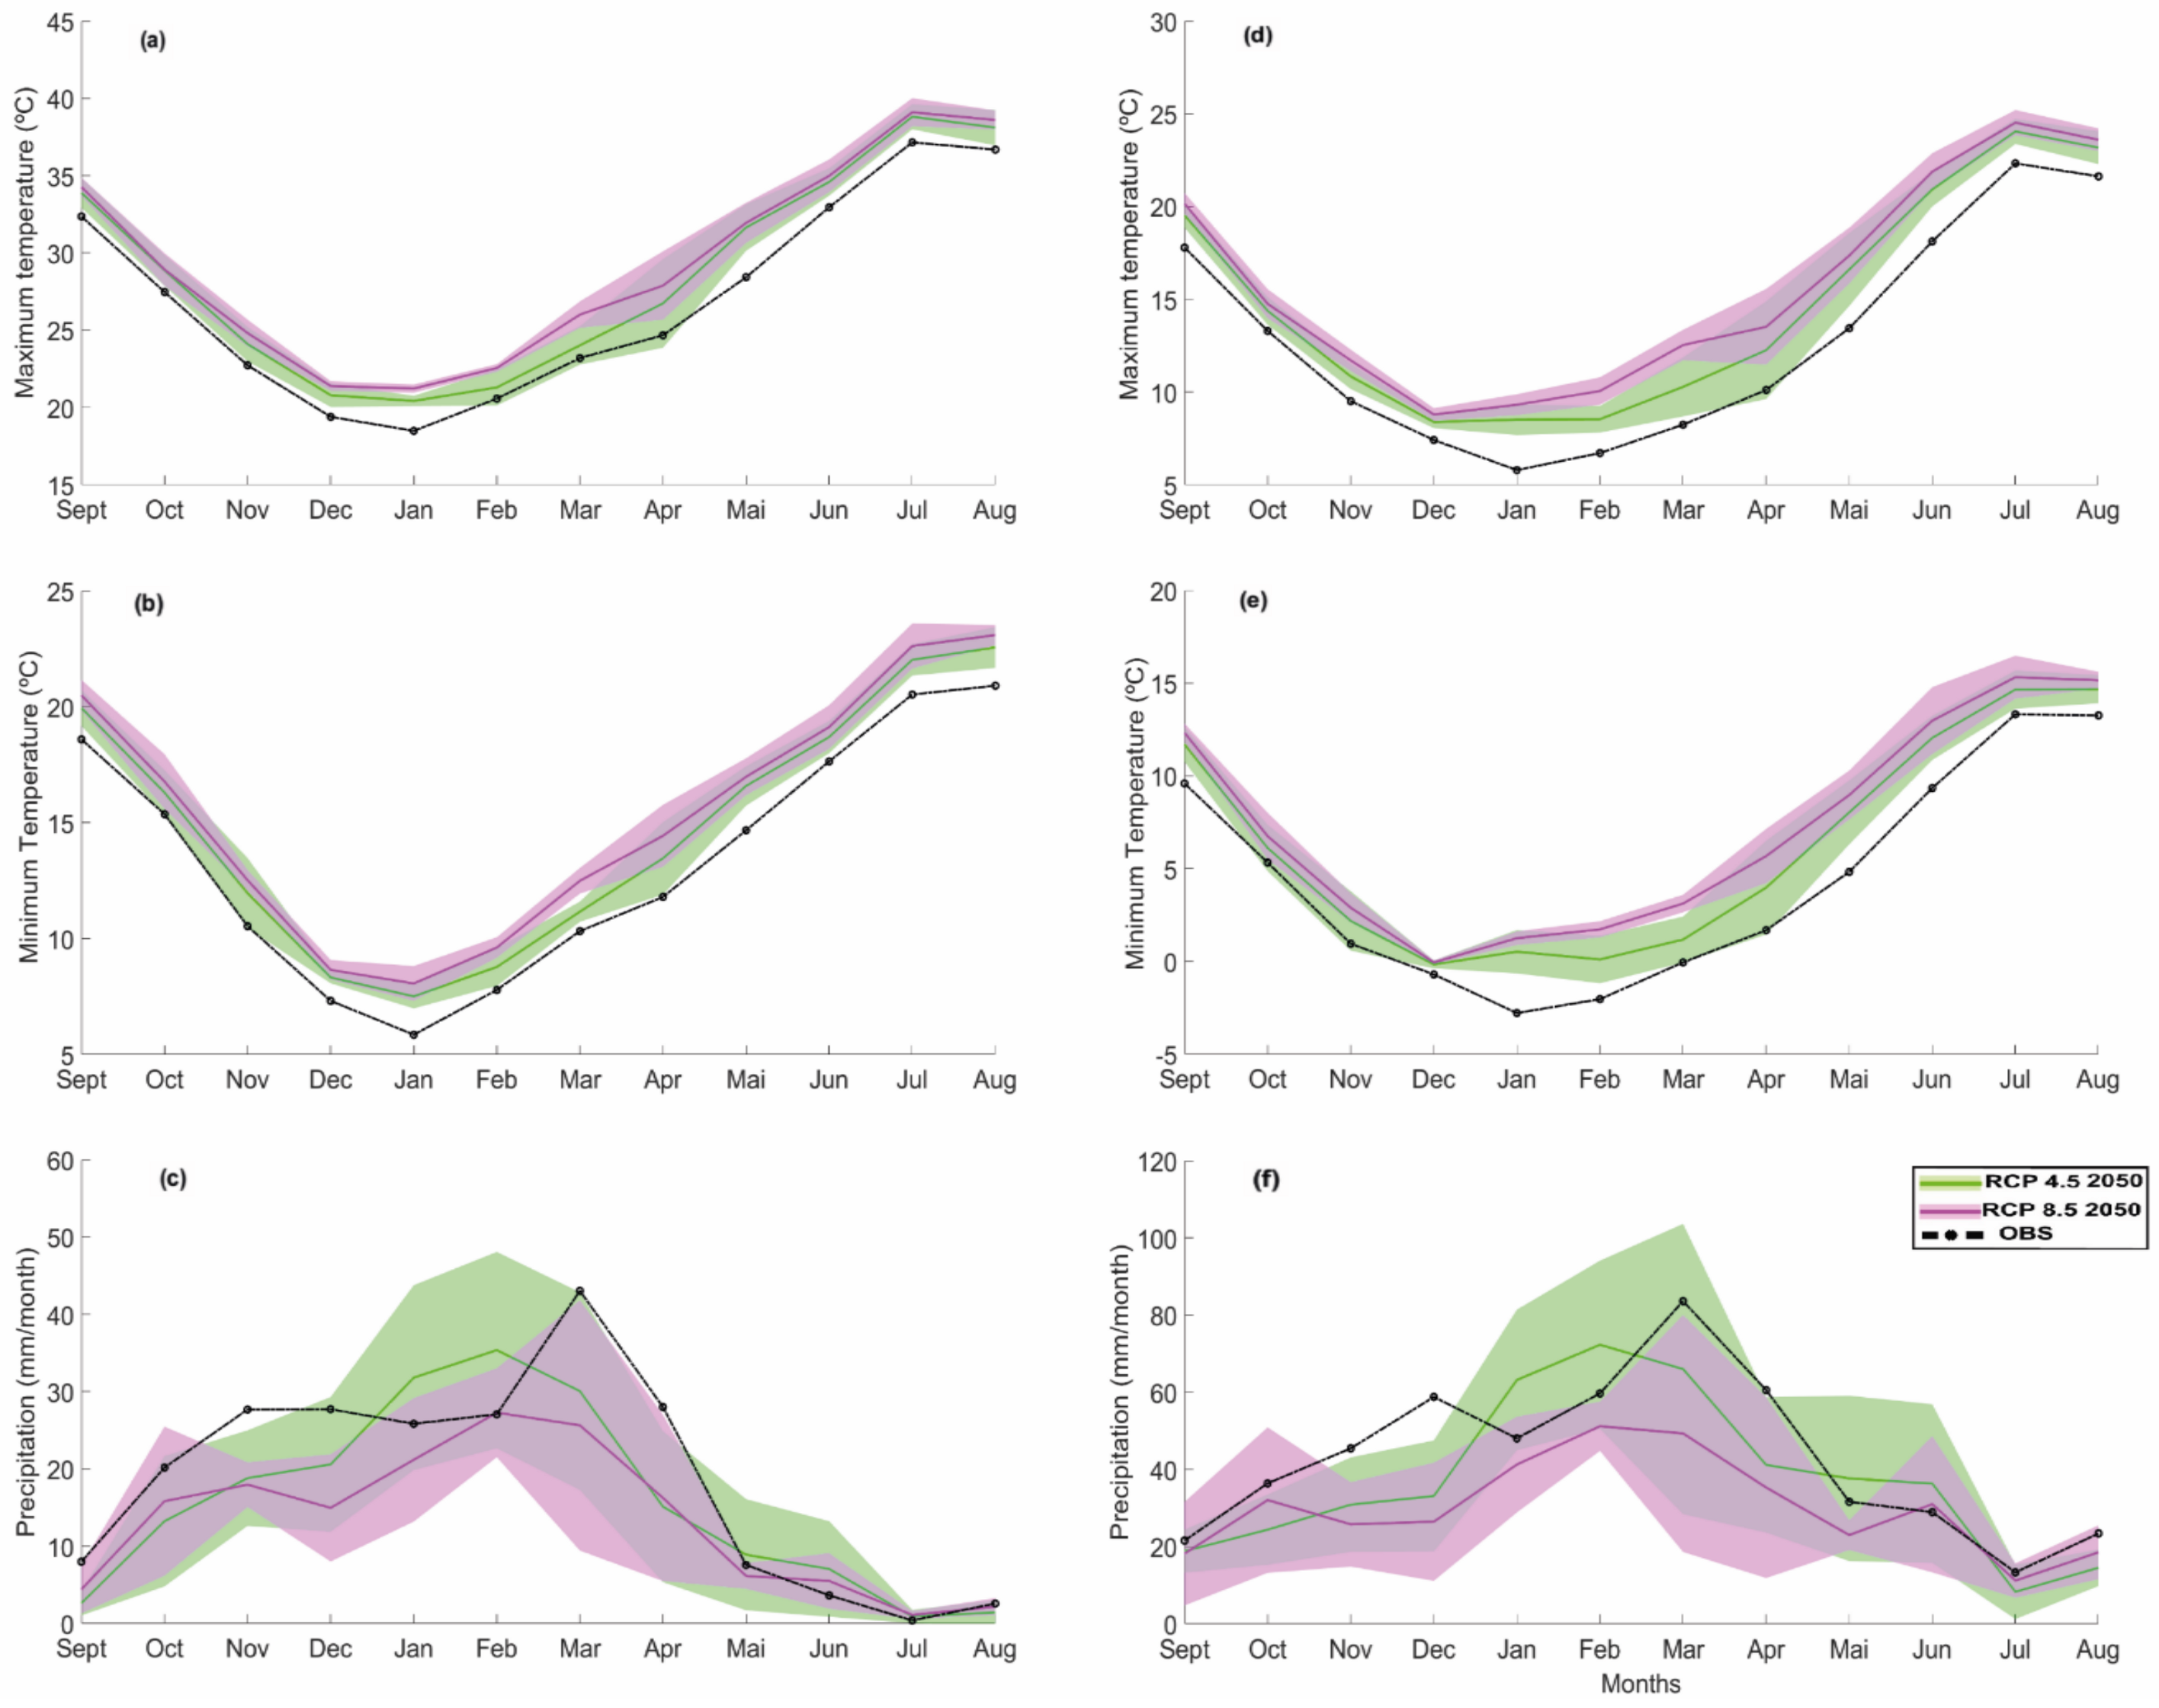
Figure 7 displays the projections for the two scenarios RCP4.5 and RCP8.5 for 2041–2060 (hereafter year “2050”). The annual changes considering the median of the model ensembles are displayed in Table 4. A high degree of warming is observed for both stations, as evidenced by the negligible scattering of the four RCMs, and also because the observations are outside of the hatched section showing the standard deviation of the RCMs. This was already observed by several authors in the South Mediterranean area [62,77].
Interestingly enough, stronger warming may be expected during the winter and spring months than for the rest of the year. This is even more prominent for the mountainous station, which could face warming of up to 4.3 °C and 3.2 °C in March for RCP8.5 and May for RCP4.5 scenarios, respectively. As for precipitation, even if a drought is predicted, in particular for the more pessimistic scenario, it is much more uncertain, as the observations fall within the hatched section for most of the year—apart from November for the Marrakech station and the months of November and December for the Oukaimeden station. An increase in precipitation reaching +8.3 mm/month at the Marrakech station and +15.1 mm/month at the Oukaimeden station can even be observed in January and February. The start (November–December) and the end of the rainy season (March–April) could face the most severe drying. The spring decrease could reach −30% (−13.0 mm/month) and −40% (−17.4 mm/month) for RCP4.5 and RCP8.5, respectively, at the Marrakech station and even −41% (−34.2 mm/month) at the mountainous station in March (for RCP8.5). In line with the latter, a downward trend in the number of snowy days at the end of the season has already been observed in the region by Marchane et al., (2017) [77] from 2000 to 2015.
The Q–Q functions are then applied to the Euro-CORDEX historical runs by separating plain grid points (below 1000 m) from the mountainous grid points (above 1000 m). The (strong) assumption underlying this approach is that while not being able to reproduce the seasonal dynamic and the yearly average of the three considered variables as already observed (Figure S1), the RCMs can predict the main pattern of the spatial variability. As orography plays a significant role in the dynamic predicted by the RCMs together with the large synoptic flows originating from the Atlantic, it may be a reasonable assumption. As it is an intermediate step before the projection of the SAFRAN reanalysis, the figures showing the projected maps of minimum and maximum temperature and precipitation (yearly average on the 2041–2060 horizon) and the deviation from the historical runs are displayed as Supplementary Materials (Figures S3 and S4, respectively). The main conclusion drawn from these two figures can be summarized as follows: (1) the whole catchment will face a temperature rise affecting both the minimum and maximum temperatures, reaching +3.5 °C in the mountainous region of the highest elevation for RCP4.5, and +4.5 °C for RCP8.5 in the same areas; (2) precipitation is also expected to decline throughout the basin. This decrease is more pronounced on the reliefs than on the plains (Table 5). This drop will reach −69.33 mm/year (−31%) on the plain against −80.3 mm/year (−32%) in the Atlas mountains for RCP8.5.

3.2.2. Projection of SAFRAN Reanalysis

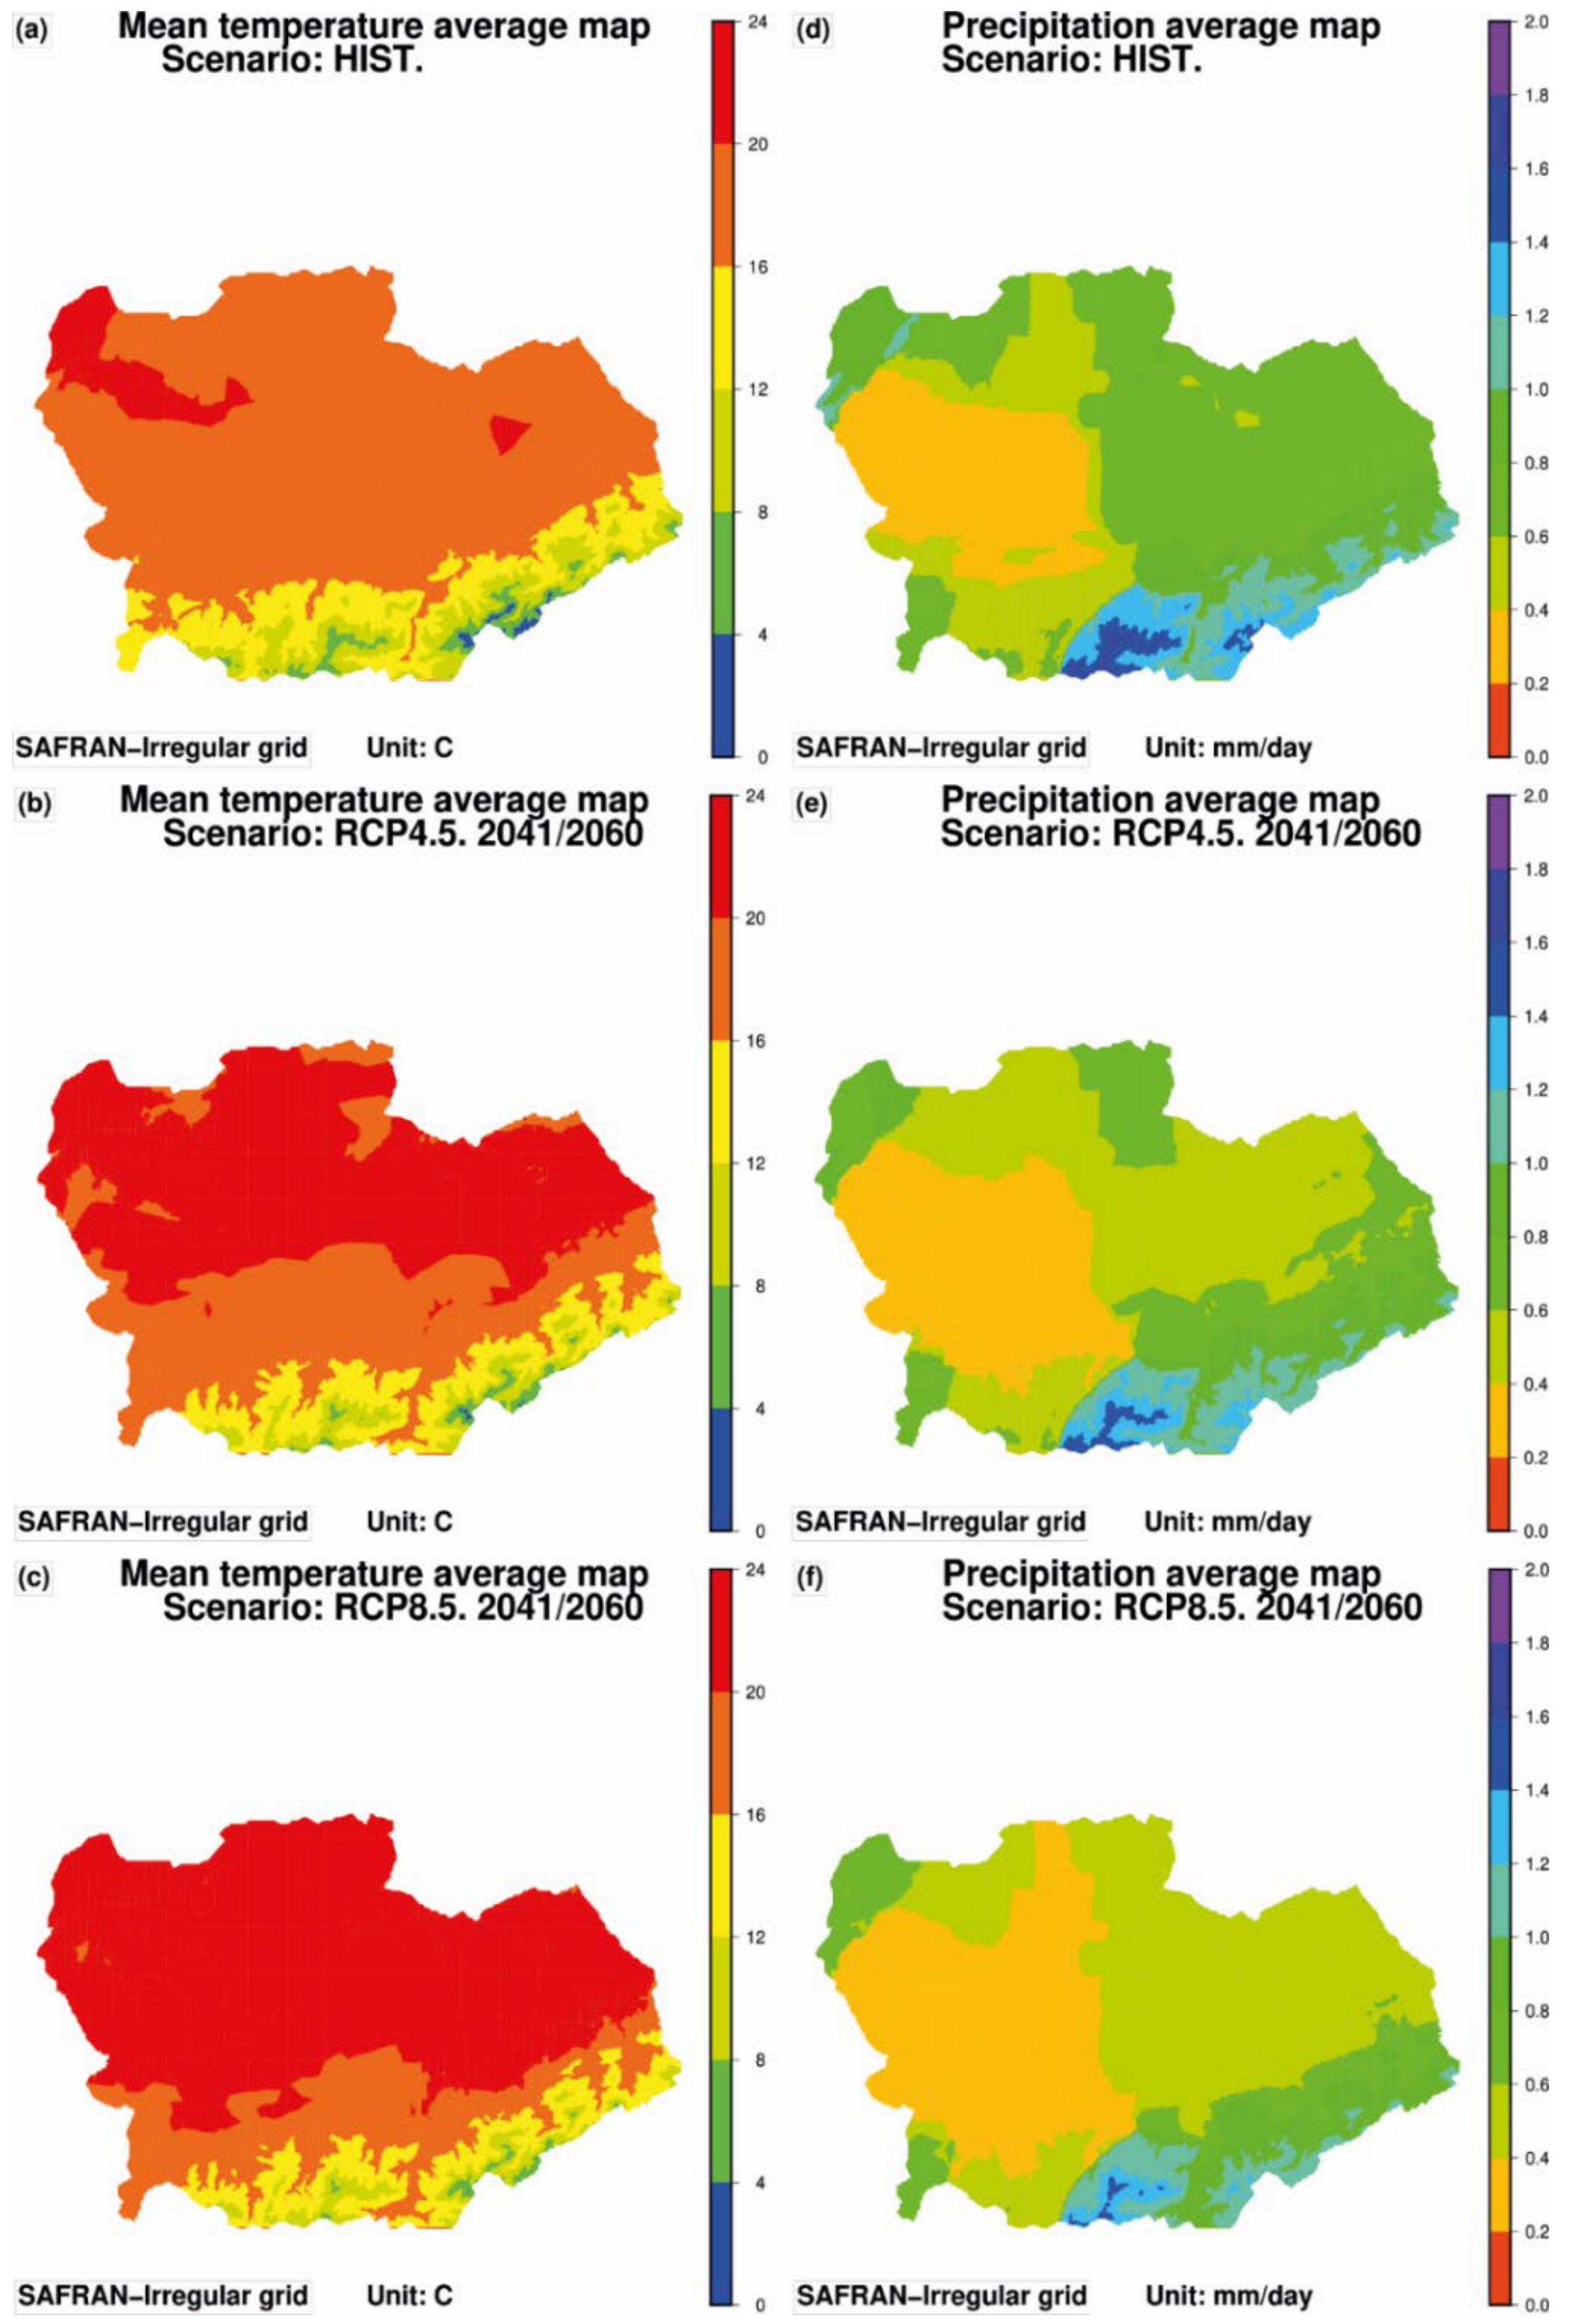
Finally, the delta change determined between the historical and the future projections of Euro-CORDEX both corrected using the Q–Q functions are applied to the SAFRAN reanalysis using the nearest Euro-CORDEX grid points. The yearly maps for the 2041–2060 horizon and the two scenarios are displayed in Figure 8. Table 5 shows the annual changes.
The SAFRAN projection is consistent, on average, with the Euro-CORDEX runs, with changes of the same order of value and higher warming projected for the mountains than for the plains. The only noticeable exception is the decrease in precipitation in the mountainous areas (elevation > 1000 m) for the RCP8.5 scenario, which is much lower for the SAFRAN projection than for the Euro-CORDEX prediction. Indeed, the delta change method computes the relative change between the historical data and the future runs. Thanks to the higher grid cell resolution, SAFRAN is better than Euro-CORDEX in mapping the strong contrast precipitation amount between the plain and the mountain: the average annual precipitation estimated by Euro-CORDEX in the mountains and the plain is equal to 275.34 mm/year and 223.48 mm/year, respectively, while it is equal to 353.0 mm/year and 221.54 mm/year for SAFRAN. Finer details of the change can be observed with the high-resolution SAFRAN projection by comparison to the 12 km Euro-CORDEX run.

4. Summary and Conclusions

The SAFRAN system of Météo-France was first assessed on the Tensift catchment thanks to station data using a leave-one-out approach, observations on snow cover both in situ and remotely sensed, and by comparison to a more data-driven approach for climate data spatialization, namely the MICROMET model [1] on a mountainous subcatchment. The main results can be summarized as follows: (1) due to complex orography, a variable mesh grid ranging from 8 km to 1 km based on terrain elevation outperformed the regular grid usually implemented in SAFRAN for temperature, wind speed, precipitation and, to a lesser extent, incoming solar radiation; (2) the leave-one-out approach is applied to a plain and a mountain station with significantly better performance for all variables obtained in the plain; (3) the timing (start and end) of the snow season is properly reproduced both by MICROMET and SAFRAN in comparison to the MODIS daily snow cover area product, although some large discrepancies are observed around the snow-covered area peak; in addition, the comparison of the predicted snow amount by SAFRAN and MICROMET to data of the Oukaimeden station supports a good timing prediction but also exhibits a large underestimation by both models with slightly better results obtained with SAFRAN.
Finally, the projection of SAFRAN reanalysis was carried out using a three-step approach. It consists in applying the quantile–quantile disaggregation to a station in the plain and a station in the mountain. The obtained transfer functions are then used to downscale the Euro-CORDEX scenario by separating the plain and mountainous grid cells using a 1000 m threshold on elevation. Finally, the delta change coefficients between the historical runs and the future scenarios of the disaggregated Euro-CORDEX are computed and applied to SAFRAN using the nearest Euro-CORDEX grid point for RCP4.5 and RCP8.5 at the 2041–2060 horizons. The obtained results are consistent with the disaggregated Euro-CORDEX scenarios and showed that the mountainous areas are expected to face a higher increase in air temperatures than the plains (up to +2.5 °C for RCP8.5 2041–2060 and +1.71 °C for RCP4.5 -same horizon- for SAFRAN), in agreement with the literature. This high-resolution historical and future climate forcing, available for the first time in this region, is to be used for impact studies, in particular those concerning water resources. It will allow for more localized impact studies at the subcatchment scale as required by water managers to anticipate their future catchment planning.

Supplementary Materials

The following are available online at https://www.mdpi.com/2073-4433/12/3/370/s1, Figure S1: Euro-CORDEX historical data from the 4 RCM models on two stations: Marrakech (left) and Oukaimeden_CAF (right), before the application of the bias correction method (the Quantile-Quantile method), Figure S2: Figure S2. Comparison of the evolution of the reanalysis of two types of grids (Regular of 8 km and Irregular) from the SAFRAN model with the observation at the CHICHAOUA station, for the period 2004–2014, Table S1: Some analysis systems used in the world, Figure S3. Spatialization map of Euro-CORDEX 12 Km futuristic projections on the Tensift Basin, according to the two scenarios RCP4.5 and 8.5 for 2041–2060., Table S2. Validation result of the two grids (regular 8 km and irregular) of the SAFRAN model, averaged over the 10-year period (2004–2014), at the CHICHAOUA station., Figure S4. Deviation map of the Euro-CORDEX futuristic projections relative to the two scenarios (RCP4.5 and RCP8.5) compared to the control period used.

Author Contributions

Conceptualization, A.M., L.H., L.J.; data curation, A.M., L.H., Y.T., A.S., C.S., L.J.; formal analysis, A.M., L.H., S.G., L.J.; methodology, A.M., L.H., L.J.; project administration, E.B.; resources, L.H., E.M., L.J.; software, A.M., A.S., M.L.P., C.S., L.J.; supervision, L.H., L.J.; validation, A.M., L.H., A.S., visualization, A.M., writing—original draft, A.M.; writing—review & editing, A.M. All authors have read and agreed to the published version of the manuscript.

Funding

This research received no external funding.

Data Availability Statement

Not applicable.

Acknowledgments

We acknowledge the World Climate Research Programme’s Working Group on Regional Climate, and the Working Group on Coupled Modelling, the former coordinating body of CORDEX and the responsible panel for CMIP5 for providing the Euro-CORDEX scenarios available at http://www.euro-cordex.net/060378/index.php.en. The meteorological data can be obtained from the Direction Générale de la Météorologie Maroc and from the Tensift Observatory. This work was carried out within the frame of Joint International Laboratory TREMA (IRD, UCAM, DMN, CNESTEN, ABHT, and ORMVAH) and the FP7 ERANET-MED CHAAMS03-62 project. The SAGESSE PPR/2015/48 “Système d’Aide à la décision pour la GEstion des reSSources en Eau”, the H2020 PRIMA IDEWA and ALTOS projects are also acknowledged for additional funding. We are also grateful to the French National Centre for Meteorological Research (CNRM UMR3539, Météo-France CNRS) for providing the SAFRAN analysis system. The Moroccan Direction Générale de la Météorologie (DGM), Université Cadi Ayyad Marrakech/ Institut de Recherche pour le Dévelopement, the Hydraulic agency of the Tensift catchment and the Office Régional de Mise en Valeur de l’Eau Agricole du Tensift Haouz (ORMVAH) are acknowledged for sharing their observational data.

Conflicts of Interest

The authors declare that they have no conflict of interest.

References

  1. Liston, G.E.; Elder, K. A meteorological distribution system for high-resolution terrestrial modeling (MicroMet). J. Hydrometeorol. 2006, 7, 217–234. [Google Scholar] [CrossRef] [Green Version]
  2. Fayad, A.; Gascoin, S.; Faour, G.; López-Moreno, J.I.; Drapeau, L.; Page, M.; Escadafal, R. Snow hydrology in Mediterranean mountain regions: A review. J. Hydrol. 2017, 551, 374–396. [Google Scholar] [CrossRef]
  3. Boudhar, A.; Duchemin, B.; Hanich, L.; Jarlan, L.; Chaponnière, A.; Maisongrande, P.; Boulet, G.; Chehbouni, A. Long-term analysis of snow-covered area in the Moroccan High-Atlas through remote sensing. Int. J. Appl. Earth Obs. Geoinf. 2010, 12, S109–S115. [Google Scholar] [CrossRef] [Green Version]
  4. García-Ruiz, J.M.; López-Moreno, J.I.; Vicente-Serrano, S.M.; Lasanta–Martínez, T.; Beguería, S. Mediterranean water resources in a global change scenario. Earth-Sci. Rev. 2011, 105, 121–139. [Google Scholar] [CrossRef] [Green Version]
  5. Viviroli, D.; Dürr, H.H.; Messerli, B.; Meybeck, M.; Weingartner, R. Mountains of the world, water towers for humanity: Typology, mapping, and global significance. Water Resour. Res. 2007, 43, 1–13. [Google Scholar] [CrossRef] [Green Version]
  6. Kuper, M.; Ameur, F.; Hammani, A. Unraveling the enduring paradox of increased pressure on groundwater through efficient drip irrigation. In Drip Irrigation for Agriculture: Untold Stories of Efficiency, Innovation and Development; Taylor & Francis: Oxford, UK, 2017; ISBN 9781315537146. [Google Scholar]
  7. Giorgi, F.; Lionello, P. Climate change projections for the Mediterranean region. Glob. Planet. Change 2008, 63, 90–104. [Google Scholar] [CrossRef]
  8. Giorgi, F. Climate change hot-spots. Geophys. Res. Lett. 2006, 33, 1–4. [Google Scholar] [CrossRef]
  9. Seager, R.; Osborn, T.J.; Kushnir, Y.; Simpson, I.R.; Nakamura, J.; Liu, H. Climate variability and change of mediterranean-type climates. J. Clim. 2019. [Google Scholar] [CrossRef] [Green Version]
  10. Pepin, N.; Bradley, R.S.; Diaz, H.F.; Baraer, M.; Caceres, E.B.; Forsythe, N.; Fowler, H.; Greenwood, G.; Hashmi, M.Z.; Liu, X.D.; et al. Elevation-dependent warming in mountain regions of the world. Nat. Clim. Change 2015, 5, 424. [Google Scholar]
  11. Bolle, H.J. Mediterranean Climate: Variability and Trends; Springer: Berlin/Heidelberg, Germany, 2002; ISBN 978-3540438380. [Google Scholar]
  12. Jarlan, L.; Khabba, S.; Er-Raki, S.; Le Page, M.; Hanich, L.; Fakir, Y.; Merlin, O.; Mangiarotti, S.; Gascoin, S.; Ezzahar, J.; et al. Remote Sensing of Water Resources in Semi-Arid Mediterranean Areas: The joint international laboratory TREMA. Int. J. Remote Sens. 2015, 36, 4879–4917. [Google Scholar] [CrossRef]
  13. Knippertz, P.; Christoph, M.; Speth, P. Long-term precipitation variability in Morocco and the link to the large-scale circulation in recent and future climates. Meteorol. Atmos. Phys. 2003. [Google Scholar] [CrossRef]
  14. Gultepe, I. Mountain Weather: Observation and Modeling. Adv. Geophys. 2015, 56, 229–312. [Google Scholar]
  15. Sun, Q.; Miao, C.; Duan, Q.; Ashouri, H.; Sorooshian, S.; Hsu, K.L. A Review of Global Precipitation Data Sets: Data Sources, Estimation, and Intercomparisons. Rev. Geophys. 2018. [Google Scholar] [CrossRef] [Green Version]
  16. Levizzani, V.; Cattani, E. Satellite remote sensing of precipitation and the terrestrial water cycle in a changing climate. Remote Sens. 2019, 11, 2301. [Google Scholar] [CrossRef] [Green Version]
  17. Huffman, G.J.; Adler, R.F.; Bolvin, D.T.; Gu, G.; Nelkin, E.J.; Bowman, K.P.; Hong, Y.; Stocker, E.F.; Wolff, D.B. The TRMM Multisatellite Precipitation Analysis (TMPA): Quasi-global, multiyear, combined-sensor precipitation estimates at fine scales. J. Hydrometeorol. 2007. [Google Scholar] [CrossRef]
  18. Kidd, C.; Levizzani, V. Status of satellite precipitation retrievals. Hydrol. Earth Syst. Sci. 2011. [Google Scholar] [CrossRef] [Green Version]
  19. Maggioni, V.; Meyers, P.C.; Robinson, M.D. A review of merged high-resolution satellite precipitation product accuracy during the Tropical Rainfall Measuring Mission (TRMM) era. J. Hydrometeorol. 2016, 17, 1101–1117. [Google Scholar] [CrossRef]
  20. Hsu, K.L.; Gao, X.; Sorooshian, S.; Gupta, H.V. Precipitation estimation from remotely sensed information using artificial neural networks. J. Appl. Meteorol. 1997. [Google Scholar] [CrossRef]
  21. Joyce, R.J.; Janowiak, J.E.; Arkin, P.A.; Xie, P. CMORPH: A method that produces global precipitation estimates from passive microwave and infrared data at high spatial and temporal resolution. J. Hydrometeorol. 2004. [Google Scholar] [CrossRef]
  22. Krakauer, N.Y.; Pradhanang, S.M.; Lakhankar, T.; Jha, A.K. Evaluating satellite products for precipitation estimation in mountain regions: A case study for Nepal. Remote Sens. 2013, 5, 4107. [Google Scholar] [CrossRef] [Green Version]
  23. Navarro, A.; García-Ortega, E.; Merino, A.; Sánchez, J.L. Extreme events of precipitation over complex terrain derived from satellite data for climate applications: An evaluation of the southern slopes of the pyrenees. Remote Sens. 2020, 12, 2171. [Google Scholar] [CrossRef]
  24. Yu, L.; Ma, L.; Li, H.; Zhang, Y.; Kong, F.; Yang, Y. Assessment of high-resolution satellite rainfall products over a gradually elevating mountainous terrain based on a high-density rain gauge network. Int. J. Remote Sens. 2020. [Google Scholar] [CrossRef]
  25. Dos Santos, V.J.; Calijuri, M.L.; Ribeiro Júnior, J.I.; de Assis, L.C. Rainfall estimation methods in the Brazilian semiarid region: 30-year evaluation on a monthly scale. Int. J. Clim. 2020. [Google Scholar] [CrossRef]
  26. Derin, Y.; Yilmaz, K.K. Evaluation of multiple satellite-based precipitation products over complex topography. J. Hydrometeorol. 2014. [Google Scholar] [CrossRef] [Green Version]
  27. Ouatiki, H.; Boudhar, A.; Tramblay, Y.; Jarlan, L.; Benabdelouhab, T.; Hanich, L.; El Meslouhi, M.R.; Chehbouni, A. Evaluation of TRMM 3B42 V7 rainfall product over the Oum Er Rbia watershed in Morocco. Climate 2017, 5, 1. [Google Scholar] [CrossRef]
  28. Tramblay, Y.; Thiemig, V.; Dezetter, A.; Hanich, L. Evaluation of satellite-based rainfall products for hydrological modelling in Morocco. Hydrol. Sci. J. 2016. [Google Scholar] [CrossRef] [Green Version]
  29. Milewski, A.; Elkadiri, R.; Durham, M. Assessment and comparison of TMPA satellite precipitation products in varying climatic and topographic regimes in Morocco. Remote Sens. 2015, 7, 5697. [Google Scholar] [CrossRef] [Green Version]
  30. Kalnay, E.; Kanamitsu, M.; Kistler, R.; Collins, W.; Deaven, D.; Gandin, L.; Iredell, M.; Saha, S.; White, G.; Woollen, J.; et al. The NCEP/NCAR 40-year reanalysis project. Bull. Am. Meteorol. Soc. 1996, 77, 437–471. [Google Scholar] [CrossRef] [Green Version]
  31. Hersbach, H.; Bell, B.; Berrisford, P.; Horányi, A.; Muñoz, J.; Nicolas, J.; Radu, R.; Schepers, D.; Simmons, A.; Soci, C.; et al. Global reanalysis: Goodbye ERA-Interim, hello ERA5. ECMWF Newsl. 2019, 159, 17–24. [Google Scholar] [CrossRef]
  32. Dahlgren, P.; Landelius, T.; Kållberg, P.; Gollvik, S. A high-resolution regional reanalysis for Europe. Part 1: Three-dimensional reanalysis with the regional HIgh-Resolution Limited-Area Model (HIRLAM). Q. J. R. Meteorol. Soc. 2016. [Google Scholar] [CrossRef]
  33. Landelius, T.; Dahlgren, P.; Gollvik, S.; Jansson, A.; Olsson, E. A high-resolution regional reanalysis for Europe. Part 2: 2D analysis of surface temperature, precipitation and wind. Q. J. R. Meteorol. Soc. 2016, 142, 2132–2142. [Google Scholar] [CrossRef] [Green Version]
  34. Soci, C.; Bazile, E.; Besson, F.; Landelius, T.; Tellus, A. Dynamic Meteorology and Oceanography High-resolution precipitation re-analysis system for climatological purposes High-resolution precipitation re-analysis system for climatological purposes. Tellus A Dyn. Meteorol. Oceanogr. 2016, 68, 29879. [Google Scholar] [CrossRef] [Green Version]
  35. Durand, Y.; Brun, E.; Merindol, L.; Guyomarc’h, G.; Lesaffre, B.; Martin, E. A Meteorological estimation of relevant parameters for snow models. Ann. Glaciol. 1993, 18, 65–71. [Google Scholar] [CrossRef] [Green Version]
  36. Durand, Y.; Giraud, G.; Brun, E.; Merindol, L.; Martin, E. A computer-based system simulating snowpack structures as a tool for regional avalanche forecasting. J. Glaciol. 1999, 45, 469–484. [Google Scholar] [CrossRef] [Green Version]
  37. Brun, E.; Martin, E.; Simon, V.; Gendre, C.; Coleou, C. An energy and mass model of snow cover suitable for operational avalanche forecasting. J. Glaciol. 1989. [Google Scholar] [CrossRef] [Green Version]
  38. Habets, F.; Boone, A.; Champeaux, J.L.; Etchevers, P.; Franchistéguy, L.; Leblois, E.; Ledoux, E.; Le Moigne, P.; Martin, E.; Morel, S.; et al. The SAFRAN-ISBA-MODCOU hydrometeorological model applied over France. J. Geophys. Res. Atmos. 2008. [Google Scholar] [CrossRef] [Green Version]
  39. Quintana-Seguí, P.; Le Moigne, P.; Durand, Y.; Martin, E.; Habets, F.; Baillon, M.; Canellas, C.; Franchisteguy, L.; Morel, S. Analysis of near-surface atmospheric variables: Validation of the SAFRAN analysis over France. J. Appl. Meteorol. Clim. 2008, 47, 92–107. [Google Scholar] [CrossRef]
  40. Vidal, J.P.; Martin, E.; Franchistéguy, L.; Baillon, M.; Soubeyroux, J.M. A 50-year high-resolution atmospheric reanalysis over France with the Safran system. Int. J. Clim. 2010. [Google Scholar] [CrossRef] [Green Version]
  41. Martin, E.; Gascoin, S.; Grusson, Y.; Murgue, C.; Bardeau, M.; Anctil, F.; Ferrant, S.; Lardy, R.; Le Moigne, P.; Leenhardt, D.; et al. On the Use of Hydrological Models and Satellite Data to Study the Water Budget of River Basins Affected by Human Activities: Examples from the Garonne Basin of France. Surv. Geophys. 2016, 37, 223–247. [Google Scholar] [CrossRef] [Green Version]
  42. Quintana-Seguí, P.; Peral, C.; Turco, M.; Llasat, M.C.; Martin, E. Meteorological analysis systems in North-East Spain: Validation of SAFRAN and SPAN. J. Environ. Inform. 2016. [Google Scholar] [CrossRef] [Green Version]
  43. Tramblay, Y.; Feki, H.; Quintana-Seguí, P.; Guijarro, J.A. The SAFRAN daily gridded precipitation product in Tunisia (1979–2015). Int. J. Clim. 2019, 39, 5830–5838. [Google Scholar] [CrossRef] [Green Version]
  44. Webster, S.; Brown, A.R.; Cameron, D.R.; Jones, C.P. Improvements to the representation of orography in the Met Office Unified Model. Q. J. R. Meteorol. Soc. 2003, 129, 1989–2010. [Google Scholar] [CrossRef]
  45. Mavromatis, T.; Voulanas, D. Evaluating ERA-Interim, Agri4Cast, and E-OBS gridded products in reproducing spatiotemporal characteristics of precipitation and drought over a data poor region: The Case of Greece. Int. J. Clim. 2020. [Google Scholar] [CrossRef]
  46. Greene, E.M.; Liston, G.E.; Pielke, R.A. Simulation of above treeline snowdrift formation using a numerical snow-transport model. Cold Reg. Sci. Technol. 1999, 30, 135–144. [Google Scholar] [CrossRef]
  47. Liston, G.E.; Sr, R.A.P.; Greene, E.M. Improving first-order snow-related deficiencies in a regional model. J. Geophys. Res. Atmos. 1999, 104, 559–567. [Google Scholar] [CrossRef] [Green Version]
  48. Prasad, R.; Tarboton, D.G.; Liston, G.E.; Luce, C.H.; Seyfried, M.S. Testing a blowing snow model against distributed snow measurements at Upper Sheep Creek, Idaho, United States of America. Water Resour. Res. 2001, 37, 1341–1356. [Google Scholar] [CrossRef]
  49. Hiemstra, C.A.; Liston, G.E.; Reiners, W.A. Snow Redistribution by Wind and Interactions with Vegetation at Upper Treeline in the Medicine Bow Mountains, Wyoming, U.S.A. Arct. Antarct. Alp. Res. 2002, 34, 262–273. [Google Scholar] [CrossRef]
  50. Liston, G.E.; Sturm, M. Winter precipitation patterns in arctic Alaska determined from a blowing-snow model and snow-depth observations. J. Hydrometeorol. 2002, 3, 646–659. [Google Scholar] [CrossRef]
  51. Hasholt, B.; Liston, G.E.; Knudsen, N.T. Snow-Distribution Modelling in the Ammassalik Region, South East Greenland: Paper presented at the 13th Northern Res.Basins/Workshop (Saariselkä, Finland and Murmansk, Russia-Aug. 19–24 2001). Hydrol. Res. 2003, 34, 1–16. [Google Scholar] [CrossRef]
  52. Bruland, G.L.; Richardson, C.J. Hydrologic Gradients and Topsoil Additions Affect Soil Properties of Virginia Created Wetlands. Soil Sci. Soc. Am. J. 2004, 68, 2069–2077. [Google Scholar] [CrossRef] [Green Version]
  53. Liston, G.E.; Winther, J.G. Antarctic surface and subsurface snow and ice melt fluxes. J. Clim. 2005, 18, 1469–1481. [Google Scholar] [CrossRef]
  54. Chehbouni, A.; Escadafal, R.; Duchemin, B.; Boulet, G.; Simonneaux, V.; Dedieu, G.; Mougenot, B.; Khabba, S.; Kharrou, H.; Maisongrande, P.; et al. An integrated modelling and remote sensing approach for hydrological study in arid and semi-arid regions: The SUDMED Programme. Int. J. Remote Sens. 2008, 29, 5161–5181. [Google Scholar] [CrossRef] [Green Version]
  55. Driouech, F. Distribution des Précipitations Hivernales sur le Maroc Dans le Cadre d’un Changement Climatique: Descente D’échelle et Incertitudes. Ph.D. Thesis, Institut National Polytechnique de Toulouse, Toulouse, France, 2010. [Google Scholar]
  56. Marchane, A.; Jarlan, L.; Hanich, L.; Boudhar, A.; Gascoin, S.; Tavernier, A.; Filali, N.; Page, M.; Hagolle, O.; Berjamy, B. Assessment of Daily MODIS Snow Cover Products to Monitor Snow Cover Dynamics over the Moroccan Atlas Mountain Range. Remote Sens. Environ. 2015, 160, 72–86, ISSN 0034-4257. [Google Scholar] [CrossRef]
  57. Zhang, X.; Yang, F. RClimDex (1.0) User Manual; Climate Research Branch Environment Canada: Burlington, ON, Canada, 2004. [Google Scholar]
  58. Chaponnière, A.; Boulet, G.; Chehbouni, A.; Aresmouk, M. Understanding hydrological processes with scarce data in a mountain environment. Hydrol. Process. Int. J. 2008, 22, 1908–1921. [Google Scholar] [CrossRef] [Green Version]
  59. Simonneaux, V.; Hanich, L.; Boulet, G.; Thomas, S. Modelling runoff in the Rheraya Catchment (High Atlas, Morocco) using the simple daily model GR4J. Trends over the last decades. Materials and Methods the GR4J Model. In Proceedings of the 13th IWRA World Water Congress, Montpellier, France, 1–4 September 2008. [Google Scholar]
  60. Boudhar, A.; Hanich, L.; Boulet, G.; Duchemin, B.; Berjamy, B.; Chehbouni, A. Evaluation of the Snowmelt Runoff Model in the Moroccan High Atlas Mountains using two snow-cover estimates Evaluation of the Snowmelt Runoff Model in the Moroccan High Atlas Mountains using two snow-cover estimates. Hydrol. Sci. 2009, 37–41. [Google Scholar] [CrossRef]
  61. Jacob, D.; Petersen, J.; Eggert, B.; Alias, A.; Christensen, O.B.; Bouwer, L.M.; Braun, A.; Colette, A.; Déqué, M.; Georgievski, G.; et al. EURO-CORDEX: New high-resolution climate change projections for European impact research. Reg. Environ. Change 2014, 14, 563–578. [Google Scholar] [CrossRef]
  62. Bouras, E.; Jarlan, L.; Khabba, S.; Er-Raki, S.; Dezetter, A.; Sghir, F.; Tramblay, Y. Assessing the impact of global climate changes on irrigated wheat yields and water requirements in a semi-arid environment of Morocco. Sci. Rep. 2019, 9. [Google Scholar] [CrossRef] [PubMed]
  63. Cardell, M.F.; Romero, R.; Amengual, A.; Homar, V.; Ramis, C. A quantile–quantile adjustment of the EURO-CORDEX projections for temperatures and precipitation. Int. J. Clim. 2019, 39, 2901–2918. [Google Scholar] [CrossRef]
  64. Dozier, J. Spectral signature of alpine snow cover from the landsat thematic mapper. Remote Sens. Environ. 1989, 28, 9–22. [Google Scholar] [CrossRef]
  65. Hall, D.K.; Riggs, G.A.; Salomonson, V.V. MODIS Snow and Sea Ice Products. In Earth Science Satellite Remote Sensing; Qu, J.J., Gao, W., Kafatos, M., Murphy, R.E., Salomonson, V.V., Eds.; Springer: Berlin/Heidelberg, Germany, 2006. [Google Scholar] [CrossRef] [Green Version]
  66. Baba, M.W.; Gascoin, S.; Hanich, L. Assimilation of Sentinel-2 data into a snowpack model in the High Atlas of Morocco. Remote Sens. 2018, 10, 1982. [Google Scholar] [CrossRef] [Green Version]
  67. Sadiki, W.; Fischer, C.; Geleyn, J.F. Mesoscale background error covariances: Recent results obtained with the limited-area model ALADIN over Morocco. Mon. Weather. Rev. 2000, 128, 3927–3935. [Google Scholar] [CrossRef]
  68. Ritter, B.; Geleyn, J.-F. A Comprehensive Radiation Scheme for Numerical Weather Prediction Models with Potential Applications in Climate Simulations. Mon. Weather. Rev. 2002. [Google Scholar] [CrossRef] [Green Version]
  69. Liston, G.E.; Polashenski, C.; Rösel, A.; Itkin, P.; King, J.; Merkouriadi, I.; Haapala, J. A distributed snow-evolution model for sea-ice applications (snowmodel). J. Geophys. Res. Ocean. 2018, 123, 3786–3810. [Google Scholar] [CrossRef]
  70. Barnes, S.L. A Technique for Maximizing Details in Numerical Weather Map Analysis. J. Appl. Meteorol. Climatol. 1964. [Google Scholar] [CrossRef] [Green Version]
  71. Barnes, S.L. Mesoscale objective analysis using weighted time-series observations. NOAA Tech. Memo. 1973, 657–662. [Google Scholar] [CrossRef]
  72. Koch, S.E.; DesJardins, M.; Kocin, P.J. An Interactive Barnes Objective Map Analysis Scheme for Use with Satellite and Conventional Data. J. Appl. Meteorol. Climatol. 1983, 22, 1487–1503. [Google Scholar] [CrossRef]
  73. Efron, B.; Burnham, P. The Jackknife, the Bootstrap and Other Resampling Plans. Biometrics 1982, 39, 816. [Google Scholar] [CrossRef]
  74. Vaittinada Ayar, P.; Vrac, M.; Bastin, S.; Carreau, J.; Déqué, M.; Gallardo, C. Intercomparison of statistical and dynamical downscaling models under the EURO- and MED-CORDEX initiative framework: Present climate evaluations. Clim. Dyn. 2016, 46, 1301–1329. [Google Scholar] [CrossRef] [Green Version]
  75. Tramblay, Y.; Somot, S. Future evolution of extreme precipitation in the Mediterranean. Clim. Change 2018, 151, 289–302. [Google Scholar] [CrossRef]
  76. Déqué, M. Frequency of precipitation and temperature extremes over France in an anthropogenic scenario: Model results and statistical correction according to observed values. Glob. Planet. Change 2007, 57, 16–26. [Google Scholar] [CrossRef]
  77. Marchane, A.; Tramblay, Y.; Hanich, L.; Ruelland, D.; Jarlan, L. Climate change impacts on surface water resources in the Rheraya catchment (High Atlas, Morocco). Hydrol. Sci. J. 2017, 62, 979–995. [Google Scholar] [CrossRef]
  78. Tramblay, Y.; Jarlan, L.; Hanich, L.; Somot, S. Future Scenarios of Surface Water Resources Availability in North African Dams. Water Resour. Manag. 2018, 32, 1291–1306. [Google Scholar] [CrossRef]
  79. WMO. World Meteorological Organization Guidelines on the Calculation of Climate Normals; WMO-No. 1203; WMO: Geneva, Switzerland, 2017; p. 18. [Google Scholar]
  80. Maraun, D.; Wetterhall, F.; Ireson, A.M.; Chandler, R.E.; Kendon, E.J.; Widmann, M.; Brienen, S.; Rust, H.W.; Sauter, T.; Themel, M.; et al. Precipitation downscaling under climate change: Recent developments to bridge the gap between dynamical models and the end user. Rev. Geophys. 2010. [Google Scholar] [CrossRef]
  81. Maraun, D. Bias Correcting Climate Change Simulations—A Critical Review. Curr. Clim. Change Rep. 2016, 2, 211–220. [Google Scholar] [CrossRef] [Green Version]
  82. Sarr, M.A.; Seidou, O.; Tramblay, Y.; El Adlouni, S. Comparison of downscaling methods for mean and extreme precipitation in Senegal. J. Hydrol. Reg. Stud. 2015, 4, 365–389. [Google Scholar] [CrossRef] [Green Version]
  83. Oliphant, A.J.; Spronken-Smith, R.A.; Sturman, A.P.; Owens, I.F. Spatial variability of surface radiation fluxes in mountainous terrain. J. Appl. Meteorol. 2003. [Google Scholar] [CrossRef]
  84. Durand, Y.; Giraud, G.; Laternser, M.; Etchevers, P.; Mérindol, L.; Lesaffre, B. Reanalysis of 47 Years of Climate in the French Alps (1958–2005): Climatology and Trends for Snow Cover. J. Appl. Meteorol. Clim. 2009, 48, 2487–2512. [Google Scholar] [CrossRef]
Figure 1. The Tensift catchment and the orography (digital elevation model STRM at 30m). The location of the meteorological stations and the division of the catchment area into 23 climatically homogeneous zones for the SAFRAN system (see text) are superimposed.
Atmosphere 12 00370 g001
Figure 2. Comparison of the evolution of the reanalysis of SAFRAN (8 km and irregular) and MicroMet model with the observation at the Aremd station, for the period 2004–2014: (a) Incoming Solar Radiation; (b) Air temperature; (c) Rainfall; (d) Wind Speed; (e) Specific Humidity.
Atmosphere 12 00370 g002
Figure 3. Map of yearly average snowfall (a,b), rainfall (c,d), air temperature (e,f), incoming solar radiation (g,h) and wind speed (i,j) for the two models SAFRAN (left) and MicroMet (right) on the Rheraya sub-basin for the period 2004–2012.
Atmosphere 12 00370 g003
Figure 4. Average annual precipitation (a), rainfall (b) and snowfall (c) as a function of altitude for MicroMet and SAFRAN irregular grid on the Rheraya sub-basin, over the period 2004–2012.
Atmosphere 12 00370 g004
Figure 5. Snow cover fraction for (a) the Rheraya sub-basin and (b) the Tensift catchment over the period 2004–2014 derived from SAFRAN (irregular grid) and MicroMet and from the daily MODIS products (see text); (c) time series of monthly snowfall (mm/day) predicted by SAFRAN (Irregular grid) and MicroMet and observed at the Oukaimden_CAF station for the period 2004–2011.
Atmosphere 12 00370 g005
Figure 6. Same as Figure S1 after the application of the quantile–quantile method in the Marrakech (left) and Oukaimeden_CAF (right) stations for the historical period (1988 to 2005): (a,d) maximum air temperature; (b,e) minimum air temperature; (c,f) precipitation.
Atmosphere 12 00370 g006
Figure 7. The future projections of minimum and maximum temperature and precipitation at the Marrakech (left) and Oukaimeden_CAF (right) stations according to the two scenarios RCP4.5 and RCP8.5 for 2041–2060. The lines represent the mean of the models and the hatched section corresponds to the mean ± standard deviation of the 4 RCM models; (a,d) maximum air temperature; (b,e) minimum air temperature; (c,f) precipitation.
Atmosphere 12 00370 g007
Figure 8. SAFRAN-irregular grid of Mean Air temperature (left) and precipitation (right) for the historical period (a,d) and for the projections according to the scenarios RCP4.5 (b,e) and RCP8.5 for 2041–2060 (c,f) over the Tensift catchment.
Atmosphere 12 00370 g008
Table 1. The meteorological observation stations, geographical positions, the time step of the data and availability period.
Name of StationGeographic Coordinates
(Lat/Lon)
Elevation (m)Time StepData Availability
OUKAIMDEN(31.22/−7.92)2680Hourly data2005–2007
MARRAKECH(31.62/−7.96)464Hourly data1988–2014
SAFI(32.28/−9.23)43Hourly data2004–2014
CHICHAOUA(31.44/−8.61)505Hourly data2004–2014
ARMED(31.12/−7.92)2058Hourly data2004–2014
R3(31.67/−7.59)563Hourly data2004–2013
OUNAGHA(31.44/−9.28)526Hourly data2014
AGAFAY(31.50/−8.23)516Hourly data2004–2014
S_A_GHYAT(31.53/−7.85)578Hourly data2004–2014
NELTNER(31.06/−7.93)3177Hourly data2007–2012
IMSKBOUR(31.20/−7.94)1443Hourly data2007–2012
TACHDART(31.15/−7.84)2385Hourly data2007–2012
ASNI(31.25/−7.98)1170Hourly data2004, 2007–2012
GRAWA(31.55/−7.87)531Hourly data2004–2010
AGDAL(31.60/−7.97)489Hourly data2004–2008
OUKA(31.09/−7.85)3239Hourly data2004–2011
SAADA(31.63/−8.07)411Hourly data2004–2014
OUKAIMEDEN_CAF(31.21/−7.86)2687Daily data1988–2005
Table 2. Evaluation of SAFRAN (8 km and Irregular) and MicroMet model at the Aremd station 2004–2014. (The evaluation of MicroMet was carried out between 2004–2012).
ParameterAverage ObservedAverage AnalyzedBiasRMSESimple Correlation
Irregular8 kmMicroMetIrregular8 kmMicroMetIrregular8 kmMicroMetIrregular8 kmMicroMet
Incoming Solar Radiation (W/m2)199.69251.19259.57287.7251.559.8786.25161.96165.88351.680.8880.890.353
Surface temperature (°C)11.5512.136.7613.070.59−4.791.523.586.193.820.8860.8490.881
Wind (m/s)2.052.433.171.810.381.12−0.342.162.622.020.3520.3380.365
Precipitation (mm/day)1.181.020.720.88−0.16−0.46−0.373.834.413.090.6080.3730.833
Specific humidity (g/kg)4.655.613.965.450.97−0.690.812.131.981.710.6630.5950.758
Table 3. Annual average (or cumulative for rainfall and snowfall) of the meteorological variables predicted by SAFRAN and MicroMet over the Rheraya sub-basin.
DATETemperature (°C)Incoming Solar Radiation (W/m2)Rainfall (mm)Snow (mm)Wind Force (m/s)
SAFRANMicroMetSAFRANMicroMetSAFRANMicroMetSAFRANMicroMetSAFRANMicroMet
2004/200511.012.0260.7284.7186.6129.961.750.02.82.1
2005/200610.811.5253.6282.7314.3260.891.477.12.92.2
2006/200710.911.6260.2291.7272.0193.479.969.12.32.0
2007/200811.411.8263.5293.6282.4319.973.365.02.42.1
2008/200910.410.6235.2304.0466.9490.2141.395.52.92.2
2009/201012.412.6240.9315.0324.1362.572.757.22.81.8
2010/201112.012.1229.8259.1502.1541.976.264.32.81.9
2011/201211.611.6252.7210.3235.0288.484.780.12.51.5
Average
(2004/2012)
11.311.7249.6280.1322.9323.485.269.82.72.0
Table 4. Annual change in temperature (Tmax, Tmin) and precipitation medians by the model ensembles on the stations of Marrakech and Oukaimeden_CAF over 2050.
Tmax (°C)Tmin (°C)Pr (mm/Year)
MarrakechOukaimedenMarrakechOukaimedenMarrakechOukaimeden
RCP4.5+1.6+1.9+1.3+1.8−48 (−22%)−96 (−19%)
RCP8.5+2.2+2.8+1.9+2.7−70.8 (−32%)−181.2 (−35%)
Table 5. Annual changes considering the mean of temperature (Tmax, Tmin) and precipitation (reduced or gain) by Euro-CORDEX and SAFRAN on the basin, the plains and mountain parts over 2050.
Mean Temperature (°C)
RCP4.5RCP8.5
SAFRANEuro-CORDEXSAFRANEuro-CORDEX
Basin+1.64+1.5+2.38+2.2
Plain+1.48+1.5+2.12+2.1
Mountain+1.71+1.7+2.5+2.5
Precipitation (mm/year)
RCP4.5RCP8.5
SAFRANEuro-CORDEXSAFRANEuro-CORDEX
Basin−32.99 (−11%)−36.2 (−15%)−58.5 (−20%)−72.31 (−31%)
Plain−34.66 (−16%)−35.78 (−16%)−65.19 (−30%)−69.33 (−31%)
Mountain−32.22 (−9%)−37.32 (−14%)−55.40 (−16%)−80.30 (−32%)
Publisher’s Note: MDPI stays neutral with regard to jurisdictional claims in published maps and institutional affiliations.