Abstract
The U.S Environmental Protection Agency’s National Air Toxics Trends Stations Network has been measuring the concentration of hazardous air pollutants (HAPs) including formaldehyde (HCHO) since 2003. Bountiful, Utah (USA) has served as one of the urban monitoring sites since the network was established. Starting in 2013, the mean concentration of HCHO measured in Bountiful, Utah exceeded the non-cancer risk threshold and the 1 in 1 million cancer risk threshold. In addition, the measured concentrations were more than double those found at surrounding locations in Utah. A Positive Matrix Factorization (PMF) analysis using PMF-EPA v5 was performed using historical data (2004–2017) to better understand the sources of formaldehyde in the region. The historical data set included samples that were collected every sixth day on a 24 h basis. Beginning in February 2019 an eight-week air sampling campaign was initiated to measure formaldehyde on a two-hour averaged basis. In addition, the measurements of O3, NO, NO2, benzene, toluene, ethylbenzene, and xylenes (BTEX) were also collected. Corresponding back-trajectory wind calculations for selected time periods were calculated to aid in the understanding of the effects of BTEX emission sources and formaldehyde formation. The results indicate that the principal formaldehyde sources are associated with biomass burning and the conversion of biogenic emissions into HCHO. Back-trajectory wind analysis of low (≤3 ppbv) and high (23.8–32.5 ppbv) HCHO cases show a clear dominance of high HCHO originating in trajectories that come from the southwest and pass over the area of the oil refineries and industrial sources in the north Salt Lake City area.
1. Introduction
The U.S. Environmental Protection Agency (EPA) National Air Toxics Trends Station (NATTS) Network has been in place since 2003 and was developed to provide long-term monitoring of hazardous air pollutants (HAPs) [1]. Since 2003, the Bountiful, Utah monitoring site has served as one location in the NATTS network. The U.S. EPA has set guidelines for a range of HAPs, and most of these pollutants have been detected in low concentrations in Utah. The Utah Division of Air Quality (DAQ) has sponsored or collaborated on several studies to measure the concentrations of various HAPs in Utah, including formaldehyde. Formaldehyde is a ubiquitous trace compound in the atmosphere. Inhalation of formaldehyde can be irritating to the upper respiratory tract and eyes. Animal studies have shown that inhalation can affect the lungs and impair learning and change behavior [2]. Formaldehyde has been classified as a probable human carcinogen (Group B1) by the U.S. Environmental Protection Agency (EPA) and carcinogen by the International Agency for Research on Cancer (IARC) [3,4]. Of 187 compounds that have been identified as HAPs, HCHO contributes over half the total cancer risk and 9% of noncancer risk in the United States (U.S.) [1,5,6]. Over 12,000 people year−1 are estimated to develop cancer based on ambient formaldehyde exposure in the US [7].
Formaldehyde is a volatile organic compound (VOC) that plays a vital role in ozone formation in urban areas. Its photolysis is a source of both OH and HO2 radicals, which both serve to drive tropospheric O3 formation. As a result of HCHO’s carcinogenic nature and role in tropospheric ozone formation, a wealth of research has been done to better elucidate sources of formaldehyde [8,9,10,11,12]. HCHO can be directly emitted into the atmosphere from both anthropogenic and biogenic sources. Secondary production of HCHO occurs during the photooxidation of almost every VOC albeit with varying efficiencies and rates. Fuel combustion has been identified as the dominate primary anthropogenic source, but biogenic emissions are the largest primary sources of formaldehyde in the U.S. [13]. Quantifying the division between primary and secondary production of HCHO has been investigated by a variety of researchers using both experimental and modeling methods [14,15,16]. The results of these studies are wide ranging and vary with the seasons and location. For example, Parrish et al., in an elaborate air sampling campaign focused on the Houston Texas region, found that 92% of HCHO production resulted from the atmospheric oxidation of highly reactive VOCs emitted from the regions’ petrochemical industry [15]. Approximately 4% of the HCHO measured was attributed to primary emissions from these facilities with another ~1% of primary emissions from vehicles. Modeling studies using the Unified Regional Air-quality Modeling System (AURAMS) focused on Canada found that between 69–96% of HCHO during summer months was produced secondarily while 9–67% is produced during winter months from secondary sources. Primary mobile emissions during the summer contributed between 0.8–19% of HCHO while during the winter this ranged between 13–56% [16].
Since 2003, HAPs measurements in Bountiful, Utah have been collected on every sixth day on a 24 h basis. A 2014 study showed that starting in 2013 the mean concentration of HCHO measured in Bountiful, Utah was more than double that found at surrounding locations in Utah [17]. In 2017, a 6-week-long summer and 7-week-long winter passive sampling study was conducted at 34 sites in the Bountiful area to better understand the sources of formaldehyde in this region. While this study provided useful data, it did not reveal the sources of elevated HCHO in the region [18].
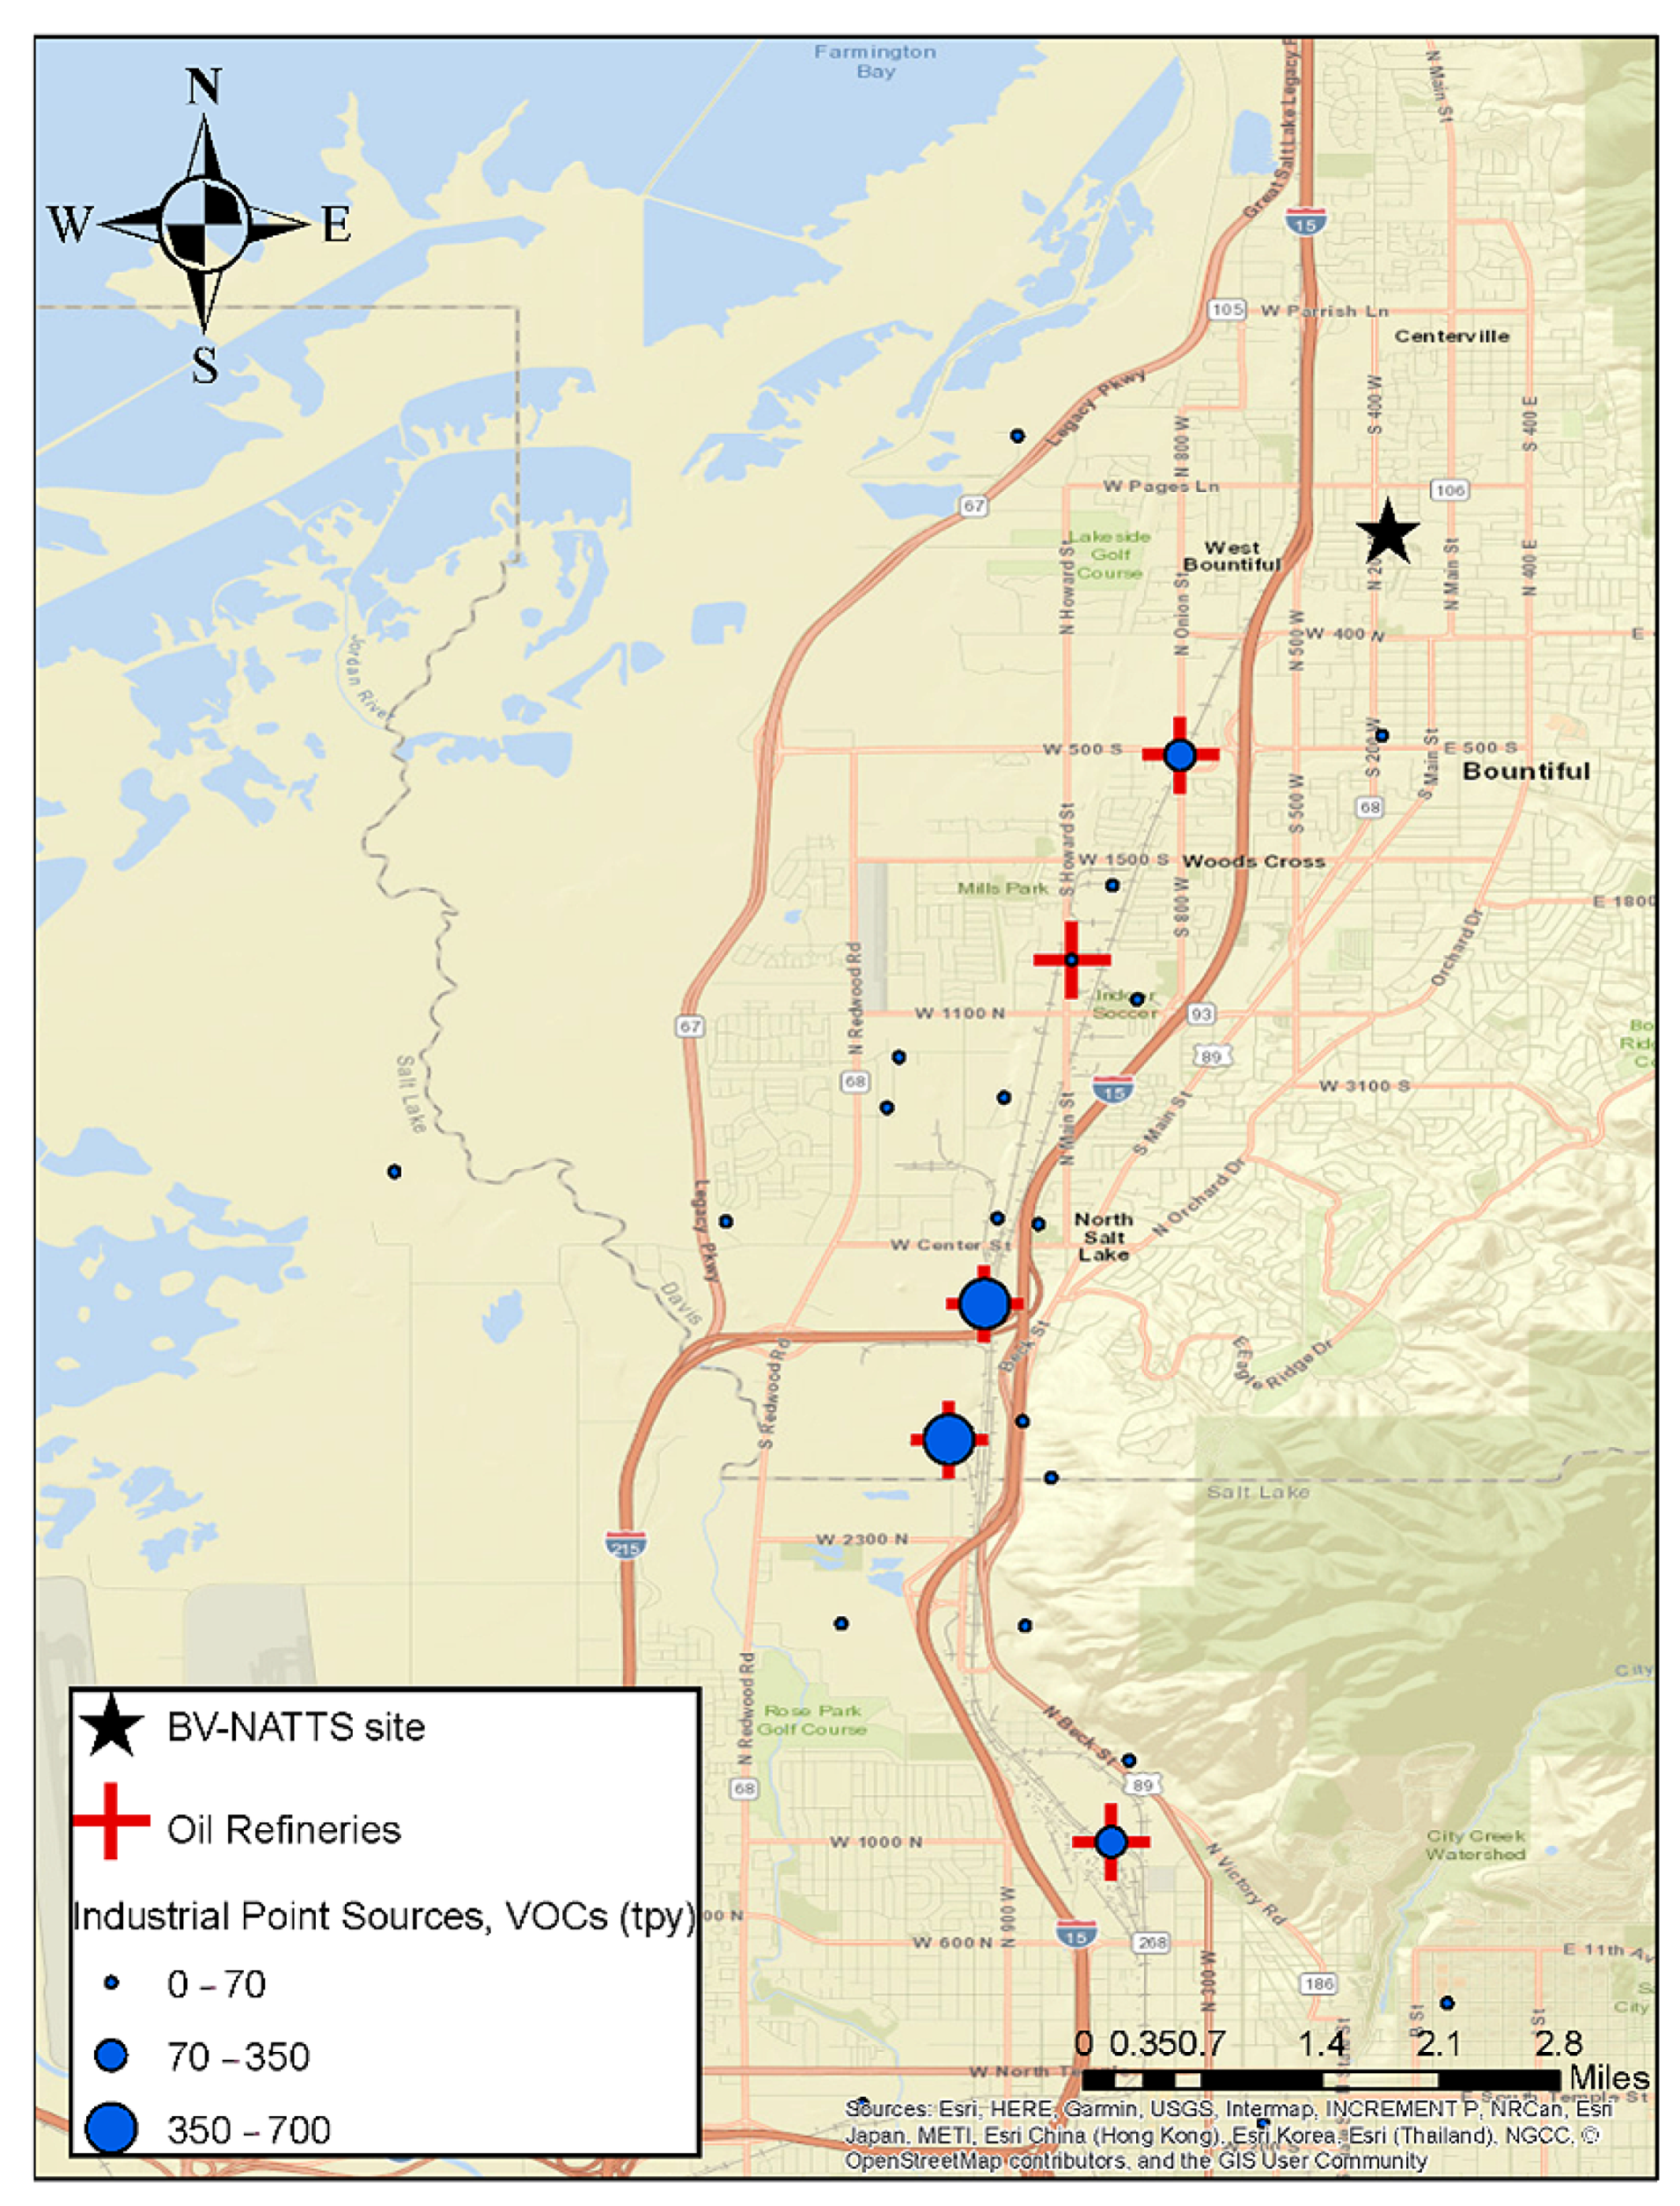
Starting in February 2019, an eight-week intensive campaign was started to measure HCHO at the Bountiful, Utah site on a two-hour averaged basis. The components expected to be important to understanding the sources of formaldehyde including benzene, ethylbenzene, toluene, and xylenes (BTEX) were also measured. In addition, the concentrations of NOX (NO, NO2) and O3, were also measured on a two-hour averaged basis. Figure 1 shows the location of the Bountiful sampling site, the five oil refineries located between 2–5 miles to the south, southwest of the sampling site as well as the I-15 interstate and the location of other DAQ permitted VOC emitting point sources. In 2017, the annual average daily traffic count for vehicles passing through the section of I-15 that runs parallel to the sampling site was 168,000. A total of 84% of this traffic was cars, 9.3% was single unit trucks (i.e., vehicle on a single frame including box trucks, camping and recreation vehicles and motor homes) and 6.7% was combination unit trucks (i.e., truck-tractors units traveling with a trailer or multiple trailers) [19].
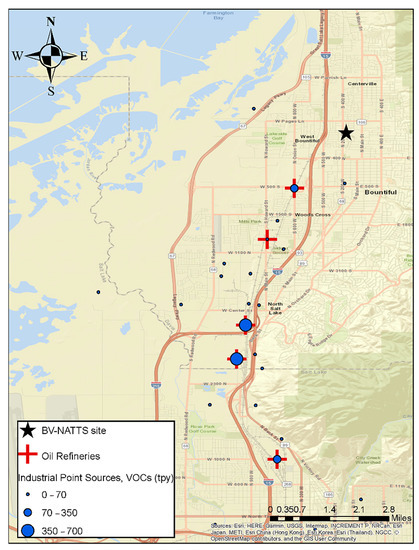
Figure 1.
The locations of various VOC emission sources, oil refineries (red crosses) and industrial (blue circles) with emission strengths (tons year−1) located to the SSW of the Bountiful NATTS sampling site (black star). Green color represents mountains with forested areas. Emission strengths are taken from permits issued by the State of Utah Department of Air Quality. Additionally, included is the location of major roadways and forested areas in the area.
This manuscript presents the results of a positive matrix factorization (PMF) analysis done using historical data (2004–2015) to better understand the sources of formaldehyde in the region. The historical data set measurements collected every sixth day on a 24 h basis. The data set collected in 2019 includes two-hour averaged measurements of formaldehyde and some of its possible precursors. The more rapid data collection method used in the 2019 study allows for additional conclusions to be made about sources of formaldehyde in the Bountiful region. To better understand the possible variety of formaldehyde emissions, corresponding back-trajectory wind calculations for selected time periods are presented to aid in the understanding of the effects BTEX emission sources on the secondary formation of formaldehyde.
2. Methods
2.1. PMF Historical Data Analysis (2004–2015 Measurements)
A source apportionment analysis, using Positive Matrix Factorization (PMF), was conducted using 24 h HAPs measurements collected at the Bountiful NATTS location for the time period of 2004–2015. This analysis focused on carbonyls, VOCs, PM2.5 and NOx. Historical measurements were collected every 6 days for a 24 h period beginning at midnight. Samples were collected using an instrument designed by ERG (ERG(C):AT/C Sampling System, North Chelmsford, MA, USA), which is U.S. EPA’s contract laboratory for the NATTS network [20]. To collect VOCs and carbonyls, air samples were drawn through evacuated canisters and 2,4-dinitrophenylhydrazine (DNPH) sampling cartridges preceded by a potassium iodide-coated O3 scrubber. Following collection, canisters were analyzed for VOCs using U.S. EPA method TO-15 while cartridges were analyzed for carbonyls using U.S. EPA method TO-11A. Over the duration of this sampling campaign, three different instruments were used to measure NOx. These were a Thermo Environmental NOx (model 42, Waltham, MA, USA) analyzer, API (model 200 A/E) analyzer and Teledyne-API (model T200UP, San Diego, CA, USA) analyzer. Measurements were collected in accordance with U.S. EPA air monitoring requirements, with sampler inlets being placed at 4–5 m above ground level. To avoid airflow interference, a minimum of 2 m was kept between samplers in all horizontal directions. A minimum of 1 m vertical spacing from supporting structures was also maintained. PM2.5 was measured using a MetOne (Grants Pass, ON, USA) SASS sampler. The MetOne SASS sampler was fitted with 47 mm Nylon and Teflon filters, with PM2.5 mass being determined by gravimetrically weighing the Teflon filter. Other filter measurements, which are typically used for PM2.5 speciation analysis, were not used in this study.
The compounds used in the PMF analysis were selected based on data completeness and their uncertainties. Initially, the raw concentrations for formaldehyde for the entire time period, 2004–2017, were evaluated to detect weekday vs. weekend trends and seasonal differences. Correlation coefficients between formaldehyde and other species, such as carbonyls and VOCs, were also used to understand potential relationships. For formaldehyde, concentrations exceeding 3 ppbv were separated into different ranges (3–10, 10–15 and 15–36 ppbv). This 3 ppbv threshold was selected because it is the minimal risk level (MRL) set up by the Agency for Toxic Substances and Disease Registry (ATSDR) for chronic inhalation causing respiratory problems in humans [21].
The raw measurements were pre-processed prior to PMF analysis to determine which species to include in the PMF model. This pre-processing step included identifying and addressing missing data, data below detection limits, and data with poor or unknown data quality.
The concept of Positive Matrix Factorization (PMF) and the algorithm used in the analysis has been previously described [22]. With PMF, the results are constrained so that factor contributions cannot be negative for any species. The PMF program used in this analysis was EPA PMF v5.0 [23]. One of the advantages of PMF is the ability to account for missing and below detection limit data as well as perform bootstrap and displacement analysis. The uncertainty in each measurement can be adjusted to account for aberrations in the data set. In this study, precision measurements were not available for the measured species. Error estimates were made by establishing an estimated limit of quantitation from the variability of measurements for each species during periods of time when low concentrations were present, and the precision of the measurements was assumed to be 10% for all species. Single missing values in the data set were accounted for by taking the geometric mean of the sample preceding and following the missing data point. The uncertainty for each species for each data point was then taken to be the limit of quantitation plus the concentrations of the species times 0.1. The uncertainty of the fitted parameter, formaldehyde, was taken to be four times the measured value [24].
The initial PMF analysis identified three species (carbon disulfide, acetonitrile and dichloromethane) that always appeared in a corresponding factor with only that species and no formaldehyde. This indicated that these species were not related to the formaldehyde factors and they were deleted from the subsequent data set. Likewise, while ozone is formed, in part from formaldehyde, inclusion of ozone in the PMF analysis resulted in a factor with no formaldehyde and ozone was dropped from the data set. Presumably this reflects that while formaldehyde contributes to the formation of ozone, other compounds often dominate ozone formation. NOX and PM2.5 were important species because they should be associated with primary formaldehyde sources. Although data were collected through 2017, starting from 23 February 2015 onward, the NOX data had long periods with constant values, indicating an issue with its measurement. Therefore, the data set was truncated to only include measurements from 2004–2015 for the PMF analysis data set. Ultimately, the PMF analysis included twenty species and 578 data points (Table 1).

Table 1.
Twenty species included in the PMF analysis. Uncertainty in the data was calculated as the limit of detection for the species plus the concentration of the species times precision, except for formaldehyde where the uncertainty was taken to be four times the concentration. The detection limit is reported after the species in units of ppbv except for PM2.5 (µg m−3).
EPA PMF v5.0 analysis was conducted in the robust mode by incrementally assuming 4–9 factors as solutions. The resulting data were best described with 5 factors. The final EPA PMF v5.0 solution with was further analyzed using the “constrained analysis” option of PMF to optimize the description of Factor 4 (attributed to mobile emissions) with respect to the formaldehyde and acetaldehyde. The Q(true) value for the final solution was 6530, compared to the degrees of freedom of 11,560.
Concentration rose plots were also generated to identify the directions in which sources of formaldehyde are likely to be situated. The plots were created by using the 24 h averaged formaldehyde concentrations, PMF source profiles and same day 24 h average wind direction measurements. The wind measurements were collected for both historical measurements period (2004–2017) and high temporally resolved measurements period (2019) using Met One 020B Wind Direction Sensor and 010B Wind Speed Sensor.
2.2. High Temporally Resolved Measurements (2019)
Formaldehyde and related gas-phase species were measured all on an hourly average basis at Bountiful Viewmont High School, Utah (EPA AIRS code: 490110004, see Figure 1) the same location that the historic measurements were made. Although measured on an hourly averaged basis the data were converted to two-hour averaged data to increase the signal/noise ratio. The following two-hour averaged data were used in the data analysis.
2.2.1. Criteria Gas Phase Species Measurement
O3 and NOx (NO, NO2) were measured using analyzers which included a photometric ozone analyzer (Teledyne-API (San Diego, CA, USA), Model 400 E), and T series NOx analyzer (Model T200U) equipped with a NO2 photolytic converter, respectively. The trace gas analyzers were calibrated bi-weekly and automated precision, zero and span (PZS) checks were performed automatically to monitor any drifts. The ambient air was drawn into a manifold at ~10 slpm (standard liters per minute) through ~10 m long 1⁄2” O.D. PFA tubing to a 6-port glass manifold. The trace gas analyzers sub-sampled from this manifold at 600–700 sccm (standard cubic centimeters per minute).
2.2.2. HCHO Measurement
A Broadband Cavity Enhanced Absorption Spectrometer (BBCEAS) instrument was used to measure HCHO and NO2. The BBCEAS leverages long path lengths (1–5 km) by use of multi-reflections in a short instrument footprint (1–2 m) [25]. A cage system constructed of carbon-fiber tubes was employed to obtain optical alignment, with structural parts being 3-D printed (laser-sintering or extruded PLA, depending on the function of the part). Initial tests were performed with a base path of 98.5 cm and 5 cm diameter highly reflective mirrors from Advanced Thin Films (ATFilms) centered at 365 nm, with a second cavity centered at 455 nm. Light was produced by LEDEngin (blue) and Thorlabs (M340D3) LEDs centered at 450 and 340 nm, respectively, and collected at the rear of the cavity onto optical fibers. An Andor Shamrock SR-303i spectrograph with gated, intensified CCD was used as a detector in the UV region (310–400 nm range, ~0.5 nm FWHM). In the visible region, an Avantes (Louisville, CO, USA) AvaSpec-2048L was used as a detector.
Nitrogen and helium were supplied to the cavity to characterize the mirror loss as well as air and NO2 produced from the reaction of NO with O3 in a calibration source. The mirror reflectivity was calculated as follows [26]:
where d0 is the cavity length, I is the intensity (spectrum) in nitrogen or helium, and α is the Rayleigh scattering.
Reference spectra were acquired every two hours using an overflow valve controlled by a separate Arduino circuit. Spectra were saved every minute, with signal averaging carried out in post-processing to bring noise in the fitting down. The limit of quantification using this method was 1 ppbv. Spectra were simultaneously fitted for HCHO and NO2.
For ambient sampling, a 2 m long, ¼” Teflon inlet extended out of the sampling trailer with a 2 µm PTFE filter at the end of the inlet. Air was pulled at a total flow of 1.5 slpm at the inlet, with additional air added as purges over the mirrors. The HCHO fitting window was narrowed to 346–357 nm due to drifts in LED/mirror matching over time at the wings of the mirror reflectivity.
2.2.3. BTEX Measurement
A Perkin/Elmer (Boston, MA, USA) GC-FID Clarus 580 made hourly averaged measurements of BTEX. Ambient samples were collected through a 2 m long, ¼”Teflon inlet extended out of the trailer with a 2 µm PTFE filter affixed to the inlet. Air flowing at 200 sccm was pulled through a preconcentrator kept at −30 °C for 45 min. After the collection period, the preconcentrated sample is flash heated and pushed using ultrapure He (99.999%) through an open tubular column for separation and finally detection by flame ionization detection. Built into the sampling protocol was injection of a standard gas mixture (AirGas) containing dichloromethane, benzene, toluene, ethylbenzene and xylenes once a day. Calibration curves affirmed linearity of the instrument response between 0.1 and 20 ppb for these compounds.
3. Results and Discussion
The results from the historical data are presented first followed by the results from the high temporally resolved measurements and finally the results from these two studies are compared to one another.
3.1. Time-Integrated Historical Measurements of HCHO (2004–2017 Data)
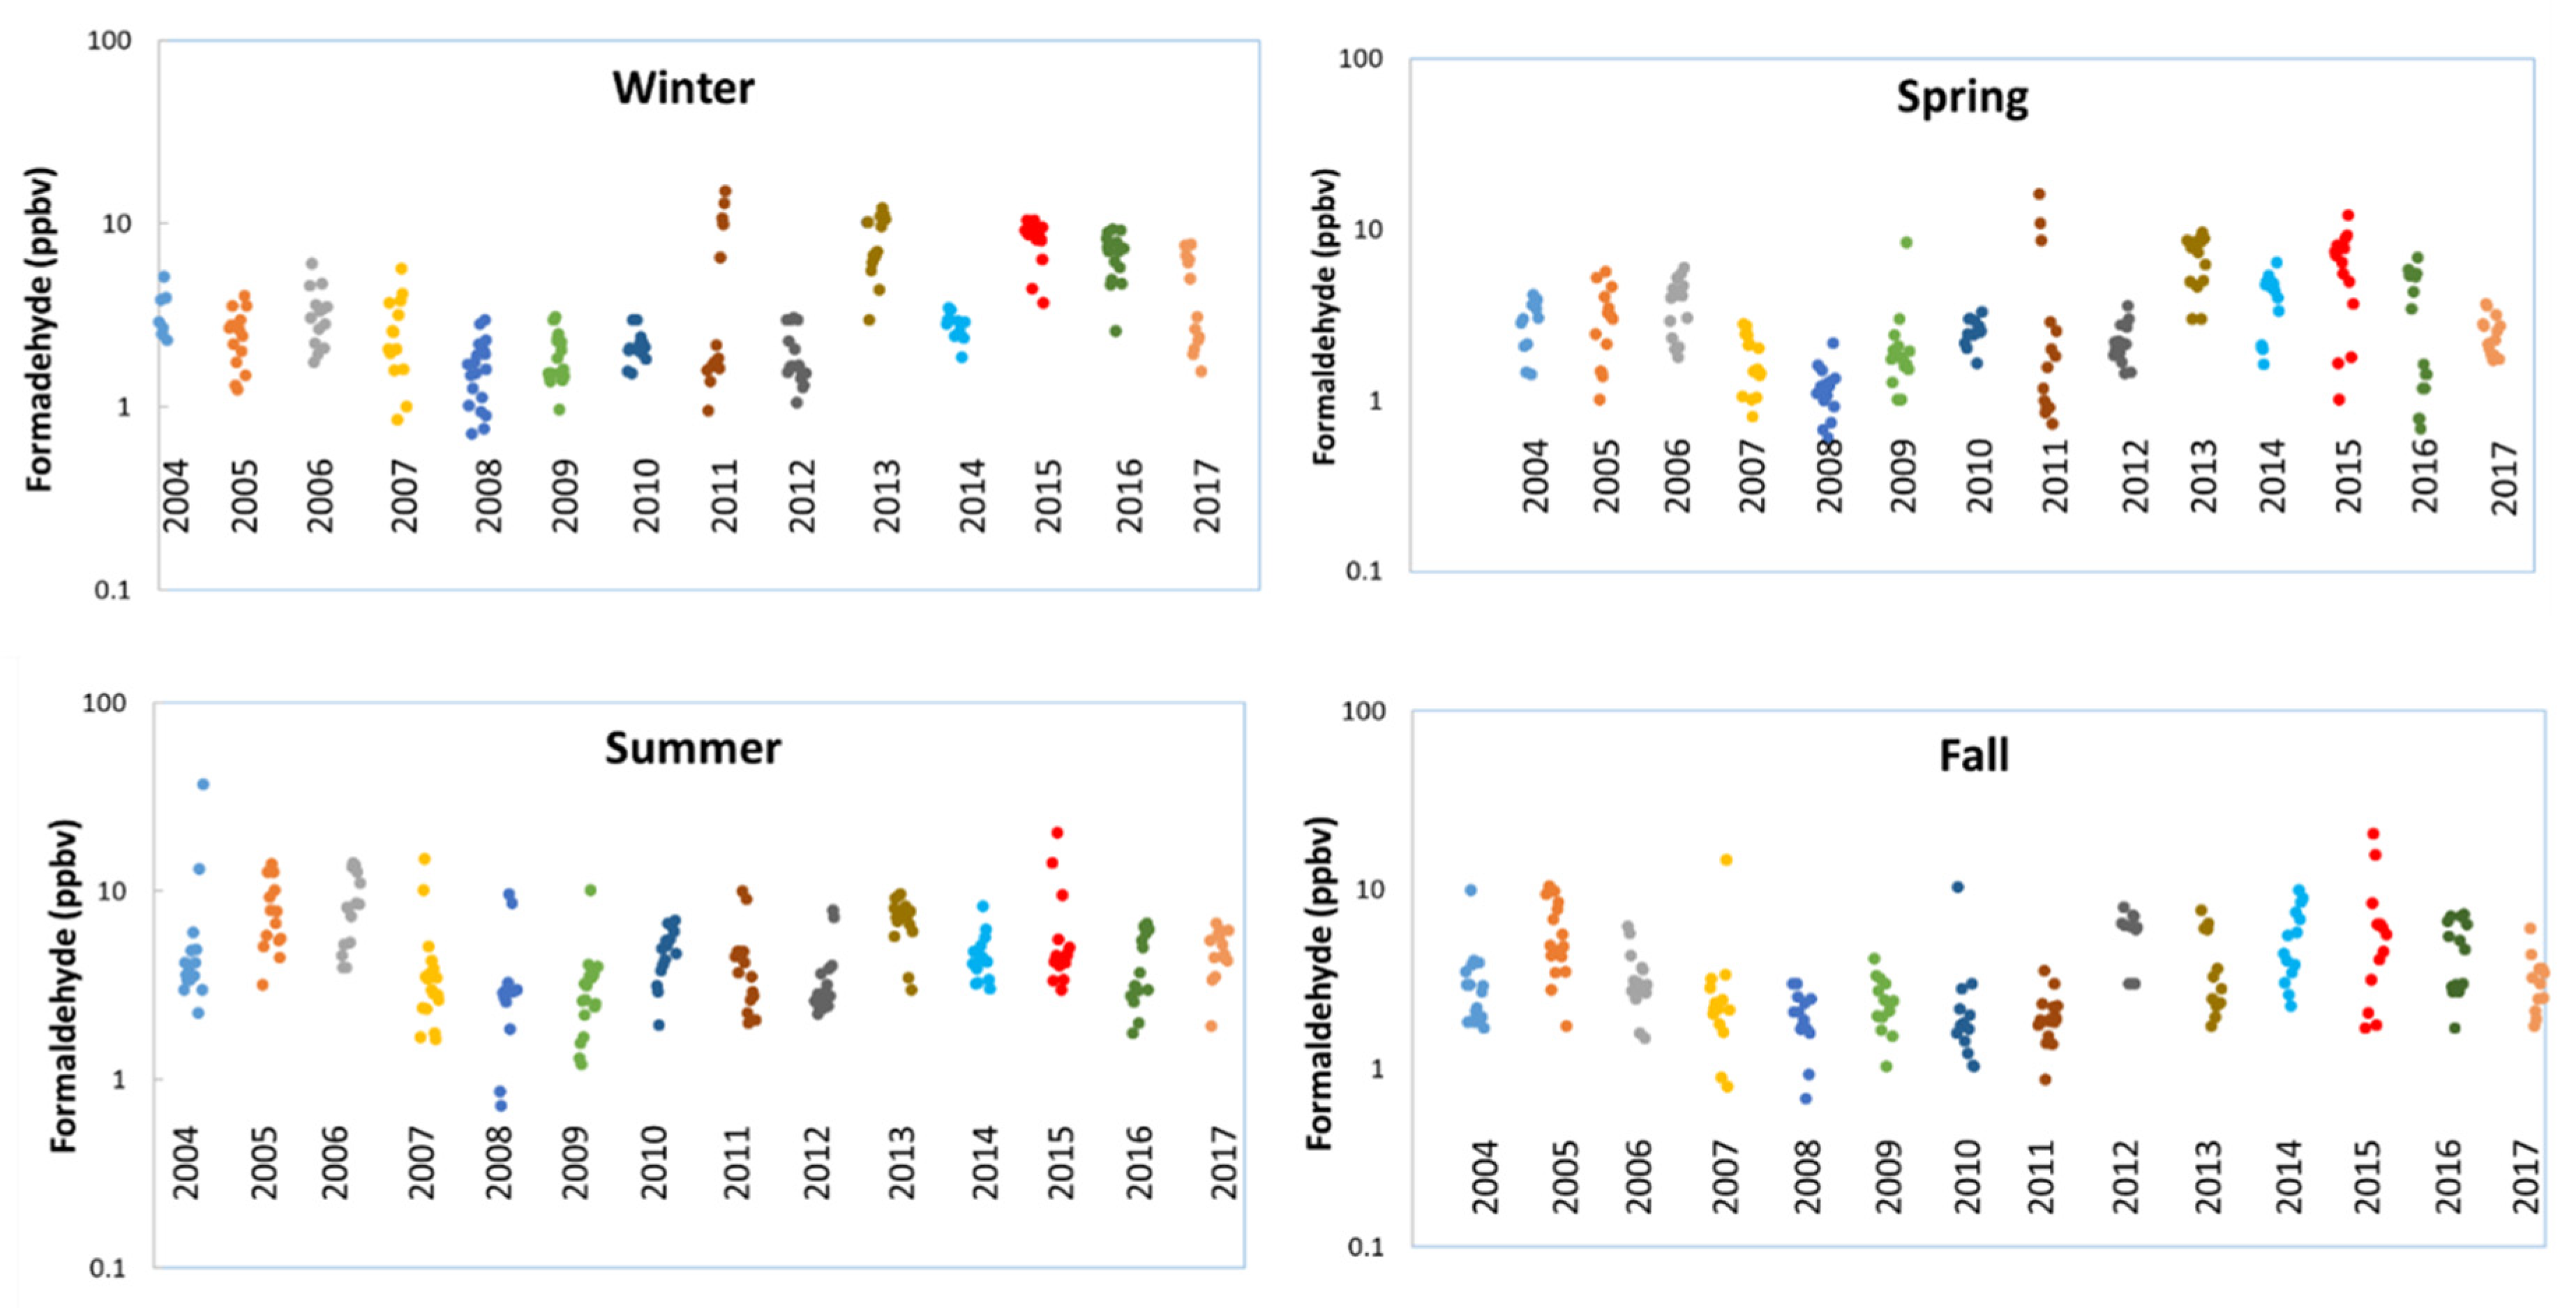
Analysis of the historical data shows that beginning in 2013, the Bountiful station began to experience elevated levels of formaldehyde during the winter (Figure 2). Starting winter 2013, high concentrations of formaldehyde were seen throughout the year in all seasons, whereas in Fall 2011, formaldehyde concentrations were not that high as compared to other seasons (winter, spring and summer 2011). Consequently, the year 2013 was used as the starting point for elevated formaldehyde concentrations.
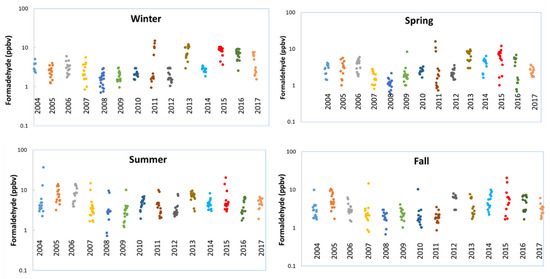
Figure 2.
Formaldehyde seasonal variations. Winter: December, January and February; Spring: March, April and May; Summer: June, July and August and Fall: September October and November.
Table 2 shows the concentration of HCHO sorted by day of the week. This was done in an attempt to detect weekday vs. weekend trends. The formaldehyde concentrations showed no trends between days of the week.

Table 2.
Proportion of formaldehyde concentration ranges separated by day of week and concentration range. The bottom row in columns 2, 4, 6, and 8 are the sum of the number of days in the analyzed data set that HCHO ranged between <3 ppbv, 3–10 ppbv, 10–15 ppbv and 15–36 ppbv. The bottom row in columns 3,5,7 and 9 are the sum of the percentages of time that the concentration ranges occurred between Monday and Sunday.
A calculation of correlation coefficients of formaldehyde with other species revealed stronger correlations for formaldehyde with other aldehydes such as: acetaldehyde, butyraldehyde, propionaldehyde, valeraldehyde, trans-crotonaldehyde, benzaldehyde and tolualdehydes (R2 values ranging from 0.9–0.98), indicating their likely shared origin.
3.2. PMF Historical Data Analysis (2004–2015 Data)
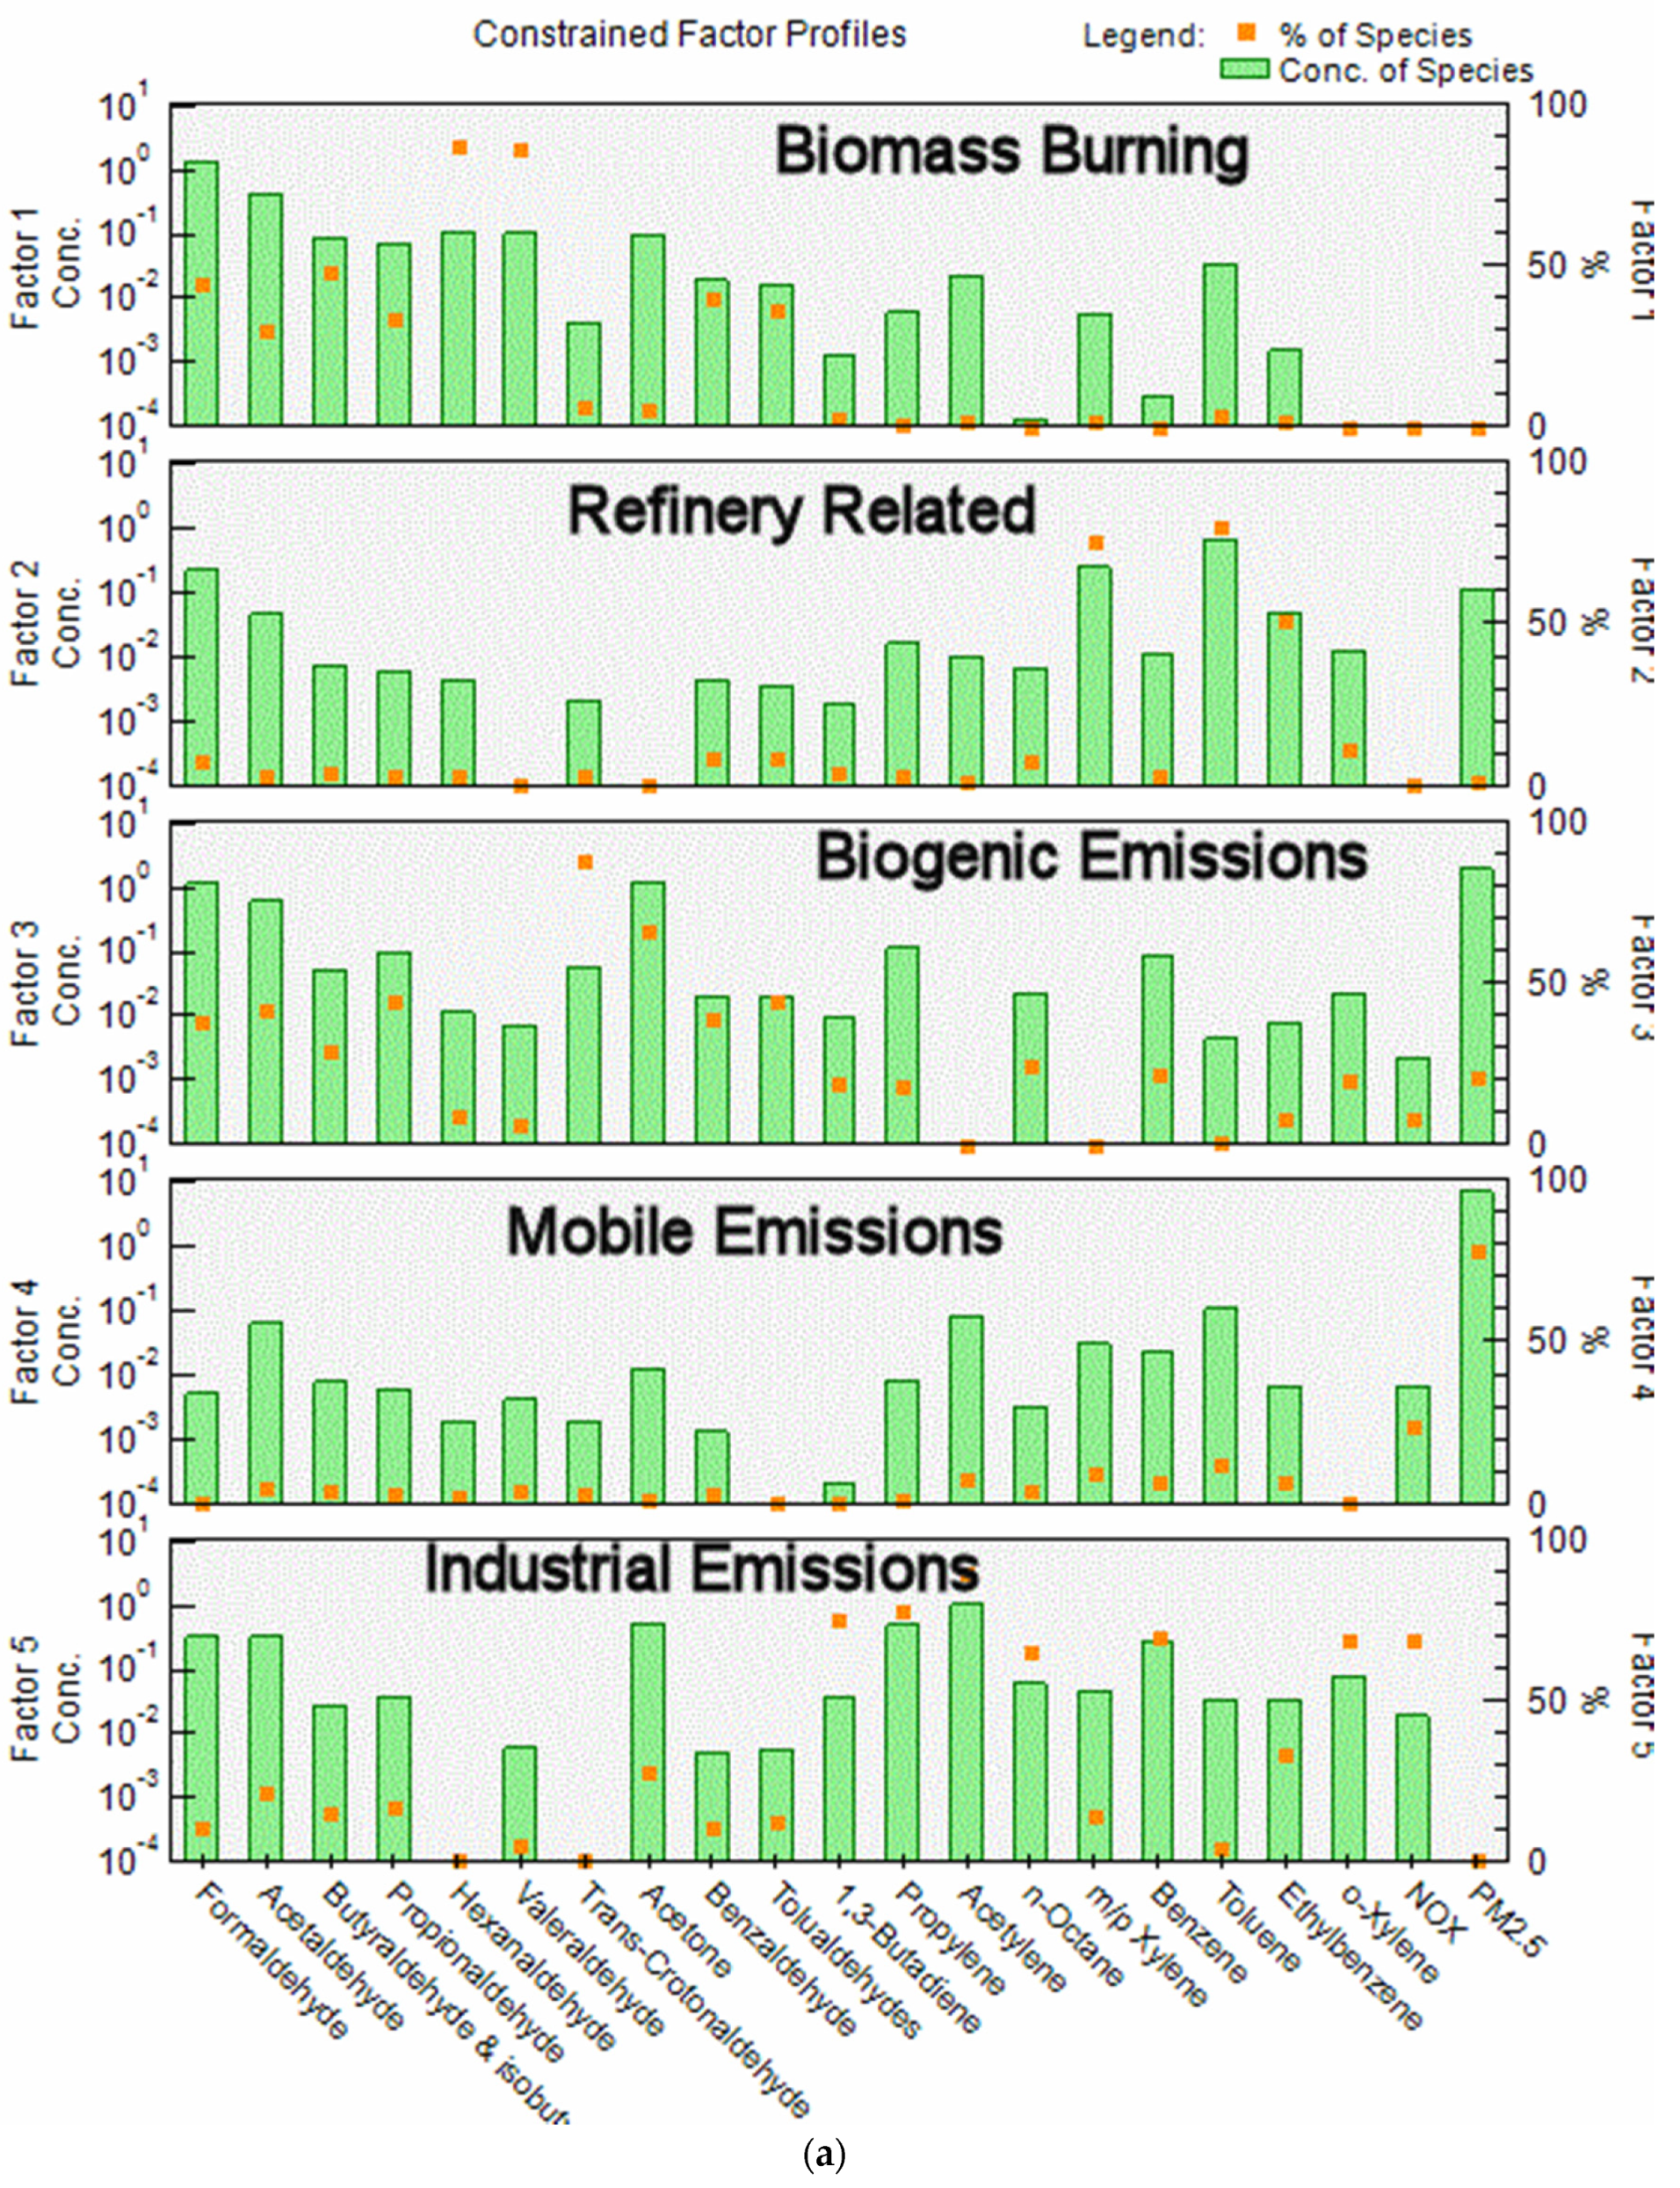
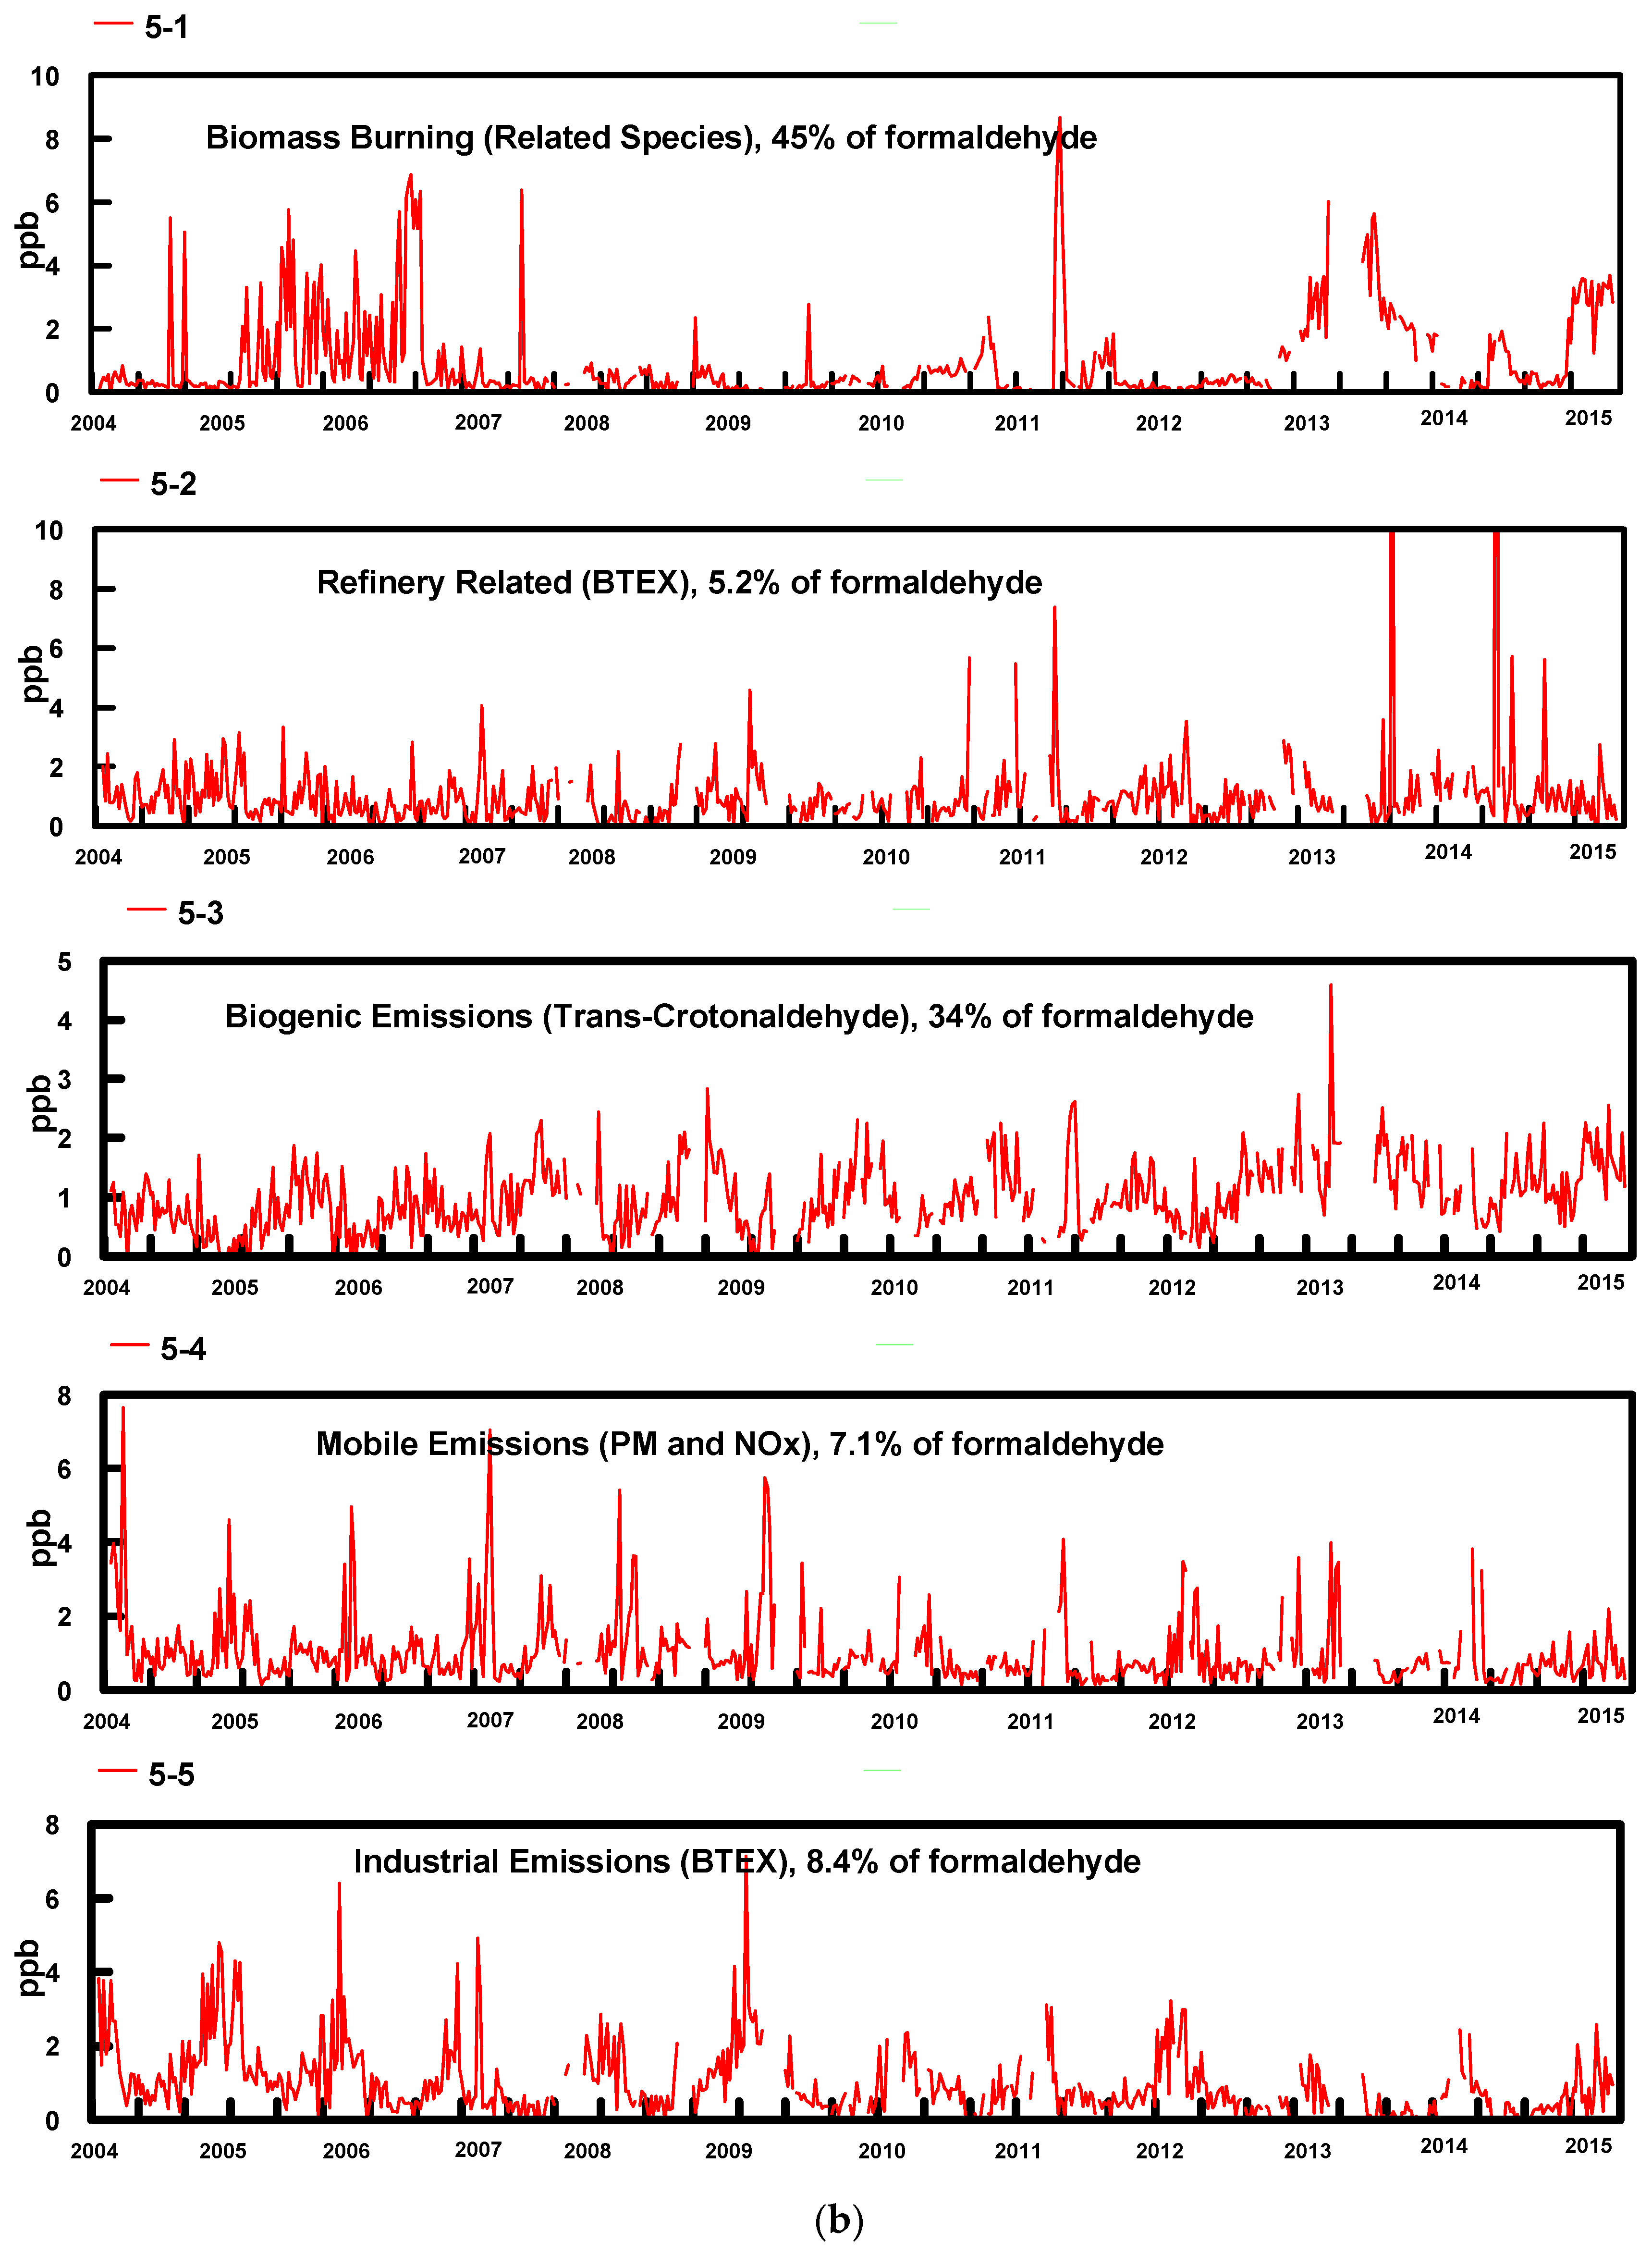
The most reasonable and physically interpretable solution was achieved for 5 factors. The profiles for the five factors (bars, where Conc refers to fraction of each species in a factor in a log plot) resolved from the PMF model and contribution percentages (dots) from each source factor are shown in Figure 3a. Time series factor contributions are presented in Figure 3b.
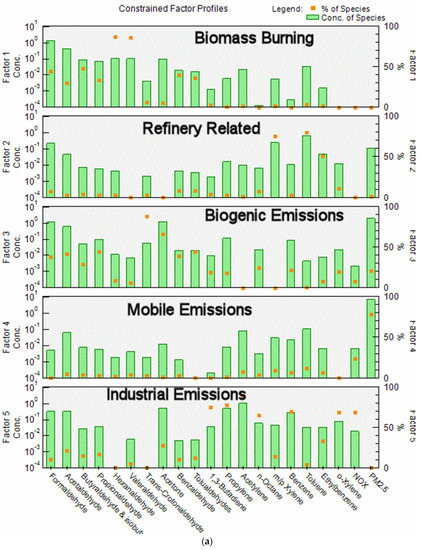
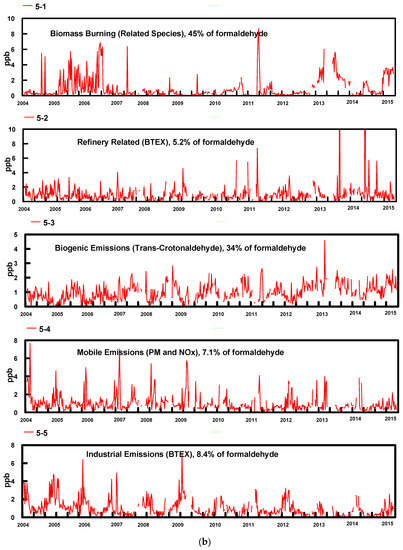
Figure 3.
(a) PMF factor profile graph shows the concentration in ppbv (logarithmic scale) of each species apportioned to the factor (bars) and the percent of each species apportioned to the factor as a red box (red box); (b) Time series of factor contributions showing the start of each year.
The factors were identified as:
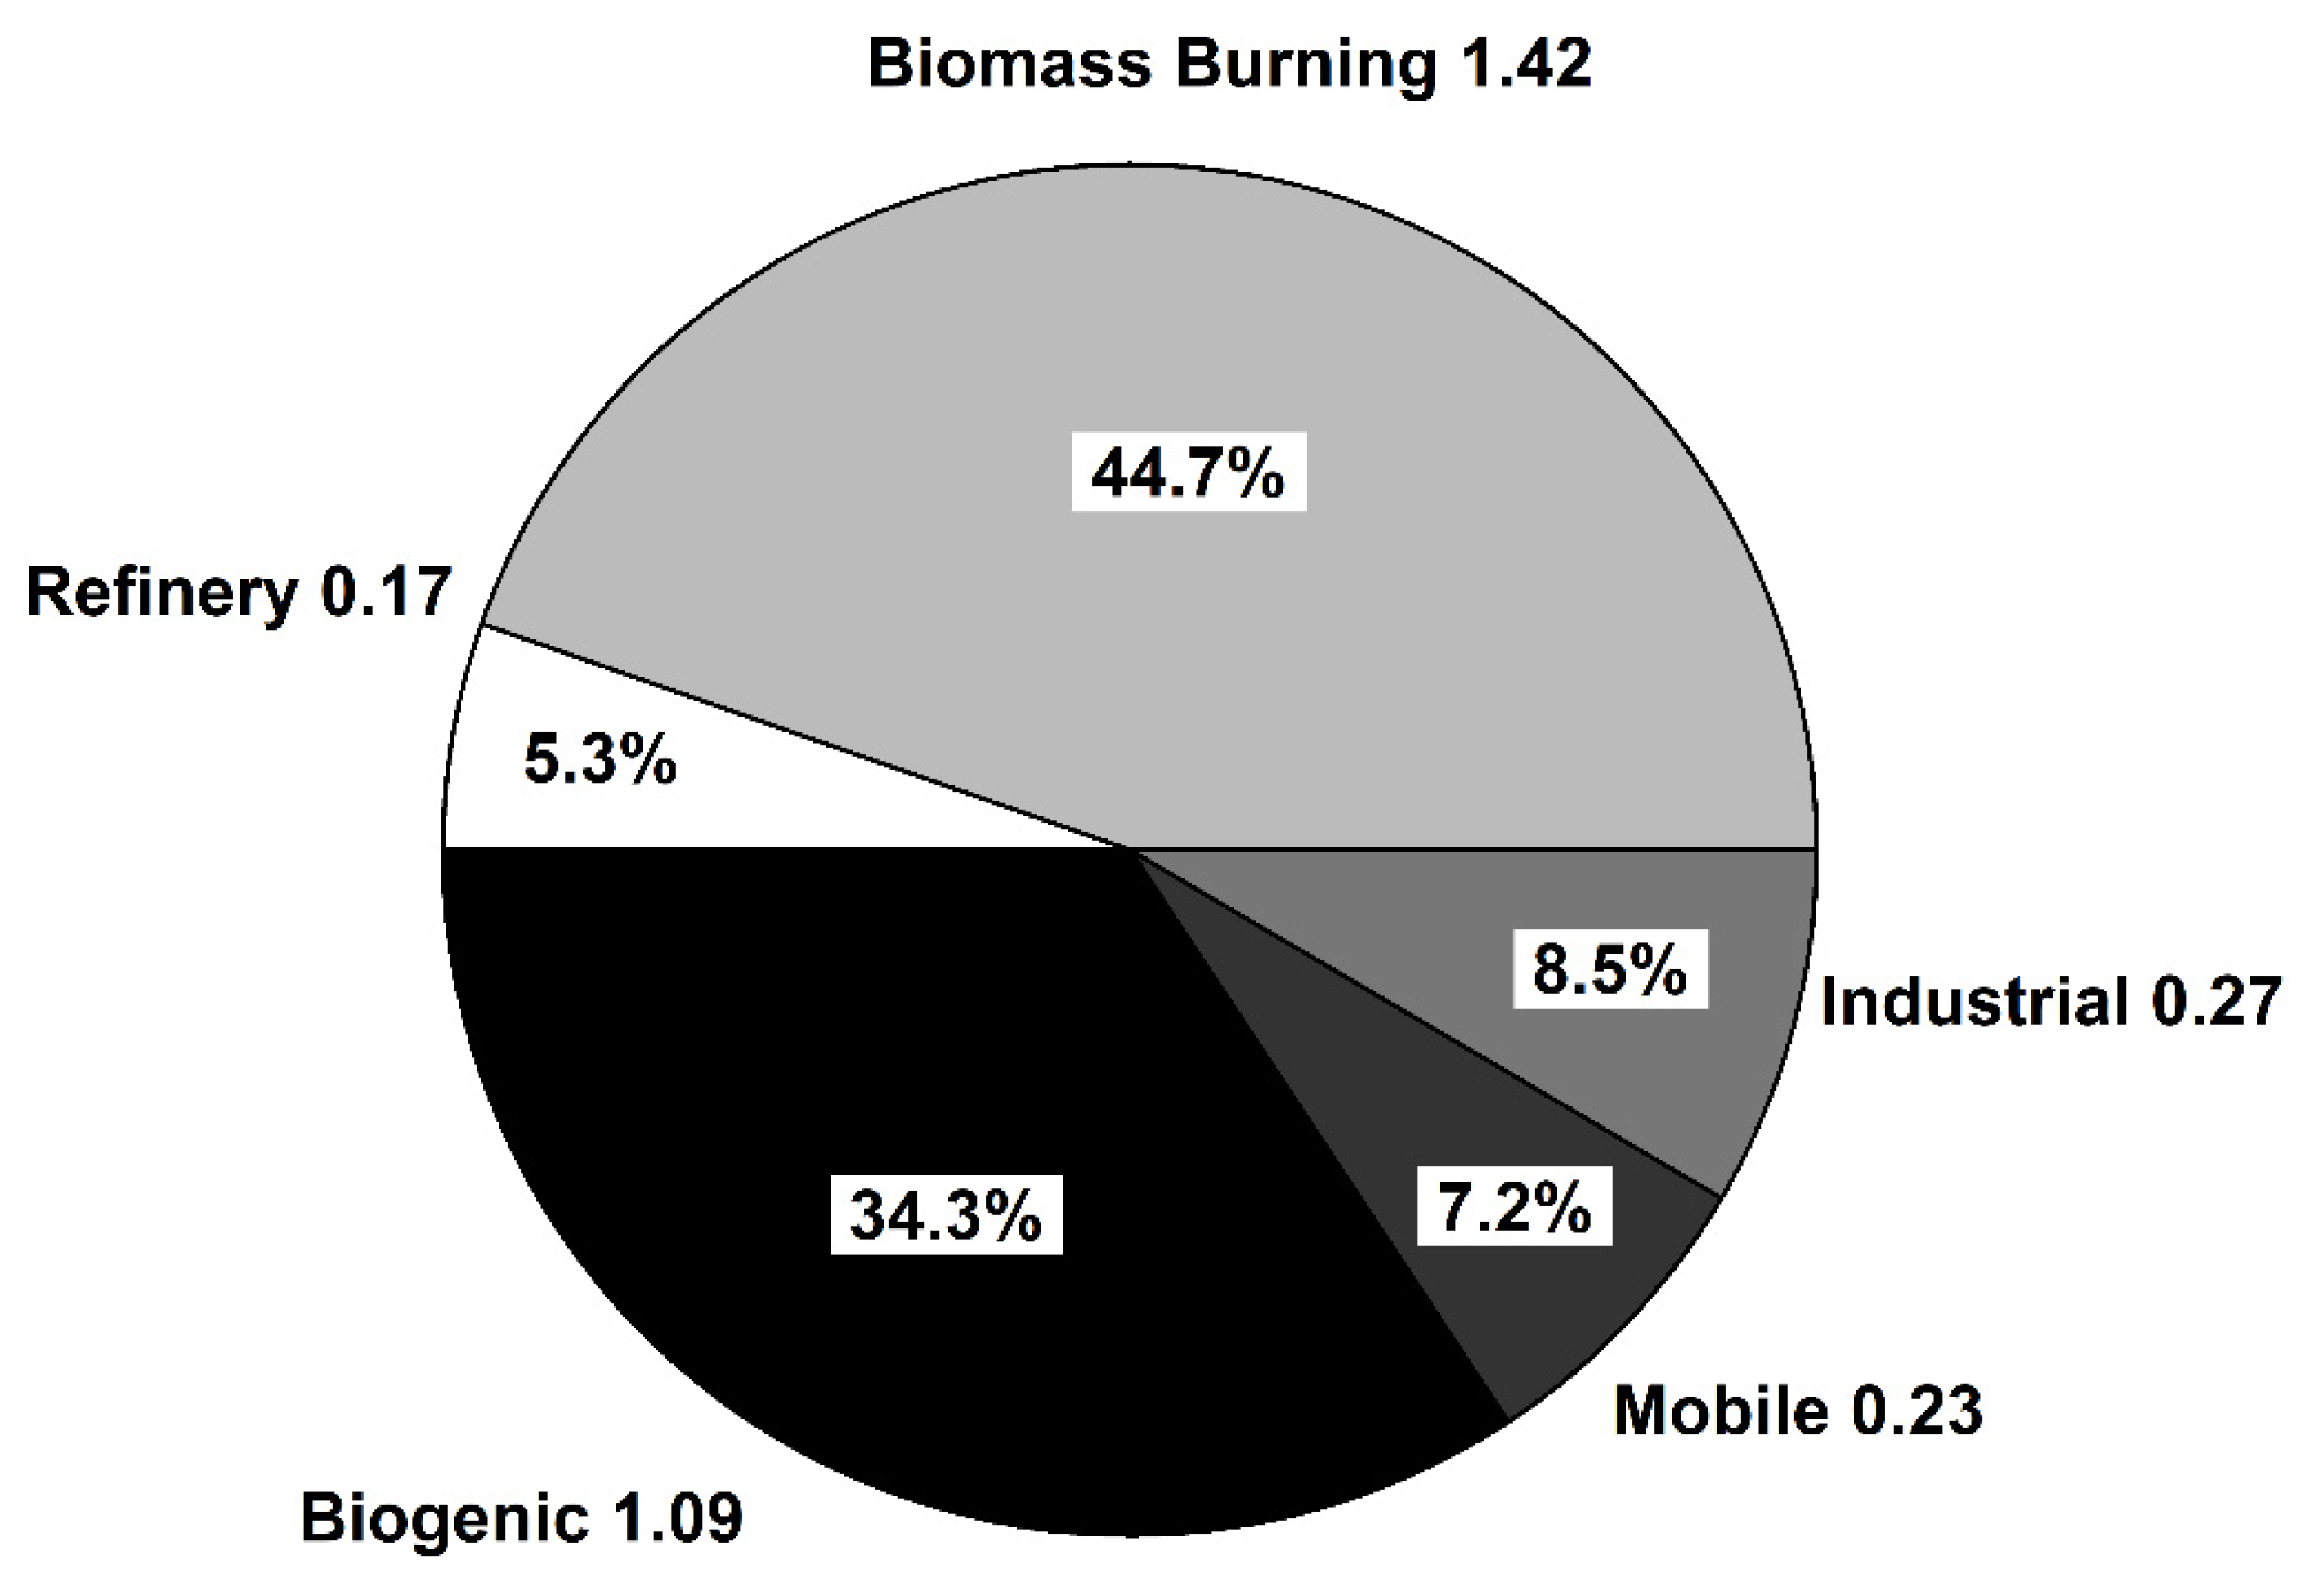
- In Factor 1, the dominant species are formaldehyde, acetaldehyde, butyraldehyde, propionaldehyde and valeraldehyde; these species are related to biomass burning emissions. Biomass burning during the winter may include residential woodburning. Factor 1 was more predominant during the wintertime for most years excluding 2005, 2006 and 2007 when the contributions from this factor were higher during summer. The higher contributions of this factor during these years corresponded to state and regional fires and high PM2.5 levels. This factor contains 45% of the formaldehyde.
- Factor 2 is dominated by high concentrations of BTEX, with 40 to 60% of these compounds being present in this factor. These emissions are consistent with expected emissions from the oil refinery complex to the SSW of the sampling site. This factor contains 5.2% of the formaldehyde.
- Factor 3 is attributed to photochemically produced formaldehyde from biogenic emissions and consists mainly of aldehydes, dominated by acetaldehyde, propionaldehyde, acetone and trans-crotonaldehyde, with 85% of the latter species in this factor. Crotonaldehyde is a product of biogenic emissions, and it is not related to industrial emissions. As expected, contributions were more predominant during summertime. This factor contains 34% of the formaldehyde.
- Factor 4 contains 100% of the PM2.5 and 34% of the NOX, with the contributions from all other species varying from 4 to 15%. We attribute this factor to mobile emissions. It contains 7.1% of the formaldehyde.
- Factor 5, similar to Factor 2 is dominated by high concentrations of BTEX, containing 22 to 65% of these compounds. It also contains 62% of the NOX. We attribute this factor to industrial emissions, possibly related to refinery emissions. This factor contains 8.4% of the formaldehyde. The principal difference between Factor 5 and Factor 2 is that Factor 5 contains 62% of the NOX while Factor 2 contains no NOX. Factor 5 is also much higher in propylene and acetylene. Both factors are probably associated with refinery emissions but reflect contribution from different processes at the refinery. They have been given different names for clarity.
Figure 4 illustrates the PMF estimated source contributions during 2004–2015
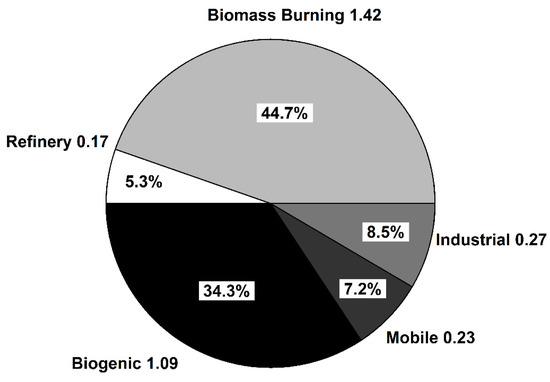
Figure 4.
PMF estimated source contributions during 2004–2015. Values outside the pie chart represent the average absolute concentration (ppbv) of HCHO attributed to each factor.
3.3. Concentration Rose Plots and Wind Direction of Historical Data (2004–2015 Data)
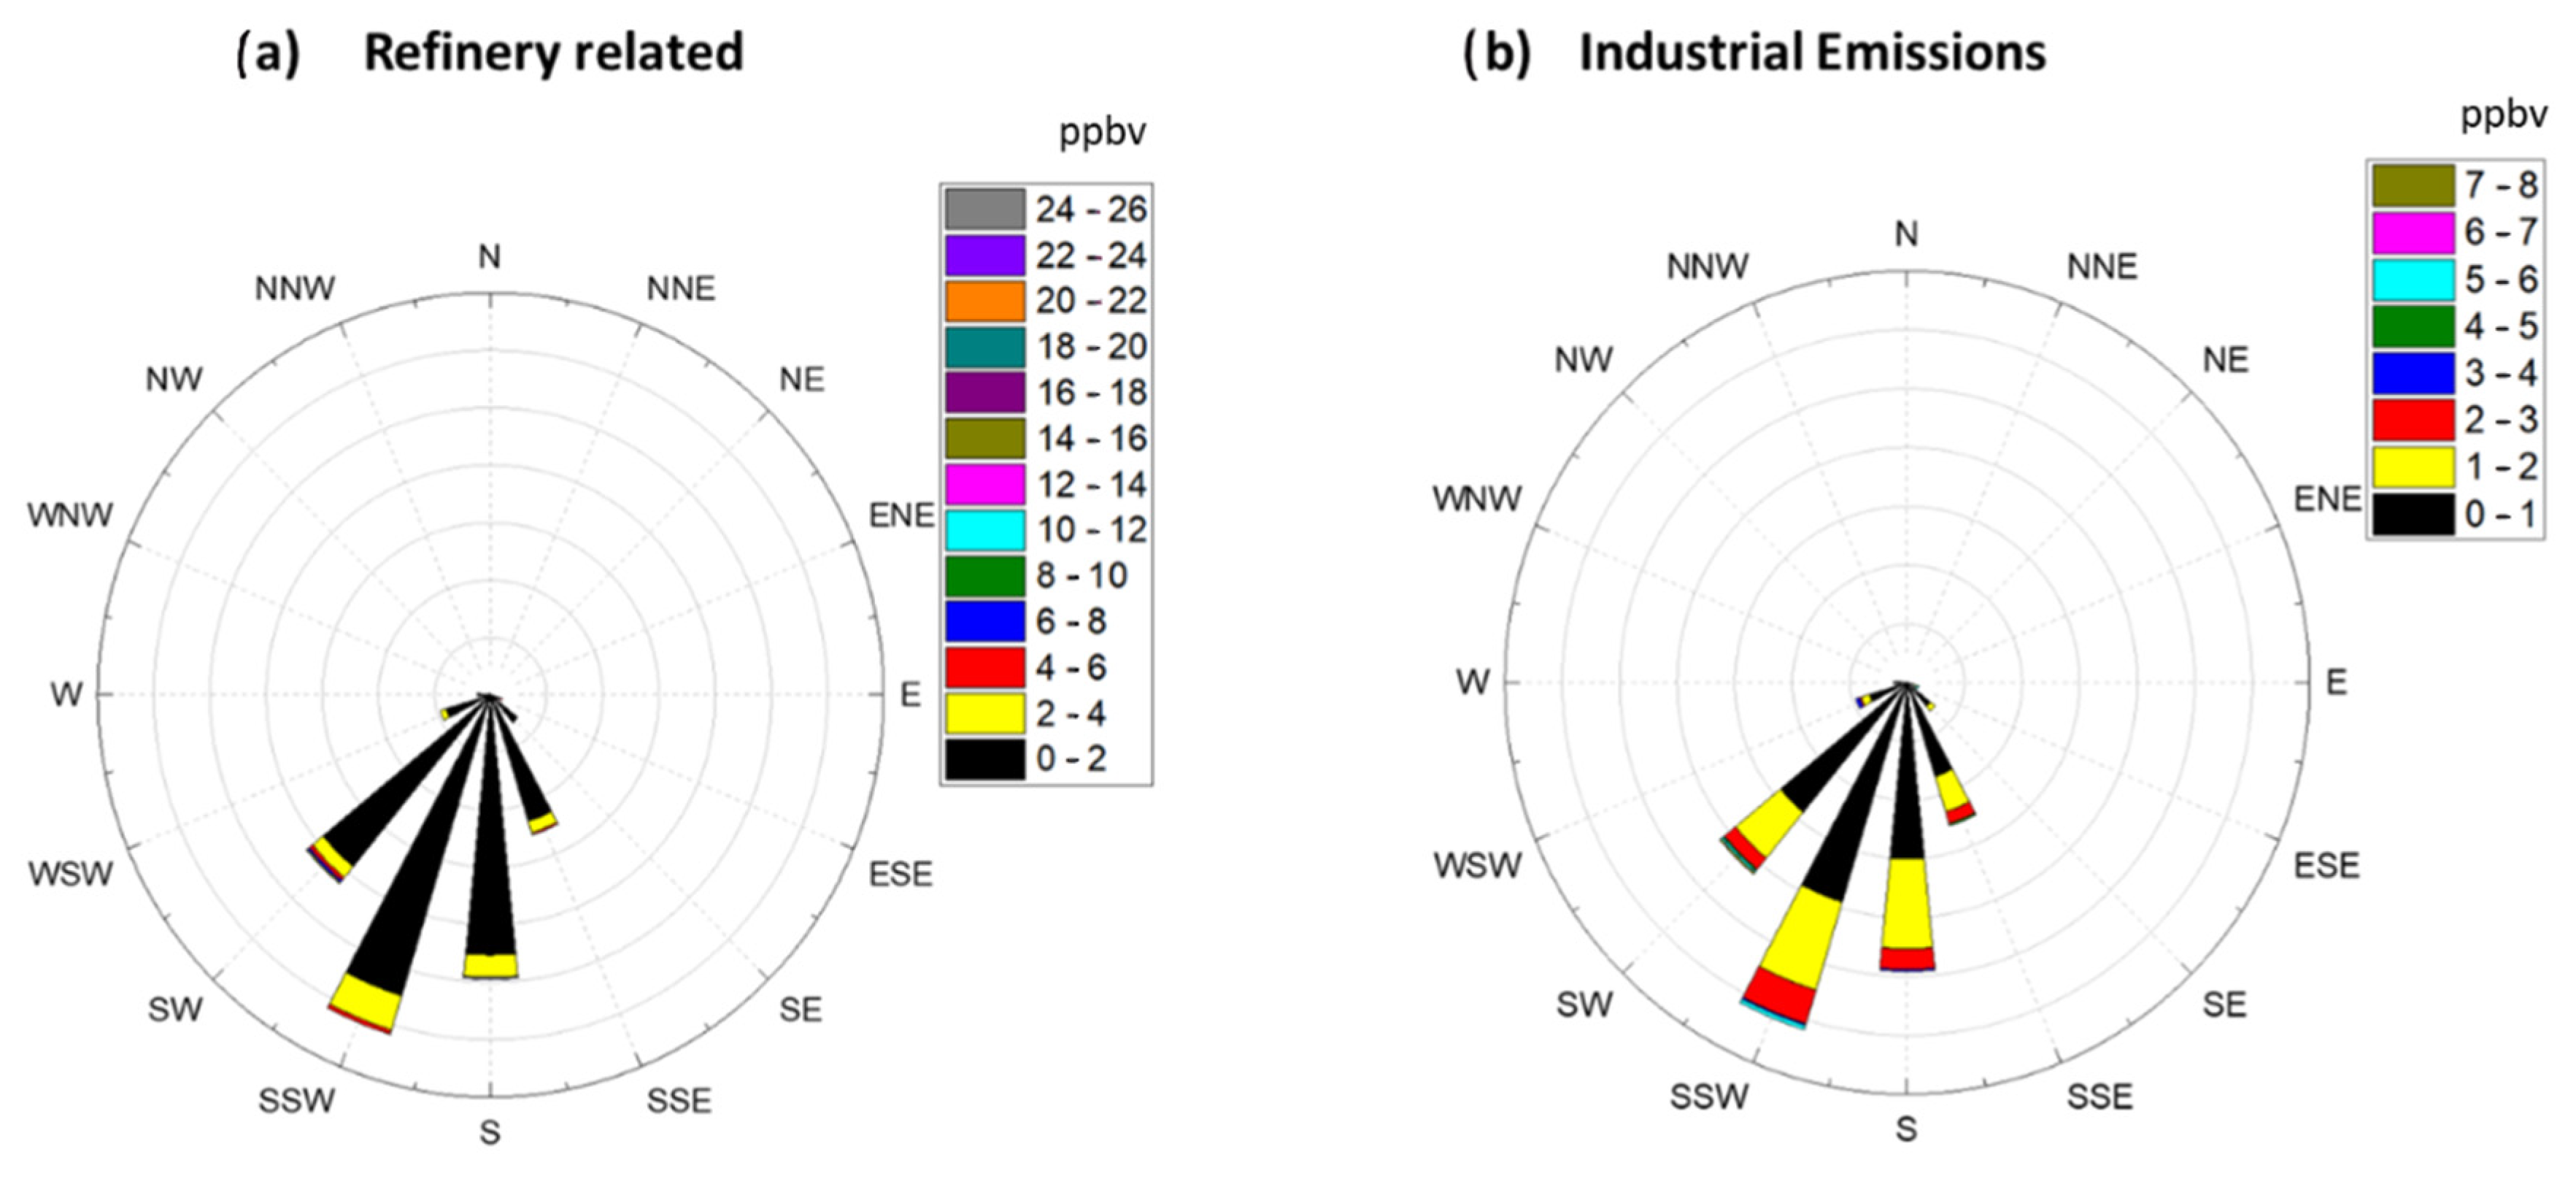
To provide more insight on formaldehyde production sources, a concentration rose plot was generated for Factor 2 (Refinery Related) and Factor 5 (Industrial Emissions). Rose plots were generated by binning the measured concentrations of HCHO attributed to these two factors between 0–26 ppbv for the Refinery related factor and 0–8 ppbv for the Industrial Emission related factor. After binning the HCHO values the corresponding wind direction was plotted to generate Figure 5. Figure 5 shows that both of these factors are primarily present when wind was blowing from the SSW direction. As can be seen in Figure 1, five refineries are located to the SSW of the Bountiful region, and these refineries process a total of 200.5K barrels day−1. The wind rose plots coupled with the results of the PMF analysis suggest that both of these factors are associated with refinery and industrial operations. Together they are responsible for 15.7% of the formaldehyde measured in Bountiful. The results of the PMF analysis of the long-term formaldehyde data set are consistent with that observation and suggests that both Factors 2 and 5 are associated with Refinery processes. Figure 1 shows the amount of VOC’s in tons year−1 (tpy) emitted by each refinery and the other industrial permitted sources located to the SSW of the sampling site. Industrial emissions are all within the 0–70 tpy emission range while the refineries are an order of magnitude larger.
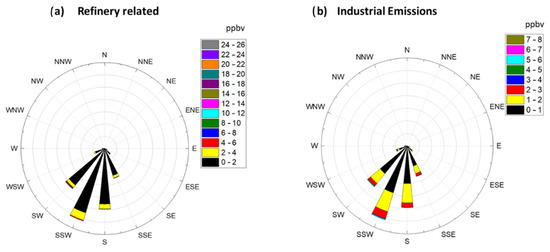
Figure 5.
(a). Concentration rose plot for Factor 2 (Refinery Related) and (b) concentration rose plots for Factor 5 (Industrial Emissions). Values in the legend are in units of ppbv.
3.4. High Temporally Resolved Measurements Results (2019)
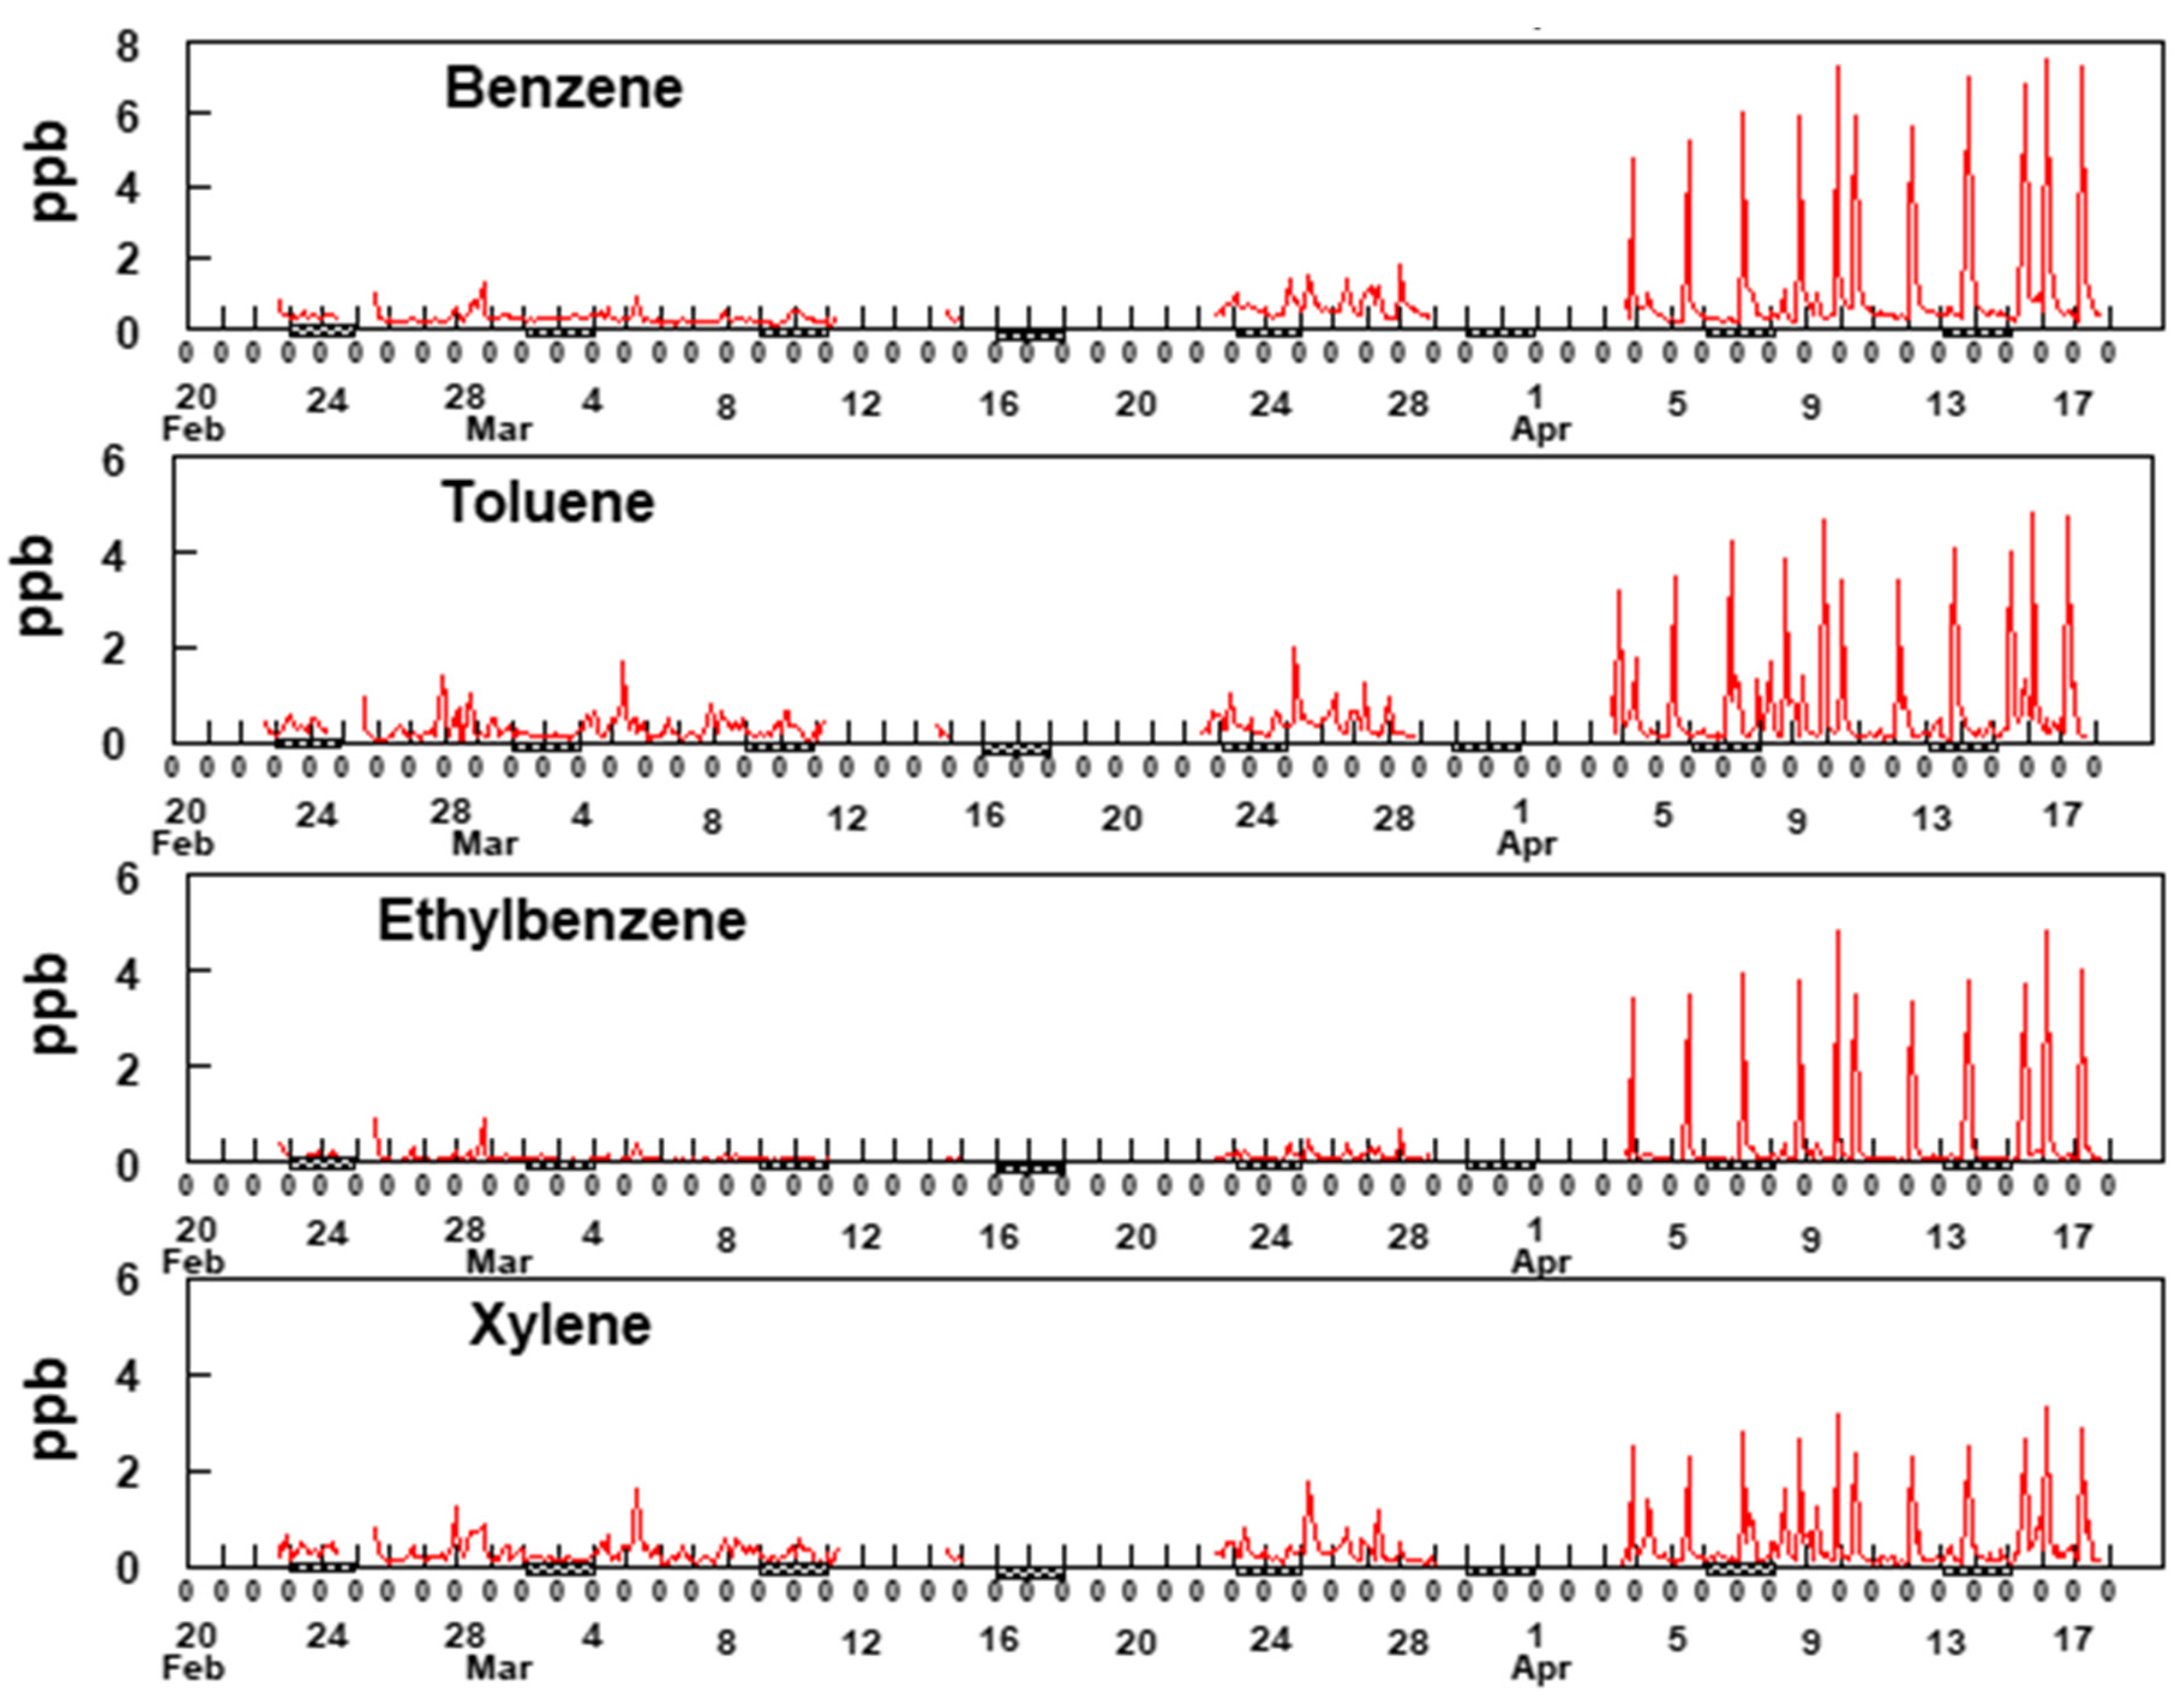
The analysis presented here is based upon two-hour averaged measurements from the GC-FID and BBCEAS. Figure 6 shows two-hour averaged concentrations of BTEX measured between 23 February and 17 April 2019 at the Bountiful, UT site.
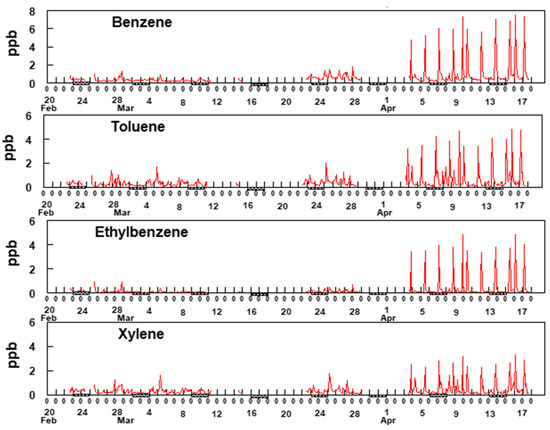
Figure 6.
Two-hour average data for BTEX. Xylene represents a sum of o-,m- and p- xylenes. The hash marks under the x-axis indicates weekends.
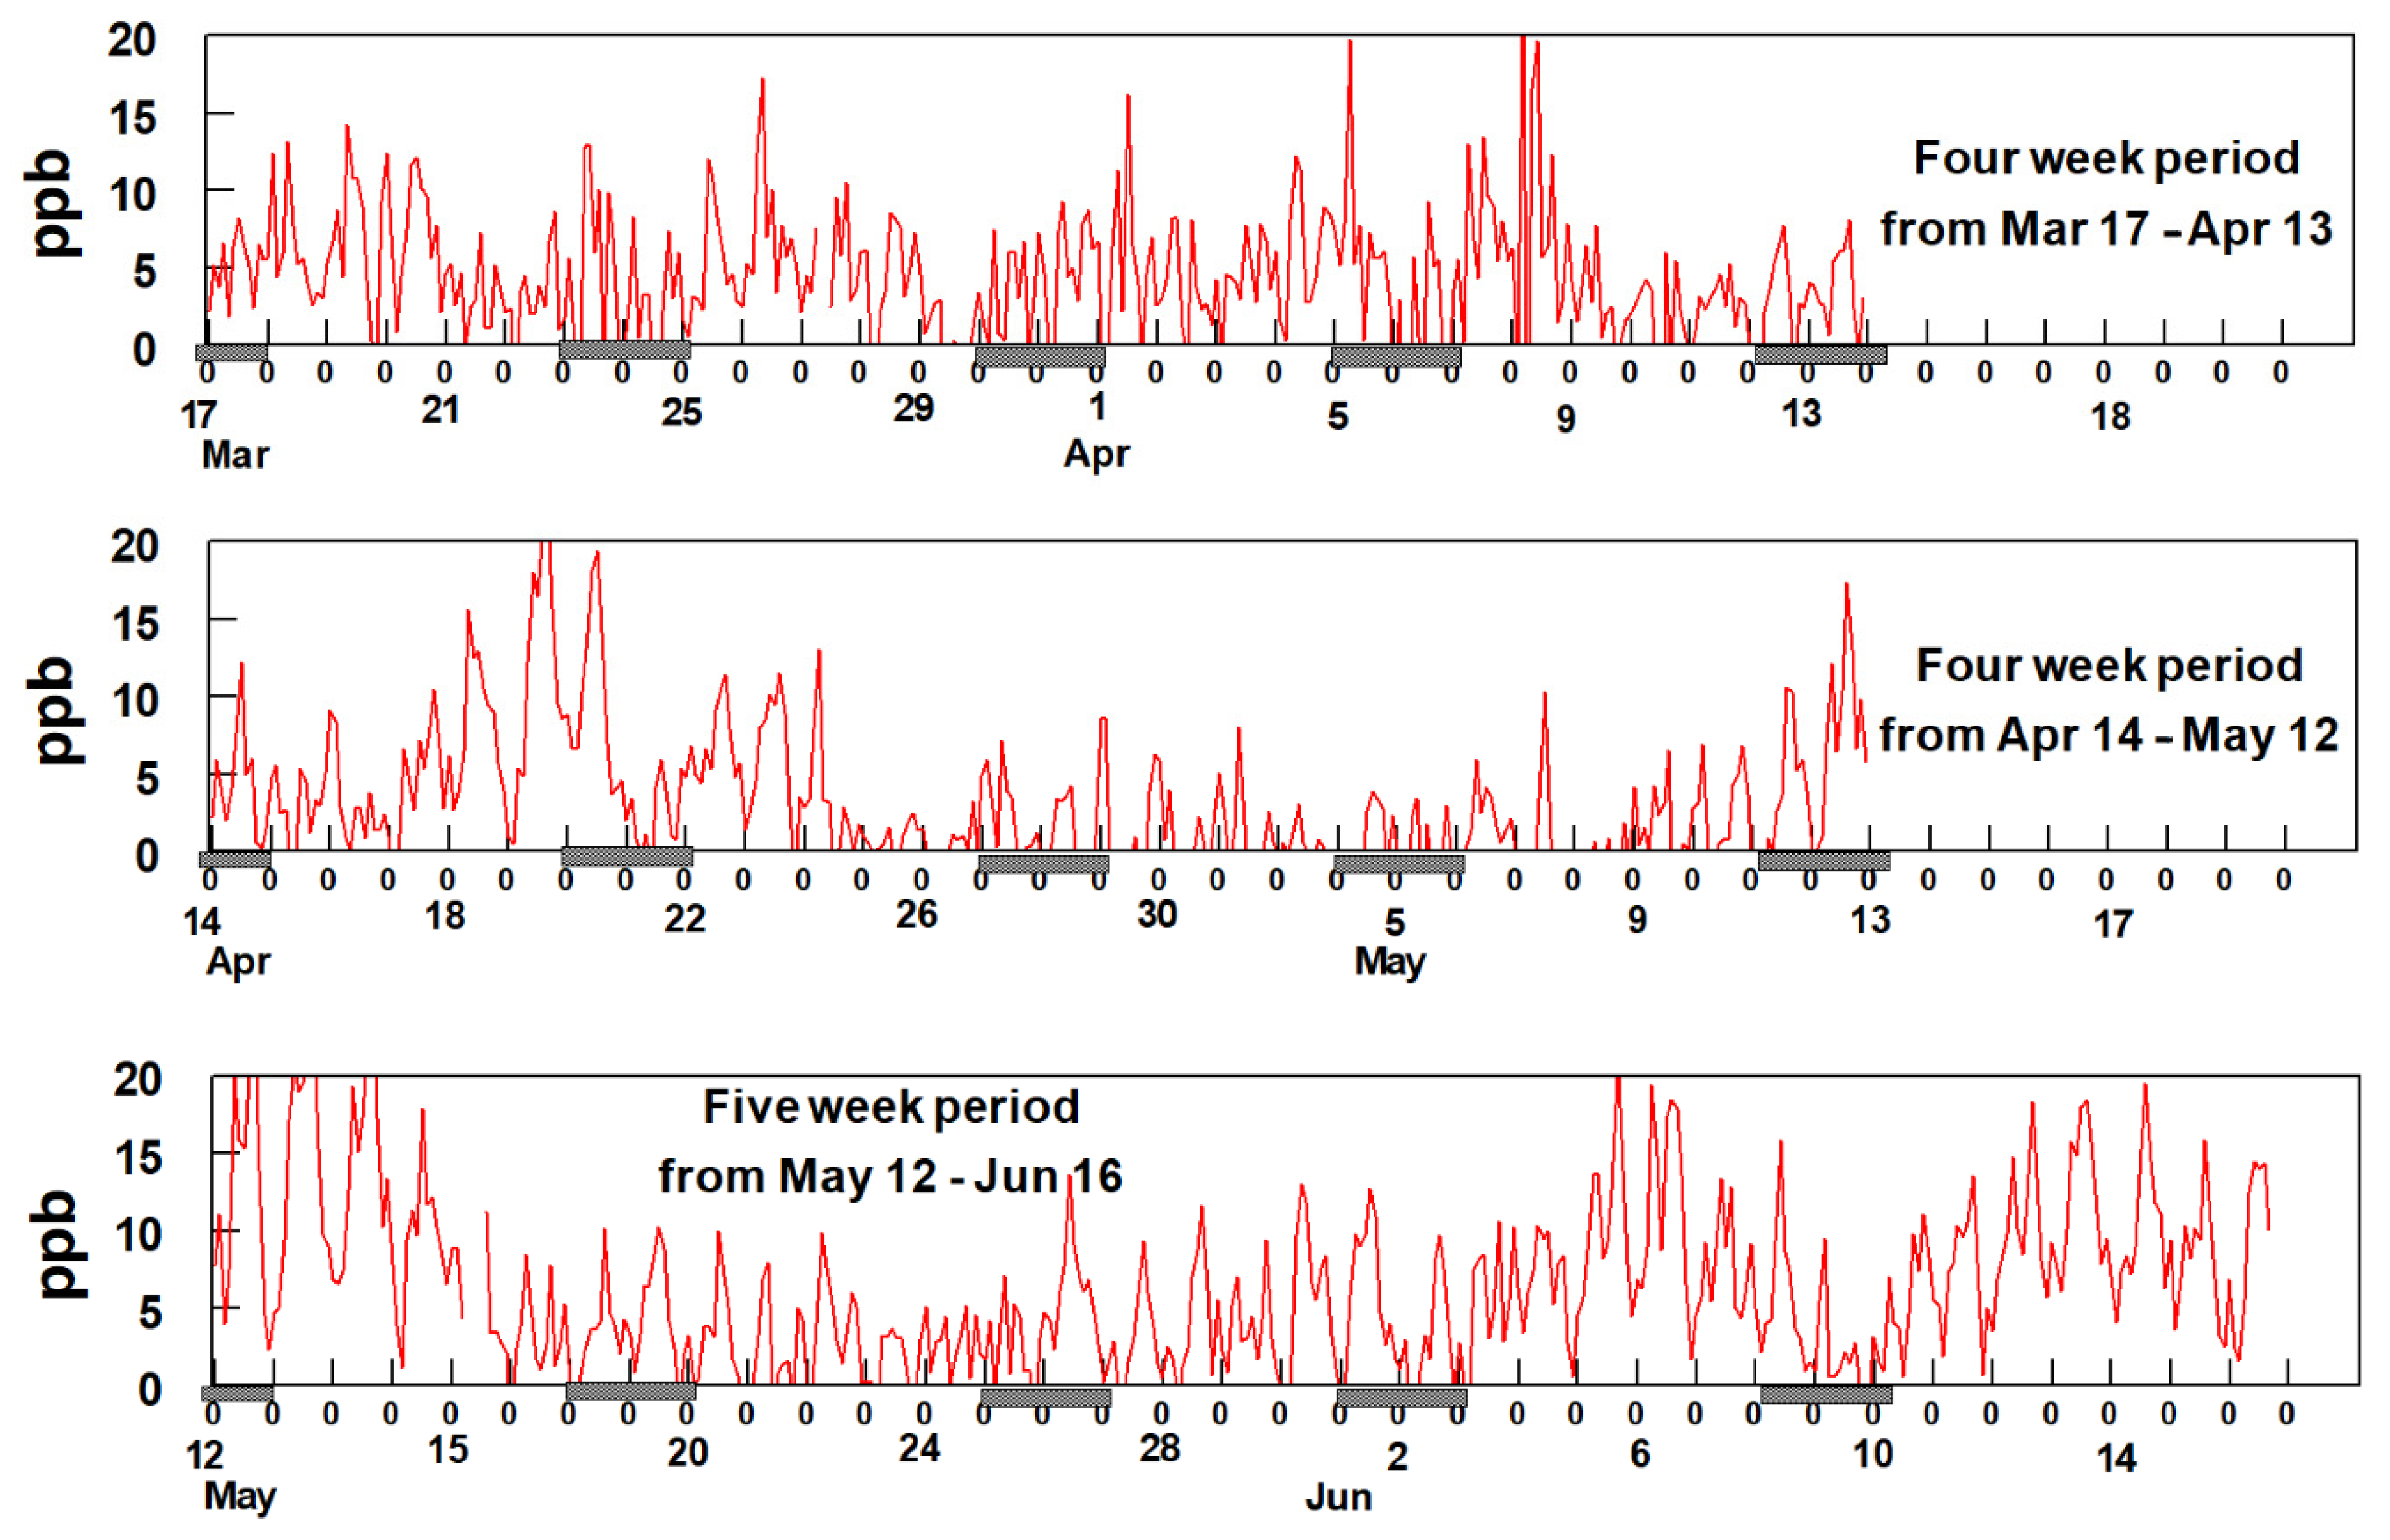
The most notable feature of the data in Figure 6 is the consistency of the time patterns among the BTEX gases, suggesting they are all dominated by a single source, possibly the refineries to the south and southwest of the sampling site. Additionally, notable is the increase in BTEX concentrations starting around 3 April and continuing through 17 April. Comparison of the data shown in Figure 6 with the rose plots shown in Figure 5 provides supporting evidence for the hypothesis that these species are emitted from sources located to the SSW of the sampling site but unfortunately, the reason for the sudden increase in BTEX beginning on 3 April is uncertain. An evaluation of the meteorology between 3 April and 17 April shows no unusual wind patterns compared to earlier time periods. The average wind speed from mid-March through 2 April was 4.9 mph whereas it was 4.3 mph between 3 April and 17 April. This suggests there was no major change in the wind speeds during and before the sudden increase in BTEX concentrations. Additionally, analysis of the wind direction shows that predominately the wind blowing from the SSW direction between 23 March and 17 April. Figure 7 shows two-hour averaged concentrations of formaldehyde over the duration of the study.
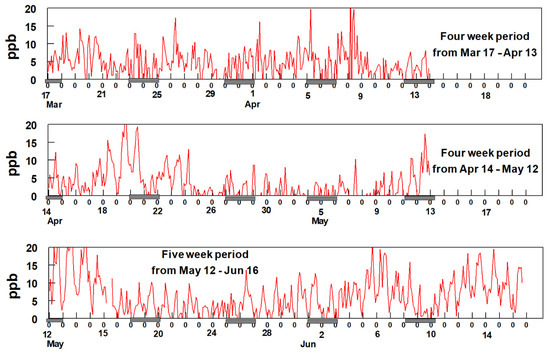
Figure 7.
(a) shows two-hour average data for formaldehyde from 17th of March to 13th of April (b) 14th of April to 12th of May and (c) 12th of May till 16th of June. The hash marks under the x-axis indicates weekends.
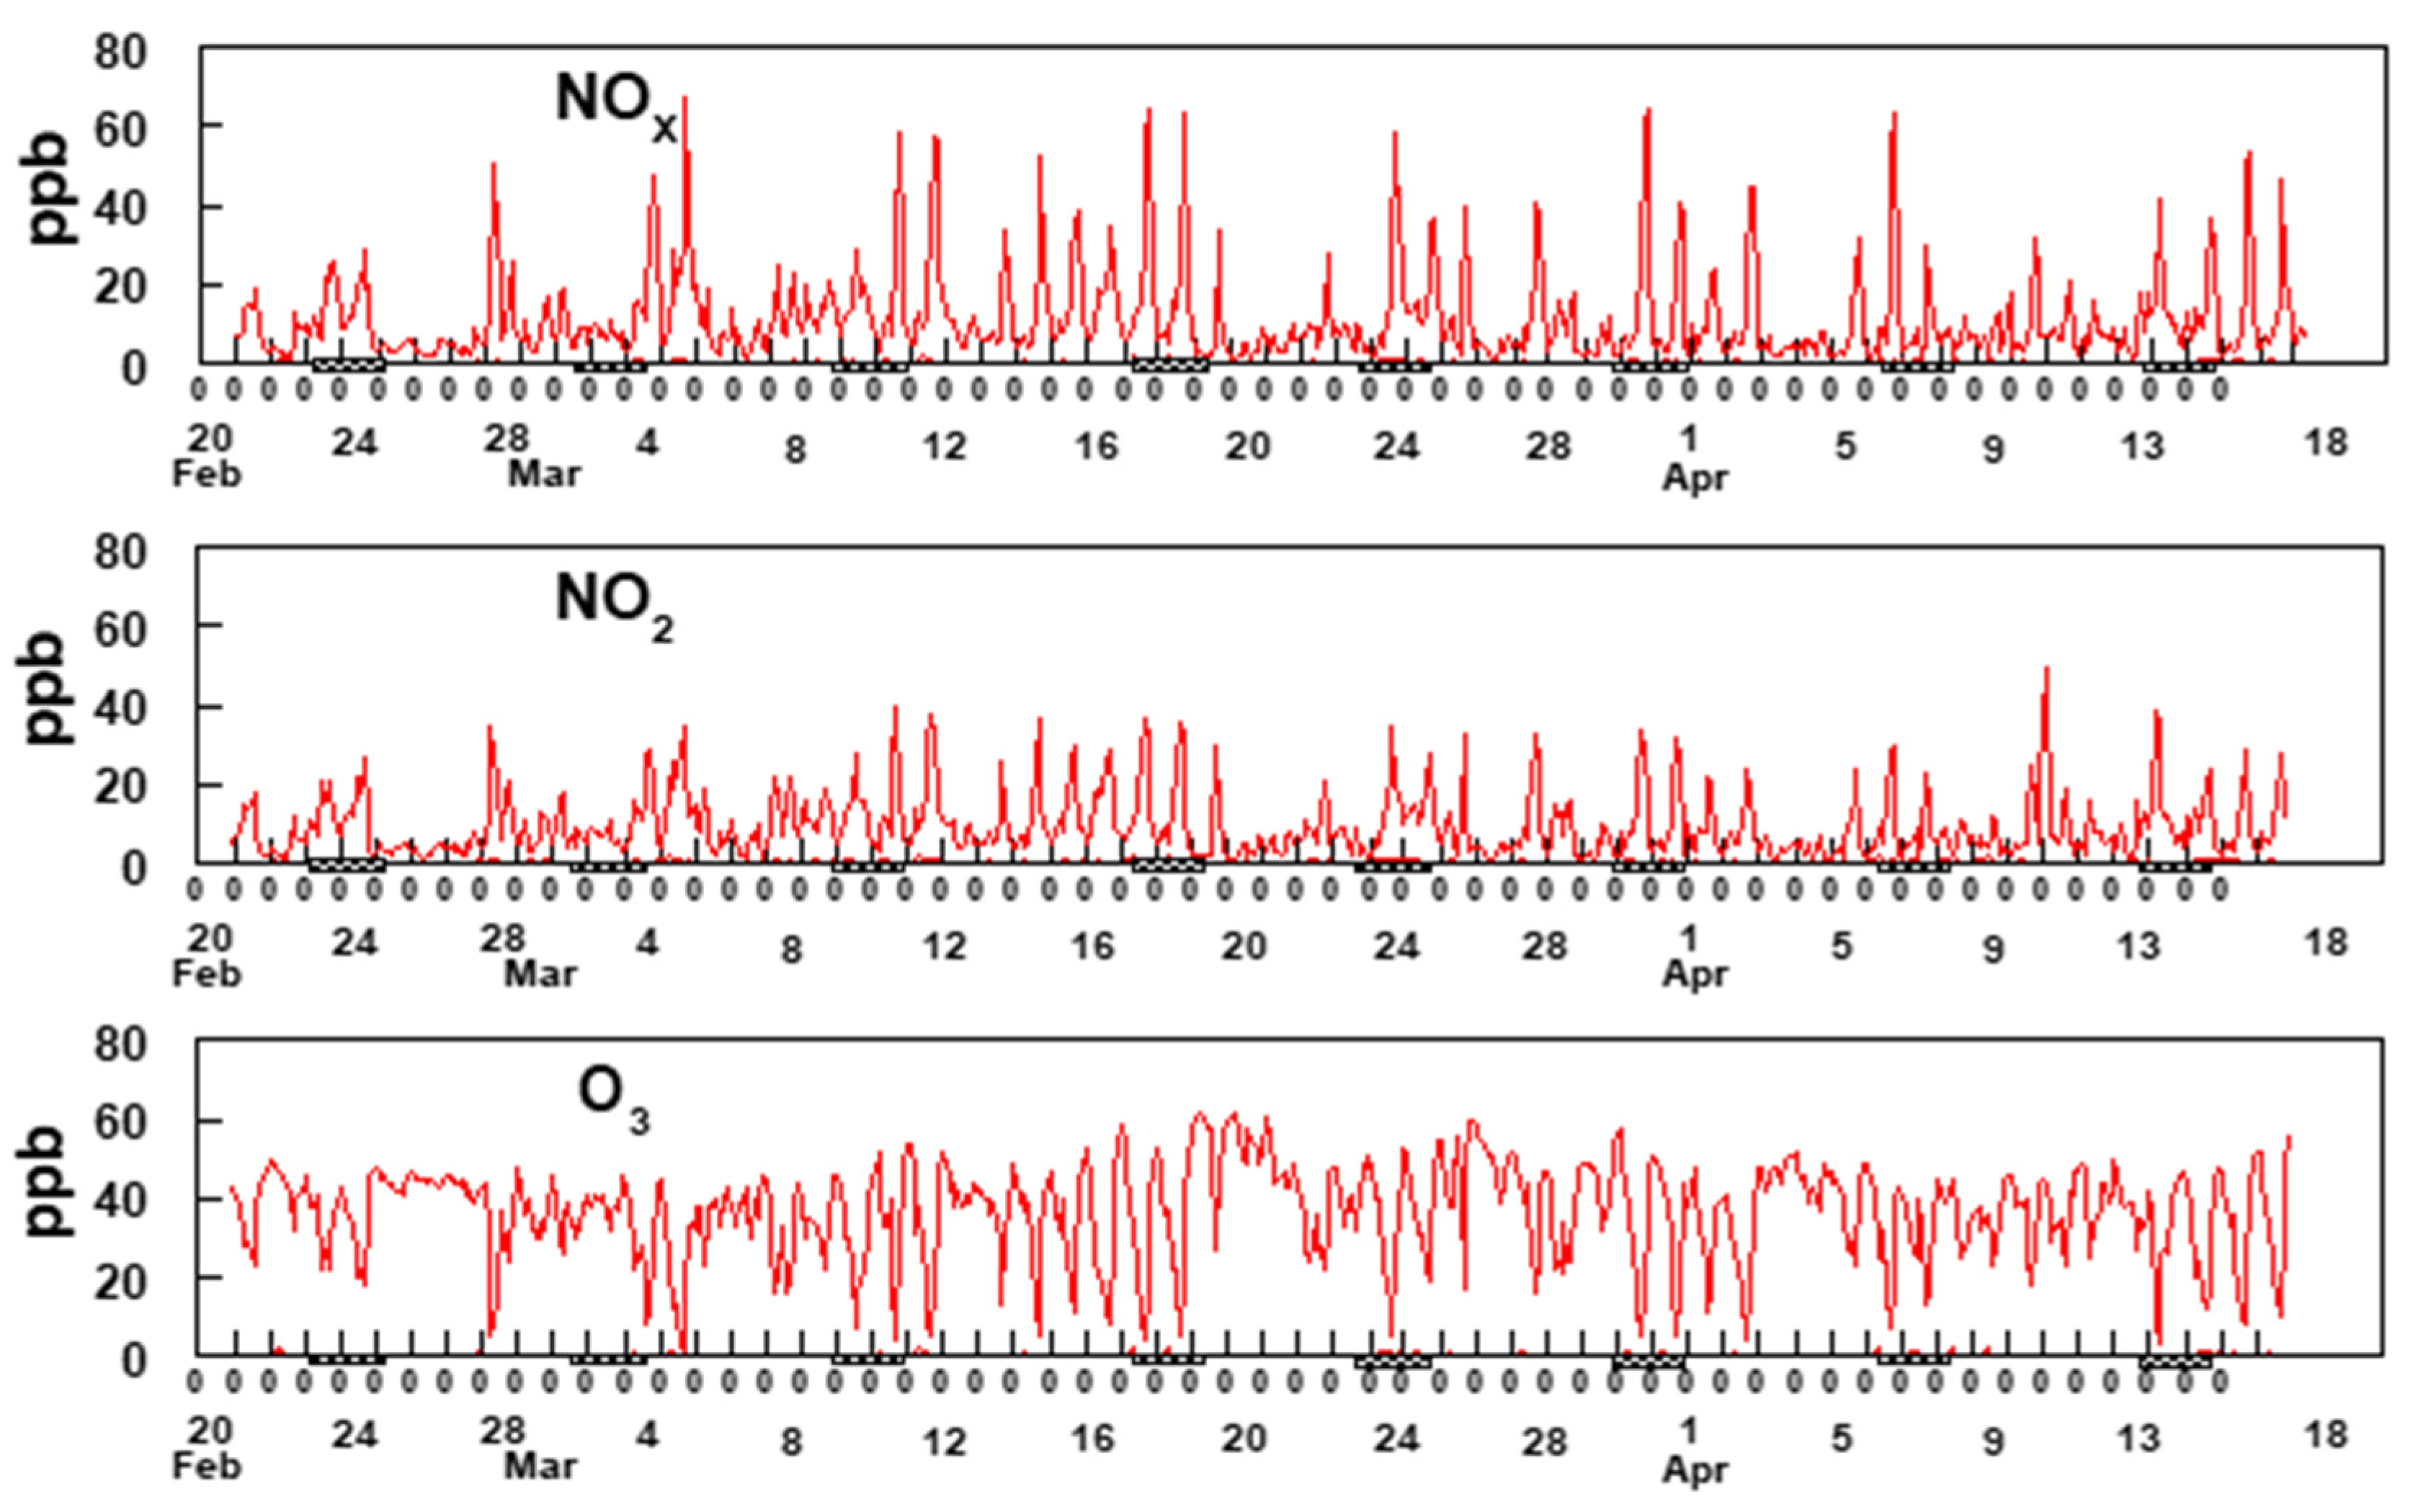
The oxides of nitrogen play a major role in the mechanism for the production of O3 and HCHO, which is explained in Section 3.6. Two-hour averaged concentrations of NOx, NO2 and O3 are shown in Figure 8.
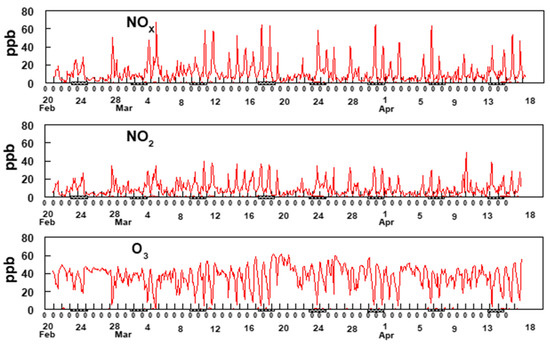
Figure 8.
Two-hour average data for NOx, NO2, and O3. The hash marks under the x-axis indicates weekends.
3.5. Relationship between Formaldehyde and BTEX
Formaldehyde has both primary and secondary sources in the atmosphere. Secondary gas phase HCHO is formed from free radical reactions with a wide variety of VOCs. The most rapid secondary formation is expected to be formed from the photooxidation of ethene, propene and larger terminal alkenes, but HCHO is also formed, albeit more slowly, from the oxidation of alkanes and aromatic compounds.
PMF analysis of the historical data shows that a combination of refinery and industrial emissions account for 13.8% of the HCHO concentrations measured in the Bountiful region (Figure 5). Since HCHO production from the photooxidation of BTEX is highly variable and depends on the solar flux, ambient temperature, concentration of BTEX and OH radical and meteorological conditions such as wind speed and wind direction, we do not expect the appearance of a formaldehyde peak to routinely follow the appearance of a day-time benzene peak.
A box model using the Master Chemical Mechanism v3.2 and the AtChem online portal (version 1), an open-source box model for the Master Chemical Mechanism was used to assess the lifetime of fossil fuel related emissions (benzene, toluene, ethylbenzene, xylenes, ethene, propene) with respect to the time scale of transport from the refineries to the measurement site [27,28,29,30,31]. The model was initiated with 2 × 10¹⁰ molecules cm−3 (1ppb) of NO. The hydroxyl radical concentration was held constant at 5 × 10⁶ molecules cm−3 and the model was run for 8-h to roughly simulate the evolution of a plume reacting with OH. Photolysis and other loss processes were not considered. Supplemental Figure S2a shows that benzene was the slowest to react, as expected from its reaction rate constants, and the results showed that it can serve as a tracer for the refineries if present in the emission plume. All the other compounds modeled reacted faster, with ethene and propene degrading the most rapidly. Supplemental Figure S2b, shows that HCHO is formed as a first-generation oxidation product from both ethene and propene in contrast to the aromatic compounds which do not generate HCHO until the second or more-generation products. In the time series comparing benzene and HCHO (Figure 9), when benzene and HCHO are observed together, HCHO is predominantly not from the oxidation of benzene, but from co-emitted species which likely correlate less because a significant portion of them will have reacted away depending on the transport time. Likewise, early morning peaks in benzene would not be expected to correlate with HCHO since OH production will not have been initiated yet and consequently HCHO will not have been produced. Additionally, the plume composition may change to contain less benzene but even a different mixture of hydrocarbons will still produce HCHO that peaks in the middle of the day along with O3 concentrations. As BTEX and HCHO do not correlate well in time, the Bountiful region does not appear to be primarily impacted from the photooxidation of BTEX to form HCHO but that the formaldehyde observed in this region is most likely from the photooxidation of refinery emitted gases with faster photooxidation reaction times like ethene and propene. Unfortunately, neither ethene nor propene were measured in this study.
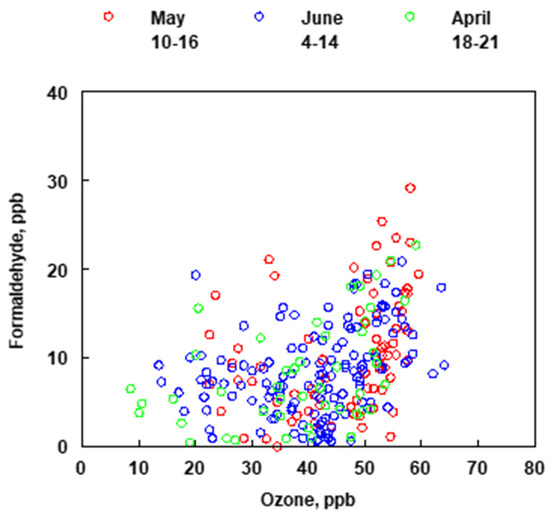
Figure 9.
Comparison of the concentrations of ozone and formaldehyde for months of April, May and June (2019).
3.6. Relationship between Formaldehyde and O3
As detailed previously, the formation of HCHO in the atmosphere from the photooxidation of VOCs is complex and dependent on the VOC of interest. Previous work has shown a strong correlation between the emissions from refineries and O3 and HCHO production in air masses located downwind. [15] The mechanism that is primarily responsible for the production of tropospheric ozone can share some of the same elementary reactions that produce HCHO. As such, if secondary formation of HCHO involves some of the same reactions producing O3 there should be a correlation observed between these two species. Reactions (1)–(5) define the well-established mechanism for production of tropospheric O3 from any hydrocarbon (RH) in the presence of NOx. [32].
RH + ·OH → R· + H2O
R· + O2 → RO2
RO2· + NO → NO2 + RO·
NO2 + hv → NO + O→
O + O2 → O3
Reactions (6)–(9) describe one mechanism for production of HCHO from the photooxidation of C2H2 (ethylene), frequently the highest concentration VOC emitted by a refinery, and shares some of the same elementary reactions described by the mechanism that produces tropospheric O3, reactions (1)–(5).
C2H2 (RH) + ·OH → HOCH2CH2 (R·)
HOCH2CH2 (R·) + O2 → HOCH2HCHO2 (RO2·)
HOCH2HCHO2 (RO2·) + NO → HOCH2HCHO (RO·) + NO2
HOCH2HCHO (RO·) + O2 → HO2· + 2 HCHO
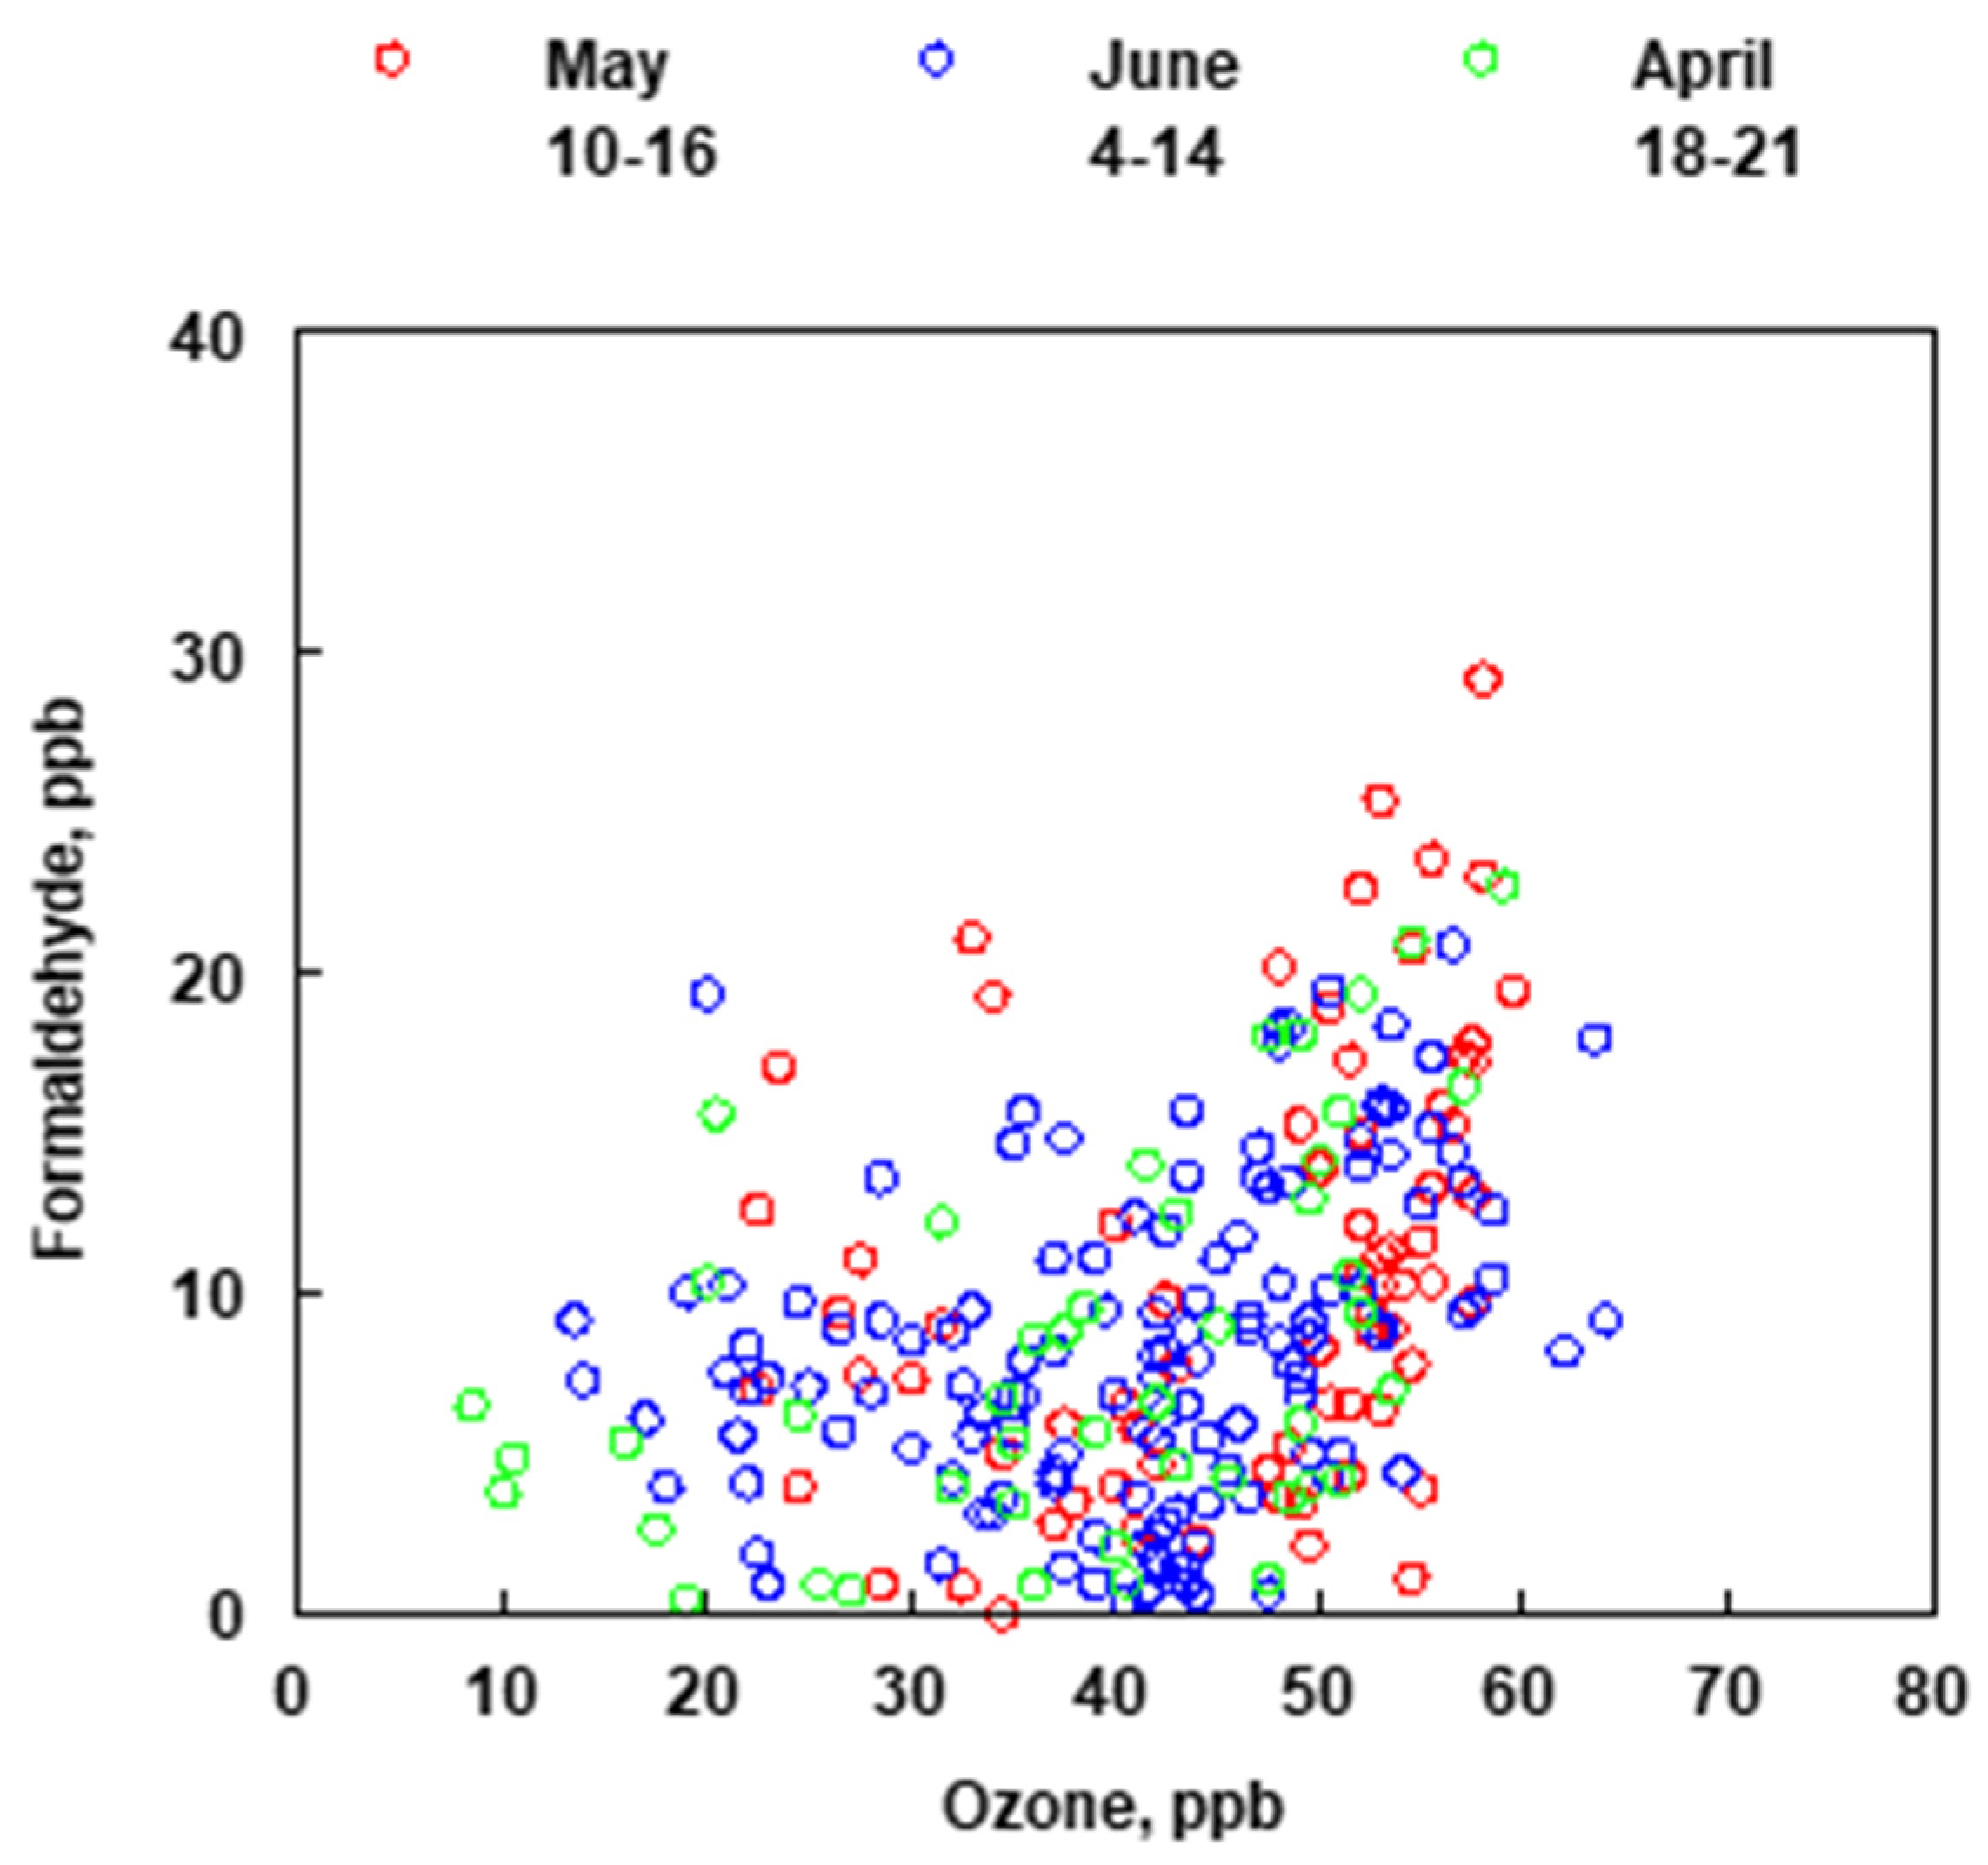
Elementary reactions (2), (3), (4), and (7), (8) and (9) are the same in the two mechanisms. If the hydrocarbon that is being photooxidized is something other than C2H2, for example BTEX, the mechanism that describes the oxidation has several additional reactions that delay the formation of HCHO. However, because of the relative high concentration of hydrocarbons that are typically emitted by refineries and react in a similar fashion to produce tropospheric ozone it is expected that a correlation between O3 and HCHO may be observed. Figure 9 shows the relationship between measured concentrations of O3 and HCHO at the Bountiful sampling site for the months of April, May and June (2019).
It has been observed that NO can play an important role in the mechanism for the production of O3 and HCHO (see reactions (3) and (8)), but HCHO can also be formed in the absence of NO. When NO concentrations are low, peroxy radicals (RO2·) can react with other RO2· radicals to produce alkoxy radicals (RO·), a product similar to what are produced by the reaction of RO2· + NO (reaction (8)). This leads to similar product branching ratios and products formed as under high NOx conditions, but without O3 formation because the needed NO is missing from the mechanism defined by reactions (1)–(5), specifically reaction (3). While the HCHO formed might be reduced because other pathways (e.g., reaction of RO2· with RO·) may start to contribute, there will still be HCHO formed while O3 formation catalyzed by NO will be shut off.
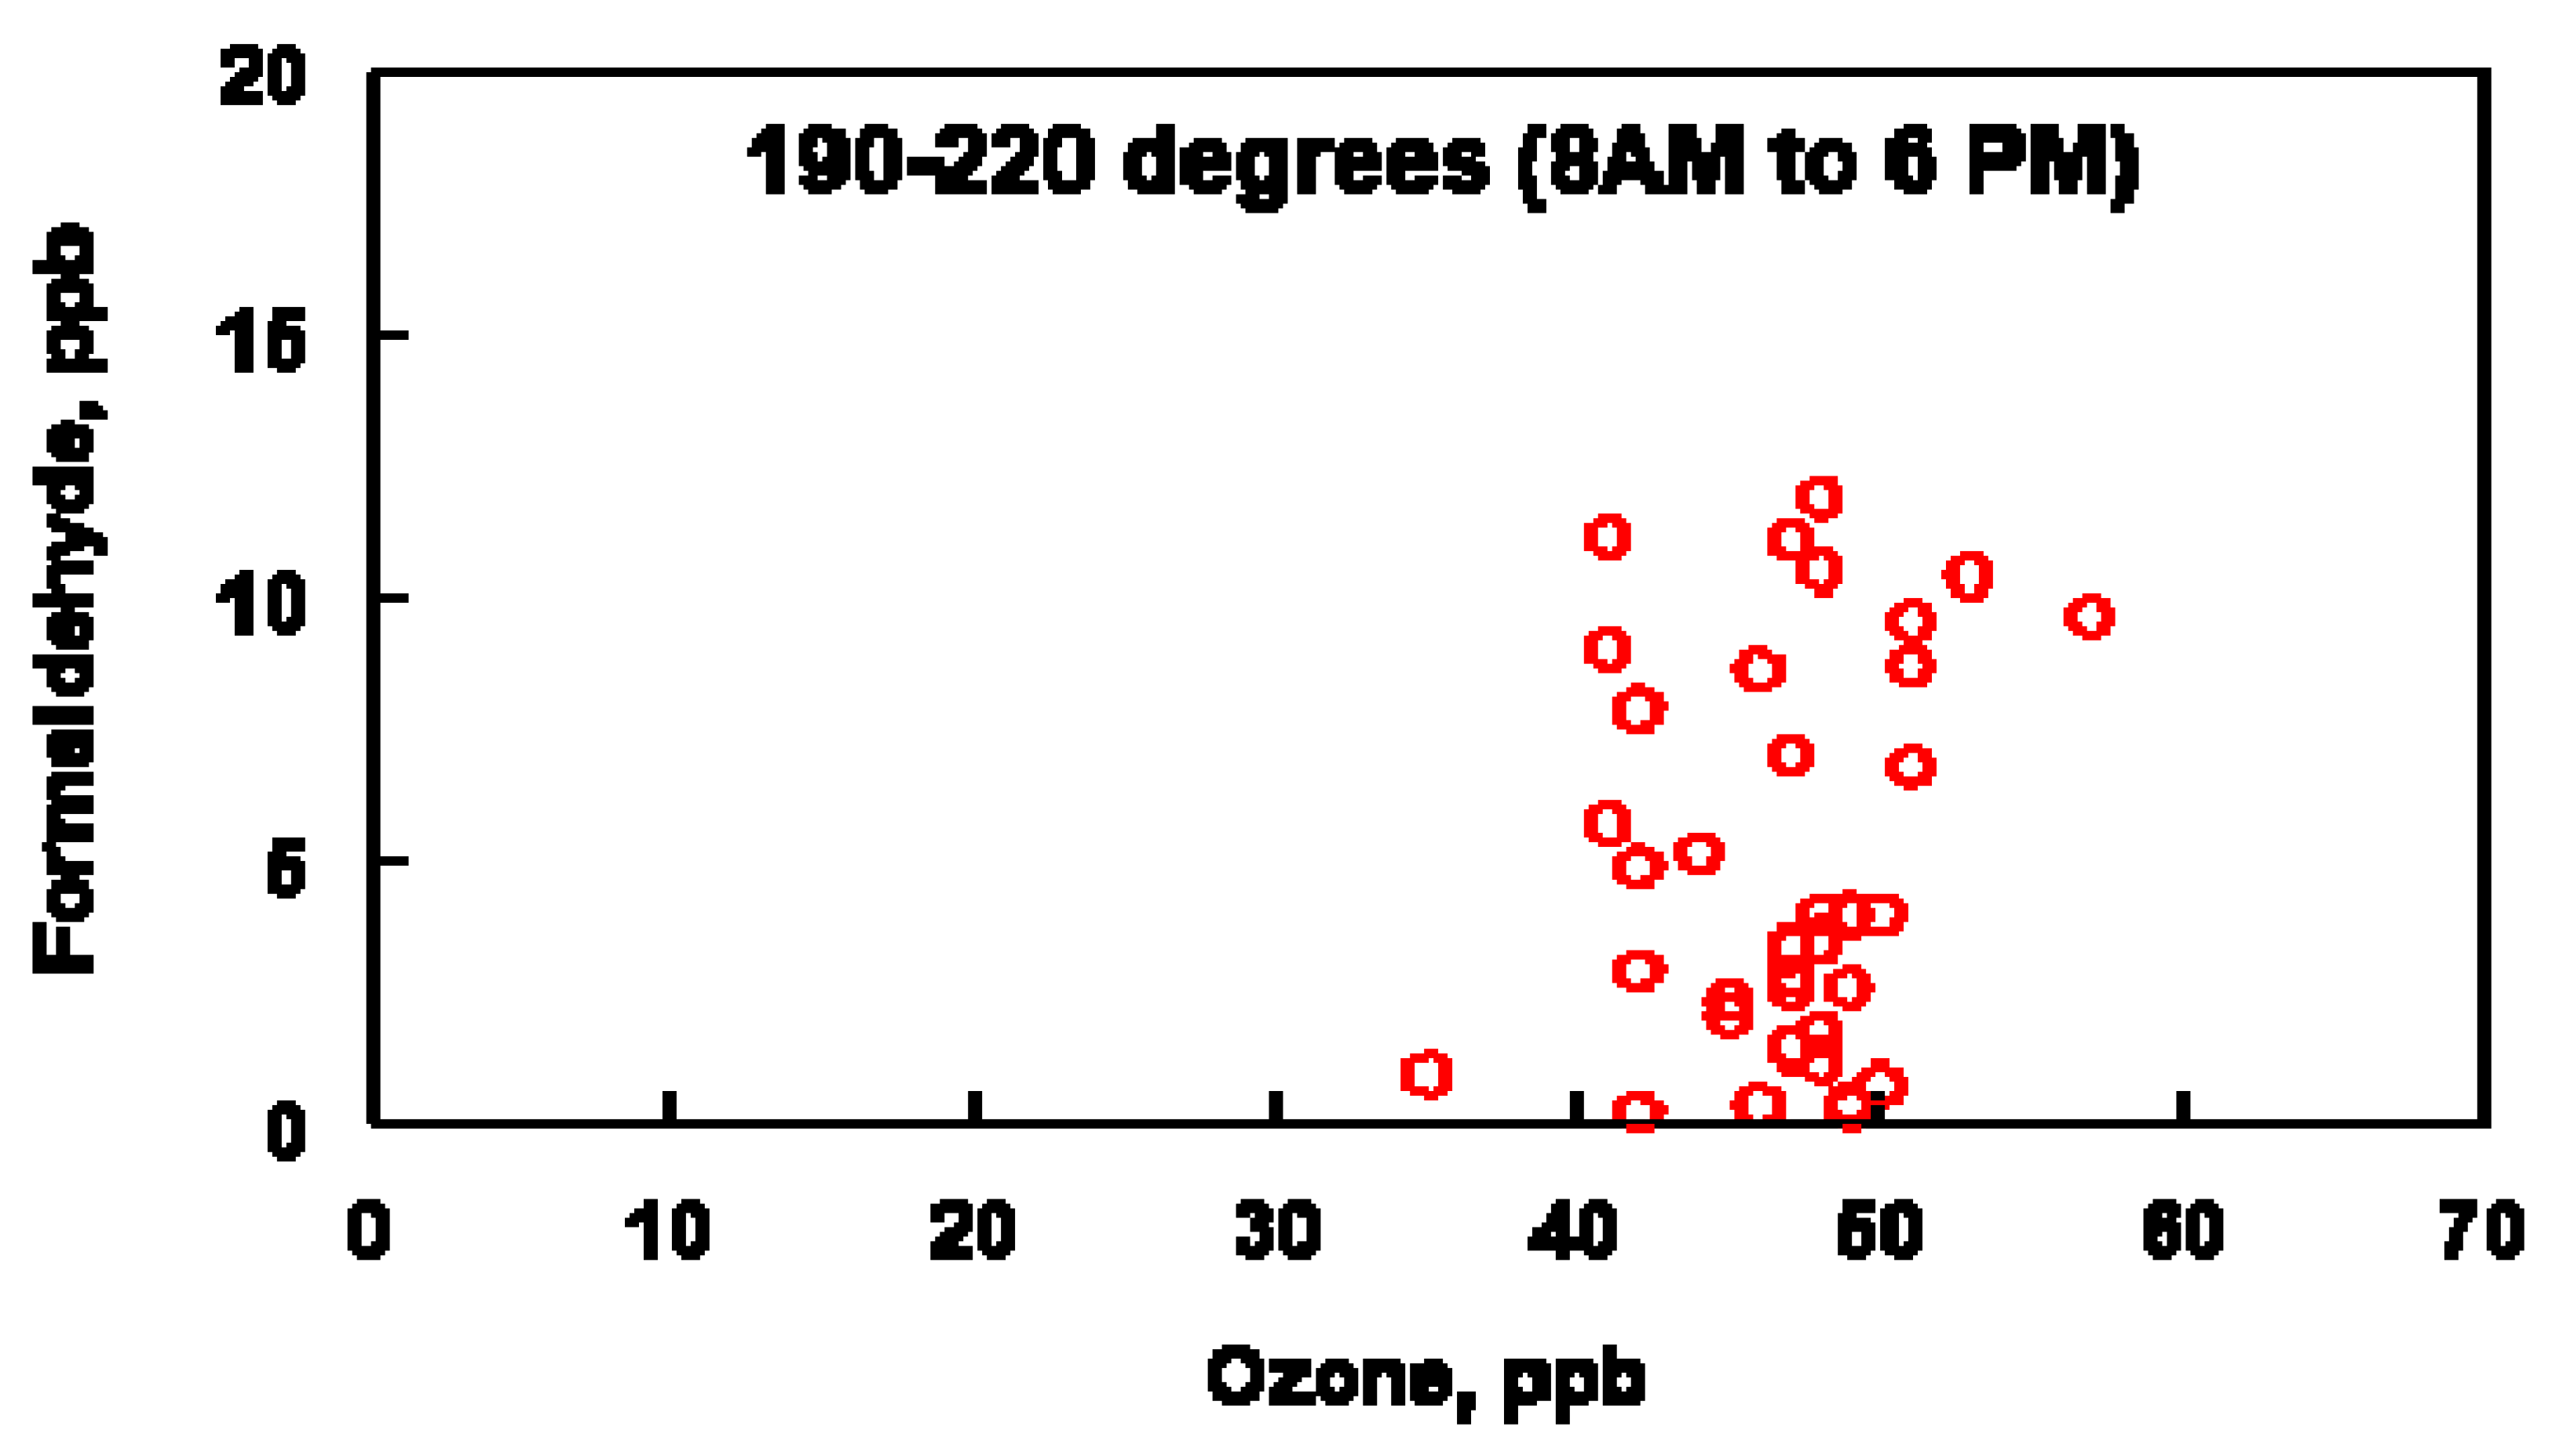
The data plotted in Figure 10 were constrained by plotting O3 and HCHO concentrations when the wind was blowing between 190–220° and between the hours of 8 am–6 pm (A wind direction of between 190 and 220° encompasses the range of oil refineries and other industrial sources located to the SSW of the Bountiful air sampling site, Figure 1). Figure 10 suggests a correlation between O3 and HCHO during the daytime when the wind is blowing from the SSW. Under conditions in which NOx is not limited, the relationship between O3 and HCHO will be linear but some scatter is expected in this analysis due to conditions in which NOx is limited. Under these conditions, HCHO concentrations can be higher than the O3 concentration predicted by a linear relationship between these two molecules. The NOx concentrations varied from 2–67 ppb during 18–21 April, 1–44 ppb during 10–16 May and 1–35 ppb during 4–14 June. The varying NOx concentrations observed during these periods supports the hypothesis that the scatter observed in Figure 10 can be attributed to the nonlinear relationship between O3 and HCHO. The non-zero intercept in Figure 10 is attributed to background levels of both HCHO and O3 at the sampling site.
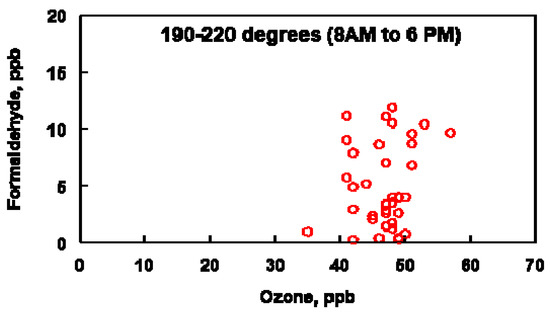
Figure 10.
Comparison of ozone and formaldehyde concentrations between the indicated wind direction and time period for the months of April, May and June (2019).
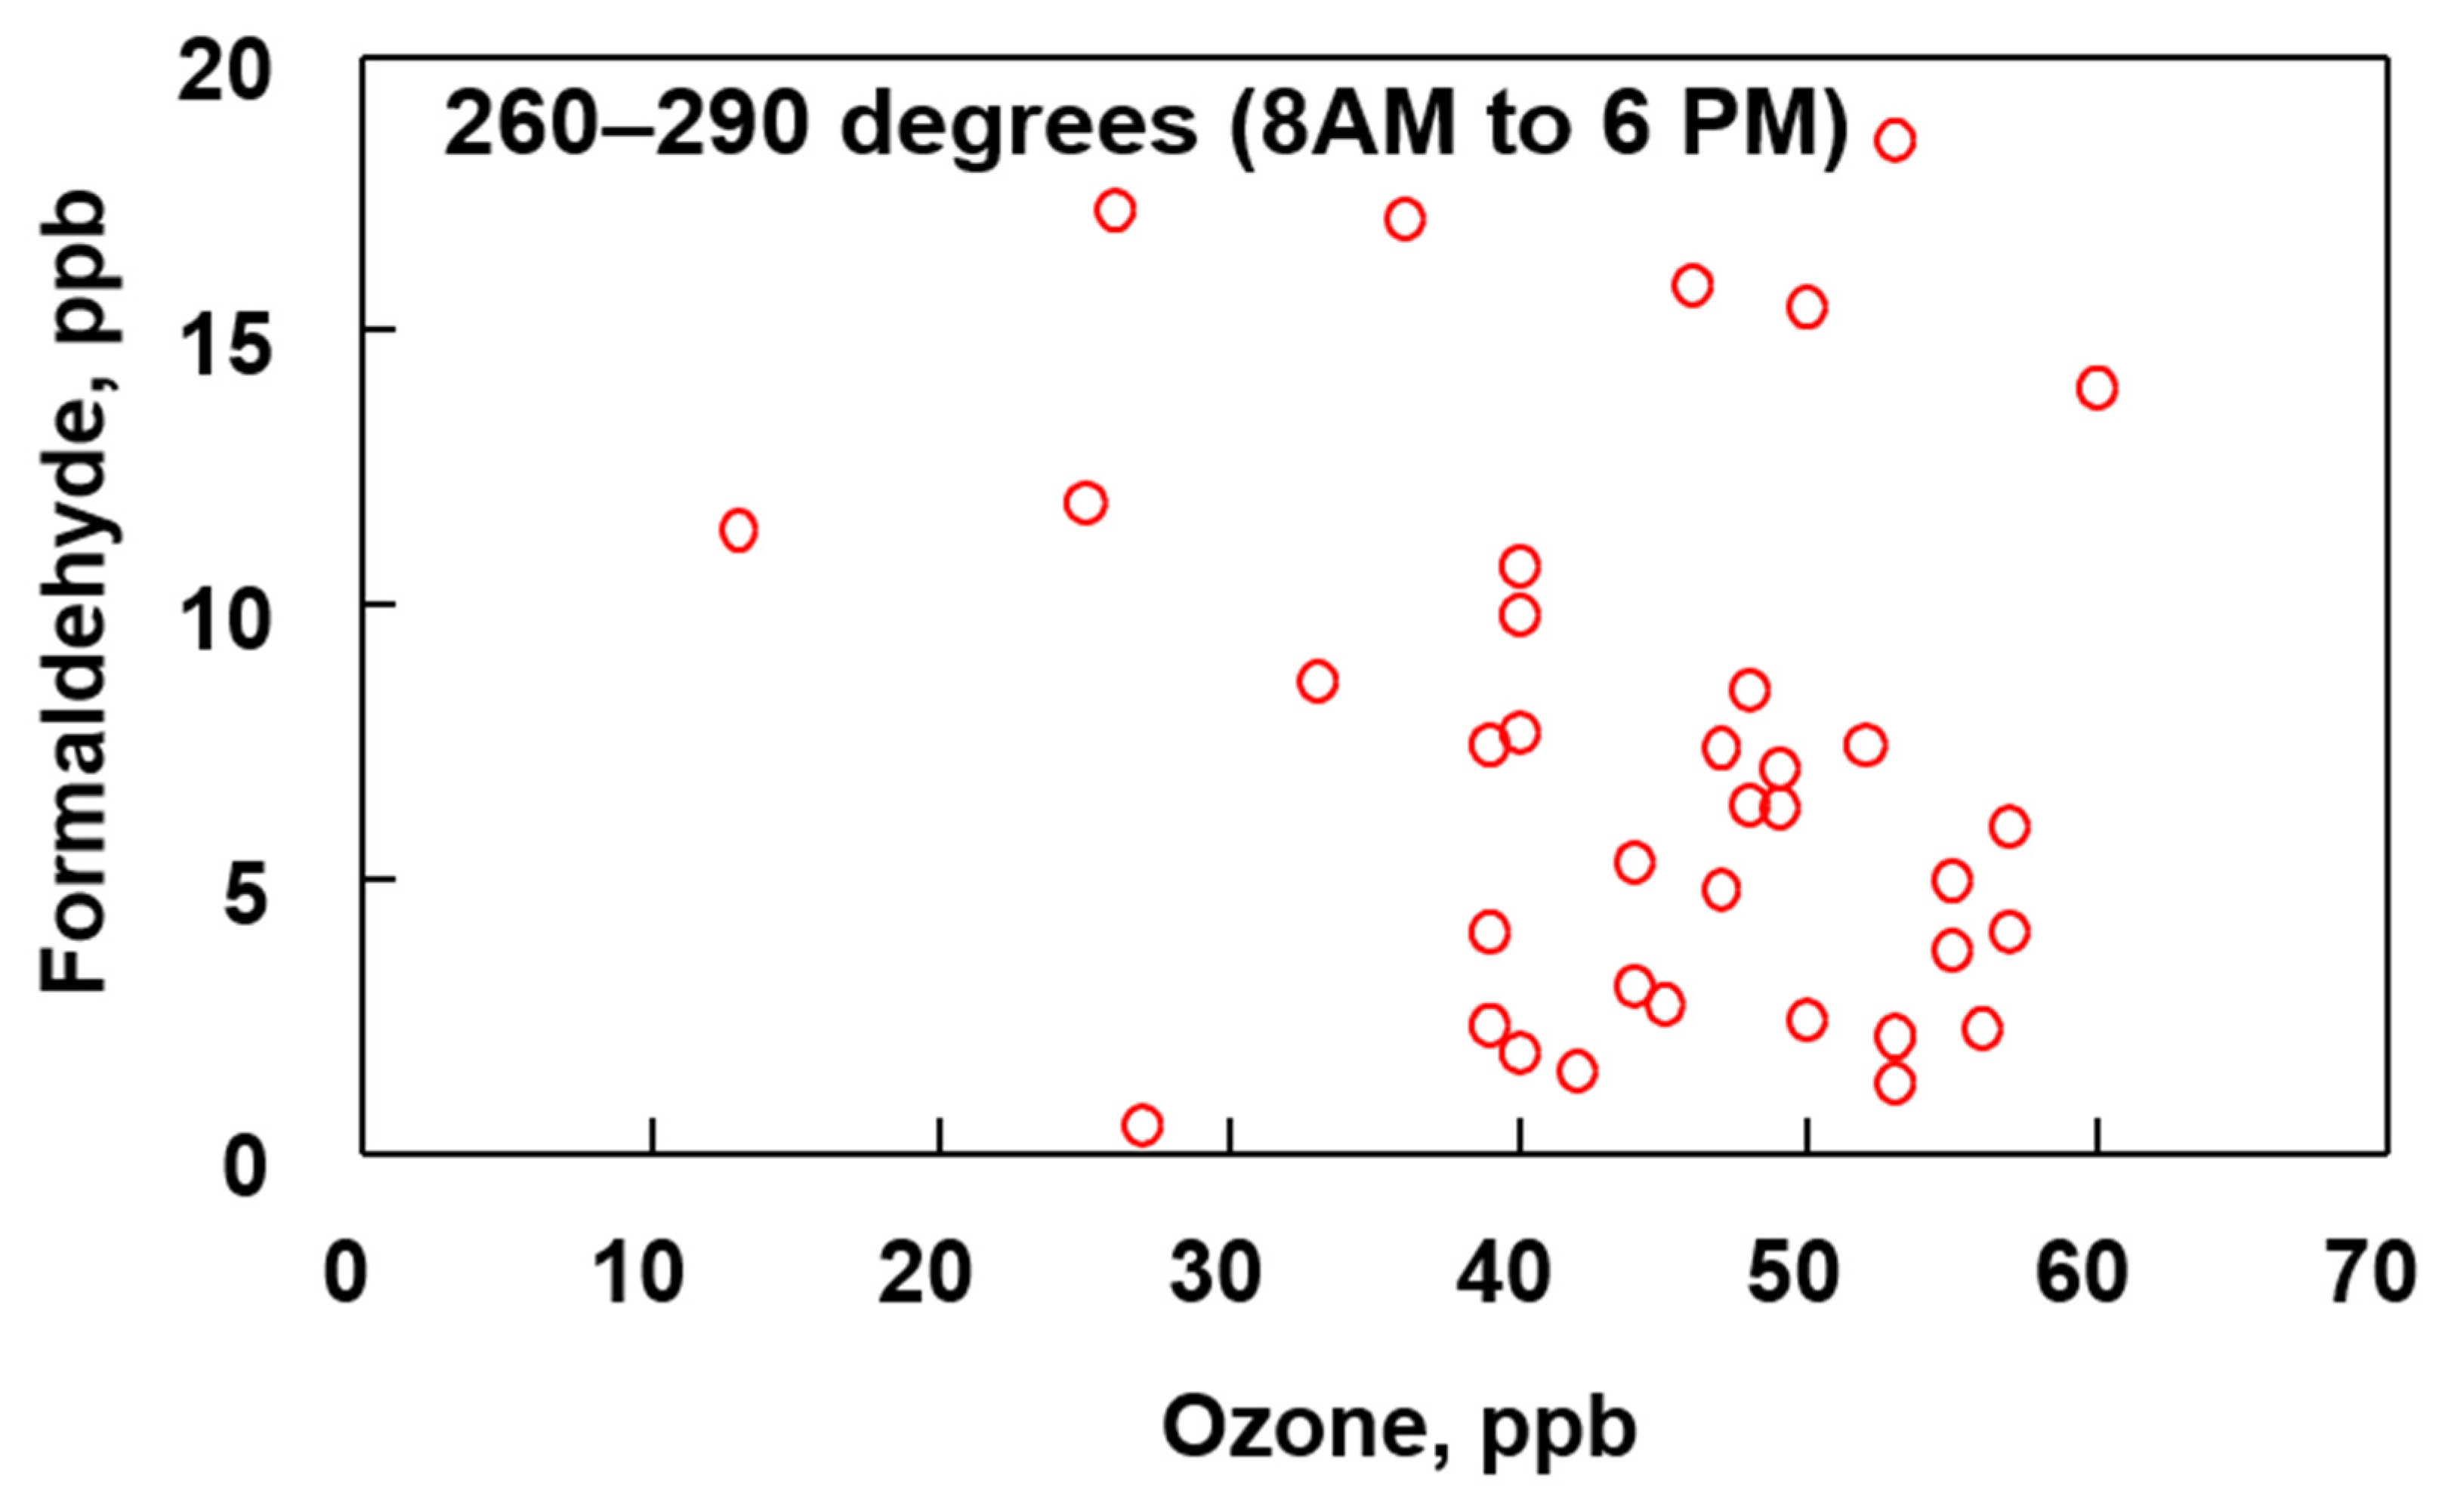
For comparison purposes, Figure 11 shows a plot of O3 verses HCHO during daytime when the wind is blowing from between 260–290° (north, northwest). There are no known large points sources for VOC’s or O3 in this direction.
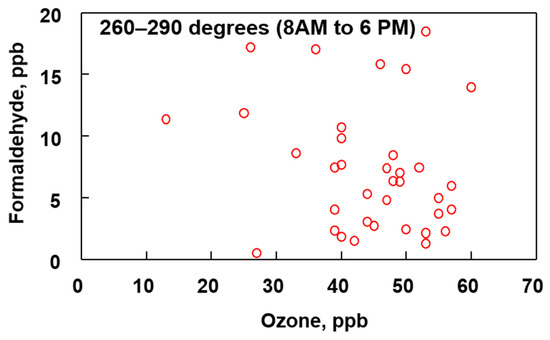
Figure 11.
Comparison of ozone and formaldehyde concentrations between the indicated wind direction and time period for the months of April, May and June (2019).
When the wind is blowing from the north/northwest towards the sampling site the correlation between O3 and HCHO is not as pronounced as when the wind is blowing from the south, southwest. The absence of a strong relationship between O3 and HCHO in Figure 11 is attributed to the absence of VOCs in the air mass that are needed to initiate formation of these two pollutants. By comparison, the data shown in Figure 11 are collected when the wind is blowing from the direction of the refineries and providing a higher concentration of VOCs that are used to initiate O3 and HCHO formation.
Examination of Figure 12 (blue trace) shows that frequently the peak in HCHO matches the peak in the actinic flux. The peak in HCHO is often observed between 12:00–14:00 h when photochemical production of OH radical, driving the photooxidation of VOCs and production of HCHO, is at a maximum.

Figure 12.
Comparison of O3 and HCHO concentrations between March 14 and June 14. The hour of the day in which O3 and HCHO peak are labeled for some of the observed peaks. The hash marks under the x-axis indicates weekends.
Since the formation of formaldehyde is associated with the presence of O3, a secondarily formed pollutant, it suggests that some of the formaldehyde, consistent with the results of the PMF analysis of historical data, is being photochemically produced in the atmosphere from point sources located to the SSW of the sampling site, mostly likely the refineries and industrial sources.
3.7. Backwind Trajectory Analysis of High-Resolution Measurements
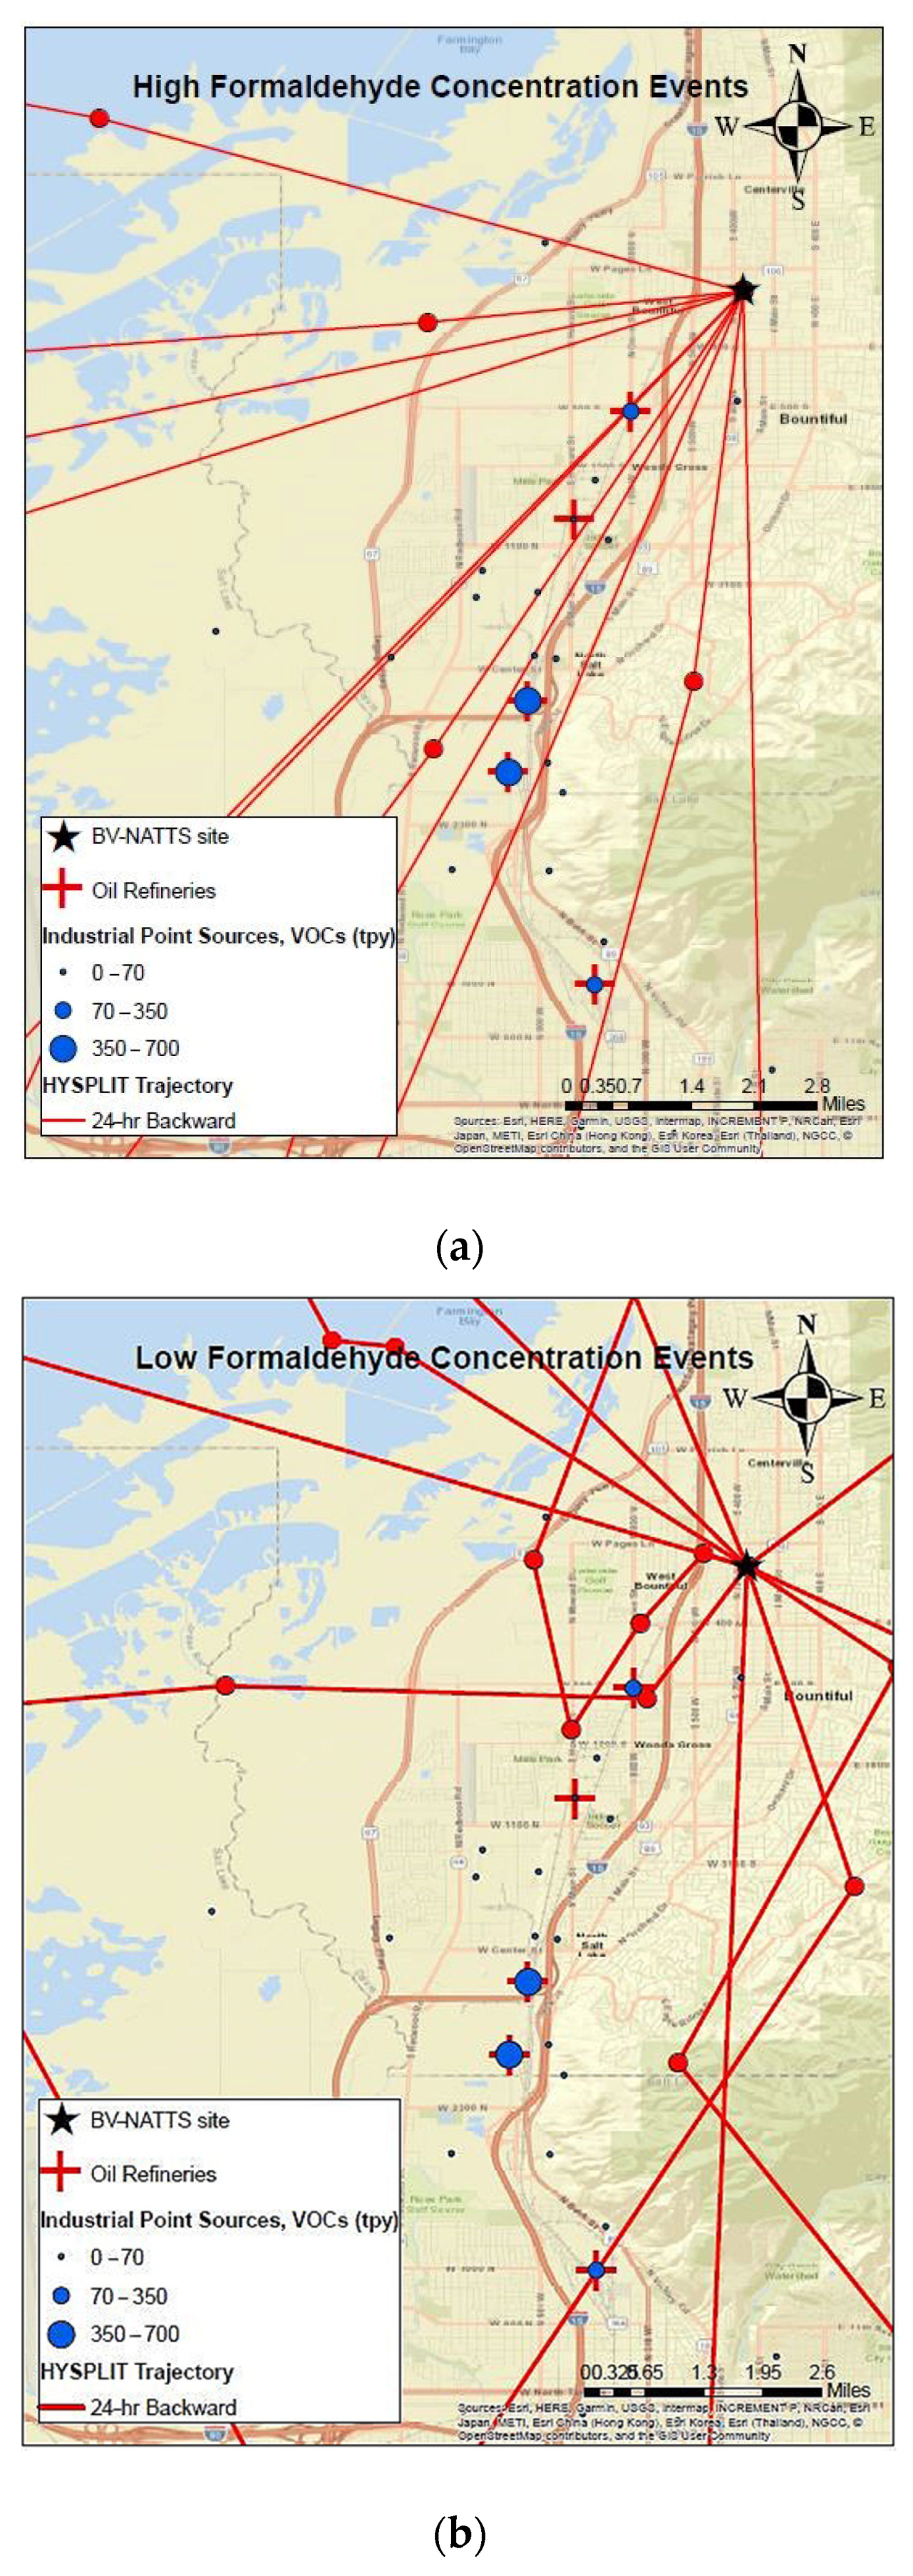
To identify emission source locations associated with formaldehyde formation at the Bountiful station during April–May 2019, 24 h backward wind trajectories were calculated using the National Oceanic and Atmospheric Administration (NOAA) HYbrid Single Particle Lagrangian Integrated Trajectory (HYSPLIT) model (version 4). For all days except for 8 and 19 April, meteorological input data such as wind speed, wind direction was acquired from the High-Resolution Rapid Refresh (HRRR) model with temporal and horizontal grid resolutions of 1 h and 3 km, respectively. Data for 8 and 19 April were acquired from the North America Model (NAM) with a horizontal grid resolution of 12 km since HRRR data were incomplete for these days. Single-particle backward wind trajectories were calculated for a 24 h duration starting at the Bountiful monitoring station. Given that the atmosphere is well mixed during the study time period, a starting height of half the mixing height (above ground level) was considered. For comparison purposes, trajectories that correspond to select high and low formaldehyde concentration events observed during the 2019 field campaign were calculated. Trajectories start times were selected to match times when high (23.8–32.5 ppbv) and low (≤3 ppbv) formaldehyde concentrations were measured by the BBCEAS. A total of 22 trajectories, equally split between the high and low formaldehyde concentration events, were computed.
Results (Figure 13a,b) indicate that trajectories associated with low formaldehyde concentrations had a mixed origin, with no predominant source direction. On the other hand, trajectories associated with peak formaldehyde measurements had a primarily southwesterly component. Given that most refineries and industrial sources in the sampling area fall within the path of the derived back trajectories for the high concentration events, it is likely that precursor emissions from the oil refineries and industrial sources contribute to formaldehyde formation at Bountiful.
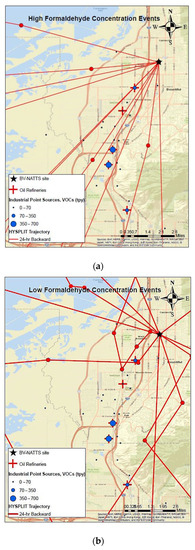
Figure 13.
(a,b) 24 h backwind trajectories at Bountiful monitoring station during (a) high and (b) low formaldehyde concentration events. Red circles represent hourly positions for each trajectory. Green color represents mountains with forested areas.
4. Conclusions
Long-term and short-term, high temporal resolution measurements were evaluated to identify the probable source of elevated formaldehyde concentrations in Bountiful, UT. The historical analysis (2003–2017) were analyzed by EPAPMF v5.0 to identify probable sources of formaldehyde. The results indicate that the principal sources are associated with biomass burning and the conversion of biogenic emissions. These two sources accounted for 79% of the formaldehyde. Anthropogenic sources which contributed the other 21% were associated with mobile emissions, and emissions associated with oil refineries and other industrial emissions. Concentration rose plots of these two factors indicated that both are probably associated with oil refinery processes since the emissions from the refineries are an order of magnitude larger than the combination of emissions from other industrial sources. The diel pattern observed for the highly resolved formaldehyde measurements (2019) suggests that formaldehyde concentration is coupled to the actinic flux and that its formation through the photooxidation of VOCs plays an important role. The relationship between O3 and HCHO supports the importance of formaldehyde being formed as a secondary pollutant. Since the conversion of species like BTEX into HCHO is highly variable and has very slow oxidation rate, the appearance of day-time benzene peak was inconsistent with appearance of formaldehyde peak but this helped in understanding the chemistry of atmospheric oxidation processes in the atmosphere. Back-trajectory wind analysis of low (≤3 ppbv) and high (23.8–32.5 ppbv) HCHO cases show a clear dominance of high HCHO originating in trajectories that come from the southwest and pass over the area of the oil refineries in the north Salt Lake City area.
Supplementary Materials
The following are available online at https://www.mdpi.com/2073-4433/12/3/375/s1, Figure S1. Comparison of the NO2 concentrations measured by the BBCEAS and the Teledyne Advanced Pollution Instrumentation (API) T series NOx analyzer operated by Utah DAQ during the 2019 air sampling campaign from February 2019 to June 2019. Figure S2. (a) Box modelling of oxidation of BTEX and light alkene compounds as a function of time (hr). (b) Rate of HCHO production as a function of VOC and loss of reactant concentration.
Author Contributions
Conceptualization, K.K., N.D., and J.C.H.; methodology, K.K., I.C.J. and J.C.H.; validation, D.J.E., I.C.J. and J.C.H.; formal analysis, D.J.E., K.K. and I.C.J., R.T. and J.C.H.; investigation, N.B. and A.K.; data curation, N.B., A.K., I.C.J., N.D., D.J.E. and J.C.H.; writing—original draft preparation, K.K., N.D., D.J.E., N.B. and J.C.H.; writing—review and editing, D.J.E., N.D., R.T., K.K., N.B. and J.C.H.; visualization, R.T., I.C.J., N.D., D.J.E. and N.B.; supervision, D.J.E., K.K. and J.C.H.; project administration, K.K. and J.C.H.; funding acquisition, K.K. and J.C.H. All authors have read and agreed to the published version of the manuscript.
Funding
This research was funded by the State of Utah, Department of Air Quality.
Institutional Review Board Statement
Not Applicable.
Informed Consent Statement
Not Applicable.
Data Availability Statement
The dataset related to this article can be found at https://scholarsarchive.byu.edu/cgi/preview.cgi?article=1035&context=data (accessed on 11 March 2021), hosted at ScholarsArchive managed by Brigham Young University.
Acknowledgments
The authors would like to thank Bo Call (Environmental Program Manager, Utah Department of Air Quality) for providing research space and use of their air sampling equipment during this study. The authors also thank Michael Yang (Environmental Scientist, Utah Department of Air Quality) for technical assistance in measuring BTEX compounds.
Conflicts of Interest
The authors declare no conflict of interest.
References
- Strum, M.; Scheffe, R. National review of ambient air toxics observations. J. Air Waste Manag. Assoc. 2016, 66, 120–133. [Google Scholar] [CrossRef]
- U.S. Department of Health and Health Services. Public Health Statement for Formaldehyde. Available online: https://www.atsdr.cdc.gov/ToxProfiles/tp111-c1-b.pdf (accessed on 21 January 2021).
- IARC Monographs on the Evaluation of Carcinogenic Risks to Humans Volume 88: Formaldehyde, 2-Butoxyethanol and 1-tert-Butoxypropan-2-ol. 2006. Available online: https://monographs.iarc.who.int/wp-content/uploads/2018/06/mono88.pdf (accessed on 10 March 2021).
- U.S. Environmental Protection Agency. Report to Congress on Indoor Air Quality, Volume II: Assessment and Control of Indoor Air Pollution; U.S. Environmental Protection Agency: Washington, DC, USA, 1989. [Google Scholar]
- Bulatov, V.P.; Kozliner, M.Z.; Sarkisov, O.M. Determination of rate constants for the reactions SH+ NO2−HSO+ NO and HSO+ NO2 products. Khim. Fiz. 1984, 3, 1300–1305. [Google Scholar]
- U.S. Department of Health and Human Services. Public Health Statement for Formaldehyde. Available online: https://www.atsdr.cdc.gov/toxprofiles/tp111-c1.pdf (accessed on 10 March 2021).
- Zhu, L.; Jacob, D.J.; Keutsch, F.N.; Mickley, L.J.; Scheffe, R.; Strum, M.; Abad, G.G.; Chance, K.; Yang, K.; Rappengluck, B.; et al. Formaldehyde (HCHO) As a Hazardous Air Pollutant: Mapping Surface Air Concentrations from Satellite and Inferring Cancer Risks in the United States. Environ. Sci. Technol. 2017, 51, 5650–5657. [Google Scholar] [CrossRef] [PubMed]
- Luo, Y.H.; Dou, K.; Fan, G.Q.; Huang, S.; Si, F.Q.; Zhou, H.J.; Wang, Y.J.; Pei, C.L.; Tang, F.Y.; Yang, D.S.; et al. Vertical distributions of tropospheric formaldehyde, nitrogen dioxide, ozone and aerosol in southern China by ground-based MAX-DOAS and LIDAR measurements during PRIDE-GBA 2018 campaign. Atmos. Environ. 2020, 226, 11. [Google Scholar] [CrossRef]
- Pfister, G.; Wang, C.T.; Barth, M.; Flocke, F.; Vizuete, W.; Walters, S. Chemical Characteristics and Ozone Production in the Northern Colorado Front Range. J. Geophys. Res. Atmos. 2019, 124, 13397–13419. [Google Scholar] [CrossRef]
- Xu, R.J.; Li, X.; Dong, H.B.; Wu, Z.J.; Chen, S.Y.; Fang, X.; Gao, J.; Guo, S.; Hu, M.; Li, D.Q.; et al. Measurement of gaseous and particulate formaldehyde in the Yangtze River Delta, China. Atmos. Environ. 2020, 224, 11. [Google Scholar] [CrossRef]
- Zeng, P.; Lyu, X.P.; Guo, H.; Cheng, H.R.; Wang, Z.W.; Liu, X.F.; Zhang, W.H. Spatial variation of sources and photochemistry, of formaldehyde in Wuhan, Central China. Atmos. Environ. 2019, 214, 9. [Google Scholar] [CrossRef]
- Kumar, A.; Bali, K.; Singh, S.; Naja, M.; Mishra, A.K. Estimates of reactive trace gases (NMVOCs, CO and NOx) and their ozone forming potentials during forest fire over Southern Himalayan region. Atmos. Res. 2019, 227, 41–51. [Google Scholar] [CrossRef]
- Adeniji, S.A.; Kerr, J.A.; Williams, M.R. Rate Constants for Ozone-Alkene Reactions under Atmospheric Conditions. Int. J. Chem. Kinet. 1981, 13, 209. [Google Scholar] [CrossRef]
- Zhang, H.L.; Li, J.Y.; Ying, Q.; Guven, B.B.; Olaguer, E.P. Source apportionment of formaldehyde during TexAQS 2006 using a source-oriented chemical transport model. J. Geophys. Res. Atmos. 2013, 118, 1525–1535. [Google Scholar] [CrossRef]
- Parrish, D.D.; Ryerson, T.B.; Mellqvist, J.; Johansson, J.; Fried, A.; Richter, D.; Walega, J.G.; Washenfelder, R.A.; de Gouw, J.A.; Peischl, J.; et al. Primary and secondary sources of formaldehyde in urban atmospheres: Houston Texas region. Atmos. Chem. Phys. 2012, 12, 3273–3288. [Google Scholar] [CrossRef]
- Stroud, C.A.; Zaganescu, C.; Chen, J.; McLinden, C.A.; Zhang, J.H.; Wang, D. Toxic volatile organic air pollutants across Canada: Multi-year concentration trends, regional air quality modelling and source apportionment. J. Atmos. Chem. 2016, 73, 137–164. [Google Scholar] [CrossRef]
- Patrick Barickman, M.B.; Daher, N.; Kelly, K.; Packham, S. 2015 Special Toxics Study Report; Utah Division of Air Quality: Salt Lake City, UT, USA, 2016. [Google Scholar]
- Kelly, K.; Daher, N. Saturation Air Toxics Monitoring in Davis County, Utah; Utah Division of Air Quality: Salt Lake City, UT, USA, 2017. [Google Scholar]
- Utah Department of Transportation Annual Averge Daily Traffice (AADT) for Roadway Segments in Utah. Available online: https://www.udot.utah.gov/connect/docs/aadt-google-map/ (accessed on 11 January 2021).
- U.S. Environmental Protection Agency Determination of Formaldehyde in Ambient Air Using Adsorbent Cartridge Followed by High Performance Liquid Chromatography. Available online: https://www.epa.gov/sites/production/files/2019-11/documents/to-11ar.pdf (accessed on 21 January 2021).
- U.S. Environmental Protection Agency Formaldehyde. Available online: https://www.epa.gov/sites/production/files/2016-09/documents/formaldehyde.pdf (accessed on 21 January 2021).
- Paatero, P. Least squares formulation of robust non-negative factor analysis. Chemom. Intell. Lab. Syst. 1997, 37, 23–35. [Google Scholar] [CrossRef]
- U.S. Environmental Protection Agency. EPA Positive Matrix Factorization (PMF) 5.0 Fundamental and User Guide; EPA/600/R-14/108; U.S. Environmental Protection Agency: Washington, DC, USA, 2018. [Google Scholar]
- Polissar, A.V.; Hopke, P.K.; Paatero, P. Atmospheric aerosol over Alaska—2. Elemental composition and sources. J. Geophys. Res. Atmos. 1998, 103, 19045–19057. [Google Scholar] [CrossRef]
- Washenfelder, R.A.; Attwood, A.R.; Flores, J.M.; Zarzana, K.J.; Rudich, Y.; Brown, S.S. Broadband cavity-enhanced absorption spectroscopy in the ultraviolet spectral region for measurements of nitrogen dioxide and formaldehyde. Atmos. Meas. Tech. 2016, 9, 41–52. [Google Scholar] [CrossRef]
- Thalman, R.; Zarzana, K.J.; Tolbert, M.A.; Volkamer, R. Rayleigh scattering cross-section measurements of nitrogen, argon, oxygen and air. J. Quant. Spectrosc. Radiat. Transf. 2014, 147, 171–177. [Google Scholar] [CrossRef]
- Jenkin, M.E.; Saunders, S.M.; Pilling, M.J. The tropospheric degradation of volatile organic compounds: A protocol for mechanism development. Atmos. Environ. 1997, 31, 81–104. [Google Scholar] [CrossRef]
- Saunders, S.M.; Jenkin, M.E.; Derwent, R.G.; Pilling, M.J. Protocol for the development of the Master Chemical Mechanism, MCM v3 (Part A): Tropospheric degradation of non-aromatic volatile organic compounds. Atmos. Chem. Phys. 2003, 3, 161–180. [Google Scholar] [CrossRef]
- Jenkin, M.E.; Saunders, S.M.; Wagner, V.; Pilling, M.J. Protocol for the development of the Master Chemical Mechanism, MCM v3 (Part B): Tropospheric degradation of aromatic volatile organic compounds. Atmos. Chem. Phys. 2003, 3, 181–193. [Google Scholar] [CrossRef]
- Bloss, C.; Wagner, V.; Jenkin, M.E.; Volkamer, R.; Bloss, W.J.; Lee, J.D.; Heard, D.E.; Wirtz, K.; Martin-Reviejo, M.; Rea, G.; et al. Development of a detailed chemical mechanism (MCMv3.1) for the atmospheric oxidation of aromatic hydrocarbons. Atmos. Chem. Phys. 2005, 5, 641–664. [Google Scholar] [CrossRef]
- Sommariva, R.; Cox, S.; Martin, C.; Borońska, K.; Young, J.; Jimack, P.K.; Pilling, M.J.; Matthaios, V.N.; Nelson, B.S.; Newland, M.J.; et al. AtChem (version 1), an open-source box model for the Master Chemical Mechanism. Geosci. Model Dev. 2020, 13, 169–183. [Google Scholar] [CrossRef]
- Finlayson-Pitts, B.J. Chemistry of the Upper and Lower Atmosphere: Theory, Experiments, and Applications; Pitts, J.N., Ed.; Academic Press: San Diego, CA, USA, 2000. [Google Scholar]
Publisher’s Note: MDPI stays neutral with regard to jurisdictional claims in published maps and institutional affiliations. |
© 2021 by the authors. Licensee MDPI, Basel, Switzerland. This article is an open access article distributed under the terms and conditions of the Creative Commons Attribution (CC BY) license (http://creativecommons.org/licenses/by/4.0/).

