Abstract
The particle emissions from a commercial brake system utilizing copper-free pads have been characterized on a brake dynamometer under two real-world driving cycles. These included a novel cycle developed from analysis of the database of the World Harmonized Test Procedure (WLTP-Brake) and a short version of the Los Angeles City Traffic cycle (3h-LACT) developed in the framework of the European LowBraSys project. Disc temperature measurements using an array of embedded thermocouples revealed a large temporal and spatial non-uniformity with the radial temperature distribution depending also on the test procedure. Averaging over the duration of the cycle, it effectively reduced the influence of thermocouple positioning, allowing for more reliable quantification of the effectiveness of convective cooling. Particulate Matter (PM) emissions were similar for both cycles with PM2.5 averaging at 2.2 (±0.2) mg/km over the WLTP-Brake and 2.2 (±0.2) mg/km over the 3h-LACT, respectively. The corresponding PM10 emissions were 5.6 (±0.2) mg/km and 8.6 (±0.7) mg/km, respectively. The measurements revealed the formation of nanosized particles peaking at 10 nm, which were thermally stable at 350 °C under both cycles. Volatile nanoparticles were observed over the more demanding 3h-LACT cycle, with their emission rates decreasing with increasing the tunnel flow, suggesting nucleation of organic vapors released during braking as a potential formation process.
1. Introduction
Airborne Particulate Matter (PM) has long been identified as an environmental and health hazard [1]. Road transport is a major contributor to ambient PM, especially in urban areas [2]. Traffic-related PM originates from both exhaust and non-exhaust sources, with brake-wear being the main contributor to non-exhaust PM10 [3,4]. The technological improvements triggered by the continuously tighter regulation worldwide resulted in a significant reduction in exhaust PM emissions [2,5]. The relative share of brake-wear PM emissions is projected to steadily increase owing to the exhaust emission reductions brought by advanced after-treatment technologies and the forecasted electrification of the automotive sector [6].
Brake-wear PM is a complex mixture of particles of vastly different chemistry, morphology and size. The physicochemical properties strongly depend on the brake system configuration, the brake-friction material and the operating conditions [7]. Two distinct formation processes have been identified. Mechanical abrasion/adhesion leads to particles having a large size, with approximately 40% of their mass being respirable [3,8]. At sufficiently high frictional heat generation, organic constituents like phenolic resins used as binders [8] can evaporate and subsequently nucleate, forming particles as small as 1.3 nm [9].
Characterization of brake-wear particle emissions under real-world operation imposes several challenges, including, amongst others, the proper collection of supermicron particles [10] and interference on the convective cooling of the brakes [11]. Brake-dynamometers allow for an alternative approach offering tighter control of the braking and cooling conditions, allowing for the development of a standardized test procedure.
In this direction, the United Nations Particle Measurement Programme Informal Working Group (UNECE PMP IWG) has been actively working on the development of a harmonized brake-dynamometer methodology. The first step was the development of a novel brake cycle that would be representative of real-world operating conditions [12]. The cycle (hereinafter WLTP-Brake) was based on the analysis of the database from the Worldwide harmonized Light Duty vehicles Test Procedure, containing in-use driving data with a total mileage of 743,694 km. The following step was the definition of an appropriate sampling setup to address the inherent difficulties in handling brake-wear particles. On the one hand, the large fraction of super-micron particles imposes challenges in their transportation [10]. Additionally, their formation is highly localized, leading to non-homogeneous concentration profiles, while the large variety of available brake systems leads to complex air flows around the brakes. Accordingly, it was decided that enclosing the brake system in a dilution tunnel would be necessary for representative PM and Particle Number (PN) sampling. Furthermore, isokinetic sampling requirements necessitate the operation of the tunnel at a constant flow rate for the entire cycle.
The establishment of a thermal load on the brake system representative of real-world operation has been identified as a critical aspect of the methodology. On the one hand, this can affect the wear-rates [13,14] and accordingly PM emission rates. On the other hand, the developed temperatures can affect the release rate of organic compounds and accordingly the nucleation rates and thus the number concentration of volatile species [12]. Due to the nonlinear nature of the nucleation process, a mismatch of the developed temperatures can lead to orders of magnitude increase in number concentrations unless the particles are thermally treated [15,16]. Hence, embedded thermocouple measurements of disc temperatures have been proposed as a means of ensuring thermal loads representative of real-world operation. Ideally, target temperature profiles should be established from real-world driving of each individual vehicle under the WLTP-Brake speed profile and then matched on the dyno by means of appropriate selection of the tunnel flow. However, this would be impractical, especially considering the varying ambient conditions. Accordingly, the use of universally applicable threshold values was proposed, subject to amendment as more vehicle data become available.
Given the emphasis of the proposed methodology on embedded thermocouple measurements, dedicated tests were conducted to assess the potential and limitations of this approach. Previous work [17] suggested that the repeatability of thermocouple measurements can be affected by the development of hot rings, the radial location of which within the contact region of the pads changes with time [18]. Such hot bands arising as a result of uneven distribution of the surface pressure (due to surface roughness and patch dynamics) were recorded with thermal cameras. In order to gain insight into the spatial and temporal variation of disc temperatures, dedicated tests were conducted on the same brake system. An array of four thermocouples was installed at four radial locations equally spaced along the contact area of the pads, to allow for real-time information on the spatial distribution of the disc temperatures. The experiments were conducted on a bigger dilution tunnel to assess whether the earlier findings are reproduced at enhanced convection cooling offered by a ~10-fold higher flowrates (900 to 1200 m3/h).
A recent study on the same brake system revealed that the burnishing procedure can have a strong effect on the particle number emissions [19]. Elevated concentrations were observed when the bedding was performed using the WLTP-Brake cycle, proposed by the PMP IWG. In order to gain insight into the nature of these particles, dedicated tests were performed with an arsenal of instrumentation. Measurements included PM2.5, PM10 and number concentrations of thermally treated samples following the regulated exhaust procedure, as well as number concentration and real-time electrical mobility size distribution of untreated samples. In addition to the WLTP-Brake, a short version of the Los Angeles City Traffic (3h-LACT) cycle developed within the LowBraSys project [20] was tested. The results provide evidence on the formation of thermally stable nanosized particles over the WLTP-Brake. Volatile particles were observed over the 3h-LACT cycle, the number concentration of which was found to be strongly affected by the tunnel flow.
2. Materials and Methods
2.1. Brake System
A commercially available front disc brake system was used for the study. It was equipped with a single-piston floating-caliper and copper-free pads certified according to R90 regulation of the United Nations Economic Commission for Europe (ECE pads hereinafter). The effective friction radius of the disc was 133.5 mm, and it weighed 9 kg. This was the same brake system tested by Mamakos et al. [17].
2.2. Temperature Measurement
The majority of tests were performed on a disc on which four embedded 3 mm k-type Ni-Cr-Ni thermocouples (GHI GmbH, Nidderau, Germany) were used to measure the disc temperature at different radial locations along the contact surface. Positions 1 and 4 were at 10 mm radial distance from the outer and inner track of the disc, respectively, while positions 2 and 3 were 20 mm apart at an equal distance from the center of the contact area. The angular position was dictated by the cooling fins. They were installed ½ mm deep in the surface of the outboard side of the disc as the PMP group recommends. Their radial positions are shown in Figure 1. The bedding investigations were performed using new brake systems (unconditioned pads and discs). In these tests, a single thermocouple was installed at the radial position 2. All temperature data were recorded at 10 Hz frequency.
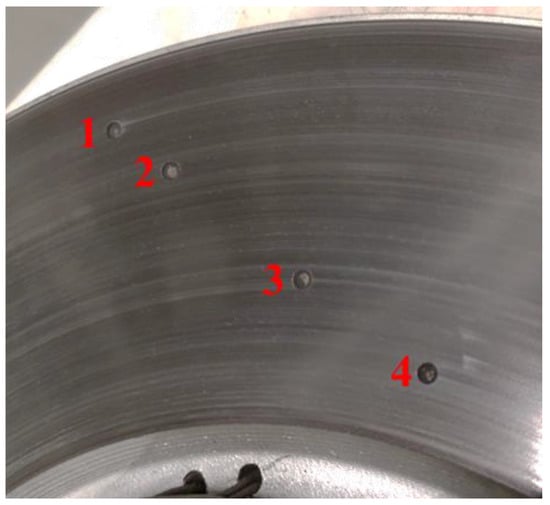
Figure 1.
Position of thermocouples 1–4 on the outboard side of the disc.
2.3. Test Stand
All tests were carried out on a brake inertia dynamometer equipped with a climate chamber at Bayerische Motoren Werke AG (BMW), shown in Figure 2. The test stand can simulate vehicles with an inertia of 10–140 kg·m2, a speed up to 3000 rpm and a maximum pressure of 200 bar, resulting in a maximum deceleration of 10 m/s2. To ensure that only particles generated by the brake are measured, an additional enclosure made out of electro-polished steel was installed around the brake and the cooling air flow (temperature: 20 ± 2 °C, humidity: 50 ± 5%) was conditioned using a HEPA H13 filter. The airflow was controlled by a blower located between the filter and the pipes to the enclosure and was set at 900 m3/h and 1200 m3/h in this campaign. As it passes through the enclosure, the flow collects the emitted particles from the braking system. The brake system was installed at the 3 o’clock position and rotated counterclockwise. The particles are transported to the sampling points through ducts with an internal diameter of 175 mm. The brake system was tested using the same inertia (73.3 kg/m2) and rolling radius (332 mm) employed in our earlier study [17].
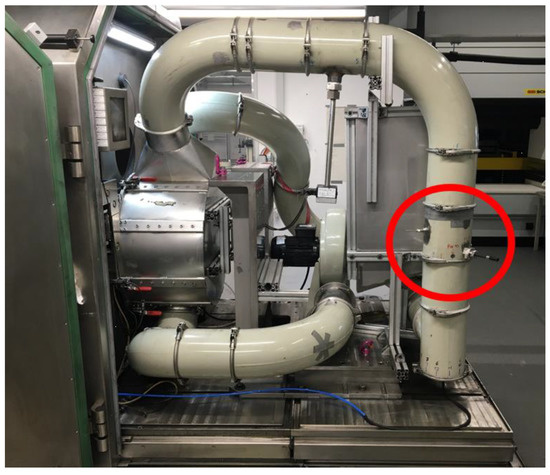
Figure 2.
Enclosure inside the brake inertia dynamometer. Location of probes used for sample extraction is highlighted.
2.4. Test Protocol
The emission performance during bedding was evaluated by means of running 12 consecutive WLTP-Brake cycles on new brakes (fresh pads and discs). All these tests were performed at a tunnel flow of 900 m3/h using a single thermocouple installed at radial position 2 (Figure 1). The effect of the test cycle and tunnel flow was assessed on a single brake system that had been previously burnished (12 consecutive WLTP-Brake cycles). The conditioned brake system was tested over the WLTP-Brake and the 3h-LACT cycle developed within the LowBraSys project [20], at tunnel flows of 900 and 1200 m3/h. The velocity profiles of the two cycles are compared in the supplementary information, while key statistics are summarized in Table 1. The cycle-average speed over the 3h-LACT is slightly higher, while braking is more frequent compared to the WLTP-Brake. In addition, the 3h-LACT is run consecutively, while the WLTP is broken down into 10 trips, each starting after sufficient cooling of the brake system to reach a disc temperature of 40 °C.

Table 1.
Important parameters of the WLTP-Brake and the 3h-LACT cycles.
2.5. Aerosol Sampling
Three EN 13284-1/ISO 9096 compliant probes (Paul Gothe GmbH, Bochum, Germany) were employed for the extraction of samples for PM2.5, PM10 and thermally treated PN. The probes incorporated a 90° bend, with the sample nozzle at the tip installed vertically facing the flow. Two additional straight probes were employed for total PN and real-time size distribution measurements of untreated samples. Anisokinetic sampling is justified for the size spectrometer employed owing to its 560 nm upper measurement range. Similarly, the aspiration efficiency for the Condensation Particle Counter (CPC) was calculated to be 105% to 110% at the cut-off size of the cyclone employed at its inlet (1.5 μm—TSI Inc. cyclone 1031588).
2.6. Aerosol Measurement
PM2.5 and PM10 emissions were quantified gravimetrically using two separate filter holders. The filter holders were equipped with a URG-2000-30EHS (URG corp., Chappel Hill, NC, USA) and a Mesa labs SCC2.345 (Mesa Labs, Butler, NJ, USA) cyclones providing a 50% cut-off size at 10 and 2.5 μm at the employed sample flows of 5 and 7 lpm, respectively. The extracted flows were set with mass flow controllers (Vögtlin red-y). A venturi pump provided a necessary vacuum. Forty-seven-millimeter Teflon-coated glass fiber filters (Pallflex TX40 HI20WW, Pall, Dreieich, Germany) were used. Conductive Teflon (carbonated internal surfaces) tubing (60 cm long of 8 mm inner diameter) was employed to connect the sample probe to the filter holder. PM measurements were only performed on the conditioned brake system. A single filter was employed over 3 repetitions of the WLTP-Brake and 5 repetitions of the 3h-LACT. The collected mass ranged from 0.47 to 0.98 mg for PM2.5 and from 0.76 and 2.20 mg for PM10, depending on cycle and tunnel flow. Weighing was performed in a Sartorius XAC01 MSE scale (Sartorius Lab Instruments GmbH & Co., Göttingen, Germany) in accordance with the requirements laid down in the European automotive exhaust regulation [21].
Thermally treated PN measurements were performed using an AVL xApp APC (AVL GmbH, Graz, Austria) fully compliant with the automotive exhaust regulation as amended for 10 nm measurements [22]. It consists of a flow-through rotating diluter operating with conditioned air at 150 °C followed by a catalytic stripper (CS) operating at 350 °C and a mixing-type diluter operating at ambient temperature. A single PCRF of 100 was employed in all tests and was sufficient to bring the number concentrations within the measurement range (30,000 cm−3) of the internal Condensation Particle Counter (CPC). The latter was a butanol-based full-flow AVL 488-10 CPC, with a 50% counting efficiency at 10 nm. Both the APC and the AVL CPC were calibrated before the campaign, and the validity of their calibrations was verified at the end of the campaign at AVL. The devices were calibrated in accordance to the aforementioned regulation [22], in an ISO-certified calibration laboratory.
The number concentration of untreated samples extracted from the tunnel were measured using a TSI 3776 ultrafine CPC (UCPC) (TSI Inc, Shoreview, MN, USA). A small fraction of the sampled aerosol enters the condenser through a capillary at the centerline, where the supersaturation is highest. The remaining fraction is filtered and enters the condenser through the periphery of the capillary acting as a sheath flow. This approach allows for lower detection sizes [23], with the specific implementation offering a nominal 50% efficiency at 2.5 nm. The UCPC was found to consistently underestimate the number concentration by ~40%, probably due to contamination of the capillary. The instrument was sent for maintenance at the end of the campaign, where the misadjustment of capillary flow was verified, although the exact effect was not quantified. A flat 1/(1−0.4) = 1.66 correction was applied in all UCPC results to account for the observed underestimation.
Real-time size distribution measurements were performed using a TSI 3090 Engine Exhaust Particle Sizer (EEPS). The EEPS is an electrical mobility spectrometer. Particles are first charged in two unipolar diffusion chargers of opposite polarity operating in tandem (with the negative preceding the positive). This configuration allows for the conditioning of potential pre-existing charges on the sampled aerosol [24]. The charged particles are subsequently electrostatically deposited in a series of collection rings in the annulus between two concentric cylinders. The current measured by electrometer connected on these rings is converted to number weighted size distributions, using proprietary software. The inversion kernel depends on the morphology of the particles with three available kernels for spherical particles as well as compact and soot fractals. If information was lacking on the morphology of the emitted particles, the default kernel was employed. The operating electrical mobility size range of the EEPS is 5.6 to 560 nm. The instrument incorporates a cyclone at the inlet removing particles larger than 1 μm, the multiple charged fraction of which could interfere with the inversion algorithm.
3. Results
3.1. Temperatures
Figure 3 provides a summary of the mean and peak disc temperatures measured with the four thermocouples over repeated WLTP-Brake (left-hand panels) and 3h-LACT (right-hand panels) tests at 900 m3/h and 1200 m3/h. The cycle-average temperatures exhibited a minor dependence on the radial location. The highest and lowest temperatures were always recorded with the third and fourth thermocouple, respectively. The difference at these two locations was on average 4 °C over the WLTP-Brake and 5.5 °C over the 3h-LACT. In absolute terms, the cycle average temperatures were nearly twice as high over the 3h-LACT (100 to 116 °C) compared to the WLTP-Brake (58.5 to 65.5 °C). This difference reflects the higher frequency of braking events over the 3h-LACT (11.3 events/min) compared to the WLTP-Brake (1.1 events/min), which also includes a large segment of constant speed driving. The separation of the WLTP-Brake cycle in 10 segments with a minimum start temperature of 40 °C also contributes to the much lower cycle-average disc temperatures compared to the 3h-LACT.
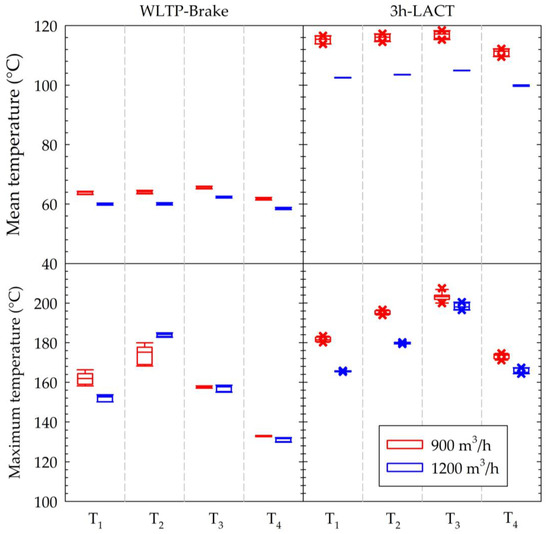
Figure 3.
Cycle-average (top panels) and peak (bottom panels) disc temperatures over the WLTP-Brake (left-hand panels) and 3h Los Angeles City Traffic cycle (3h-LACT) (right-hand panels) cycle at a tunnel flow of 900 m3/h (red boxplots) and 1200 m3/h (blue boxplots) measured with the 4 thermocouples (T1 to T4). Boxplots indicate the median, 25th and 75th percentiles, error bars correspond to the 10th and 90th percentiles, and crosses refer to the 5th and 95th percentiles.
The effect of tunnel flow on the cycle-average disc temperatures was also more pronounced over the 3h-LACT cycle, since the overall higher temperature differences between disc surface and ambient air result in higher convective heat transfer rates. An increase from 900 to 1200 m3/h resulted in an approximately 12 °C reduction in the cycle-average temperature over the 3h-LACT. The corresponding effect over the WLTP-Brake was in the order of 3 °C. This behavior is in agreement with the numerical simulation results of Adamowicz and Grzes [25].
The difference in the peak disc temperatures (bottom panels of Figure 3) achieved over the two cycles was considerably lower. However, the peak temperature showed a large spatial dependence ranging between 131 to 184 °C over the WLTP-Brake and 165 to 203 °C over the 3h-LACT. Interestingly, the radial location at which the highest temperatures were measured differed between the two cycles. The maximum temperature was recorded at the position of the second thermocouple in the case of the WLTP-Brake, while in the case of the 3h-LACT, the maximum temperatures were established at the location of the third thermocouple. This different behavior was systematic and thus cannot be attributed to the development of hot rings, whose radial location changes dynamically as the microstructure in the contact area changes with use [18]. These hot rings could be responsible though for the relatively larger test-to-test variability compared to the cycle-average results (reflected in a wider 25 to 75% percentile region).
One additional distinct difference in the peak temperatures over the two cycles pertains to the effect of the tunnel flow. In the case of the 3h-LACT tests, an increase from 900 m3/h to 1200 m3/h led to a systematic reduction in the peak temperatures from 5 °C (third thermocouple) to 15 °C (first and second thermocouple). Over the WLTP, however, there was no consistent effect, with the 1200 m3/h flow leading to the highest peak temperatures. The repeatability of the peak disc temperatures was also worse over the WLTP-Brake. To a certain extent, this is due to the fact that the peak temperature over the WLTP-Brake always occurs on a single brake event (295th brake event). The specific event corresponds to a deceleration from constant speed cruising at 132.5 km/h and results in approximately 20 °C higher disc temperatures than any other braking event in the cycle (Figure A1 and Figure A2 in Appendix A). Eventually, this boils down to the repeatability of the temperature profile over a single brake event.
3.2. PM Emissions
Figure 4 provides a summary of the gravimetric PM emission results for the burnished brake system. PM2.5 emissions were very similar over the two cycles, ranging between 2.0 and 2.5 mg/km over the WLTP-Brake and between 2.5 and 2.8 mg/km over the 3h-LACT cycle. The latter, however, resulted in ~50% higher PM10 emissions, averaging at 8.7 mg/km compared to 5.6 mg/km over the WLTP-Brake. Accordingly, the average PM10 to PM2.5 ratios increased from 2.8 over the WLTP-Brake to 3.3 over the 3h-LACT. Similar trends were observed in an earlier measurement campaign on a smaller dilution tunnel (operating at 170 m3/h) with the same and a bigger brake system [17]. The results suggest that the mass weighted-size distribution is shifted towards larger sizes over the 3h-LACT cycle.
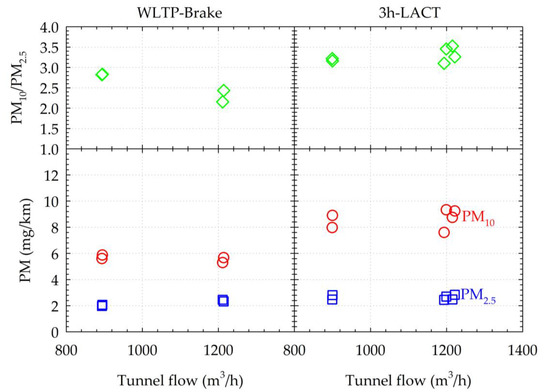
Figure 4.
PM10 (red dots on bottom panels), PM2.5 (blue dots on bottom panels) emissions and ratio of PM10 to PM2.5 (green dots on top panels) over the WLTP-Brake (left-hand panels) and 3h-LACT (right-hand panels) as a function of the tunnel flow employed (horizontal axis).
No clear effect on the PM10 to PM2.5 ratios could be observed when increasing the tunnel flow from 900 m3/h to 1200 m3/h. The ~20% lower ratios over the WLTP-Brake tests are not reproduced over the 3h-LACT tests. The larger PM10 to PM2.5 ratios over 3h-LACT suggest an apparent shift in the mass-weighted size distributions to larger sizes compared to WLTP-Brake. Accordingly, increased losses in the tunnel associated with the increased Stokes number at the elevated tunnel flow should have a stronger effect over the 3h-LACT. This rather points to experimental uncertainties.
3.3. PN Emissions
3.3.1. Burnishing Procedure
A systematic observation with the ECE pads tested was an increase in the PN emissions following the first few executions of the WLTP-Brake cycle on fresh pads. As an example, Figure 5 shows the evolution of cycle-average PN emission rates for both thermally treated (APC) and untreated (UCPC) particles over 12 repetitions of the WLTP-Brake cycle, starting from fresh pads. PN emissions showed a sharp decline over the first three repetitions of the cycle, from 7.5 × 10⁹ km−1 to 3.5 × 10⁹ km−1 for thermally treated samples and from 6.5 × 10⁹ km−1 to 2.5 × 10⁹ km−1 for untreated samples. The 15% higher concentrations measured with the APC reflect an overestimation of the loss compensation following the automotive regulatory method. In cases with a lack of size information, the regulation requires applying a correction for the average losses at 30, 50 and 100 nm. While this is a reasonable assumption for diesel exhaust [26], it is bound to overestimate the losses for aerosol peaking at larger sizes. According to EEPS, the cycle-average geometric mean particles size over these first three repetitions was 140 nm, resulting in an approximately 11% overestimation of losses.
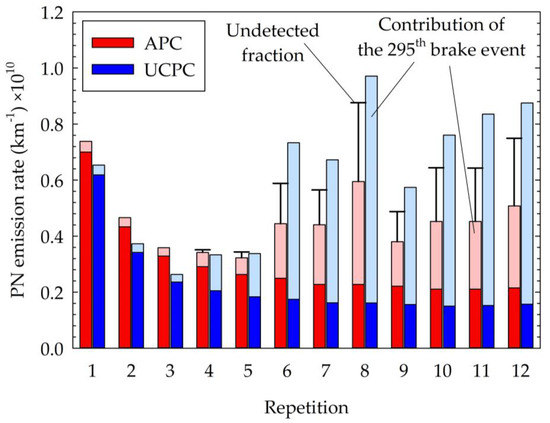
Figure 5.
Evolution of Particle Number (PN) emissions over consecutive WLTP cycles starting from fresh pads (degreening). The combined red/light red bars correspond to APC (thermally treated samples), while the combined blue/light blue bars to ultrafine Condensation Particle Counter (UCPC) (untreated samples). The top (light blue–light red) section of the bars indicate the contribution of particles emitted during the braking event following high-speed cruising at the top cycle speed of 132.5 km/h (295th brake event) to the total particles emitted over the whole cycle. The error bars on the APC results correspond to the undetected fraction due to losses inside the instrument and the larger detection limit of the internal UCPC, calculated from the measured Engine Exhaust Particle Sizer (EEPS) size distributions (Figure 4).
A large increase in PN emissions was observed over the sixth repetition of the WLTP-Brake, especially in the case of the UCPC, where emissions even exceeded those from the first repetition (7.3 × 10⁹ km−1). PN emissions remained at similarly high levels over the remaining tests, showing a relatively large test-to-test variability. An investigation of the real-time traces revealed that this increase was solely due to a sharp increase in PN emissions over the single-brake event following constant-speed driving at 132.5 km/h (295th brake event, the contribution of which is shown in the light red and blue sections of the bars in Figure 5). The PN emissions over the remaining part of the cycle (dark blue and red bars in Figure 5) were found to gradually decrease and eventually stabilize after the first five repetitions of the WLTP-Brake.
Figure 6 compares the real-time PN concentrations and EEPS size distributions over the specific brake event for the 3rd, 5th and 8th repetitions corresponding to Figure 5. The particles emitted during the third repetition of the WLTP-Brake showed a unimodal distribution peaking at 140 nm with APC closely following the UCPC signal. The slower response in the APC is due to the additional delay times in the dilution and thermal treatment sections of the instrument. During the fifth repetition of the WLTP-Brake, three additional emission events were superimposed on the UCPC and APC traces, although they appeared smoothed out in the case of the APC due to the unavoidable additional dead volume in the flow path. The EEPS distributions indicate the formation of a distinct mode peaking at 10 nm over the specific three emission events. Over the eighth (and all subsequent) repetition(s) of the WLTP-Brake, this second mode at 10 nm grows in number and is extended in duration, dominating the number emissions. It should be stressed that the actual concentrations during this event exceeded the 105 cm−3 upper threshold in the single counting mode of the stand-alone UCPC. While still not saturated, it operated in the less accurate photometric mode (±20% nominal accuracy).
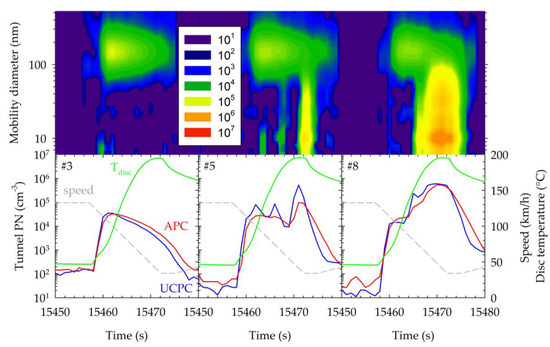
Figure 6.
Top panel: PN size distributions of untreated tunnel samples over the 295th brake event measured with the EEPS over the 3rd (left-most panel), the 5th (middle panel) and 8th (right-most panel) repetition of the WLTP procedure during degreening of fresh pads (Figure 3). Bottom panel: corresponding speed (grey lines), disc temperature (green lines) and real time PN concentration traces for thermally treated (red lines—APC) and untreated (blue lines—UCPC) samples.
Based on the measured EEPS size distributions and the experimentally determined efficiencies of the APC and the internal 10 nm CPC, it was possible to calculate the fraction of the inlet PN concentration that could not be detected with the APC. This was found to increase from ~15% in the fourth repetition to ~45% from the sixth onwards (exact values shown as error bars in Figure 5). By including these undetected fractions, the difference between the APC and UCPC drops to 30%. Considering the extra uncertainties in the UCPC when operating in photometric mode, and its lower cut-off size (2.5 nm) compared to the EEPS (6.4 nm), the results can be considered comparable. Accordingly, the observed nanosized particles appear to be thermally stable at 350 °C of the APC’s catalyzed volatile particle remover. Their nature is therefore different from the nanosized particles observed by Mathissen et al. [15] and Perricone et al. [16] that were effectively removed in a catalytic stripper or thermodenuder operating at 300 °C.
3.3.2. h-LACT
The real-time APC and CPC traces over the 3h-LACT tests suggested also that the majority of particles are emitted over few distinct braking events. As shown in panel b of Figure 7, four braking events between 3000 and 5300 s contribute up to 20–40% each on the total thermally treated PN. The same braking events can contribute up to 25–60% of the total untreated PN (panel c). The thermally untreated samples also revealed some high-emission events at 7150 and 9300 s not seen with the APC, thus suggesting a volatile nature. This particular section of the 3h-LACT cycle was found to promote volatile particle formation in previous studies [15,27].
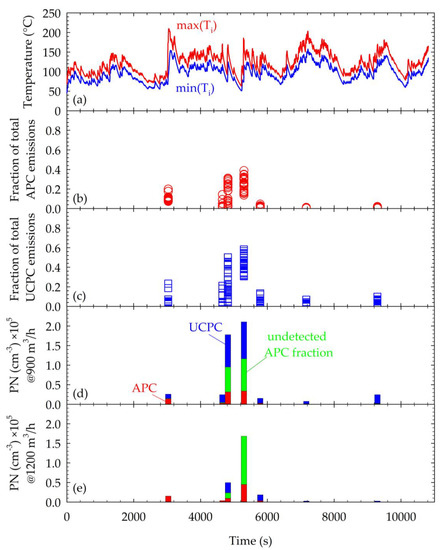
Figure 7.
(a): Real-time traces of the maximum (red-lines) and minimum (blue-lines) temperatures measured from all repetitions of the 3h-LACT procedure and all 4 thermocouples. (b): Contribution of specific braking events on the total PN emissions of thermally treated samples (APC). (c): Contribution of specific braking events on the total PN emissions of untreated samples (CPC). (d,e): Twenty-second average concentrations measured with the APC (red bars) and the CPC (blue bars) over the specific brake events based on all LACT tests at 900 m3/h (d) and at 1200 m3/h (e). Estimated undetected APC fractions based on the corresponding EEPS distributions are shown as green bars.
Figure 8 shows the evolution of the cycle-average thermally treated (red dots) and untreated (blue dots) PN emissions over all 3h-LACT cycle tests performed on the burnished brake disc system. As in the case of the WLTP-Brake tests, the EEPS size distributions allowed for the calculation of the undetected fraction of PN with the APC and are shown as error bars. The difference between the UCPC and the APC far exceeds the calculated undetected fractions within the APC, suggesting the presence of some excess volatile particles in the untreated samples. These volatile emission events are identified with blue bars in panels (d) and (e) of Figure 7.
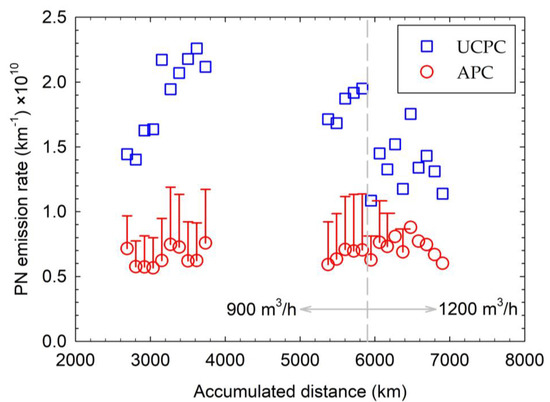
Figure 8.
Evolution of thermally treated (red dots—APC) and untreated (blue dots—UCPC) PN emissions over several repetitions of the 3h-LACT cycle for conditioned pads as a function of the equivalent accumulated distance. The error bars on top of the APC results correspond to the undetected fraction due to losses inside the instrument and the larger detection limit of the internal CPC, based on the measured EEPS size distributions. The first 15 tests were performed at a tunnel flow of 900 m3/h and the last 10 tests at a flow of 1200 m3/h.
In absolute terms, PN emissions measured with the APC (uncorrected for the undetected fraction) ranged between 5.5 and 8.7 × 10⁹ km−1, exhibiting a coefficient of variation of ~12%. The corresponding emission rates of thermally untreated samples ranged between 11 and 23 × 109 km−1, with a 21% coefficient of variation. The change of tunnel flow had no statistically significant effect on the thermally treated PN. On the contrary, the increase in the dilution tunnel flow resulted in a systematic reduction of the thermally untreated PN results by approximately 40%. The effect is more evident when comparing the UCPC to APC ratios, which were reduced from 2.9 ± 0.4 at 900 m3/h to 1.9 ± 0.1 at 1200 m3/h. Given the small size of the particles dominating the PN emissions (with cycle-average geometric mean diameter in the range of 20 to 40 nm), this shift cannot be attributed to the lack of isokinetic sampling in the case of the CPC. This systematic effect rather points towards a dependence of the concentration of the formed volatile particles on the exact flow and dilution conditions in the dilution tunnel. This effect is more clearly shown when comparing the blue bars of panels (d) and (e) in Figure 7, corresponding to the average excess concentrations measured with the CPC over the high emitting events at 900 and 1200 m3/h, respectively.
4. Discussion
The proposed harmonized procedure for brake-wear measurements on a brake dyno relies on the use of an embedded thermocouple to assess whether the developed temperatures are representative of real-world operation. In order to establish representative thresholds on the measured disc temperatures, it is imperative to assess the sensitivity of such measurements on the spatial and temporal evolution of the temperature. An array of four thermocouples was installed at four different radial locations across the contact area of the pads, allowing for such an assessment over two different test cycles. With respect to the temporal resolution, the measurements at all radial locations showed that the temperatures are sharply rising during braking and then drop down at a much slower rate once the brakes are released. The significantly different time constants in the two heat processes are a direct consequence of the large differences between friction power and convection heat rates. Even under the more extreme cooling conditions, the heat transfer coefficient cannot exceed 100 W/(m2K) [25] which corresponds to 1.8 × 10⁴ W/m2 at the highest disc temperatures anticipated over the WLTP-Brake. In comparison, the friction power is in the order of 106 W/m2 [18], i.e., two orders of magnitude higher. Consequently, adjustments of the tunnel flow mainly affect the temperatures over cruising sections, leading to inconsistent effects on the peak disc temperatures (Figure 4, [17]). Thermal radiation is generally considered to be insignificant under normal operating conditions [28,29,30].
The measurements also revealed a spatial distribution of temperatures during the braking phases, with the maximum occurring at a radial location within the contact area. On the one hand, the work done by friction force increases with radial location owing to the increase in the linear velocity and the contact area. On the other hand, the contact area and thus mass and heat capacity increases with radius. The actual geometry of the disc (i.e., slots and or grooves to enhance heat transfer and clear water films) also contributes to the spatial temperature distribution. At the same time, the application of a brake pressure leads to a deformation of the pads, leading to non-uniform pressure, with the effect increasing with the applied pressure. The latter could explain the systematic difference observed in the radial location of the peak disc temperature over the WLTP-Brake (15 bar maximum brake pressure) and the 3h-LACT (20 bar maximum brake pressure). Changes in the local torque transmission due to the expansion of the brake caliper would require higher brake pressure (> 30 bar) [31]. It is, however, also possible that this difference reflects temporal heat transfer effects, since braking over the 3h-LACT is more frequent and occurs at elevated start temperatures.
Superimposed in this macroscopic heat transfer process are microscopic phenomena resulting from the development of hot rings, the radial location of which changes within the contact region of the pads over time. Such hot bands are the manifestation of an uneven distribution of the surface pressure on individual contact areas caused by surface roughness and patch dynamics [18]. The formation and time evolution of such hot rings results in test-to-test variations in individual thermocouple measurements.
When averaged over the entire duration of the cycle, the spatial nonuniformities were marginal, with all thermocouples yielding similar results. The increase in the tunnel flow also resulted in a consistent reduction in the cycle-average temperatures at all radial locations, although the effect was generally small. This behavior is anticipated, considering that the actual duration of braking is only a small fraction of the whole cycle (10% over WLTP-Brake and 20% over 3h-LACT). The cycle-average temperatures would thus correspond to an average of the temperatures during braking and during convective cooling, weighted by their relative duration in the cycle. Spatial nonuniformities are smoothened out during the cooling of the discs, leading to similar results at all radial locations. Moreover, the larger weighting of the convective cooling sections also implies that the mean temperatures better represent the effect of adjusting the tunnel flow. Similarly, the averaging over the duration of the cycle flattens out temporal variations introduced by the formation of hot-rings, leading to more repeatable measurements.
An increase in the tunnel flow from 900 to 1200 m3/h led to a 3.3 °C (from 63.6 °C to 60.3 °C) and a 12.1 °C (114.8 °C to 102.7 °C) reduction in the cycle-average temperature over the WLTP-Brake and the 3h-LACT cycle, respectively. Some dedicated temperature tests suggested a similar change in cycle-average temperature over WLTP-Brake when reducing the tunnel flow from 900 to 400 m3/h. Accordingly, the effect of tunnel flow is expected to be relatively small compared to reported differences between different brake systems with large differences in their heat capacity [17]. Establishing universally applicable thresholds would therefore require careful consideration of the different commercial systems and perhaps differences in the designs between regions.
PM2.5 emission levels were little affected by the test procedure, averaging 2.2 mg/km and 2.6 mg/km over the WLTP-Brake and the 3h-LACT, respectively. The corresponding PM10 emission levels were 2.5 and 3.3 times higher, respectively. The same brake system was tested using the same PM sampling train on a smaller tunnel operating at 170 to 270 m3/h [17] over the last section of the WLTP-Brake. Emission levels following ten repetitions of trip 10 were found to be comparable, with PM2.5 averaging at ~2.6 mg/km and PM10 at ~7.8 mg/km. Similarly, the 3h-LACT yielded the same levels of PM2.5 but distinctly higher PM10 emissions, with the PM10/PM2.5 ratio increasing from 3 to 3.6. Tests with other brake systems suggested that PM emission varies with the size of the brakes, with PM2.5 over the last section of WLTP ranging between 1.5 mg/km and 4.1 mg/km, for two systems having an effective disc radius of 113 mm [32] and 144 mm [17], respectively. The PM10 to PM2.5 ratios for both brake systems (~2.7) were similar to what was observed in the present study.
The consistency in the recovered PM10 to PM2.5 ratios for both tunnels implies that the extracted mass-weighted size distributions were similar, given that the same PM sampling system (and thus transmission efficiency) was employed in the campaigns. The adjustment of the tunnel flows had a modest effect on both tunnels, at least at the flows employed. A simple non-dimensional analysis on the relative importance of gravitational and inertial losses can verify this. The settling velocity for a 10 μm unit-density particle is 0.003 m/s at standard conditions (1 atm and 21 °C). The corresponding average convection velocities ranged between 9.5 m/s (170 m3/h) and 15 m/s (270 m3/h) for the small tunnel (duct diameter of 80 mm) and between 11 m/s (900 m3/h) and 15 m/s (1200 m3/h) for the large tunnel (duct diameter of 175 mm). Therefore, the particle settling distance per meter of horizontal duct is in the order of 0.2 to 0.3 mm, and the associated gravitational losses are calculated to be less than 1% [33]. Accordingly, gravitational losses are not expected to be critical in brake-wear tunnels. All other relevant loss mechanisms (aspiration, flow path changes) are linked to particle inertia. Their relative importance directly depends on the magnitude of the square root of the Stokes number (Stk0.5). The latter equals 0.025×(U0/D)0.5, for a 10 μm particle at ambient conditions, where U0 is the gas velocity in m/s and D is the characteristic size (i.e., duct diameter) in meters. The Stk0.5 number ranges between 0.27 (170 m3/h) and 0.34 (270 m3/h) for the small tunnel and 0.2 (900 m3/h) to 0.23 (1200 m3/h) for the larger one used in the present study. As a reference, the inertial losses of 10 μm particles in a 90° bend for the above duct sizes and flows would be 15% to 23% for 80 mm ducts and 8% to 11% for 175 mm ducts. In fact, a single 90° bend is the major source of losses in the small tunnel [32], while the larger tunnel employed here incorporates two 90° bends resulting eventually in similar losses. Overall, the effect of flow on particle losses is expected to be small at the conditions tested as confirmed by the gravimetric PM measurements. It should be emphasized that the presence of such bends is desirable as they enhance mixing to ensure homogenous concentration at the extraction plane [27,34].
Proper PM measurements require careful consideration of the entire flow path down to the filter. The diameters of the tubing employed to transport samples extracted from the tunnel are much smaller than the tunnel diameter (typically in the 4 to 12 mm range). While the use of exchangeable nozzles offers some flexibility, isokinetic extraction implies similar velocities at the tubing and the tunnel. On the one hand, this means that settling distances remain in the order of tenths of a millimeter per meter of horizontal tubing, but now are comparable to the actual tubing diameter. Similarly, the Stk0.5 number will increase significantly (3-fold increase for a tubing of 1/10th of the tunnel duct diameter for the same velocities). Thus, both gravitational and inertial losses are more critical on the PM sampling train and need to be carefully considered. Both loss mechanisms can be avoided by avoiding bends and using straight vertical tubing [27]. When this is not feasible due to the layout of the tunnel, like in the present study, the sample velocities should be maintained as low as possible. The 5 lpm flow used here corresponds to an Stk0.5 number of 0.3 for a 10 μm particle and a probe diameter of 8 mm. The losses of 10 μm particles in the PM sampling train configuration employed were calculated to be 8% due to gravitational settling in the ~0.4 m horizontal section and ~10% due to inertial impaction on the sampling probe bend.
To our knowledge, this is the first study to reveal the release of thermally stable (at the 350 °C of the catalyst) nanosized particles under non-extreme operating conditions explicitly targeted by the novel WLTP-Brake cycle. These particles were distinctly different from volatile nanoparticles reported in previous studies, which were found to be efficiently removed by the use of either thermodenuders [16] or catalytic strippers [15] at 300 °C, while, the disc temperature as measured with the array of four thermocouples was lower than 200 °C, the temperature on the friction interface can be significantly higher owing to the much smaller mass, thermal conductivity and thermal diffusivity of the brake pads [13] but also due to the thermal resistance caused by wear particles [30,35]. Tribochemical reactions occurring at elevated temperatures and pressures are difficult to describe owing to the complex composition of brake linings [35]. These may include degradation of phenolic resin that can be catalyzed by metal particles [36] but also oxidation of metallic components like iron, copper, brass and tin [37]. The composition of the thermally stable nanoparticles observed in the present study is not known. While the possibility of being organics of low volatility cannot be excluded, it is possible that they have a solid core. Monitoring the release of such thermally stable nanoparticles peaking in the 10 nm size deserves special attention.
The formation of these thermally stable nanoparticles was found to strongly depend on the bedding-in procedure employed to condition the brake system [19]. Figure 9 compares the PN emissions over the last section of the WLTP-Brake cycle, where these particles were released, following different bedding-in procedures for the same brake system. The same brake system was also burnished following 10 repetitions of the last and more aggressive section of the WLTP-Brake, at the same facility in the context of a parallel study conducted at the same period [19]. Subsequent repetitions of the WLTP-Brake cycle showed no excessive PN emissions over the 295th brake event, where the thermally stable nanoparticles were observed. Unfortunately, only the UCPC was available in these tests, so no information is available on their particle size. Similarly, no release of nanosized particles was observed in an earlier study [17], where the same brake system was tested using fresh pads over consecutive repetitions of the last section of the WLTP-Brake. The different emission behavior was consistently observed through several repetitions of the different bedding-in procedures [19]. These findings suggest that the initial transformation of the friction surfaces by the thermal, mechanical and chemical processes occurring during the actual burnishing procedure can strongly affect the particle emission performance of the brake systems. More research is necessary to better understand the nature of emitted nanoparticles and their formation processes.
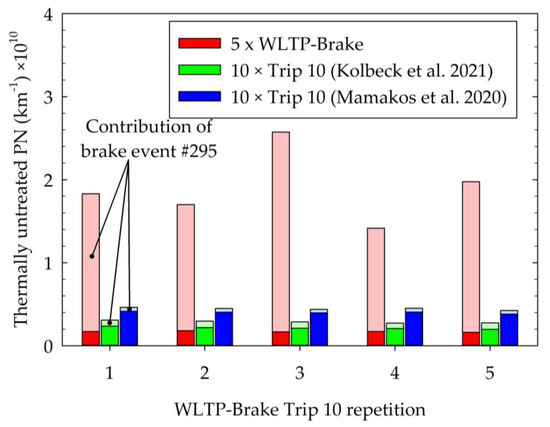
Figure 9.
Evolution of thermally untreated PN emissions over successive repetitions of trip 10 of the WLTP-Brake following conditioning of fresh pads using 5 repetitions of the whole WLTP (red-bars) or 10 repetitions of trip-10 of the WLTP-Brake cycle (green and blue bars). The tests from [19] were performed at the same facility over the same period using the same UCPC. The tests from [17] were performed on a smaller tunnel using a 10 nm full-flow CPC. The contribution of emissions over the 295th brake event where the thermally stable nanoparticles were observed is indicated with light colors.
Volatile nanoparticles like those reported in brake dyno [16,27] and chassis dyno [15] measurements were also observed in the present study when tested under the same test cycle (3h-LACT). In contrast to thermally treated PN, the total PN concentration was found to depend on the operating tunnel flow. More specifically, the excess number of particles measured with the UCPC dropped from 185% (±40%) to 85% (±10%) when increasing the tunnel flow from 900 to 1200 m3/h, when APC concentrations differed by less than 10%. The most probable formation mechanism of such volatile nanoparticles is the nucleation of evaporated organic compounds like phenolic resins typically employed as binders [8]. The nucleation rates and therefore number concentration of volatile nanoparticles will ultimately depend on the developed saturation ratios in the tunnel. Given the complex flow patterns in the vicinity of the brakes, it is expected that the vapor concentrations, the gas temperatures and therefore saturation ratios will exhibit a large spatial distribution. Despite these complexities, an increase in the tunnel flow would lead to overall higher dilutions and thus reduction in vapor concentrations, suppressing nucleation rates. Furthermore, increased tunnel flows can result in reduced temperatures (Figure 3) that could reduce the amount of released vapors, thus further reducing nucleation rates.
The established methodology constitutes a significant step towards the harmonization of brake-wear emission measurements. The comparability between the PM10, PM2.5 and their ratios for tests contacted at dilution tunnels operating at very different flows are very promising results. A potential introduction of the methodology in a regulation would require the careful consideration of some additional performance criteria, with the repeatability and reproducibility of measurements being perhaps the most important. One topic of active research pertains to the establishment of a proper degreening procedure and the definition of appropriate criteria to ensure that the emissions are stabilized. The potential formation of nanosized particles like those observed with the brake-pad tested will result in unstable PN emissions. Owing to their very small size, such nanoparticles will make an insignificant contribution to PM. PM measurements will therefore not detect unstable emissions during the bedding procedure.
While we have not observed the release of volatile particles over the WLTP-Brake procedure, it is not clear whether this is universally applicable. On the one hand, commercially available brake linings show large differences in their chemical formulations, which may also change in the future [38]. Therefore, the volatility of organic compounds can differ between formulations. On the other hand, embedded disc thermocouple measurements do not necessarily capture the temperatures relevant for the release of volatile material, considering the higher temperatures developed on the contact area. Furthermore, homogeneous nucleation is not a binary process, and the rate of nuclei formation depends strongly on the ambient conditions and vapor concentration/chemistry. Adjustments in the tunnel flows and differences between tunnel designs can therefore affect their relative release rates. The systematic reduction observed in the relative amount of volatile PN over the 3h-LACT tests when increasing the tunnel flow is a manifestation of the nonlinear nucleation process. Significantly higher number concentrations of volatile particles were reported in tests of another brake system over the 3h-LACT both on a chassis dyno [15] and on a brake-dyno under more appropriate ventilation conditions [27]. If the total particle population is to be considered, it is important to carefully assess the volatile formation potential over the WLTP-Brake for different brake systems. Thermal treatment of the samples at 300 °C was found to efficiently remove volatile species [16], indicating that the regulated methodology for automotive exhaust would be appropriate. At the same time, it would allow for the identification of the release of thermally stable nanoparticles that might deserve special attention. More research is needed, though, to better understand the nature of both the volatile and thermally stable nanoparticles in order to assess the potential need for amendments (e.g., the need for a catalytic stripper).
The mode of the number-weighted brake-wear size distribution is generally reported to lie in the submicron size range [32,38]. Therefore, an upper limit of 2.5 μm should be sufficient. Elevated number concentrations are generally associated with the release of nanosized particles. Given the relatively large size of brake-wear particles, it is advisable to implement a pre-classifier to reduce the risk of clogging. This risk is considerably higher compared to exhaust measurements owing to the significantly larger size of brake-wear particles. As such, the regulatory requirement for full-flow CPC designs that would allow direct monitoring of the flow entering the detector optics becomes more relevant. The flow split inside the UCPC employed in the present study was misadjusted due to contamination, despite the use of a 1.5 μm impactor at its inlet. The lowest cut-off size of full-flow CPCs is in the range of 6 to 7 nm and can be extended at smaller sizes by means of particle magnifiers [9]. However, calibration at sizes below 10 nm becomes very challenging, while the lowest detection size will be substantially confined if a dilution stage will be required, owing to unavoidable diffusional losses.
The observed release of nanosized particles over the WLTP-Brake led to tunnel PN concentrations up to 1,000,000 cm−3 as measured with the regulated exhaust 10 nm method at a tunnel flow of 1200 m3/h. Such concentrations are far exceeding the measurement range of commercial full flow CPCs in single count mode (typically 50,000 to 100,000 cm−3). Thus, a minimum dilution of at least 10:1 is required to accurately quantify the PN concentrations. An introduction of a dilution stage necessitates the characterization of size-dependent particle losses as well as an agreed approach for their compensation. The approach followed in exhaust PN regulation involving the quantification of Particle Concentration Reduction Factors (PCRF) is well established and can be transferred. Similarly, the size ranges of 15, 30, 50 and 100 nm are suitable for capturing diffusional losses in diluters, also considering the limitations in the production of monodisperse sizes. However, the relevance of an average compensation at 30, 50 and 100 nm needs to be assessed, as it was established on the basis of typical diesel exhaust number-weighted distributions peaking at approximately 60 to 70 nm [26]. The number-weighted distribution of brake-wear particles is known to exhibit a mode above 100 nm, with a second mode in the sub-20 nm range occurring at specific events that can dominate in number.
5. Conclusions
The use of embedded disc thermocouples was found to offer a reliable means of monitoring the cycle-average temperatures developed over the test. By smoothing out spatial distributions of the developed temperature profiles during braking, the cycle averaging allows for reliable quantification of the efficiency of tunnel flow in convective cooling of the discs, although the effect was relatively small over the WLTP-Brake cycle. PM emissions were found to be very similar to earlier measurements of the same brake system using the same PM sampling train on a smaller dilution tunnel. Nondimensional analysis revealed that the design of the sampling train is more critical for proper PM10 measurements owing to the larger Stokes numbers. The PN results suggested the release of thermally stable nanosized particles over both the WLTP-Brake and 3h-LACT cycles, the formation of which is linked to the bedding-in procedure applied. More research is needed to understand their nature and formation mechanism. Volatile nanoparticles were observed over the more demanding 3h-LACT cycle, with their emission rates decreasing with increasing tunnel flow and thus dilution. This emission behavior is consistent with the reduced nucleation rates expected by lowering the vapor concentration, suggesting released organic compounds as their origin.
Author Contributions
Conceptualization, A.M., M.A. and M.B.; methodology, A.M., M.A., K.K., T.S. and M.B.; software, T.S. and M.B.; validation, K.K., T.S. and M.B.; formal analysis, A.M.; investigation, A.M.; resources, T.S. and M.B.; data curation, A.M.; writing—original draft preparation, A.M.; writing—review and editing, A.M. and K.K.; visualization, A.M.; supervision, M.B.; project administration, M.B.; funding acquisition, M.B. All authors have read and agreed to the published version of the manuscript.
Funding
This research received no external funding.
Data Availability Statement
The data that support the findings of this study are available from the corresponding author, A.M., upon reasonable request.
Conflicts of Interest
A.M. and M.A. are employed by AVL List GmbH, which supplies aerosol instrumentation. The rest of the authors declare no conflict of interest.
Appendix A
Figure A1 and Figure A2 illustrate the average speed and temperature profiles measured with the four thermocouples over the WLTP-Brake and the 3h-LACT cycles.

Figure A1.
Speed (grey lines) and average temperature traces at 900 m3/h (red lines) and 1200 m3/h (blue lines) tunnel flow recorded with each of the 4 thermocouples over the WLTP-Brake test cycle. Dashed vertical lines are used to separate the 10 sections (trips) of the cycle.
Figure A1.
Speed (grey lines) and average temperature traces at 900 m3/h (red lines) and 1200 m3/h (blue lines) tunnel flow recorded with each of the 4 thermocouples over the WLTP-Brake test cycle. Dashed vertical lines are used to separate the 10 sections (trips) of the cycle.


Figure A2.
Speed (grey lines) and average temperature traces at 900 m3/h (red lines) and 1200 m3/h (blue lines) tunnel flow recorded with each the 4 thermocouples over the 3h-LACT cycle.
Figure A2.
Speed (grey lines) and average temperature traces at 900 m3/h (red lines) and 1200 m3/h (blue lines) tunnel flow recorded with each the 4 thermocouples over the 3h-LACT cycle.

References
- Pope, C.A.; Dockery, D.W. Health effects of fine particulate air pollution: Lines that connect. J. Air Waste Manag. Assoc. 2006, 56, 709–742. [Google Scholar] [CrossRef]
- Pant, P.; Harrison, R.M. Estimation of the contribution of road traffic emissions to particulate matter concentrations from field measurements: A review. Atmos. Environ. 2013, 77, 78–97. [Google Scholar] [CrossRef]
- Harrison, R.M.; Jones, A.M.; Gietl, J.; Yin, J.; Green, D.C. Estimation of the contributions of brake dust, tire wear, and resuspension to nonexhaust traffic particles derived from atmospheric measurements. Environ. Sci. Technol. 2012, 46, 6523–6529. [Google Scholar] [CrossRef]
- Nagpure, A.S.; Gurjar, B.R.; Kumar, V.; Kumar, P. Estimation of exhaust and non-exhaust gaseous, particulate matter and air toxics emissions from on-road vehicles in Delhi. Atmos. Environ. 2016, 127, 118–124. [Google Scholar] [CrossRef]
- Amato, F.; Cassee, F.R.; Denier van der Gon, H.A.C.; Gehrig, R.; Gustafsson, M.; Hafner, W.; Harrison, R.M.; Jozwicka, M.; Kelly, F.J.; Moreno, T.; et al. Urban air quality: The challenge of traffic non-exhaust emissions. J. Hazard. Mater. 2014, 275, 31–36. [Google Scholar] [CrossRef]
- Evangeliou, N.; Grythe, H.; Klimont, Z.; Heyes, C.; Eckhardt, S.; Lopez-Aparicio, S.; Stohl, A. Atmospheric transport is a major pathway of microplastics to remote regions. Nat. Commun 2020, 11, 3381. [Google Scholar] [CrossRef]
- Liati, A.; Schreiber, D.; Eggenschwiler, P.D.; Dasilva, Y.A.R.; Spiteri, A.C. Electron microscopic characterization of soot particulate matter emitted by modern direct injection gasoline engines. Combust. Flame 2016, 166, 307–315. [Google Scholar] [CrossRef]
- Kukutschová, J.; Moravec, P.; Tomášek, V.; Matějka, V.; Smolík, J.; Schwarz, J.; Seidlerová, J.; Šafářová, K.; Filip, P. On airborne nano/micro-sized wear particles released from low-metallic automotive brakes. Environ. Pollut. 2011, 159, 998–1006. [Google Scholar] [CrossRef] [PubMed]
- Nosko, O.; Vanhanen, J.; Olofsson, U. Emission of 1.3–10 nm airborne particles from brake materials. Aerosol Sci. Technol. 2017, 51, 91–96. [Google Scholar] [CrossRef]
- Sanders, P.G.; Xu, N.; Dalka, T.M.; Maricq, M.M. Airborne brake wear debris: Size distributions, composition, and a comparison of dynamometer and vehicle tests. Environ. Sci. Technol. 2003, 37, 4060–4069. [Google Scholar] [CrossRef]
- Hagen, F.H.F.Z.; Mathissen, M.; Grabiec, T.; Hennicke, T.; Rettig, M.; Grochowicz, J.; Vogt, R.; Benter, T. On-road vehicle measurements of brake wear particle emissions. Atmos. Environ. 2019, 217, 116943. [Google Scholar] [CrossRef]
- Mathissen, M.; Grochowicz, J.; Schmidt, C.; Vogt, R.; Hagen, F.H.F.Z.; Grabiec, T.; Steven, H.; Grigoratos, T. A novel real-world braking cycle for studying brake wear particle emissions. Wear 2018, 414–415, 219–226. [Google Scholar] [CrossRef]
- Day, A. Braking of Road Vehicles; Elsevier: New York, NY, USA, 2014; ISBN 978-0-12-397314-6. [Google Scholar]
- Verma, P.C.; Ciudin, R.; Bonfanti, A.; Aswath, P.; Straffelini, G.; Gialanella, S. Role of the friction layer in the high-temperature pin-on-disc study of a brake material. Wear 2016, 346, 56–65. [Google Scholar] [CrossRef]
- Mathissen, M.; Grigoratos, T.; Lahde, T.; Vogt, R. Brake wear particle emissions of a passenger car measured on a chassis dynamometer. Atmosphere 2019, 10, 556. [Google Scholar] [CrossRef]
- Perricone, G.; Matĕjka, V.; Alemani, M.; Wahlström, J.; Olofsson, U. A Test stand study on the volatile emissions of a passenger car brake assembly. Atmosphere 2019, 10, 263. [Google Scholar] [CrossRef]
- Mamakos, A.; Arndt, M.; Hesse, D.; Hamatschek, C.; Augsburg, K. Comparison of Particulate Matter and Number Emissions from a Floating and a Fixed Caliper Brake System of the Same Lining Formulation. Available online: https://www.sae.org/publications/technical-papers/content/2020-01-1633/ (accessed on 12 March 2021).
- Ostermeyer, G.P. On the dynamics of the friction coefficient. Wear 2003, 254, 852–858. [Google Scholar] [CrossRef]
- Kolbeck, K.; Bernnhard, M.; Schröder, T.; Hesse, D.; Augsburg, K. Influence of the run-in methodology on the particle number emission of brakes. In Proceedings of the Eurobrake 2021 Conference, Mainz, Germany, 17−21 May 2021. [Google Scholar]
- Mathissen, M.; Evans, C. Lowbrasys brake wear cycle-3h LACT. Available online: https://data.mendeley.com/datasets/4cgs6myx9d/1 (accessed on 12 March 2021).
- UNECE. Regulations No. 83 Uniform provisions concerning the approval of vehicles with regard to the emission of pollutants according to engine fuel requirements. Available online: https://op.europa.eu/en/publication-detail/-/publication/2f8f0ce5-66fb-4a38-ae68-558ae1b04a5f/language-en (accessed on 12 March 2021).
- IWG PMP GRPE-81-10-(PMP) Revisions to ECE/TRANS/WP.29/GRPE/2020/14: Sub 23 nm PN Measurements 2020. Available online: https://unece.org/DAM/trans/doc/2020/wp29grpe/GRPE-81-10e.pdf (accessed on 12 March 2021).
- Wilson, J.C.; Hyun, J.H.; Blackshear, E.D. The function and response of an improved stratospheric condensation nucleus counter. J. Geophys. Res. 1983, 88, 6781–6785. [Google Scholar] [CrossRef]
- Schwelberger, M.; Mamakos, A.; Fierz, M.; Giechaskiel, B. Experimental assessment of an electrofilter and a tandem positive-negative corona charger for the measurement of charged nanoparticles formed in selective catalytic reduction systems. Appl. Sci. 2019, 9, 1051. [Google Scholar] [CrossRef]
- Adamowicz, A.; Grzes, P. Influence of convective cooling on a disc brake temperature distribution during repetitive braking. Appl. Therm. Eng. 2011, 31, 2177–2185. [Google Scholar] [CrossRef]
- Kittelson, D.B. Engines and nanoparticles. J. Aerosol Sci. 1998, 29, 575–588. [Google Scholar] [CrossRef]
- Hagen, F.H.F.Z.; Mathissen, M.; Grabiec, T.; Hennicke, T.; Rettig, M.; Grochowicz, J.; Vogt, R.; Benter, T. Study of brake wear particle emissions: Impact of braking and cruising conditions. Environ. Sci. Technol. 2019, 53, 5143–5150. [Google Scholar] [CrossRef] [PubMed]
- Talati, F.; Jalalifar, S. Investigation of heat transfer phenomena in a ventilated disk brake rotor with straight radial rounded vanes. J. Appl. Sci. 2008, 8, 3583–3592. [Google Scholar] [CrossRef]
- Wallis, L.; Leonardi, E.; Milton, B.; Joseph, P. Air flow and heat transfer in ventilated disc brake rotors with diamond and tear-drop pillars. Numer. Heat Transf. Part A Appl. 2002, 41, 643–655. [Google Scholar] [CrossRef]
- Talati, F.; Jalalifar, S. Analysis of heat conduction in a disk brake system. Heat Mass Transf. 2009, 45, 1047–1059. [Google Scholar] [CrossRef]
- Heimann, S. Methodische Ansätze zur Untersuchung des Restbremsmomentes von Scheibenbremsen; Technische Universität Ilmenau: Ilmenau, Germany, 2012. [Google Scholar]
- Mamakos, A.; Arndt, M.; Hesse, D.; Augsburg, K. Physical characterization of brake-wear particles in a PM10 dilution tunnel. Atmosphere 2019, 10, 639. [Google Scholar] [CrossRef]
- Kulkarni, P.; Baron, P.A.; Willeke, K. Aerosol Measurement: Principles, Techniques, and Applications, 3rd ed.; Kulkarni, P., Baron, P.A., Willeke, K., Eds.; Wiley: Hoboken, NJ, USA, 2011; ISBN 978-0-470-38741-2. [Google Scholar]
- Perricone, G.; Wahlström, J.; Olofsson, U. Towards a test stand for standardized measurements of the brake emissions. Proc. Inst. Mech. Eng. Part D J. Automob. Eng. 2016, 230, 1521–1528. [Google Scholar] [CrossRef]
- Matějka, V.; Lu, Y.; Matějková, P.; Smetana, B.; Kukutschová, J.; Vaculík, M.; Tomášek, V.; Zlá, S.; Fan, Y. Possible stibnite transformation at the friction surface of the semi-metallic friction composites designed for car brake linings. Appl. Surf. Sci. 2011, 258, 1862–1868. [Google Scholar] [CrossRef]
- Křístková, M.; Filip, P.; Weiss, Z.; Peter, R. Influence of metals on the phenol–formaldehyde resin degradation in friction composites. Polym. Degrad. Stab. 2004, 84, 49–60. [Google Scholar] [CrossRef]
- Cristol-Bulthé, A.L.; Desplanques, Y.; Degallaix, G.; Berthier, Y. Mechanical and chemical investigation of the temperature influence on the tribological mechanisms occurring in OMC/cast iron friction contact. Wear 2008, 264, 815–825. [Google Scholar] [CrossRef]
- Grigoratos, T.; Martini, G. Brake wear particle emissions: A review. Environ. Sci. Pollut. Res. 2015, 22, 2491–2504. [Google Scholar] [CrossRef] [PubMed]


Publisher’s Note: MDPI stays neutral with regard to jurisdictional claims in published maps and institutional affiliations. |
© 2021 by the authors. Licensee MDPI, Basel, Switzerland. This article is an open access article distributed under the terms and conditions of the Creative Commons Attribution (CC BY) license (http://creativecommons.org/licenses/by/4.0/).