Article

Isotopic Composition of Precipitation in a Southeastern Region of Brazil during the Action of the South Atlantic Convergence Zone

1
National Institute for Space Research (INPE), São José dos Campos 12227-010, Brazil
2
Academic Unit of Atmospheric Sciences, Federal University of Campina Grande (UFCG), Campina Grande 58428-830, Brazil
3
Environmental Studies Center, São Paulo State University, Rio Claro 13.506-900, Brazil
*
Author to whom correspondence should be addressed.
Atmosphere 2021, 12(4), 418; https://doi.org/10.3390/atmos12040418
Submission received: 25 February 2021 / Revised: 19 March 2021 / Accepted: 20 March 2021 / Published: 24 March 2021
(This article belongs to the Section Meteorology)

Abstract

:
The use of stable isotopes of hydrogen and oxygen is a tool widely used to trace water paths along the hydrological cycle, providing support for understanding climatic conditions in different spatial scales. One of the main synoptic scale events acting in southeastern Brazil is the South Atlantic Convergence Zone (SACZ), which causes a large amount of precipitation from southern Amazonia to southeastern Brazil during the southern summer. In order to determine the isotopic composition of precipitation during the action of SACZ in São Francisco Xavier in southeastern Brazil, information from the Weather Forecasting and Climate Studies Center of the National Institute for Space Research (CPTEC) was used regarding SACZ performance days, the retrograde trajectories of the HYSPLIT model, and images from the GOES-16 satellite, in addition to the non-parametric statistical tests by Spearman and Kruskal–Wallis. A high frequency of air mass trajectories from the Amazon to southeastern Brazil was observed when the SACZ was operating. During the SACZ events, the average isotopic composition of precipitation was more depleted, with a δ18O of −9.9‰ (±2.1‰), a δ2H of −69.3‰ (±17.9‰), and d-excess of 10.1‰ (±4.0‰). When disregarding the SACZ performance, the annual isotopic composition can present an enrichment of 1.0‰ for δ18O and 8.8‰ for the δ2H. The long-term monitoring of trends in the isotopic composition of precipitation during the SACZ events can assist in indicating the evapotranspiration contribution of the Amazon rainforest to the water supply of southeastern Brazil.

1. Introduction

Stable isotopes of hydrogen and oxygen are one of the main ecohydrological techniques for tracking water during its cycle, acting as a kind of “water fingerprint” [1]. This tracking is only possible due to the fractionation process between light and heavy isotopes of hydrogen and oxygen [2]. Different associations between the stable isotopes of hydrogen and oxygen result in the most varied combinations of water molecules (isotopologues), enabling tracking through the atomic mass difference of molecules [3].
The growing number of scientific studies focused on the use of isotopes shows the importance in different contexts, such as in studies related to climate change, evapotranspiration, surface runoff, and others [4,5,6]. One of the applications of the use of isotopes is to determine their composition during precipitation, more specifically with the performance of synoptic scale events, enabling the tracking of moisture that contributes to their formation [7,8,9]. In addition, this application can serve as a useful tool for validating atmospheric models [10] and for a better understanding of isotopic values in the tropical region [11].
The synoptic scale precipitation events have distinct isotopic characteristics, depending on the type of scale system and the region in which they operate [7,12]. The South Atlantic Convergence Zone (SACZ) is one of the main synoptic systems operating in Brazil [13], being associated with the highest volume of precipitation commonly recorded in the Midwest and Southeast regions of the country, between October and March. This system is characterized by a region of high connectivity, positioned in the direction NW–SE of Brazil, from the south of the Amazon to the South Atlantic Ocean [14,15,16]. According to Escobar [17] and Quadro et al. [18], to characterize the occurrence of the SACZ, it is necessary to respect some classic criteria in the region, such as (1) the configuration of a high pressure system over Bolivia (Bolivian High, BH) at high levels of the atmosphere (250 hPa), and a low pressure system over northeastern Brazil (Upper Level Cyclonic Vortices, ULCV); (2) at medium levels of the atmosphere (500 hPa), negative Omega values (expressive convective activity); (3) at the surface level, the passage of a frontal system, usually stationary in southeastern Brazil, assisting the convergence of humidity coming from the Amazon; and (4) the persistence of these main atmospheric patterns, for a minimum period of 4 days.
Acting on a large spatial scale (~2000 km), the SACZ is paramount in recharging large aquifers [19], providing support to water supply for vegetation, animal watering, population supply, and industrial use, among others. Its area of activity supplies one of the main producing regions of agricultural commodities, such as soybeans (Glycine max (L.) Merr.), corn (Zea mays L.), and sugar cane (Saccharum officinarum L.) [20]. Therefore, the constant monitoring over the origin of the water that provides support for economic, social, and environmental activities in this region is important. Identifying the isotopic signature of precipitation exactly meets this need.
Although Gastmans et al. [21] and Santos et al. [22] have identified that during the performance of the SACZ the precipitation showed more depleted isotopic values in southeastern Brazil, the focus of these surveys was not exclusive to SACZ monitoring. This means that there are no reports on scientific works that have investigated in particular the monitoring of the SACZ. The differential of this research is precisely to present a more refined monitoring of this important synoptic mechanism acting in Brazil.
Works such as these show that isotopic records of precipitation on a synoptic scale present characteristic signs. Incorporating this information into the literature is a valuable resource in the scientific community, mainly in regions lacking data and isotopic precipitation information, as in the case of South America [11]. Thus, the objective of this research was to determine the isotopic composition of precipitation during the performance of the SACZ in São Francisco Xavier, southeastern Brazil.

2. Materials and Methods
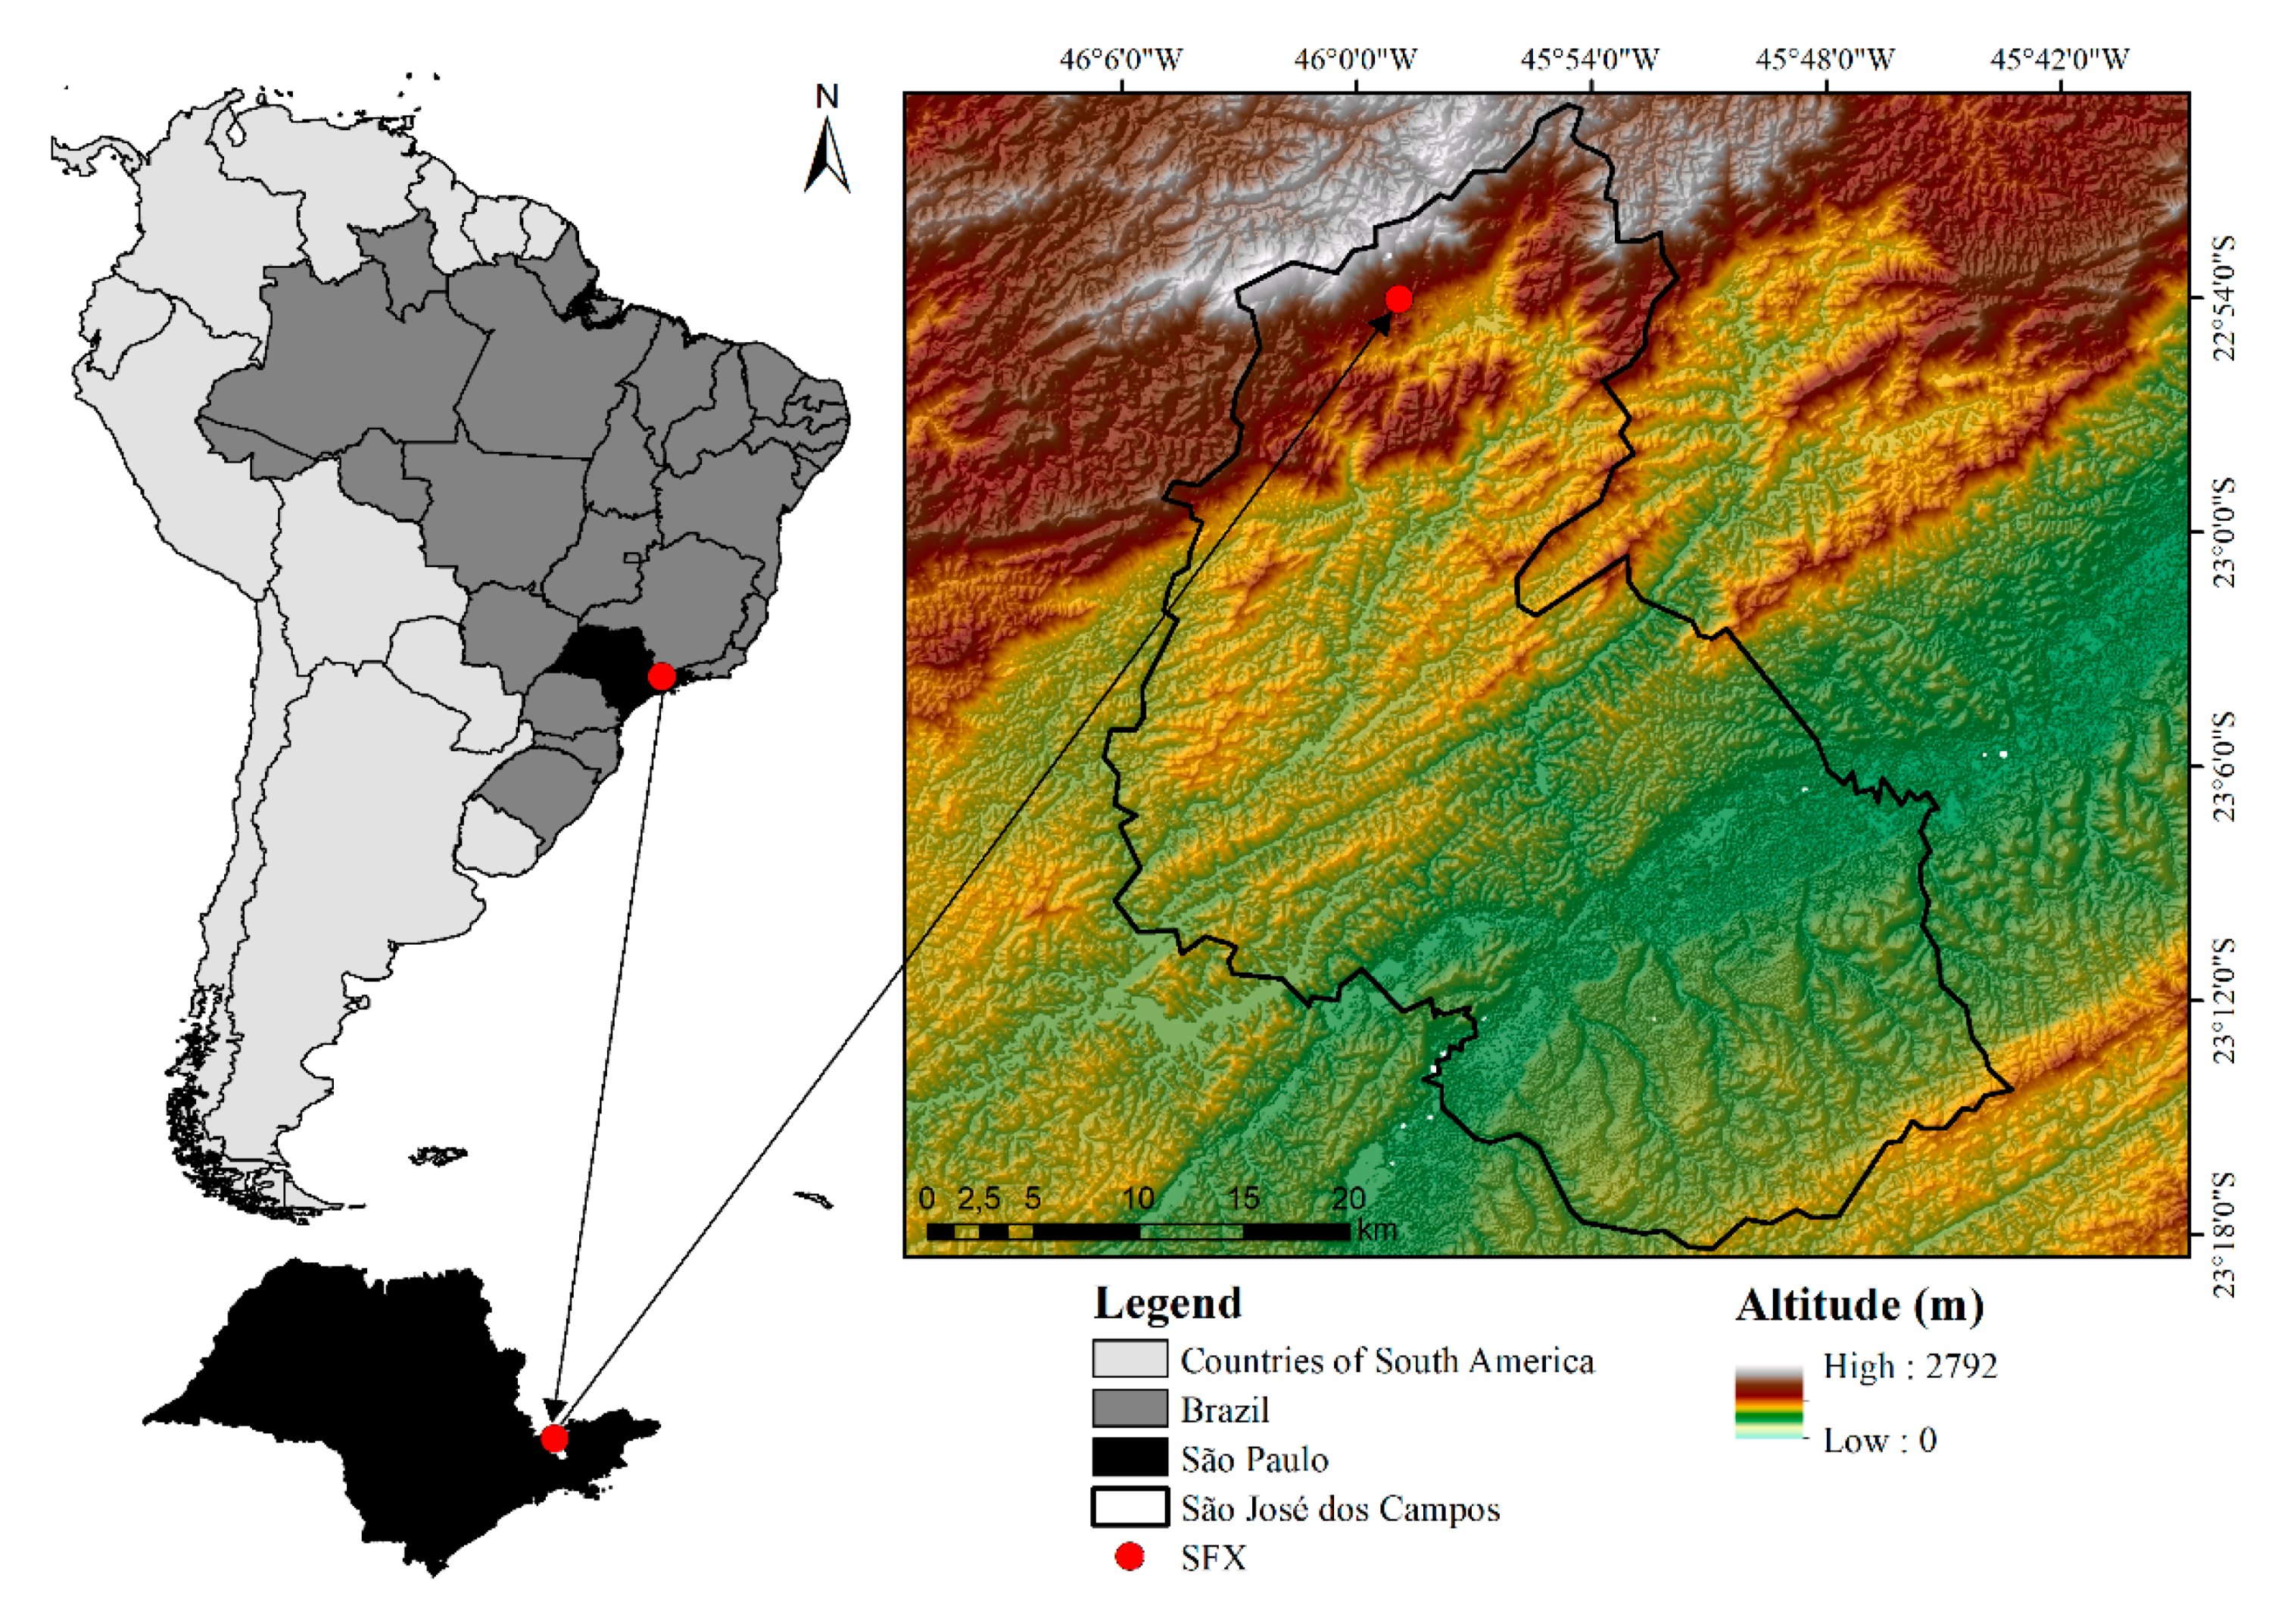
2.1. Study Region

This study was performed in the Ecohydrologic Experimental Station of São Francisco Xavier (EES-SFX) located in São Francisco Xavier (SFX), a district of the city of São José dos Campos (SP), approximately 1100 m above average sea level (Figure 1). The EES-SFX comprises the experimental branch of the Laboratory of Isotopic Ecohydrology (LabEcoh) of the National Institute for Space Research (INPE). The region is characterized by the presence of remnants of the Atlantic forest [23] and is one of the slopes of the Paraíba do Sul River Basin.
According to the Köppen climate classification, the climate in the region is defined as Cwa, humid subtropical with dry winters and hot summers [24], with the hottest month in February (average 23.9 °C) and the coldest month in July (average 16.4 °C) [25]. The annual rainfall is ~1885.0 mm (1950–2000, weather station code 02245050), when the rainy period occurs between October and March, presenting 78.3% (1475.9 mm) of precipitation during the year, and the dry period occurring between April and September, with 21.7% (409.1 mm) of annual precipitation [26].
In the study region, there are several meteorological systems that promote precipitation events. For example, during the austral summer, mesoscale convective systems occur, as well as isolated storms, beyond the performance of the SACZ, capable of generating deep convection and large amount of precipitation [27]. On the other side, during the austral winter, the amount of precipitation is low due to the performance of the South Atlantic Subtropical High [28], a high pressure system that inhibits cloud formation. During this period, precipitation occurs mainly due to the passage of cold fronts that can overcome this block with approximately 3.3 events each month [29].

2.2. Samples Collection

Water samples from precipitation events (≥1 mm) that occurred in SFX were collected from February 2019 to February 2020, totaling 178 samples in 124 days with precipitation. The rain collector used was a “funnel ball” type [30] and followed the technical standards indicated by Global Network of Isotopes in Precipitation [31]. This collector had the funnel attached to a glass jar, properly covered with a metallic adhesive tape, and a high-density polyethylene plastic bag attached to the bottom of the funnel to reduce any type of evaporation in addition to facilitating collection and storage. After the end of each precipitation event, the collected samples were immediately stored in a refrigerator at a temperature of ~4 °C, subsequently transferred to 1.5 mL glass vials for isotopic analysis. The process of transferring the water to the flask occurred through a syringe with a needle, coupled to a hydrophilic PTFE filter, with pore diameter of 0.22 µm, able to eliminate possible impurities and microorganisms.

2.3. Isotopic Analysis

All precipitation samples were analyzed at the LabEcoh/INPE in São José dos Campos, Brazil. The measurements were performed on a Picarro Cavity Ring-Down Spectrometer, L2130-I Model. The standards used were those made available by the manufacturer, considering Zero (δ18O 0.3 ± 0.2‰; δ2H 1.8 ± 0.9‰), Mid (δ18O −20.6 ± 0.2‰; δ2H −159.0 ± 1.3‰) and Depl (δ18O −29.6 ± 0.2‰; δ2H −235.0 ± 1.8‰), organized for analysis every 10 samples, enabling the correction of any deviations [32]. Each sample, as well as the standards, was analyzed six times, but the first three analyzes were discarded to avoid the memory effect, and the last three samples were used to calculate the arithmetic mean, as a final result. This routine ensures greater precision to the analyzed data [33]. The analytical precision was ±0.08‰ for oxygen and ±0.9‰ for hydrogen.
Isotopic ratios were defined in terms of ‰ (per mile) using the notation δ, relative to Vienna Standard Mean Ocean Water (V-SMOW) (Equation (1)),
δ   = R s a m p l e R s t a n d a r d     1 ,
where R s a m p l e and R s t a n d a r d are ratios between heavy and light isotopes (2H/1H or 18O/16O) in the collected water and in the standard, respectively [34].
Deuterium excess (d-excess) was calculated as shown in Equation (2).
d - excess   = δ 2 H     8   δ 18 O ,
To calculate isotopes monthly averages and also the SACZ events, the weighted average by the amount of precipitation was used, as shown in Equation (3):
δ w ¯   =   i = 1 n P i δ i i = 1 n P i ,
where δ w ¯ informs the weighted average value of the isotopic ratio over the amount of precipitation, P i represents the amount of precipitation in the event (mm), δ i is the isotopic ratio of an individual sample (‰), and n represents the number of collections.

2.4. SACZ Events Determination and Meteorological Data

To determine the performance and positioning of the SACZ during precipitation collections, images from Geostationary Operational Environmental Satellite (GOES-16) in the infrared field [35], with a 10-min time interval, were used together with daily bulletins provided by the Weather Forecasting and Climate Studies Center of the National Institute for Space Research (CPTEC), with a 6-h time interval [36]. Surface meteorological data (precipitation uncertainty of ±4.0%, ±1 rainfall between 0.2 and 50.0 mm per hour and ±5.0%, ±1 rainfall between 50.0 and 100.0 mm per hour; temperature-uncertainty of ±0.21 °C; relative humidity-uncertainty of ±2.5%) were obtained through a weather station HOBO U30 with standard ONSET sensors, installed exactly next to the precipitation collection site, with a data logging frequency of every 5 min.

2.5. Air Mass Sources

To identify the retrograde trajectory of main air masses that contribute to precipitation events, the Hybrid Single-Particle Lagrangian Integrated Trajectory Model (HYSPLIT) was used [37]. This model is widely used in studies involving precipitation stable isotopes [38,39,40]. For each time the precipitation started, retrograde trajectories of 10 days (240 h) were calculated, at an altitude of 2,000 m, using the meteorological data set from Global Data Assimilation System (GDAS), with a 1° × 1° (1° ~111 km) spatial resolution [41]. Due to the data resolution and uncertainties inherent to the model, the retrograde trajectory is just a general approximation of the air mass origin because interactions with local humidity can occur and cannot be considered by the trajectories [38].

2.6. Statistical Analysis

As the Shapiro–Wilk normality test [42] revealed the data were not extracted from a normal distribution (p-value < 0.001), nonparametric statistical tests were adopted. To correlate the meteorological variables with the isotopic signal of precipitation, the Spearman test was used [43]. The requirements and interpretation for the Spearman Test are given in the Table 1 [44]. The Kruskal–Wallis test was adopted to verify the existence of statistically significant differences between the isotopic values of δ18O, δ2H, and d-excess [9]. The significance level adopted for the tests was 0.05.

3. Results

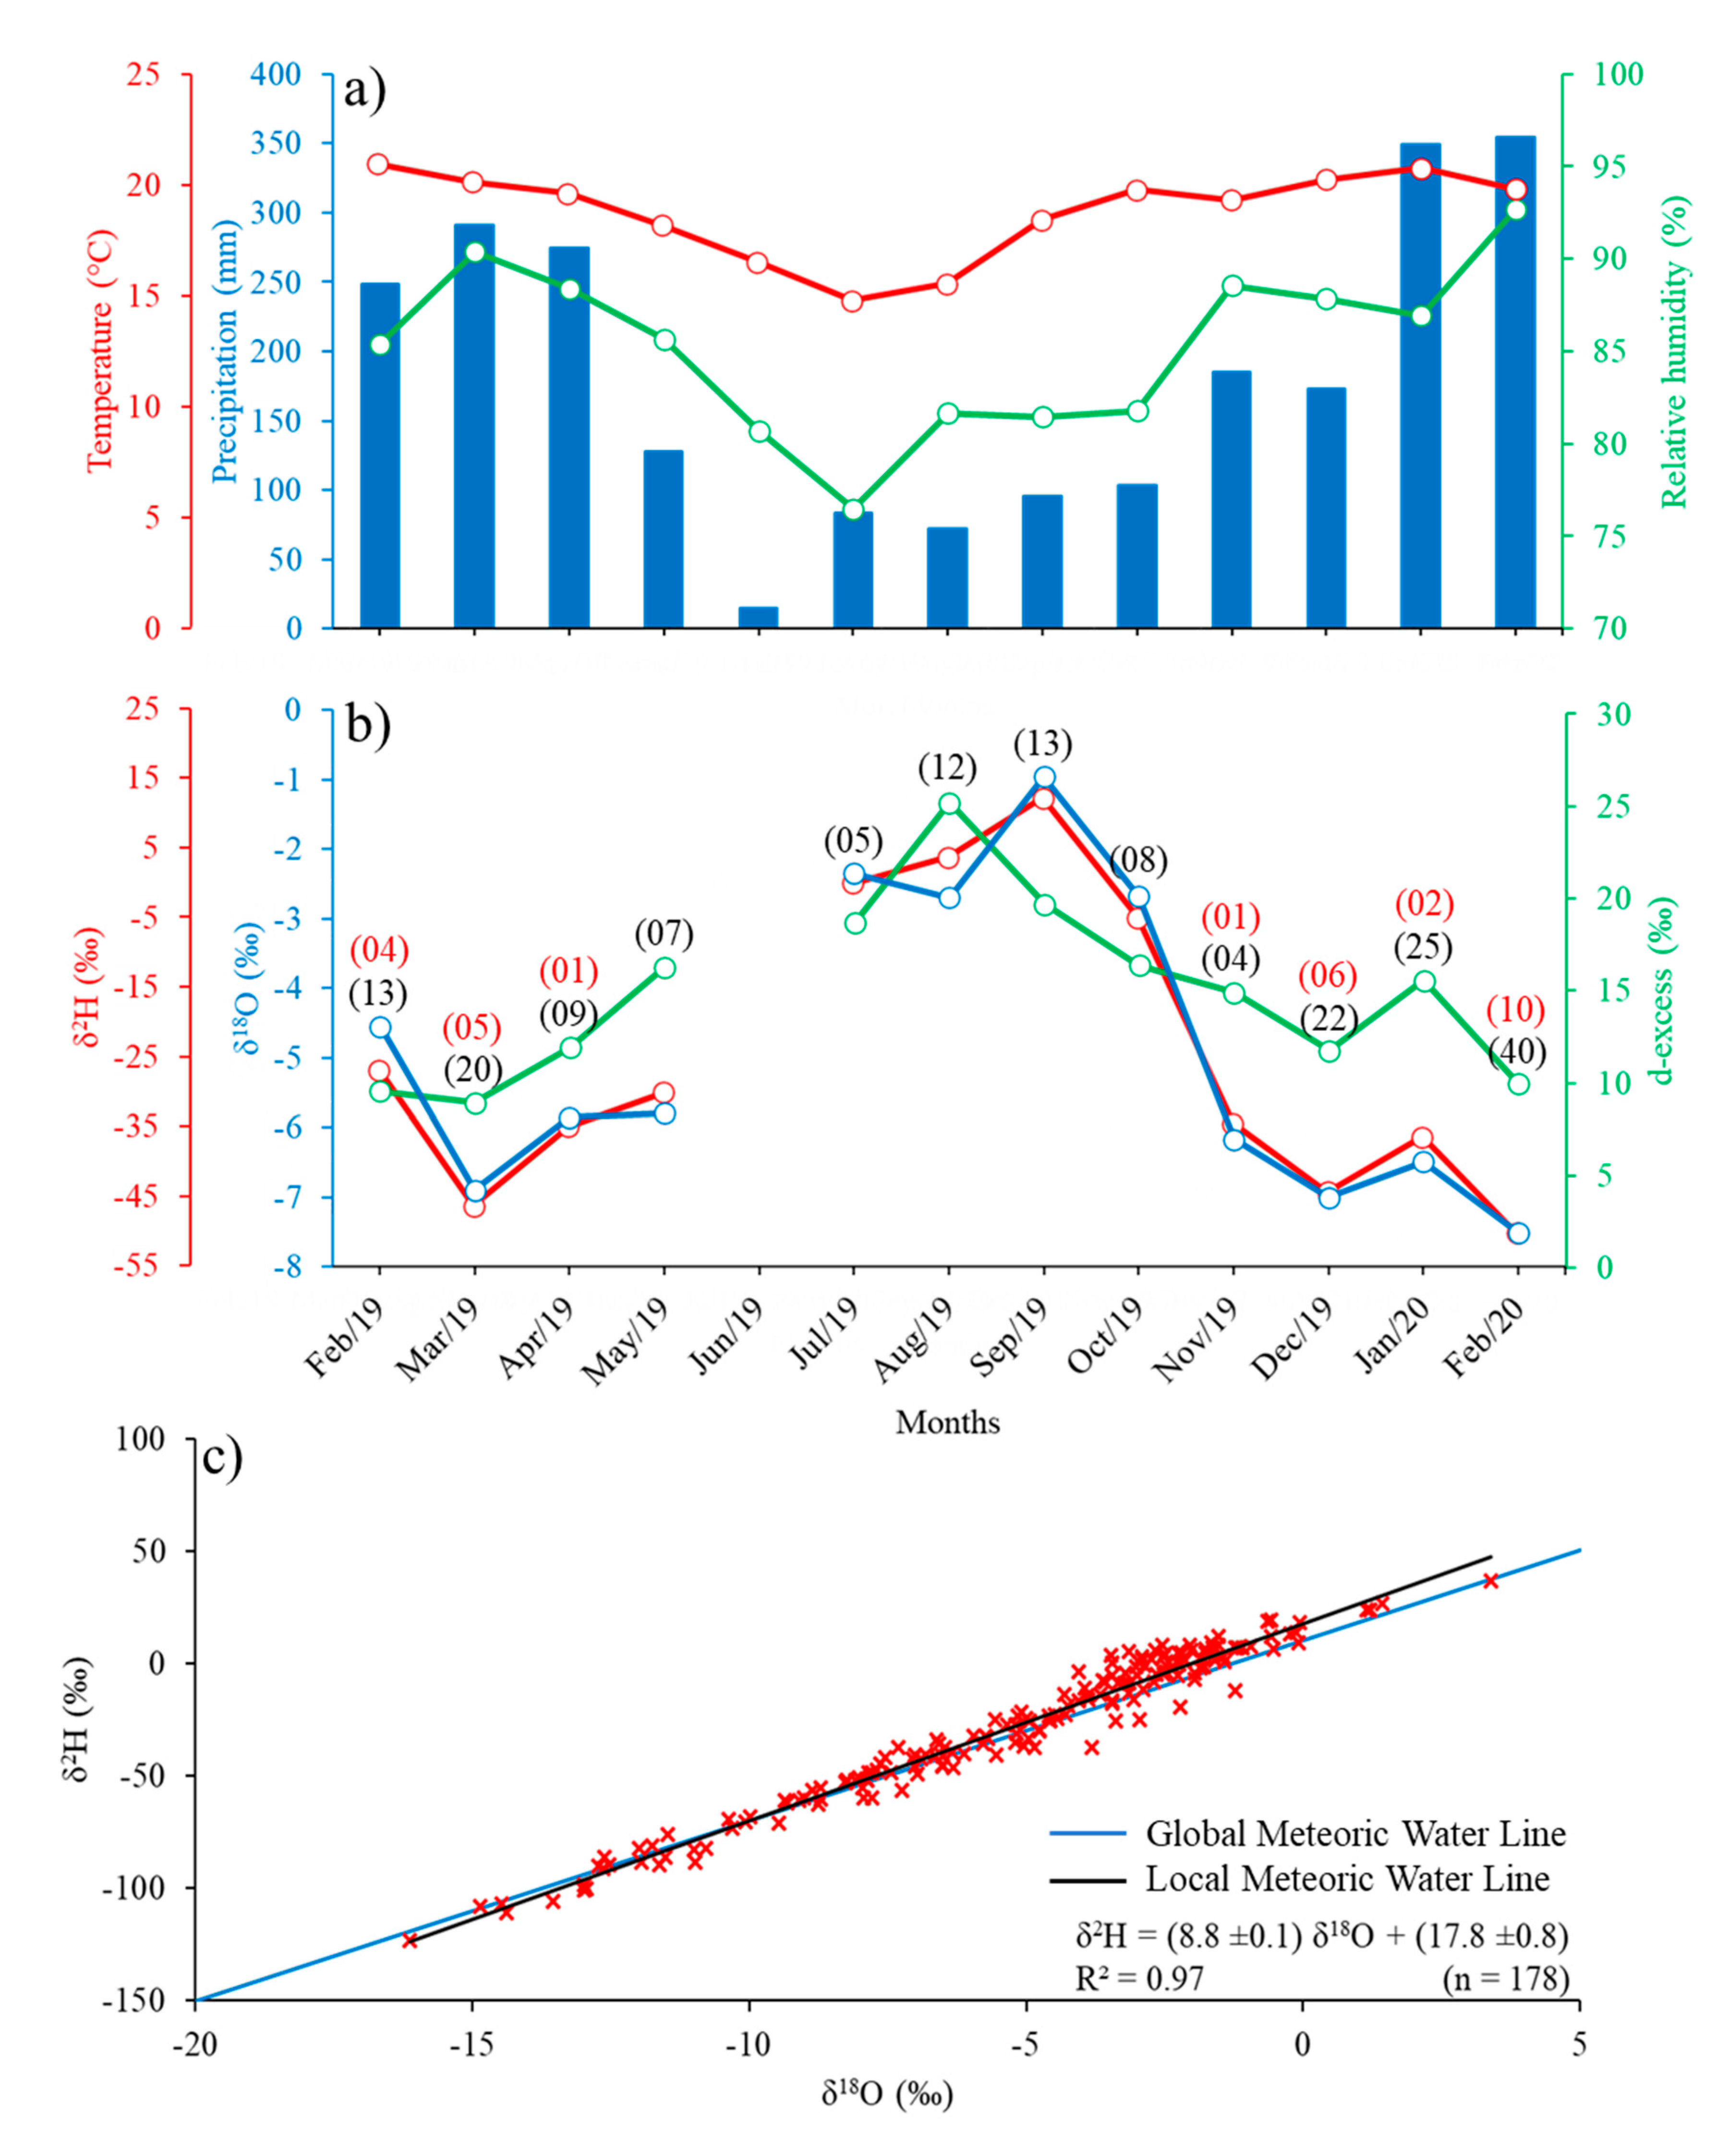
3.1. Meteorological and Isotopic Characterization

The temporal variability of meteorological data (precipitation, temperature, and relative humidity of the air) in SFX are shown in Figure 2a. During the study period (February 2019­–February 2020), the total precipitate was 2373.8 mm, when the lower amount of precipitation occurred between the months of May and October (497.4 mm, 21% of the total), representing the least rainy period. On the other hand, the rest of the months showed a higher amount of precipitation (1876.4 mm, 79% of the total), representing the rainiest period. The average air temperature for the period was 18.5 °C, the coldest month occurred in July (average of 14.7 °C), and the hottest month occurred in January 2020 (average of 20.7 °C). Regarding the relative humidity of the air, June was considered the driest month (average of 76%), and February 2020 was the wettest month (average of 93%) (Figure 2a).
For the entire analysis period, the weighted isotopic average of rainfall was −5.4‰ (±3.7‰) for δ18O, −30.1‰ (±32.7‰) for δ2H, and 13.2‰ (±6.2‰) for d-excess. The monthly variability of isotopic data (Figure 2b) shows more enrichment in precipitation during the month of September, with an average of −0.9‰ (±1.8‰) for δ18O and 12.1‰ (±10.6‰) for δ2H. The most depleted values occurred during February 2020, with an average of −7.5‰ (±3.6‰) for δ18O and −51‰ (±31‰) for δ2H. On average, the highest value of d-excess occurred in the month of August, with 25.2‰ (±3.9‰), and the lowest average value occurred in March, with 9.0‰ (±5.1‰). The Local Meteoric Water Line presented slope and intercept (δ2H = (8.8 ± 0.1) δ18O + (17.8 ± 0.8)) higher than the GMWL value (δ2H = 8 δ18O + 10) identified by Craig [45], as shown in Figure 2c.
The Spearman correlation between meteorological variables and the isotopic signal of precipitation ranged from moderate, strong, and very strong (Table 2). The precipitation presented a very strong negative correlation for δ18O, δ2H, and d-excess (more than −0.80; p-value ≤ 0.003). The relative humidity of the air also showed a very strong negative correlation for δ18O and δ2H (superior than −0.91; p-value < 0.001) and a strong correlation for d-excess (more than −0.78; p-value 0.004). The air temperature showed a moderate negative correlation but without statistical significance with the δ18O (more than −0.58; p-value 0.052) and showed a strong correlation with the δ2H (more than −0.61; p-value 0.040) and d-excess (more than −0.76; p-value 0.007).

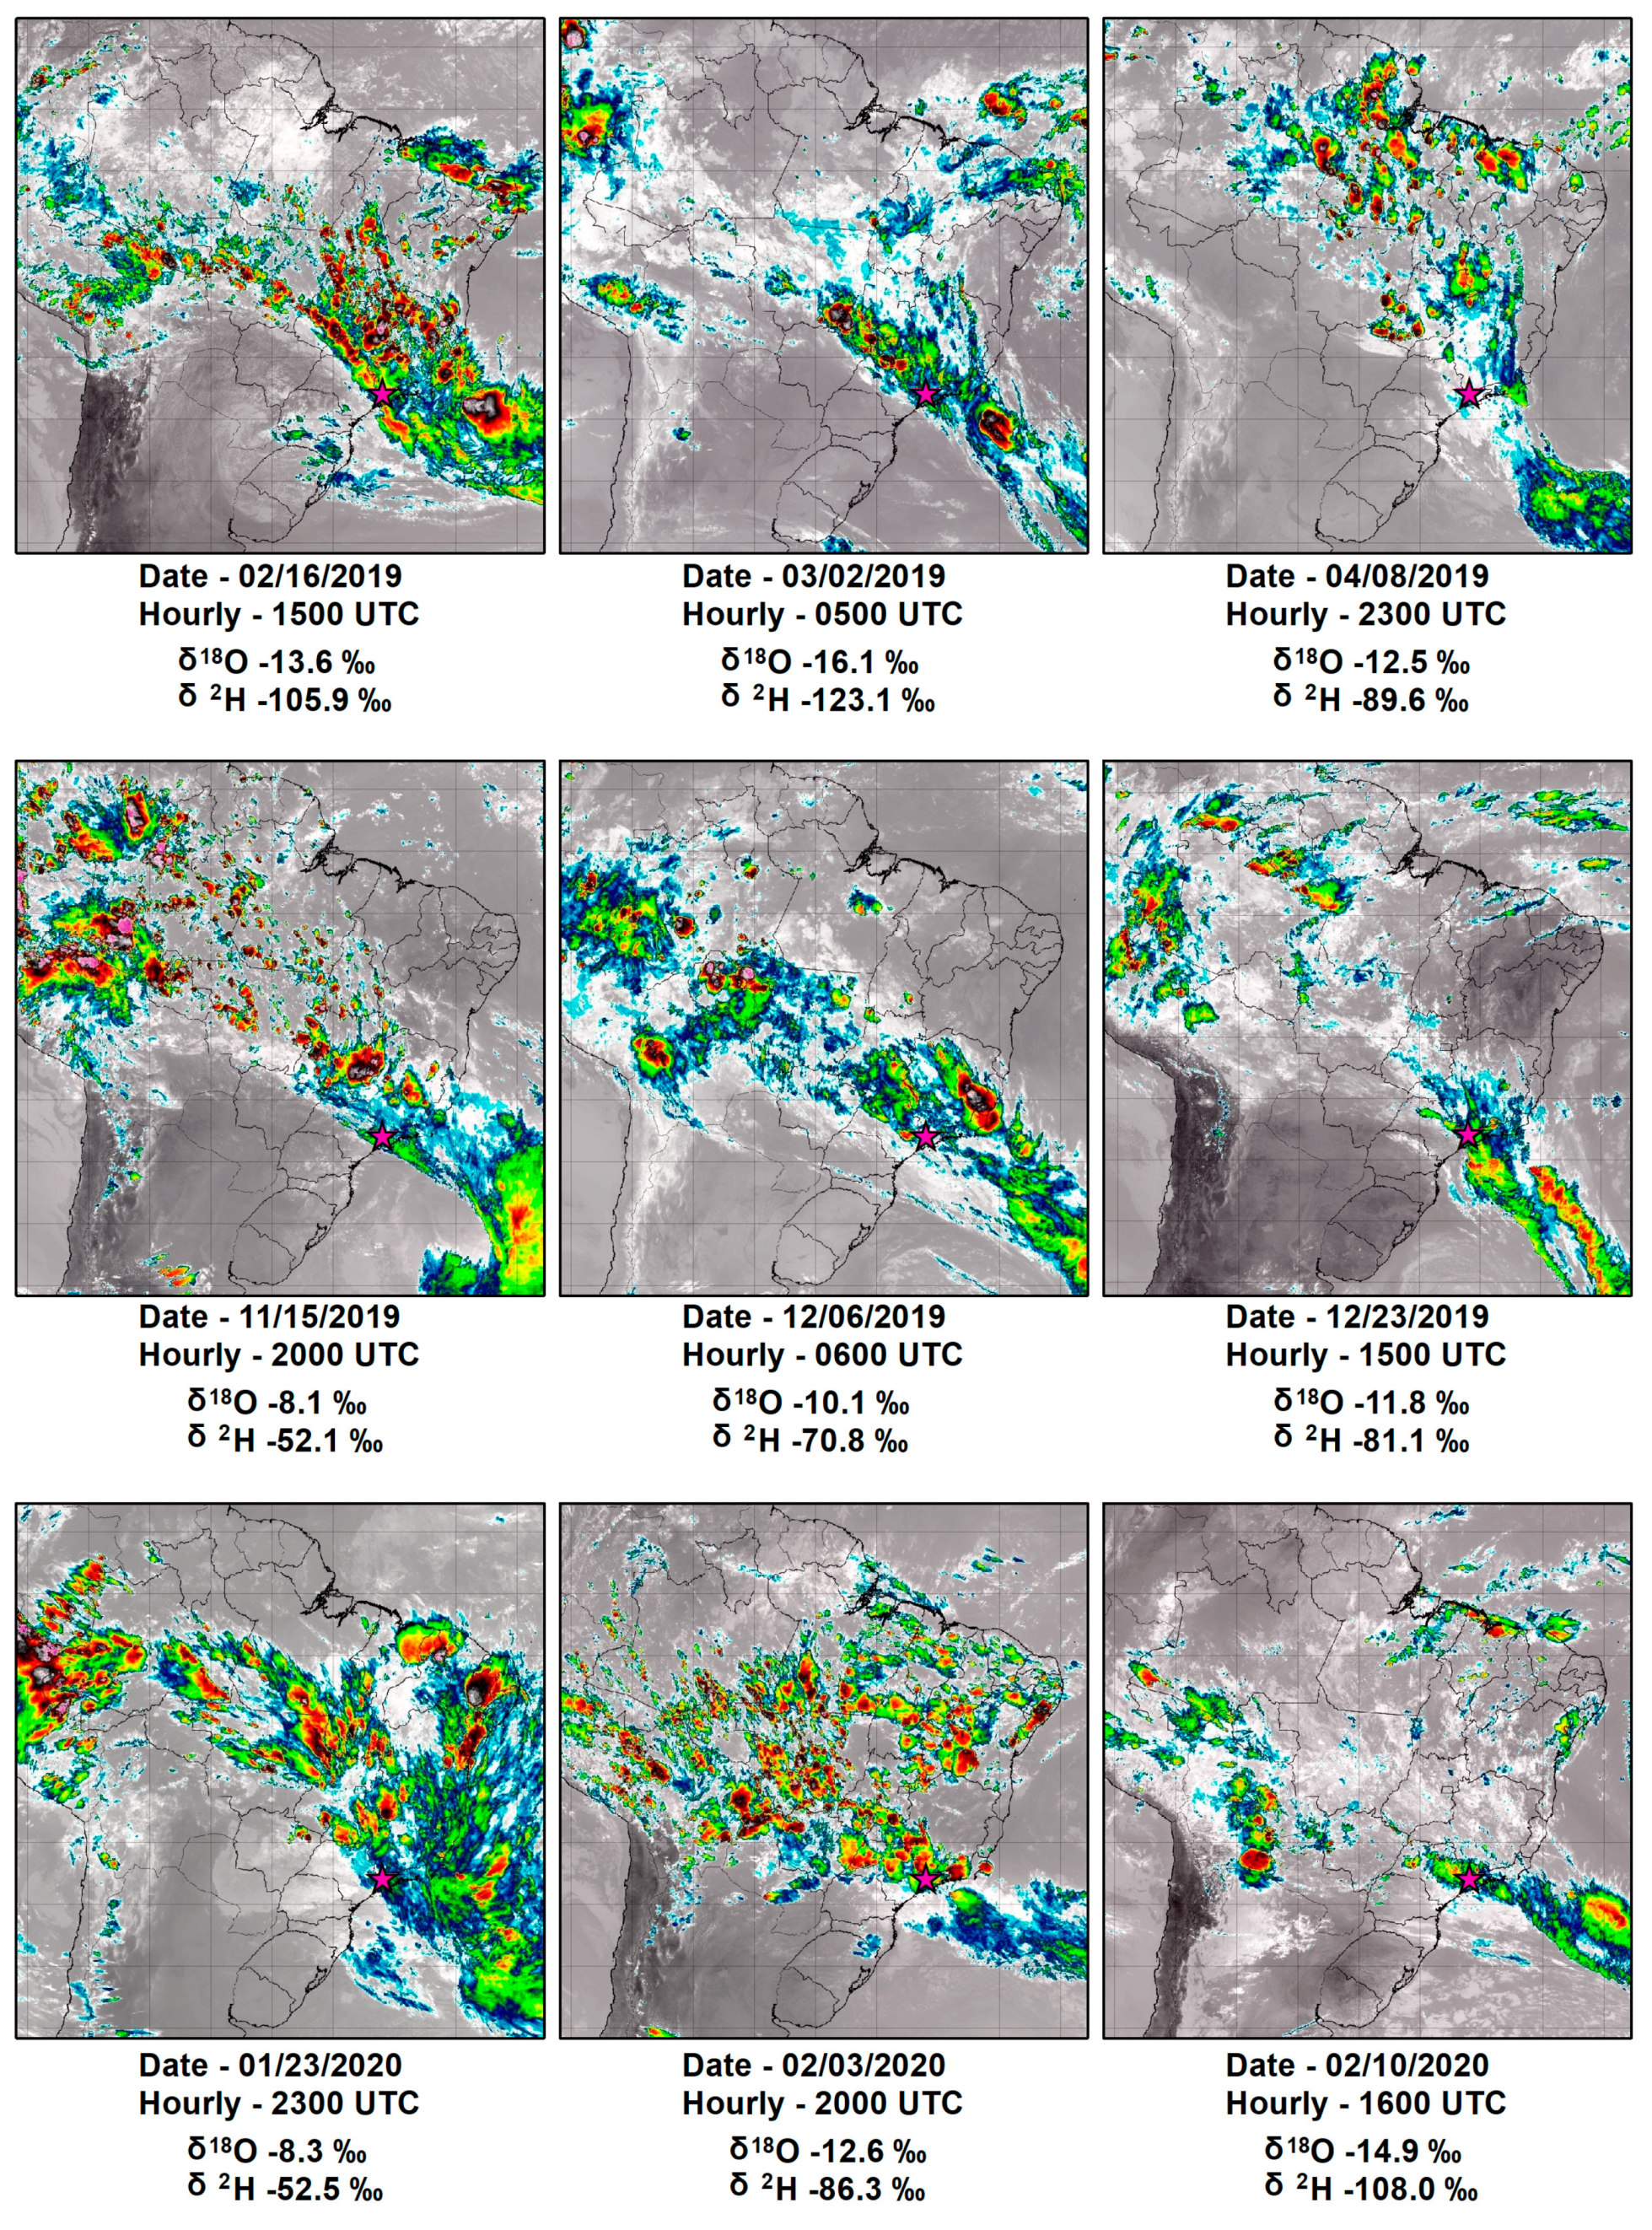
3.2. Isotopic Composition during SACZ Events

According to the synoptic analyzes generated by the CPTEC, nine SACZ events occurred in SFX during the period from February 2019 to February 2020. During the nine SACZ events, 29 rainwater samples were collected in 17 days of precipitation. The average isotopic composition of precipitation (precipitation-weighted values) during SACZ events (Table 3) was considerably more depleted (δ18O of −9.9‰ (±2.1‰), δ2H of −69.3‰ (±17.9‰)) than the mean value of the isotopic signal of precipitation (precipitation-weighted values) obtained throughout the study period (δ18O of −4.9‰ (±2.2‰), δ2H of −24.4‰ (±21.3‰)), in addition to presenting lower d-excess values during SACZ performance, from 10.1‰ (±4.0‰) to 14.9‰ (±4.8‰). During the collection period, the most depleted isotopic value occurred during the second SACZ event (δ18O of −12.6‰, δ2H of −96.4‰), and the lowest value of d-excess occurred in the first event (d-excess of 2.6‰), near the end of the austral summer. The least depleted isotopic value occurred during the fifth SACZ event (δ18O of −7.7‰, δ2H of −51.9‰), with the highest value of d-excess occurring in the seventh event (d-excess of 13.9‰), near the beginning of the austral summer.
The averages per precipitation event (arithmetic means) reveal isotopic differences (δ18O, δ2H and d-excess) that occur during the SACZ performance and without its influence (Figure 3). As previously reported, the isotopic value of precipitation was extremely depleted during the SACZ events. Applying the Kruskal–Wallis test, it was possible to observe significant differences between the mean values of the entire collection period (ALL) events and SACZ (δ18O, p-value < 0.001; δ2H, p-value < 0.001; d-excess, p-value < 0.001) and between SACZ and NO SACZ (δ18O, p-value < 0.001; δ2H, p-value < 0.001; d-excess, p-value < 0.001). In addition, there was a significant difference between the mean values of ALL and NO SACZ for δ18O (p-value 0.03) and δ2H (p-value 0.03). These results show that the average annual value of the isotopic composition is more enriched without the SACZ performance, surpassing the annual average by 1.0‰ for δ18O and 8.8‰ for δ2H. On the other hand, there was no significant difference for the values of d-excess (p-value 0.17).

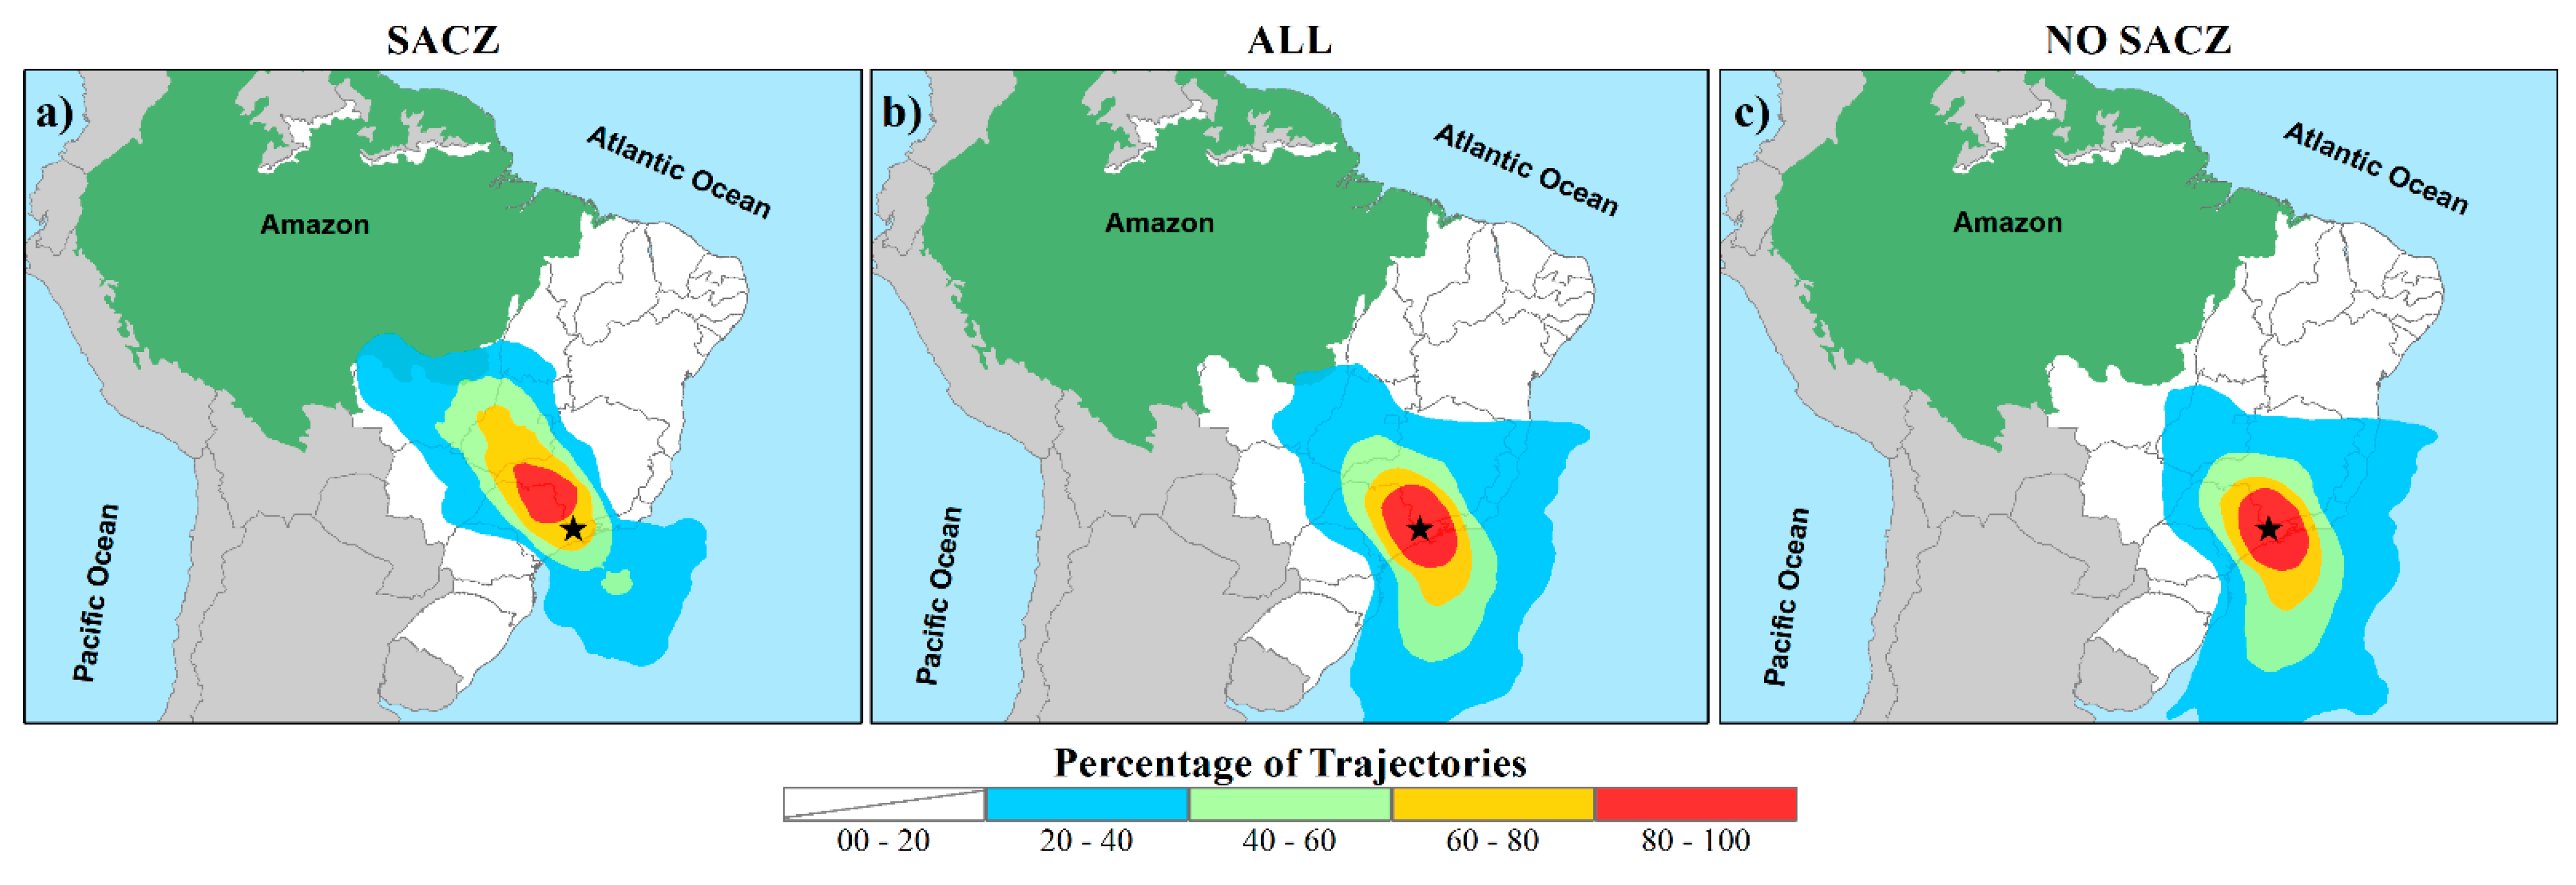
3.3. Retrograde Trajectory of the Air Parcel

Using the 178 retrograde trajectories generated by the HYSPLIT model, three air mass transport patterns have been identified in SFX (Figure 4). The first pattern of trajectories refers to the days with SACZ performance (29 trajectories), presenting the existence of a potential moisture transport from the Amazon Region to SFX due to the large percentage of trajectories from this region (Figure 4a). The second pattern of trajectories for all collections (178 trajectories) (Figure 4b) shows that, in addition to the humidity from the Amazon, moisture shifts from the Atlantic Ocean to SFX also occur frequently. In the third pattern of trajectories, when SACZ events are excluded (149 trajectories) (Figure 4c), there is a reduction in the density of humidity trajectories from the Amazon region, compared to previous patterns.

4. Discussion

4.1. Isotopic Seasonal Variability

The seasonality of the hydrogen and oxygen isotopic signal (Figure 2b) was in agreement with the quantity effect reported by [1], when there is a negative correlation with the amount of precipitation. The d-excess values significantly higher than the global average (~10‰) [45], registered between the months of July and September, may be associated with lower relative humidity [46], characteristic of the period for the region [47]. It is also important to note that both the isotopic signal and the seasonality of found results in this study are in accordance with the results obtained by Gastmans et al. [21] and Santos et al. [22] for the Southeastern region of Brazil. The slope and intercept (Figure 2c) higher than the global average may reflect the high amount of precipitation during the year [48], characteristic of the study region, in addition to local evaporation being an important factor in increasing the intercept, in relation to the global average [49]. These values are typical for humid tropical and humid temperate regions [50].
The very strong negative correlation of precipitation with δ18O and δ2H (Table 2) indicates the quantity effect: the greater (less) the amount of precipitation, the more depleted (enriched) the isotopic signal will be [51]. The negative correlation of relative air humidity with δ18O and δ2H was also an expected effect, because the drier atmosphere favors evaporation, causing isotopic enrichment of precipitation [52]. In contrast, despite a moderate correlation, the effect of air temperature showed a different result to that described in the classic literature [1,38]. According to the literature [51], a positive correlation between isotopic enrichment and air temperature was expected. However, this effect was not observed, which may be associated with low thermal amplitude, characteristic of tropical regions, and with the amount effect. This negative correlation was also found by Santos et al. [22] in a study on southeastern Brazil and by Baker et al. [53] in a study on the southwestern Amazon and some regions of Asia [54,55]. This inverse relation suggests the temperature effect may not be a good indicator to control the isotopic signal of precipitation for the region. In addition, this effect may have been masked by another one (relative humidity, for example), or the source of moisture that precipitates on the spot may be a determining factor for its seasonal variability [56]. In relation to d-excess, its negative correlation with the relative humidity of the air and precipitation was already expected [51,57], although the last one may not cause significant variations in the d-excess in some particular cases [58]. The inverse correlation of d-excess with the air temperature was not expected, since the d-excess usually presents correlation directly proportional to temperature [47,59]. This adverse result suggests the air temperature is not the best predictor for d-excess, but relative humidity, as presented by Li et al. [60].

4.2. Air Parcel Trajectory and Isotopic Signal of Precipitation during SACZ

As shown in Figure 4, there are three air-mass transport patterns for SFX. The trajectories of oceanic origin are mainly caused by the frequent passage of cold fronts and by the action of South Atlantic Subtropical Anticyclone (SASA), that inject water vapor into the continent, mainly during austral summer [61,62,63,64]. Several studies corroborate with the plot’s trajectories during the SACZ performance (Figure 4a), highlighting the expressive contribution of the Amazon region to provide moisture for SACZ formation [36,65,66,67,68]. This moisture transport shows the importance of the Amazon in the provision of ecosystem services to different locations, similar to other rainforests, which are also of great importance in moisture transport for water maintenance in other regions [69,70]. This service strengthens the constant search for the maintenance and preservation of tropical forests [71].
With the aid of GOES-16 satellite images in the infrared channel, it is possible to observe the range of cloudiness associated with positioning during SACZ events, as well as its magnitude (Figure 5). The SACZ positioning was mostly well defined, mainly referring to moisture transport from the Amazon region to southeastern Brazil, as well as identified with the retrograde trajectories of the HYSPLIT (Figure 4a). During the nine episodes that SACZ was active, individual isotopic values varied from a δ18O of −16.1‰ and a δ2H of −123.1‰ (during the fifth collection of the second event) to a δ18O of −8.1‰ and a δ2H of −52.1‰ (during the collection in the fourth event), as shown in Figure 5. In addition, d-excess varied individually from 1.7‰ (during the first collection in the second event) to 14.7‰ (during the second collection in the eighth event). Furthermore, in the first two SACZ events, the d-excess presented values below the average (Table 3). A joint analysis of the data suggests the d-excess increase may occur gradually, due to the total coupling of systems in the region for the SACZ formation [17]. For example, in the events that enabled the higher number of collections (events 5, 8, and 9), d-excess increased gradually (values shown individually in the Supplementary Material—Table S1).
During the SACZ events, the occurrence of the most depleted isotopic signal may be associated with the continentality effect and latitude [72,73], interpreted as Rayleigh distillation [1,74]. Rain depletion during the SACZ event, compared to the average isotopic signals of the other precipitating events that act in the region, may occur due to the displacement of the large cloudiness complex, along with humidity from the Amazon to southeastern Brazil. Because this system extends over a distance for a distance greater than 2000 km, from an average latitude of −7° S to −23° S and can last ap-proximately 10 days [14,17].
As shown by Salati et al. [75], the displacement of moisture from the Atlantic Ocean to the Amazon basin would not be enough to cause an expressive isotopic gradient to its easternmost region, as Rayleigh distillation proposes. Thus, it was suggested that the moisture recycling process, produced by evapotranspiration from the Amazon basin, would be a major cause of the low isotopic gradient of precipitation (δ18O −0.75‰/1000 km) in relation to that expected by the continentality effect [75,76,77,78]. Njitchoua et al. [79] also found a low isotopic gradient in the Cameroon rainforest (δ18O −0.9‰/1000 km) in Central Africa, attributing this value to the moisture recycling driven by the transpiration of local forests having a more isotopically enriched water. Studies developed by Salati et al. [75] and Gat and Matsui [76] reveal that the isotopic composition of δ18O of precipitation in the Amazon basin was approximately −4.5‰ during the months that the SACZ is formed. The fact that the average δ18O of precipitation presents the value of −6.4‰ (±1.0‰) during the months of SACZ operation in SFX demonstrates the occurrence of an isotopic gradient between the Amazon and southeastern Brazil, of approximately −1‰/1000 km for δ18O, driven by the Rayleigh distillation. This gradient could possibly be higher if the data available by Salati et al. [75] and Gat and Matsui [76] occurred in the SACZ event scale, enabling a more refined comparison.
It is important to mention that in regions where the rain recycling process is reduced or absent, the Rayleigh distillation has been more clearly evidenced. Kern et al. [80] used data from an isotopic monitoring network in Austria, Slovenia, and Hungary and found an extremely high gradient of δ18O, of −2.4‰/100 km, during the boreal winter period, attributed to the reduction of evapotranspiration for the formation of rain. Rozanski et al. [81] found the annual mean of the isotopic gradient of δ18O, in the order of −2‰/1000 km for the European continent, a region where an expressive contribution of atmospheric vapor from densely forested areas is not expected. The occurrence of the Rayleigh distillation along the air mass trajectory from the Amazon to southeastern Brazil can be explained by the fact that along this path, there are regions with a high degree of deforestation, such as the arc of deforestation region [82] and areas of the Cerrado biome in in the Midwest of Brazil, with a predominance of pastures or monocultures [20] drastically reducing the moisture recycling process through evapotranspiration [83,84]. The joint analysis of the results, based on similar works developed in the Amazon and in highly anthropized regions of the European continent, support the hypothesis that the greatest deforestation in the Amazon may be an important factor in the greater depletion of the rainwater isotopic signal that occurs in SFX in the southeastern region of Brazil during events where the SACZ is active.
In a future scenario, with the evapotranspiration reduction in the Amazon basin [71,85] mainly due to the loosening of Brazilian public policies related to forest management and the reduction of deforestation [86,87], the isotopic composition of precipitation may present more depletion in the southeastern region of Brazil during SACZ events, and consequently in its annual average, because the recycling process is one of the main processes responsible for isotopic enrichment [78,88,89].

5. Conclusions

The results of this study revealed that during the periods in which the SACZ was active in the southeastern region of Brazil, particularly in São Francisco Xavier, the isotopic signal of precipitation was more depleted (δ18O of −9.9‰ (±2.1‰) and δ2H of −69.3‰ (±17.9‰)) compared to the average isotopic signal (−4.9‰ (±2.2‰) to δ18O and −24.4‰ (±21.3‰) to δ2H). By disregarding the isotopic signal of precipitation during the presence of the SACZ, the annual averages of δ18O and δ2H can increase by 1.0‰ and 8.8‰, respectively. The isotopic depletion of precipitation during SACZ events is explained by the Rayleigh distillation process that occurs during humidity transportation from Amazon to southeastern Brazil.
The results found in this study support other works that show the strong contribution of the Amazon to the water supply in southeastern Brazil. In addition, the results obtained also suggest that the degradation of the Amazon forest may be an impact factor for an isotopic signal of more depleted precipitation, observed during SACZ events. This depletion suggests less participation of evapotranspiration from forest areas during SACZ events. Thus, the proposed study suggests that long-term monitoring of the variability of the isotopic signal of precipitation during the SACZ, associated with the detection of the most depleted isotopic signal, can serve as an indicator of decreased of the recycling process, impacting humidity formation and contributing to SACZ occurrence.

Supplementary Materials

The following are available online at https://www.mdpi.com/article/10.3390/atmos12040418/s1, Table S1: Set of isotopic and meteorological data used in this study. The samples collected during the performance of SACZ are in red. Table S2: Detailed Boxplot values used in Figure 3. Figure S1: Graphical details of the Spearman test between the monthly meteorological variables and the isotopic signal, shown in Table 2.

Author Contributions

C.S. collected samples as part of his PhD, processed and analyzed the data, and prepared the first draft of this paper and the write-up of the manuscript. C.S., R.C., C.B., D.G. and L.B. analyzed the data, provided guidelines for the write-up of the manuscript, and contributed to its editing and finalization. All authors have read and agreed to the published version of the manuscript.

Funding

This study was financed in part by the Coordenação de Aperfeiçoamento de Pessoal de Nível Superior—Brazil (CAPES/ANA)—Finance Code 2180/2017, Fundação de Amparo à Pesquisa do Estado de São Paulo (FAPESP) Finance Code—2018/16791-0 and Financiadora de Estudos e Projetos (FINEP) Finance Code—01.16.0076.00.

Acknowledgments

The authors thank the National Institute of Space Research (INPE). Cleber Santos acknowledges the Brazilian National Council for Scientific and Technological Development (CNPq) and Coordination for the Improvement of Higher Education Personnel (CAPES) for the graduate fellowship. Laura Borma also acknowledges CAPES/ANA and FAPESP (processes nos. 2180/2017 and 2018/16791-0, respectively).

Conflicts of Interest

The authors declare that they have no conflict of interest. The founding sponsors had no role in the design of the study; in the collection, analyses, or interpretation of data; in the writing of the manuscript; or in the decision to publish the results.

References

  1. Dansgaard, W. Stable Isotopes in Precipitation. Tellus 1964, 16, 436–468. [Google Scholar] [CrossRef]
  2. Gibson, J.J.; Reid, R. Stable Isotope Fingerprint of Open-Water Evaporation Losses and Effective Drainage Area Fluctuations in a Subarctic Shield Watershed. J. Hydrol. 2010, 381, 142–150. [Google Scholar] [CrossRef]
  3. Criss, R.E.; Farquhar, J. Abundance, Notation, and Fractionation of Light Stable Isotopes. Rev. Mineral. Geochem. 2008, 68, 15–30. [Google Scholar] [CrossRef]
  4. Kong, Y.; Pang, Z. Evaluating the Sensitivity of Glacier Rivers to Climate Change Based on Hydrograph Separation of Discharge. J. Hydrol. 2012, 434–435, 121–129. [Google Scholar] [CrossRef]
  5. Lu, X.; Liang, L.L.; Wang, L.; Jenerette, G.D.; McCabe, M.F.; Grantz, D.A. Partitioning of Evapotranspiration Using a Stable Isotope Technique in an Arid and High Temperature Agricultural Production System. Agric. Water Manag. 2017, 179, 103–109. [Google Scholar] [CrossRef]
  6. Congjian, S.; Yaning, C.; Weihong, L.; Xingong, L.; Yuhui, Y. Isotopic Time Series Partitioning of Streamflow Components under Regional Climate Change in the Urumqi River, Northwest China. Hydrol. Sci. J. 2016, 61, 1443–1459. [Google Scholar] [CrossRef]
  7. Aemisegger, F.; Spiegel, J.K.; Pfahl, S.; Sodemann, H.; Eugster, W.; Wernli, H. Isotope Meteorology of Cold Front Passages: A Case Study Combining Observations and Modeling. Geophys. Res. Lett. 2015, 42, 5652–5660. [Google Scholar] [CrossRef]
  8. Crawford, J.; Hughes, C.E.; Parkes, S.D. Is the Isotopic Composition of Event Based Precipitation Driven by Moisture Source or Synoptic Scale Weather in the Sydney Basin, Australia? J. Hydrol. 2013, 507, 213–226. [Google Scholar] [CrossRef]
  9. Lykoudis, S.P.; Kostopoulou, E.; Argiriou, A.A. Stable Isotopic Signature of Precipitation under Various Synoptic Classifications. Phys. Chem. Earth Parts A/B/C 2010, 35, 530–535. [Google Scholar] [CrossRef]
  10. Berkelhammer, M.; Stott, L.; Yoshimura, K.; Johnson, K.; Sinha, A. Synoptic and Mesoscale Controls on the Isotopic Composition of Precipitation in the Western United States. Clim. Dyn. 2012, 38, 433–454. [Google Scholar] [CrossRef]
  11. Sánchez-Murillo, R.; Durán-Quesada, A.M. Preface to Stable Isotopes in Hydrological Studies in the Tropics: Ecohydrological Perspectives in a Changing Climate. Hydrol. Process. 2019, 33, 2160–2165. [Google Scholar] [CrossRef]
  12. Treble, P.C.; Budd, W.F.; Hope, P.K.; Rustomji, P.K. Synoptic-Scale Climate Patterns Associated with Rainfall δ18O in Southern Australia. J. Hydrol. 2005, 302, 270–282. [Google Scholar] [CrossRef]
  13. Cavalcanti, I.F.A. Large Scale and Synoptic Features Associated with Extreme Precipitation over South America: A Review and Case Studies for the First Decade of the 21st Century. Atmos. Res. 2012, 118, 27–40. [Google Scholar] [CrossRef]
  14. Ambrizzi, T.; Ferraz, S.E.T. An Objective Criterion for Determining the South Atlantic Convergence Zone. Front. Environ. Sci. 2015, 3. [Google Scholar] [CrossRef]
  15. Carvalho, L.M.V.; Jones, C.; Liebmann, B. The South Atlantic Convergence Zone: Intensity, Form, Persistence, and Relationships with Intraseasonal to Interannual Activity and Extreme Rainfall. J. Clim. 2004, 17, 88–108. [Google Scholar] [CrossRef]
  16. Kodama, Y. Large-Scale Common Features of Subtropical Precipitation Zones (the Baiu Frontal Zone, the SPCZ, and the SACZ) Part I: Characteristics of Subtropical Frontal Zones. J. Meteorol. Soc. Japan. Ser. II 1992, 70, 813–836. [Google Scholar] [CrossRef]
  17. Escobar, G.C.J. Zona de Convergência Do Atlântico Sul (ZCAS): Critério de Detecção Para Uso Em Centros Operacionais de Previsão de Tempo; INPE: São José dos Campos, Brazil, 2019; pp. 1–17. Available online: http://urlib.net/rep/8JMKD3MGP3W34R/3SGMUDP (accessed on 9 October 2019).
  18. Quadro, M.F.L.; Pezzi, L.P.; Rosa, E.B. O Climanálise e o Monitoramento Da ZCAS Nos Últimos 30 Anos. Rev. Climanálise 2016, 4, 19–25. Available online: http://climanalise.cptec.inpe.br/~rclimanl/revista/pdf/30anos/quadroetal.pdf (accessed on 7 October 2019).
  19. Chang, H.K.; Gonçalves, R.D.; Aggarwal, P.K.; Stradioto, M.R.; Hespanhol, E.C.B.; Sturchio, N.C.; Romatschke, U.; Araguas, L.J.A. Groundwater Isotope Ratios Reflect Convective and Stratiform (Paleo)Precipitation Fractions in Brazil. J. Hydrol. 2020, 585, 124801. [Google Scholar] [CrossRef]
  20. Dias, L.C.P.; Pimenta, F.M.; Santos, A.B.; Costa, M.H.; Ladle, R.J. Patterns of Land Use, Extensification, and Intensification of Brazilian Agriculture. Glob. Chang. Biol. 2016, 22, 2887–2903. [Google Scholar] [CrossRef]
  21. Gastmans, D.; Santos, V.; Galhardi, J.A.; Gromboni, J.F.; Batista, L.V.; Miotlinski, K.; Chang, H.K.; Govone, J.S. Controls over Spatial and Seasonal Variations on Isotopic Composition of the Precipitation along the Central and Eastern Portion of Brazil. Isot. Environ. Health Stud. 2017, 53, 518–538. [Google Scholar] [CrossRef]
  22. Santos, V.D.; Gastmans, D.; Sánchez-Murillo, R.; Felippe Gozzo, L.; Vianna Batista, L.; Lilla Manzione, R.; Martinez, J. Regional Atmospheric Dynamics Govern Interannual and Seasonal Stable Isotope Composition in Southeastern Brazil. J. Hydrol. 2019, 579, 124136. [Google Scholar] [CrossRef]
  23. Silva, R.F.B.D.; Rodrigues, M.D.A.; Vieira, S.A.; Batistella, M.; Farinaci, J. Perspectives for Environmental Conservation and Ecosystem Services on Coupled Rural–Urban Systems. Perspect. Ecol. Conserv. 2017, 15, 74–81. [Google Scholar] [CrossRef]
  24. Alvares, C.A.; Stape, J.L.; Sentelhas, P.C.; de Moraes Gonçalves, J.L.; Sparovek, G. Köppen’s Climate Classification Map for Brazil. Meteorol. Z. 2013, 22, 711–728. [Google Scholar] [CrossRef]
  25. INMET. (Brazilian National Meteorology Institute). Available online: https://portal.inmet.gov.br/ (accessed on 3 June 2020).
  26. ANA. (National Water Agency). Available online: http://www.snirh.gov.br/hidroweb/publico/medicoes_historicas_abas.jsf (accessed on 3 June 2020).
  27. Reboita, M.S.; Gan, M.A.; Rocha, R.P.D.; Ambrizzi, T. Regimes de Precipitação Na América Do Sul: Uma Revisão Bibliográfica. Rev. Bras. Meteorol. 2010, 25, 185–204. [Google Scholar] [CrossRef]
  28. Sun, X.; Cook, K.H.; Vizy, E.K. The South Atlantic Subtropical High: Climatology and Interannual Variability. J. Clim. 2017, 30, 3279–3296. [Google Scholar] [CrossRef]
  29. Morais, M.A.D.; Castro, W.A.C.D.; Tundisi, J.G. Climatologia de Frentes Frias Sobre a Região Metropolitana de São Paulo (RMSP), e Sua Influência Na Limnologia Dos Reservatórios de Abastecimento de Água. Rev. Bras. Meteorol. 2010, 25, 205–217. [Google Scholar] [CrossRef]
  30. Prechsl, U.E.; Gilgen, A.K.; Kahmen, A.; Buchmann, N. Reliability and Quality of Water Isotope Data Collected with a Low-Budget Rain Collector. Rapid Commun. Mass Spectrom. 2014, 28, 879–885. [Google Scholar] [CrossRef] [PubMed]
  31. GNIP (Global Network of Isotopes in Precipitation) IAEA/GNIP Precipitation Sampling Guide. Available online: http://www-naweb.iaea.org/napc/ih/documents/other/gnip_manual_v2.02_en_hq.pdf (accessed on 1 June 2018).
  32. Paul, D.; Skrzypek, G.; Fórizs, I. Normalization of Measured Stable Isotopic Compositions to Isotope Reference Scales a Review. Rapid Commun. Mass Spectrom. 2007, 21, 3006–3014. [Google Scholar] [CrossRef] [PubMed]
  33. Pierchala, A.; Rozanski, K.; Dulinski, M.; Gorczyca, Z.; Marzec, M.; Czub, R. High-Precision Measurements of δ2H, δ18O and δ17O in Water with the Aid of Cavity Ring-down Laser Spectroscopy. Isotopes Environ. Health Stud. 2019, 55, 290–307. [Google Scholar] [CrossRef] [PubMed]
  34. Coplen, T.B. Guidelines and Recommended Terms for Expression of Stable-Isotope-Ratio and Gas-Ratio Measurement Results. Rapid Commun. Mass Spectrom. 2011, 25, 2538–2560. [Google Scholar] [CrossRef] [PubMed]
  35. Satyamurty, P.; Rosa, M.B. Synoptic Climatology of Tropical and Subtropical South America and Adjoining Seas as Inferred from Geostationary Operational Environmental Satellite Imagery. Int. J. Climatol. 2020, 40, 378–399. [Google Scholar] [CrossRef]
  36. de Oliveira Vieira, S.; Satyamurty, P.; Andreoli, R.V. On the South Atlantic Convergence Zone Affecting Southern Amazonia in Austral Summer. Atmos. Sci. Lett. 2013, 14, 1–6. [Google Scholar] [CrossRef]
  37. Stein, A.F.; Draxler, R.R.; Rolph, G.D.; Stunder, B.J.B.; Cohen, M.D.; Ngan, F. NOAA’s HYSPLIT Atmospheric Transport and Dispersion Modeling System. Bull. Am. Meteorol. Soc. 2015, 96, 2059–2077. [Google Scholar] [CrossRef]
  38. Otte, I.; Detsch, F.; Gütlein, A.; Scholl, M.; Kiese, R.; Appelhans, T.; Nauss, T. Seasonality of Stable Isotope Composition of Atmospheric Water Input at the Southern Slopes of Mt. Kilimanjaro, Tanzania. Hydrol. Process. 2017, 31, 3932–3947. [Google Scholar] [CrossRef]
  39. Samuels-Crow, K.E.; Galewsky, J.; Hardy, D.R.; Sharp, Z.D.; Worden, J.; Braun, C. Upwind Convective Influences on the Isotopic Composition of Atmospheric Water Vapor over the Tropical Andes. J. Geophys. Res. Atmos. 2014, 119, 7051–7063. [Google Scholar] [CrossRef]
  40. Santos, V.; Dias de Oliveira, M.; Boll, J.; Sánchez-Murillo, R.; Menegário, A.A.; Gozzo, L.F.; Gastmans, D. Isotopic Composition of Precipitation during Strong El Niño–Southern Oscillation Events in the Southeast Region of Brazil. Hydrol. Process. 2019, 33, 647–660. [Google Scholar] [CrossRef]
  41. Rodell, M.; Houser, P.R.; Jambor, U.; Gottschalck, J.; Mitchell, K.; Meng, C.-J.; Arsenault, K.; Cosgrove, B.; Radakovich, J.; Bosilovich, M.; et al. The Global Land Data Assimilation System. Bull. Am. Meteorol. Soc. 2004, 85, 381–394. [Google Scholar] [CrossRef]
  42. Shapiro, S.S.; Wilk, M.B. An Analysis of Variance Test for Normality (Complete Samples). Biometrika 1965, 52, 591. [Google Scholar] [CrossRef]
  43. Sánchez-Murillo, R.; Birkel, C.; Welsh, K.; Esquivel-Hernández, G.; Corrales-Salazar, J.; Boll, J.; Brooks, E.; Roupsard, O.; Sáenz-Rosales, O.; Katchan, I.; et al. Key Drivers Controlling Stable Isotope Variations in Daily Precipitation of Costa Rica: Caribbean Sea versus Eastern Pacific Ocean Moisture Sources. Quat. Sci. Rev. 2016, 131, 250–261. [Google Scholar] [CrossRef]
  44. Weir, I. Spearman’s Correlation. Available online: http://www.statstutor.ac.uk/resources/uploaded/spearmans.pdf (accessed on 12 March 2019).
  45. Craig, H. Isotopic Variations in Meteoric Waters. Science. 1961, 133, 1702–1703. [Google Scholar] [CrossRef] [PubMed]
  46. Wu, H.; Zhang, X.; Xiaoyan, L.; Li, G.; Huang, Y. Seasonal Variations of Deuterium and Oxygen-18 Isotopes and Their Response to Moisture Source for Precipitation Events in the Subtropical Monsoon Region. Hydrol. Process. 2015, 29, 90–102. [Google Scholar] [CrossRef]
  47. Pfahl, S.; Sodemann, H. What Controls Deuterium Excess in Global Precipitation? Clim. Past 2014, 10, 771–781. [Google Scholar] [CrossRef]
  48. Adhikari, N.; Gao, J.; Yao, T.; Yang, Y.; Dai, D. The Main Controls of the Precipitation Stable Isotopes at Kathmandu, Nepal. Tellus B Chem. Phys. Meteorol. 2020, 72, 1–17. [Google Scholar] [CrossRef]
  49. Yeh, H.-F.; Lee, C.-H.; Hsu, K.-C. Oxygen and Hydrogen Isotopes for the Characteristics of Groundwater Recharge: A Case Study from the Chih-Pen Creek Basin, Taiwan. Environ. Earth Sci. 2011, 62, 393–402. [Google Scholar] [CrossRef]
  50. Putman, A.L.; Fiorella, R.P.; Bowen, G.J.; Cai, Z. A Global Perspective on Local Meteoric Water Lines: Meta-analytic Insight Into Fundamental Controls and Practical Constraints. Water Resour. Res. 2019, 55, 6896–6910. [Google Scholar] [CrossRef]
  51. Yang, Q.; Mu, H.; Guo, J.; Bao, X.; Martín, J.D. Temperature and Rainfall Amount Effects on Hydrogen and Oxygen Stable Isotope in Precipitation. Quat. Int. 2019. [Google Scholar] [CrossRef]
  52. Chen, F.; Zhang, M.; Wang, S.; Ma, Q.; Zhu, X.; Dong, L. Relationship between Sub-Cloud Secondary Evaporation and Stable Isotopes in Precipitation of Lanzhou and Surrounding Area. Quat. Int. 2015, 380–381, 68–74. [Google Scholar] [CrossRef]
  53. Baker, J.C.A.; Gloor, M.; Spracklen, D.V.; Arnold, S.R.; Tindall, J.C.; Clerici, S.J.; Leng, M.J.; Brienen, R.J.W. What Drives Interannual Variation in Tree Ring Oxygen Isotopes in the Amazon? Geophys. Res. Lett. 2016, 43. [Google Scholar] [CrossRef]
  54. Araguás-Araguás, L.; Froehlich, K.; Rozanski, K. Stable Isotope Composition of Precipitation over Southeast Asia. J. Geophys. Res. Atmos. 1998, 103, 28721–28742. [Google Scholar] [CrossRef]
  55. Zhao, P.; Tan, L.; Zhang, P.; Wang, S.; Cui, B.; Li, D.; Xue, G.; Cheng, X. Stable Isotopic Characteristics and Influencing Factors in Precipitation in the Monsoon Marginal Region of Northern China. Atmosphere 2018, 9, 97. [Google Scholar] [CrossRef]
  56. Liu, J.; Song, X.; Yuan, G.; Sun, X.; Liu, X.; Wang, S. Characteristics of δ18O in Precipitation over Eastern Monsoon China and the Water Vapor Sources. Chin. Sci. Bull. 2010, 55, 200–211. [Google Scholar] [CrossRef]
  57. Bershaw, J. Controls on Deuterium Excess across Asia. Geosciences 2018, 8, 257. [Google Scholar] [CrossRef]
  58. Guan, H.; Zhang, X.; Skrzypek, G.; Sun, Z.; Xu, X. Deuterium Excess Variations of Rainfall Events in a Coastal Area of South Australia and Its Relationship with Synoptic Weather Systems and Atmospheric Moisture Sources. J. Geophys. Res. Atmos. 2013, 118, 1123–1138. [Google Scholar] [CrossRef]
  59. Uemura, R.; Matsui, Y.; Yoshimura, K.; Motoyama, H.; Yoshida, N. Evidence of Deuterium Excess in Water Vapor as an Indicator of Ocean Surface Conditions. J. Geophys. Res. 2008, 113, D19114. [Google Scholar] [CrossRef]
  60. Li, Z.-J.; Li, Z.-X.; Yu, H.-C.; Song, L.-L.; Ma, J.-Z. Environmental Significance and Zonal Characteristics of Stable Isotope of Atmospheric Precipitation in Arid Central Asia. Atmos. Res. 2019, 227, 24–40. [Google Scholar] [CrossRef]
  61. Escobar, G.C.J.; Reboita, M.S.; Souza, A. Climatology of Surface Baroclinic Zones in the Coast of Brazil. Atmósfera 2019, 32, 129–141. [Google Scholar] [CrossRef]
  62. Foss, M.; Chou, S.C.; Seluchi, M.E. Interaction of Cold Fronts with the Brazilian Plateau: A Climatological Analysis. Int. J. Climatol. 2017, 37, 3644–3659. [Google Scholar] [CrossRef]
  63. Vera, C.S.; Vigliarolo, P.K.; Berbery, E.H. Cold Season Synoptic-Scale Waves over Subtropical South America. Mon. Weather Rev. 2002, 130, 684–699. [Google Scholar] [CrossRef]
  64. Reboita, M.S.; Ambrizzi, T.; Silva, B.A.; Pinheiro, R.F.; da Rocha, R.P. The South Atlantic Subtropical Anticyclone: Present and Future Climate. Front. Earth Sci. 2019, 7. [Google Scholar] [CrossRef]
  65. Arraut, J.M.; Nobre, C.; Barbosa, H.M.J.; Obregon, G.; Marengo, J. Aerial Rivers and Lakes: Looking at Large-Scale Moisture Transport and Its Relation to Amazonia and to Subtropical Rainfall in South America. J. Clim. 2012, 25, 543–556. [Google Scholar] [CrossRef]
  66. Carvalho, L.M.V.; Silva, A.E.; Jones, C.; Liebmann, B.; Silva Dias, P.L.; Rocha, H.R. Moisture Transport and Intraseasonal Variability in the South America Monsoon System. Clim. Dyn. 2011, 36, 1865–1880. [Google Scholar] [CrossRef]
  67. Kodama, Y.-M.; Sagawa, T.; Ishida, S.; Yoshikane, T. Roles of the Brazilian Plateau in the Formation of the SACZ. J. Clim. 2012, 25, 1745–1758. [Google Scholar] [CrossRef]
  68. Quadro, M.F.L.d.; da Silva Dias, M.A.F.; Herdies, D.L.; de Gonçalves, L.G.G. Análise Climatológica Da Precipitação e Do Transporte de Umidade Na Região Da ZCAS Através Da Nova Geração de Reanálises. Rev. Bras. Meteorol. 2012, 27, 152–162. [Google Scholar] [CrossRef]
  69. Pearce, F. Rivers in the Sky. New Sci. 2019, 244, 40–43. [Google Scholar] [CrossRef]
  70. Bergier, I.; Assine, M.L.; McGlue, M.M.; Alho, C.J.R.; Silva, A.; Guerreiro, R.L.; Carvalho, J.C. Amazon Rainforest Modulation of Water Security in the Pantanal Wetland. Sci. Total Environ. 2018, 619–620, 1116–1125. [Google Scholar] [CrossRef]
  71. Ruiz-Vásquez, M.; Arias, P.A.; Martínez, J.A.; Espinoza, J.C. Effects of Amazon Basin Deforestation on Regional Atmospheric Circulation and Water Vapor Transport towards Tropical South America. Clim. Dyn. 2020, 54, 4169–4189. [Google Scholar] [CrossRef]
  72. Stumpp, C.; Klaus, J.; Stichler, W. Analysis of Long-Term Stable Isotopic Composition in German Precipitation. J. Hydrol. 2014, 517, 351–361. [Google Scholar] [CrossRef]
  73. Giustini, F.; Brilli, M.; Patera, A. Mapping Oxygen Stable Isotopes of Precipitation in Italy. J. Hydrol. Reg. Stud. 2016, 8, 162–181. [Google Scholar] [CrossRef]
  74. Galewsky, J.; Steen-Larsen, H.C.; Field, R.D.; Worden, J.; Risi, C.; Schneider, M. Stable Isotopes in Atmospheric Water Vapor and Applications to the Hydrologic Cycle. Rev. Geophys. 2016, 54, 809–865. [Google Scholar] [CrossRef] [PubMed]
  75. Salati, E.; Dall’Olio, A.; Matsui, E.; Gat, J.R. Recycling of Water in the Amazon Basin: An Isotopic Study. Water Resour. Res. 1979, 15, 1250–1258. [Google Scholar] [CrossRef]
  76. Gat, J.R.; Matsui, E. Atmospheric Water Balance in the Amazon Basin: An Isotopic Evapotranspiration Model. J. Geophys. Res. 1991, 96, 13179. [Google Scholar] [CrossRef]
  77. Pattnayak, K.C.; Tindall, J.C.; Brienen, R.J.W.; Barichivich, J.; Gloor, E. Can We Detect Changes in Amazon Forest Structure Using Measurements of the Isotopic Composition of Precipitation? Geophys. Res. Lett. 2019, 46, 14807–14816. [Google Scholar] [CrossRef]
  78. Zhu, G.; Guo, H.; Qin, D.; Pan, H.; Zhang, Y.; Jia, W.; Ma, X. Contribution of Recycled Moisture to Precipitation in the Monsoon Marginal Zone: Estimate Based on Stable Isotope Data. J. Hydrol. 2019, 569, 423–435. [Google Scholar] [CrossRef]
  79. Njitchoua, R.; Sigha-Nkamdjou, L.; Dever, L.; Marlin, C.; Sighomnou, D.; Nia, P. Variations of the Stable Isotopic Compositions of Rainfall Events from the Cameroon Rain Forest, Central Africa. J. Hydrol. 1999, 223, 17–26. [Google Scholar] [CrossRef]
  80. Kern, Z.; Hatvani, I.; Czuppon, G.; Fórizs, I.; Erdélyi, D.; Kanduč, T.; Palcsu, L.; Vreča, P. Isotopic ‘Altitude’ and ‘Continental’ Effects in Modern Precipitation across the Adriatic–Pannonian Region. Water 2020, 12, 1797. [Google Scholar] [CrossRef]
  81. Rozanski, K.; Araguás-Araguás, L.; Gonfiantini, R. Isotopic Patterns in Modern Global Precipitation. Geophys. Monogr. 1993, 78, 1–36. [Google Scholar] [CrossRef]
  82. Durieux, L. The Impact of Deforestation on Cloud Cover over the Amazon Arc of Deforestation. Remote Sens. Environ. 2003, 86, 132–140. [Google Scholar] [CrossRef]
  83. Dias, L.C.P.; Macedo, M.N.; Costa, M.H.; Coe, M.T.; Neill, C. Effects of Land Cover Change on Evapotranspiration and Streamflow of Small Catchments in the Upper Xingu River Basin, Central Brazil. J. Hydrol. Reg. Stud. 2015, 4, 108–122. [Google Scholar] [CrossRef]
  84. O’Connor, J.; Santos, M.J.; Rebel, K.T.; Dekker, S.C. The Influence of Water Table Depth on Evapotranspiration in the Amazon Arc of Deforestation. Hydrol. Earth Syst. Sci. 2019, 23, 3917–3931. [Google Scholar] [CrossRef]
  85. Farinosi, F.; Arias, M.E.; Lee, E.; Longo, M.; Pereira, F.F.; Livino, A.; Moorcroft, P.R.; Briscoe, J. Future Climate and Land Use Change Impacts on River Flows in the Tapajós Basin in the Brazilian Amazon. Earth’s Future 2019, 7, 993–1017. [Google Scholar] [CrossRef]
  86. Azevedo-Ramos, C.; Moutinho, P.; Arruda, V.L.D.S.; Stabile, M.C.C.; Alencar, A.; Castro, I.; Ribeiro, J.P. Lawless Land in No Man’s Land: The Undesignated Public Forests in the Brazilian Amazon. Land Use Policy 2020, 99, 104863. [Google Scholar] [CrossRef]
  87. Reydon, B.P.; Fernandes, V.B.; Telles, T.S. Land Governance as a Precondition for Decreasing Deforestation in the Brazilian Amazon. Land Use Policy 2020, 94, 104313. [Google Scholar] [CrossRef]
  88. Peng, T.-R.; Liu, K.-K.; Wang, C.-H.; Chuang, K.-H. A Water Isotope Approach to Assessing Moisture Recycling in the Island-Based Precipitation of Taiwan: A Case Study in the Western Pacific. Water Resour. Res. 2011, 47. [Google Scholar] [CrossRef]
  89. Wang, S.; Zhang, M.; Che, Y.; Chen, F.; Qiang, F. Contribution of Recycled Moisture to Precipitation in Oases of Arid Central Asia: A Stable Isotope Approach. Water Resour. Res. 2016, 52, 3246–3257. [Google Scholar] [CrossRef]
Figure 1. Map of São Francisco Xavier geographical location and topography of the region.
Atmosphere 12 00418 g001
Figure 2. Temporal variability of meteorological and isotopic variables in São Francisco Xavier, Brazil. (a) Monthly amount of precipitation (blue bars), monthly average air temperature (red line), and monthly average of relative humidity (green line). (b) Weighted average rainfall of δ18O (blue line), δ2H (red line), and d-excess (green line). Values in black parentheses represent the total number of collections in each month, and in red parentheses represent the number of collections during SACZ events. (c) Global Meteoric Water Line (GMWL) and Local Meteoric Water Line (LMWL).
Atmosphere 12 00418 g002
Figure 3. Boxplot of isotopic precipitation composition (δ18O, δ2H and d-excess) during the occurrence of the South Atlantic Convergence Zone (SACZ) during the entire collection period (ALL), excluding the samples during SACZ performance (NO SACZ). The numerical values of the boxplot are in the Supplementary Material (Table S2).
Atmosphere 12 00418 g003
Figure 4. Percent frequency of retrograde trajectory of the air parcel using the HYSPLIT model, calculated for São Francisco Xavier (black star) with 240 h return, at a 2000 m altitude, during (a) the occurrence of the South Atlantic Convergence Zone (SACZ), (b) during the entire collection period (ALL), and (c) excluding the samples during SACZ performance (NO SACZ).
Atmosphere 12 00418 g004
Figure 5. Infrared images from the GOES-16 satellite on the days when the SACZ was active in SFX (magenta star). Images selected on days and times when the precipitation collection presented more depleted isotopic signals for each SACZ event.
Atmosphere 12 00418 g005
Table 1. Interpretation of Spearman correlation coefficient.
Spearman Value (+ or −)Interpretation of the Degree of Correlation
0.00 a 0.19Very weak
0.20 a 0.39Weak
0.40 a 0.59Moderate
0.60 a 0.79Strong
0.80 a 1.00Very strong
Table 2. Spearman correlation between monthly averages of meteorological variables and the isotopic signal of precipitation in São Francisco Xavier, Brazil (Correlation graphical details are contained in the Supplementary Material—Figure S1).
Meteorological
Variables
δ18O (‰)δ2H (‰)d-excess (‰)
rsp-Valuersp-Valuersp-Value
Precipitation (mm)−0.800.003−0.87<0.001−0.810.002
Relative humidity (%)−0.91<0.001−0.92<0.001−0.780.004
Temperature (°C)−0.580.052−0.610.040−0.760.007
Table 3. Weighted average isotopic composition of precipitation in each South Atlantic Convergence Zone (SACZ) event and precipitation values, air temperature, and relative humidity.
EventDateN° of
Samples
δ18O
(‰)
δ2H
(‰)
d-excess
(‰)
Precipitation
(mm)
Air Temperature
(°C)
Relative
Humidity (%)
116 Feb 20192−9.0 ± 4.1−69.4 ± 32.72.6 ± 0.119.819.698
227 Feb–03 Mar 20197−12.6 ± 4.5−96.4 ± 35.74.6 ± 1.741.218.995
308 Apr 20191−12.5−89.610.68.817.5100
415 Nov 20191−8.1−52.112.628.217.599
505 Dec–06 Dec 20194−7.7 ± 2.0−51.9 ± 17.99.6 ± 2.739.418.798
623 Dec 20192−8.5 ± 2.9−54.4 ± 23.713.7 ± 0.734.818.1100
723 Jan 20202−7.9 ± 0.3−49.9 ± 3.013.9 ± 0.35.217.4100
803 Feb–04 Feb 20204−11.9 ± 1.5−82.5 ± 11.712.7 ± 4.932.419.998
909 Feb–11 Feb 20206−10.9 ± 3.1−76.9 ± 26.410.4 ± 2.680.618.599
Publisher’s Note: MDPI stays neutral with regard to jurisdictional claims in published maps and institutional affiliations.

