Article

Testing of Alternative Disc Brakes and Friction Materials Regarding Brake Wear Particle Emissions and Temperature Behavior

1
Department of Mechanical Engineering, Technische Universität Ilmenau, 98693 Ilmenau, Germany
2
Porsche AG, 70435 Stuttgart, Germany
3
Audi AG, 85057 Ingolstadt, Germany
*
Author to whom correspondence should be addressed.
Atmosphere 2021, 12(4), 436; https://doi.org/10.3390/atmos12040436
Submission received: 8 February 2021 / Revised: 22 March 2021 / Accepted: 23 March 2021 / Published: 29 March 2021
(This article belongs to the Special Issue Study of Brake Wear Particle Emissions)

Abstract

:
In this study, different disc brakes and friction materials are evaluated with respect to particle emission output and characteristic features are derived. The measurements take place on an inertia dynamometer using a constant volume sampling system. Brake wear particle emission factors of different disc concepts in different sizes are determined and compared, using a grey cast iron disc, a tungsten carbide-coated disc and a carbon ceramic disc. The brakes were tested over a section (trip #10) novel test cycle developed from the database of the worldwide harmonized Light-Duty vehicles Test Procedure (WLTP). First, brake emission factors were determined along the bedding process using a series of trip-10 tests. The tests were performed starting from unconditioned pads, to characterize the evolution of emissions until their stabilization. In addition to number- and mass-related emission factors (PM2.5–PM10), the particle size distribution was determined. Another focus was the evaluation of temperature ranges and the associated challenges in the use of temperature readings in a potential regulation of brake wear particle emissions. The results illustrate the challenges associated with establishing a universal bedding procedure and using disc temperature measurements for the control of a representative braking procedure. Using tungsten carbide coated discs and carbon ceramic discs, emission reduction potentials of up to 70% (PM10) could be demonstrated along the WLTP brake cycle. The reduction potential is primarily the result of the high wear resistance of the disc, but is additionally influenced by the pad composition and the temperature in the friction contact area.

1. Introduction

Airborne particulate matter has long been associated with negative environmental and health impacts [1]. Road traffic and transport are one of the main sources of airborne particulate matter in urban areas [2,3]. The contribution of exhaust emissions has decreased worldwide due to increasingly stringent regulations, the application of efficient powertrain units and exhaust aftertreatment systems [4]. Different studies show that other vehicle-related sources of particulate matter are a significantly higher contributor to traffic-related emissions. These include particulate brake wear [5]. Since most of the emitted particles belong to the size classes of particulate matter (≤10 µm) and differ significantly in their physico-chemical properties from automotive exhaust emissions, this source is of particular relevance to human health and is therefore the focus of scientific studies [6,7,8,9,10,11].

1.1. Brake Wear Particle Sampling and Measurement

Different approaches have been employed for the characterization of brake-wear particles. These can be classified into on-road, laboratory (inertia brake and chassis dynamometer), and pin-on disc measurements. A review of relevant studies identified inconsistencies possibly related to the lack of a standardized methodology for brake wear particle measurement [12]. To address the need for harmonization, a task force was established within the Particle Measurement Program (PMP) informal working group, under the auspices of the UNECE Working Group on Pollution and Energy (GRPE). The first step included the analysis of the database of the Worldwide harmonized Light-Duty vehicles Test Procedure (WLTP) to establish a brake emissions test cycle that would be representative of real-world operating conditions [13,14]. This concerns not only the driving and braking conditions, but also the temperature of the braking system. During the development process, the definition of a thermal load on the braking system, which is representative of the real operating conditions, was identified as a critical aspect. Since the release of nanoscale organic compounds was observed above a critical temperature threshold, a method was developed to limit the maximum temperatures [7,8,9,10,15,16]. The next step addressed the definition of an appropriate sampling setup. This is followed by the development of a brake emission protocol to guide future brake emission measurements. The development of the test procedure aims to determine particle number and particle mass equally. The challenge is to guarantee comparable and representative test conditions for the wide variety of brake system configurations available on the market. Particularly, the influence on the flow profile and particle dispersion makes the collection of representative samples a difficult task. This is already influenced by the particle injection, which is very inhomogeneous and shows a high time dependence [17].
Accordingly, the group decided on the brake test rig approach and the use of a dilution tunnel, which allows the parallel measurement of emission factors of particle number and mass fractions [18]. The evacuation of the particle-laden flow to the sampling position follows the driving direction. This results in another challenge in terms of transport and sampling of super-micron particles [19]. The method currently developed allows for realistic driving and braking conditions, definition of the test inertia based on the force distribution specified by the vehicle manufacturer, options to correct for parasitic vehicle losses and adjustment of the cooling flow rate based on real vehicle temperature profile data. Nevertheless, there is currently, and probably will be in the future, no way to mimic the aerodynamics of the vehicle, given the wide variety of configurations available on the market. In addition, the method replicates the primary brake emissions under strictly controlled laboratory conditions and does not capture the ambient dilution, particle transport, losses and deposition on the vehicle and on the road that occur in the real world. To allow reproducible test conditions, the simulation of extreme weather conditions that may occur in the real world is also omitted [13].

1.2. Influence of Brake Disc Temperature and Interaction with the Flow Rate

This section contains an excerpt on the current state of research on the temperature distribution within the friction contact of disc brakes, the correlation between temperature and formation of nanoparticles (defined in this study as particles <1 μm), and the current PMP working group approach to temperature regulation. In addition, it outlines the challenges in developing a methodology for measuring brake particle emissions as a basis for a potential legislative process, which is a primary motivation for conducting this study.
Brake wear aerosol is a complex physico-chemical mixture whose composition and morphology depends on the chemical–physical properties of the friction partners and the braking conditions [16,20]. The particle number concentration is known to be influenced by the use of differently calibrated condensation particle counter (CPC) cut-offs [16,17]. In these tests, ECE (Economic Commission for Europe; low steel brake pads for the European market) and non-asbestos organic (NAO) brake pads were tested with conventional grey cast iron discs of an upper middle class vehicle (D-segment). Peak temperatures ˂ 180 °C could be recorded under WLTP data basis (trip #10 of the WLTP brake cycle) according to the PMP temperature specifications. A linearity comparison between CPCs with differently calibrated cut-offs (10 nm and 23 nm) results in a coefficient of determination R2 = 0.99, which indicates a very high comparability. The particles are assigned to a size spectrum > 23 nm or 55 nm (plateau of the CPC efficiency curve). From measurements of the particle size distribution using an electrical low-pressure cascade impactor (ELPI) (Dekati, Ltd., Tampere, Finland), concentration peaks between 0.8–3.0 μm (monomodal distribution) with a lower limit of 0.2–0.3 μm can be derived for ECE and NAO brake pad materials. The formation of nanoparticles results from locally occurring peak temperatures (hot bands) > 180–200 °C (temperature threshold 1). The actual chemistry and morphology of the emitted particles will depend on both the brake–pad formulation and the operating conditions [7,15,20,21,22,23,24]. Nucleation of evaporated organic constituents like phenolic resins typically employed in binders is identified as the most likely pathway [7,10]. Another threshold temperature could be assigned to a temperature range of 450–500 °C (temperature threshold 2) [17].
The inhomogeneous and dynamic temperature profiles on the surface of the brake disc, shown in Figure 1 and Figure 2, are the result of inhomogeneous contact conditions due to the dynamic processes in the contact area [24].
The dynamic brake pressure-dependent change in local energy transfer is related to this. For the floating caliper brake used, the energy transfer at brake pressures < 30 bar occurs primarily via the inner ring. In the other case, the energy is transferred via the outer ring at maximum brake pressures. This effect results from the expansion of the brake caliper under increasing brake pressure [25]. The hotband characteristics are very dynamic and not constant over time, which can be explained by the dynamic processes in the frictional contact. The temperature profiles were measured using a thermographic camera (InfraTec GmbH, Dresden, Germany). This enables the measurement of surface temperatures in the visible area of the friction ring. To follow the current recommendations of the PMP group, the measurement of the braking temperature in this study is done with embedded Ni-Cr-Ni thermocouples. These are positioned 0.5 ± 0.1 mm below the disc surface 10 mm outwards of the centre of the friction path. With embedded thermocouples, the temperature of the brake disc body can be measured due to heat conduction, which is the result of friction and energy conversion. This results in temperature differences between these two measurement methods, which are higher the higher the converted friction energy and friction power per braking event. As a result of the described inhomogeneous temperature distribution, it is to be expected that reproducible and representative temperature measurements using embedded thermocouples is a challenge [17]. It is to be expected that the local temperature peaks occurring in the frictional contact, which seem to be responsible for the formation of nanoparticles, cannot be clearly detected. This is especially the case for high power braking events. Previous studies have demonstrated temperature differences of up to 120 °C (200→170 km/h) [17]. The temperature distribution should also be influenced by the material properties of the brake disc, which has not been investigated so far. Currently, it is recommended that temperature profiles be bound within specific ranges (e.g., average and maximum brake temperature) and that the flow rate be used as a means of adjusting the measured temperatures. An extract of the specified temperatures is shown in Table 1 [14,26].
In addition to the challenges associated with measuring maximum temperatures described above, non-compliance with the PMP minimum average temperature specifications for some brakes was demonstrated in previous studies [17]. Flow velocities of approximately 4.5 km/h were selected for the tests, which corresponds to a low cooling capacity. The deviation from the PMP temperature specifications can be explained by the dimensioning and heat capacity of the disc to ensure high friction power and high stability of the coefficient of friction even under very sporty driving conditions. Even tests with deactivated cooling current did not lead to compliance with the temperature specifications.
Additional investigations were conducted to evaluate the influence of varying flow rates (Table 2) on the disc temperature [27]. The flow velocities around the brake correspond to 6, 25, and 50 km/h. An ECE pad and an internally ventilated disc of a C-segment car were used for the tests. The disc has a mass of 6.5 kg and a diameter of 278 mm. A moment of inertia of 56.7 kg/m2 was simulated. A test without activated cooling represents the reference. As expected, the average temperature decreases as the flow rate increases. It is remarkable that the maximum temperature is significantly less influenced by the flow rate compared to the average temperature. The range is up to 28 °C for the average temperature and 18 °C for the maximum temperature. The specified average temperature is maintained for flow rates significantly lower than 25 km/h.
It can be assumed that conductive heat transfer at the disc during actual braking is much faster than convective cooling. This means that regulating the flow rate will have only a marginal effect on the maximum temperatures [28]. With respect to the average temperature, the spatial inhomogeneity of the temperature profile during transient braking maneuvers will only slightly influence the measurement accuracy. Due to the inhomogeneous temperature distribution described above, embedded thermocouples are not expected to be able to detect the local and microscopic temperatures within the friction contact in a repeatable manner, which are associated with the formation process of nanoparticles. Large differences between flow rates are to be expected with the chosen method to meet the specified temperature values for each individual brake available on the market. This also concerns differences between laboratories due to different dimensions and designs of the sampling systems. The challenge for the PMP IWG (Informal Working Group) will be to ensure the requirements for transport efficiency and uniformity despite these differences in order to enable reproducible and representative measurements [14].
The local friction contact between pad and disc can lead to secondary particle emissions [17]. These emissions can be observed in Figure 6 in the time range of 2.020–2.060 s during the phases of constant acceleration and constant velocity, measured as particle number concentration (GCI disc). Secondary emissions are defined as emissions that are not the result of a deceleration using hydraulic pressure. These emissions can occur as soon as the restoring force does not completely decouple the brake pads from the disc. Due to the continuous rotation of the disc, individual particles embedded in the friction layer can be released and emitted, which is described as local and continuous wear. It is also possible that the critical threshold temperature (threshold 1) is locally exceeded, which leads to a temperature-dependent emission of nanoparticles (< 23 nm). The proof was provided by measuring the temperature on the disc using a thermographic camera. Temperature differences of up to 15 °C could be detected through local contact. The available information on the condition of these volatile nanoparticles suggests that the exhaust solid PN method (e.g., with a volatile particle remover tempered to 300/350 °C) can effectively eliminate them [17,25,29]. Only limited recommendations can be made for solid nanoparticles.

1.3. Bedding Procedure to Achieve Representative Friction and Emission Behaviour

The formation process of the friction layer typically results in a drop in the wear rate due to reduced abrasive wear and an increase in the coefficient of friction. The reduction of the wear rate is associated with a reduction of the particle emission rate, which is strongly influenced by the composition of the friction partners. [17,30,31,32,33,34]. The inhomogeneous contact conditions and surface topography as a result of the unformed friction layer are mentioned as an explanation. Due to the inhomogeneous contact conditions, the real microscopic contact pressures are significantly higher than the nominal contact pressures. The dynamic surface changes result in dynamic and locally occurring friction values, temperatures and wear rates. The bedding process is completed when an equilibrium is reached between the particles migrated into the friction layer and those released and emitted [17,31,32]. The speed at which the friction layer forms is approximately constant compared to the degrading layers. After completion of the bedding process, the brake wear particle emissions and the composition of the friction layer remain almost constant as long as the operating conditions do not change. Inhomogeneous surface structures, which are significantly more pronounced with the ECE compared to the NAO, are smoothed out by wear particles. If the operating conditions, such as the surface pressure, rotational speed or temperature are changed, the contact conditions or the composition of the friction layer, the coefficient of friction and the number of emitted particles can change. In addition, the bedding process can occur again after a time interruption (standstill) or due to environmental influences (e.g., humidity) [17,34].
The number of cycles and friction energy required to complete the bedding processes differed for different friction materials. For a tested grey cast iron disc with an ECE brake pad, a factor of 2 less cycles was required compared to a conventional grey cast iron disc with an NAO brake pad. At the same time, the number-related emission factor using the ECE brake pad was higher by a factor of 3.5 and different concentration curves can be observed. The drop in the number-related emission factors is clearly more pronounced for the ECE brake pad. Influenced by the material properties of the friction partners, a different composition of the friction layer and the emitted wear particles results. In summary, the friction energy and number of cycles converted until the end of the bedding process as well as the emission process are material characteristics that are particularly influenced by the wear rate [17,35].

1.4. Brake Emissions Reduction

The trade-off between brake performance and brake wear particle emissions can only be resolved to a limited extent with the pad mixtures known to date. Brake wear particle emissions can be reduced by using low-wear brake pad mixtures, such as NAO–friction materials [17]. Significantly higher reduction potentials can be expected by using wear-resistant brake discs such as tungsten carbide-coated discs (HMC) or carbon–ceramic discs (CC) [17]. However, market penetration of these disc concepts is currently limited to use in high-performance sports cars and luxury class vehicles due to the continuing high costs. HMC discs are much cheaper to produce than CC discs and offer significantly higher market penetration. Scientific studies confirming the reduction potential of wear-resistant brake discs are not available. In addition, filtering and extraction devices for capturing the emitted particles are under development. Advantages have already been demonstrated with prototypes. Information on the required replacement intervals of the filters as well as the energy consumption to be calculated is not yet finally possible.
With increasing electrification of the drive train, the possibility of regenerative braking increases. The use of the friction brake for vehicle deceleration decreases dramatically. This is especially true for low decelerations. Nevertheless, modern BEVs (Battery Electric Vehicle) have a high recuperation capacity, making decelerations of up to 3.8 m/s2 feasible without using the friction brake. For BEVs, a reduction in brake wear emissions of up to > 90% (particle number) is possible. Emission reductions of well over 50% can also be demonstrated for mild hybrids with an integrated 48-V starter generator [17] (p. 123).

1.5. Required Examinations

Studies on brake wear emissions have so far primarily been carried out with conventional cast iron brake discs [19,24,25,36,37]. There is a lack of studies to identify the emission characteristics and emission reduction potential of alternative friction materials. For this purpose, front axle brake discs (conventional grey cast iron disc (GCI), tungsten carbide-coated disc (HMC), and carbon ceramic disc (CC)) of the same vehicle (vehicle 1) with comparable disc dimensions (max. difference of the diameter: 4 mm; identical disc thickness) and serial brake pads adapted per disc concept are compared. To classify the emission reduction potentials and evaluate influencing variables (such as temperature or friction surface), a comparison of varying disc and pad dimensions (vehicle 2) is included. The operating conditions for sampling and measurement remain identical for all tests. Differences exist in the design of the fixed caliper used and the number of pistons.
Measured properties included gravimetric PM2.5 and PM10, and particle number (PN) concentrations to relate to a potential legislative procedure. Part of the comparison is the analysis of the emission behaviour over the bedding process as well as the evaluation of the influence of temperature. By measuring disc temperature and particle size distribution in parallel, the correlation between temperature and the formation of nanoparticles per disc concept is evaluated. The disc temperature is measured according to the method developed by the PMP IWG, which allows a variation of the flow rate in case of non-compliance with the temperature specifications. A chemical and physical analysis of the friction partners concludes the study.

2. Experimental

2.1. Brake System and Friction Materials

A conventional GCI (diameter: 390 mm) is compared with a HMC disc (diameter: 390 mm) and a CC disc (diameter: 394 mm) in terms of particle emission behaviour. The front axle brakes (J-segment vehicle) are tested under identical conditions; described as vehicle 1. The moments of inertia and effective radius designated by the vehicle manufacturer were employed in the study corresponding to 90.9 kg*m2 and between 161.7 mm (GCI) and 164.8 mm (CC). The geometric design of the brake discs aims at efficient cooling and high friction performance. To ensure realistic test conditions, serial ECE-brake pads are used that are adapted and approved for the different brake discs. One set of components (pad and disc) is tested per brake. The GCI disc is protected against environmental influences by an anti-corrosion layer which is removed during the initial phase. The brake pads shown in Figure 3 differ significantly in their composition (Table 3).
The elemental proportions were determined using a scanning electron microscope (energy dispersive X-ray analysis; JEOL JSM-6610). In addition, proportions of Mg, Si, Cr, Zn, and Sn can be detected in all brake pads. What is different is that the friction materials of the tungsten carbide-coated disc contains Zr. Ti is also detected in the CC-brake pad. To classify the results, additional tests are made for a second vehicle (vehicle 2; J-segment) with series brakes available on the market in each case.
The serial brakes available on the market are selected in the dimensions of 350 mm-GCI, 415 mm-HMC, and 440 mm-CC. Even though the disc dimensions differ, this comparison allows a deeper understanding of the influence of the disc dimensioning on the temperature and emission behaviour. For vehicle 2, a moment of inertia of 115.97 kg*m2 is simulated.

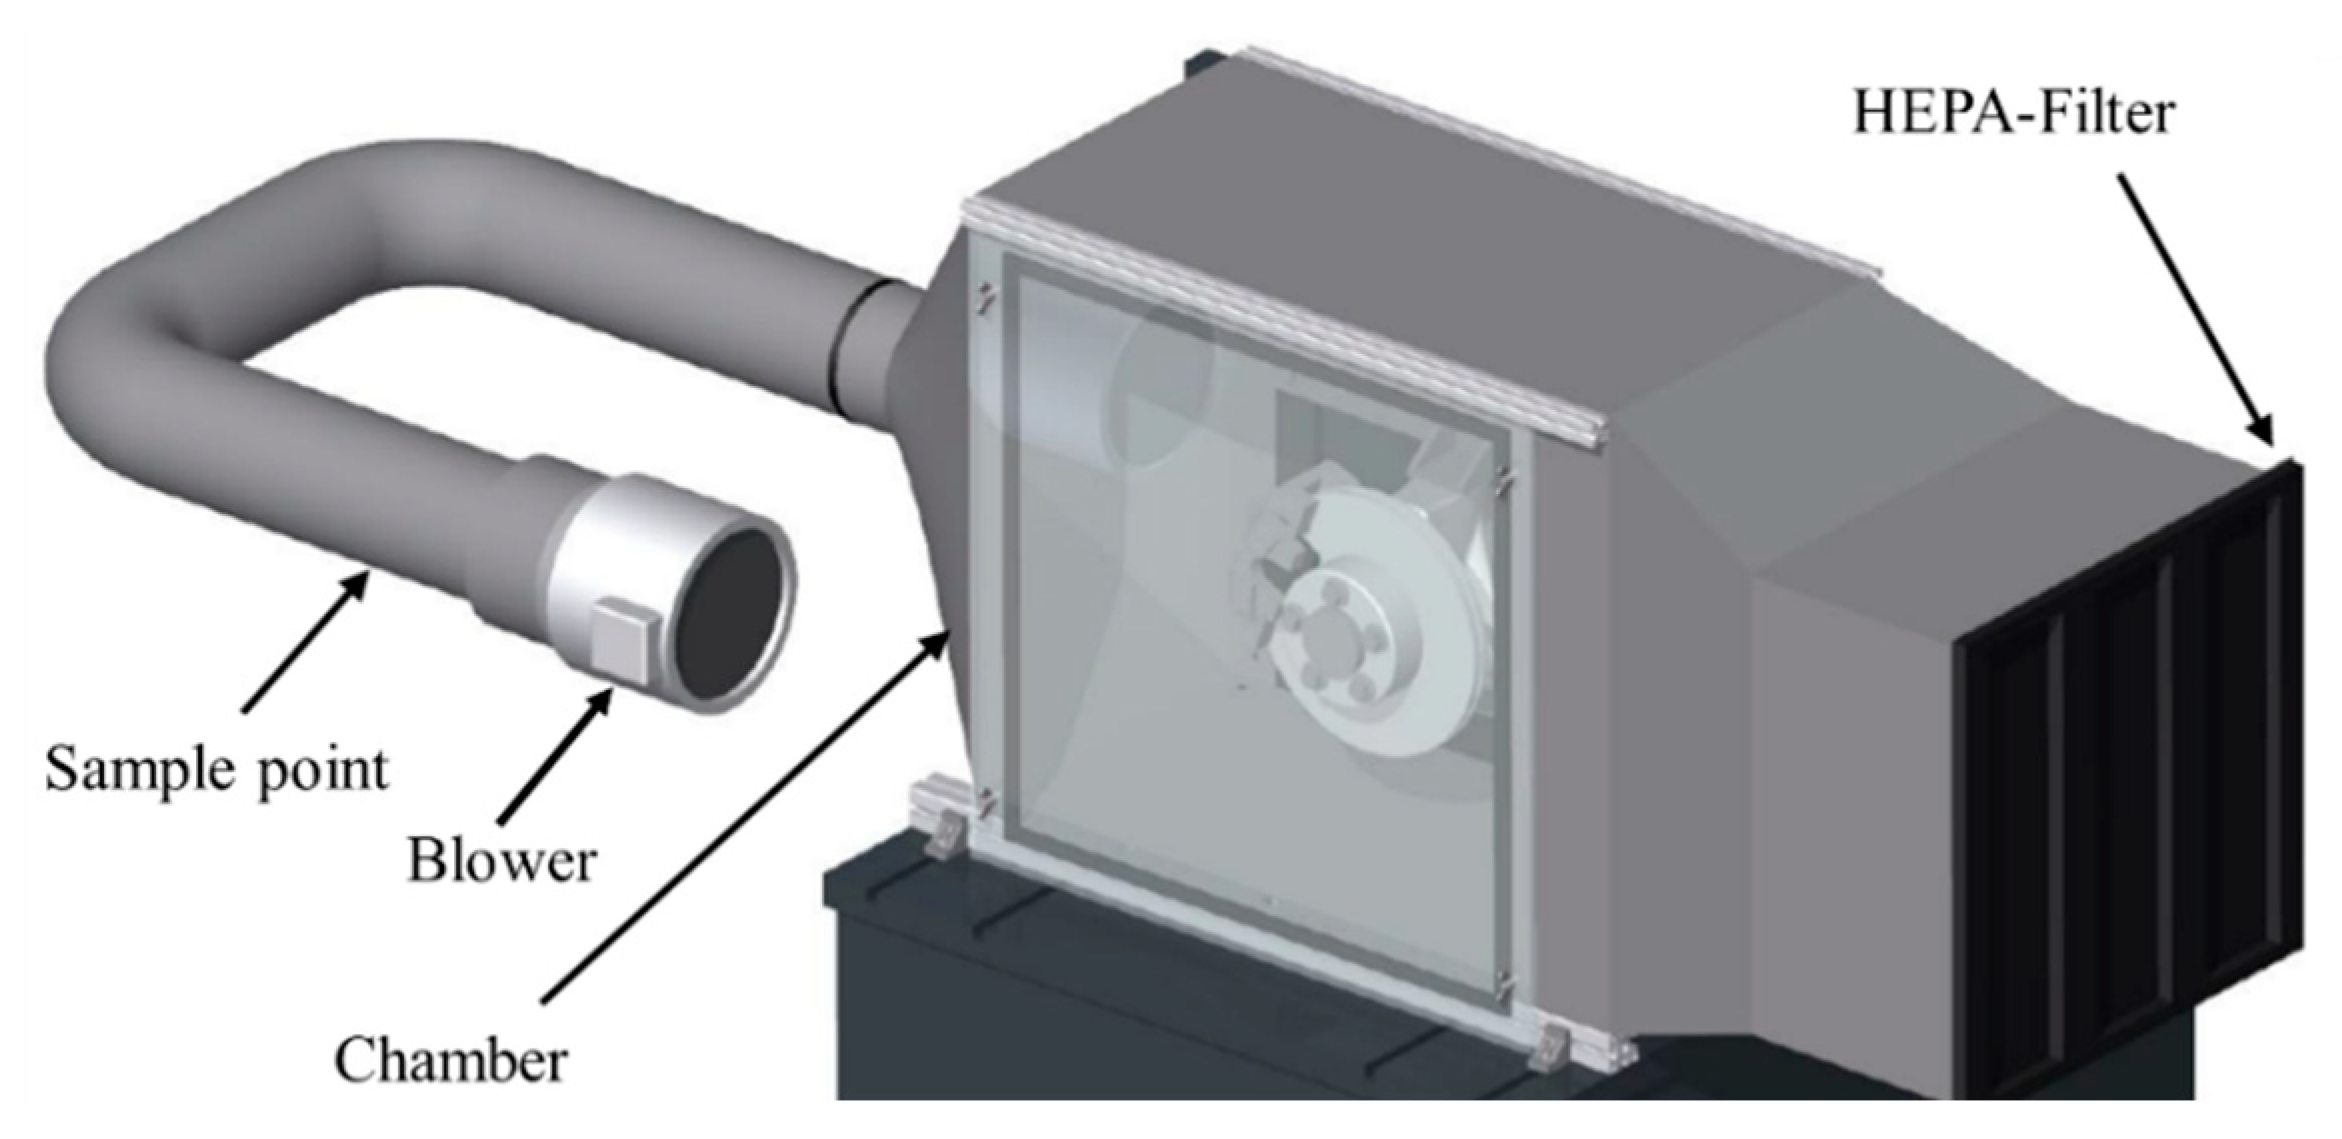
2.2. Brake Dyno and Dilution Tunnel

All brakes were tested on an inertia dynamometer (Link 3900 NVH) in a fully air-conditioned test chamber. The brake assembly is fully closed (exchange time < 2.5 s) and is rotating in the direction of evacuation. A photo of the dilution tunnel used in this study is shown in Figure 4. A high efficiency particulate air (HEPA H13) filter is installed at the inlet of the chamber. Airflow is controlled by a blower located downstream which was set at 850 m3/h, which corresponds to an average flow velocity of 1.66 m/s around the periphery of the brake. The particle loaded air flow is transported to the sampling position. The specific exhaust duct configuration was established following CFD simulations as the best compromise between space limitations in commercial brake-dyno chambers and optimized particle mixing and penetration [38].

2.3. Particle Sampling and Measurement

Samples were extracted from the dilution tunnel using isokinetic probes compliant to EN 13284-1 and ISO 9096 (Paul Gothe GmbH). The air flow is determined downstream of the sampling position with a differential pressure transmitter (KIMO). A 90° bend probe design was used with the sample nozzle installed vertically facing the flow. PN and PM samples are collected in parallel, each with one probe placed in the same plane at a distance of 1 cm from the duct center. A third probe is installed to take a sample to determine the particle size distribution. For PN samples, a TSI 3708 4-way flow divider was used to provide the collected sample to two connected particle counters. Probe nozzle diameters were selected to achieve isokinetic ratios of 1 ± 0.1 for both tunnel flows tested.
The sample is sucked into the 3-stage cascade impactor (Paul Gothe GmbH) through the inlet of the plane filter device (ISO 23,210 and VDI 2066 part 7) and the aerosol is fractionated in the particle size classes > 10 μm, 10–2.5 μm (coarse PM) and < 2.5 μm (fine PM). The impactor was designed and calibrated for PM10/PM2.5 in-stack measurements. Due to a relatively high volume flow of 3.2 m3/h (depending on the gas conditions) corresponding to the nominal 50% cutoff sizes at 10 and 2.5 μm, sampling times are kept short (for dust concentrations of 20 mg/m3/h) [39]. The sample is deposited per size fraction on glass fiber filters (Munktell MG 160). According to VDI 2066, the detection limit of the filter loading is 0.3 mg for PM2.5 and 0.4 mg for PM10. To ensure that the particle deposition and the isokinetic sampling conditions do not change over the course of a test cycle, the ambient conditions (temperature and pressure) must be monitored continuously. For this purpose, an automatic control unit is used, which regulates the impactor flow rate according to the ambient conditions. In addition to determining mass-related PM emission factors, the PM10-PM2.5 ratio is used to evaluate emission characteristics and size-specific differences. This allows differences between the tested friction materials to be identified in terms of size distribution.
The XSR225DU precision balance from Mettler Toledo is used for gravimetric determination of the filter mass. The weight of the filter inserts is determined before and after each test. The accuracy is 0.01 mg with a repeatability of 0.02 mg. Despite the relatively large amount of mass collected, the pressure drop was insignificant and the sample flow rate remained constant during the tests due to the regulation of the isokinetic control unit. The filters were conditioned for 24 h in a temperature and humidity controlled climatic cabinet before each measurement. Weighing was done 5 times to minimize measurement inaccuracies.
A 10-nm (D50) CPC (TSI 3772) with dual-dilution system was used to measure the PN emissions in accordance to the automotive exhaust European regulation [40]. The CPC is configured with a sampling unit, a volatile particle remover (primary diluter (PND1)/secondary diluter (PND2)/catalytic stripper (CS)), and a particle counter. First, the sample is collected from the dilution tunnel and coarse mode-particles are removed by a pre-classifier (cyclone) with a cut off size of 2.5 μm. Next, the samples were diluted 15 times (PND1) in a heated diluter using hot air at 191 °C, and then thermally treated in a catalytic stripper (CS) operating at 350 °C. A second 10:1 dilution with air at room temperature cooled down the sample bringing it to the appropriate concentration levels for the counting unit (35 °C or less). An ELPI was used in dedicated tests to investigate the size of the emitted particles. The ELPI is using a unipolar corona charger to condition the particle charge but utilizes impactors (connected to sensitive electrometers) for size classification of the charged particles. The ELPI has 13 impactor stages and an absolute filter stage, covering the aerodynamic mobility size range of 6 nm to ~10,000 nm. The ELPI shows acceptable agreement with a CPC (reference for determining particle number concentration) [16,17]. Calculating the electrical mobility size distribution from the ELPI, requires an assumption on the effective particle density, which in general may vary with particle size and friction material composition. To ensure uniform assumptions, the calculation of the size-resolved number concentration is carried out within the scope of this work with a uniform density of 1 g/cm3 (corresponding to the aerodynamic diameter).

2.4. Test Protocol

Currently, the brake emissions protocol specifies a fixed number of cycles (WLTP brake cycle) to generate a stable transfer layer, brake effectiveness and level of brake emissions before the actual cycle to characterize the friction brake in terms of emissions is performed. The aim is to achieve an emission level equivalent to the service life of the brake. This approach was developed using GCI discs, which are expected to shorten the duration of the bedding procedure in the case of higher wear. The extent to which this approach can be transferred without restriction to alternative brake concepts and friction materials has been clarified in the following investigations.
The bedding process is analysed along a series of trip #10 of the WLTP brake cycle. Since no definition is available in the literature that can be used to describe the bedding process on the basis of particle emission behaviour, a trend analysis is carried out. A deviation of <5% over 5 consecutive number-related emission factors (CPC) is assumed as the target value. From this point on, a completed bedding process and an emission level that is reproducible over the further test period is assumed. According to the previous descriptions, the formation of the friction layer and the duration of the bedding process depend on the test cycle, the temperature and brake pressure level. The bedding process can be accelerated under certain operating parameters [41]. The disadvantage is that increasing the brake pressure, the rotation speed, and possibly the temperature significantly changes the structure and composition of the friction layer. This can result in deviating emission behaviour and should be avoided against the background of representative test conditions. The bedding process cannot be understood as a universal and arbitrarily transferable process in which a fixed predefined number of cycles always leads to the identical result. To verify the assumptions, the emission behaviour for the presented brakes of different dimensions (vehicle 1 and 2) and material properties (GCI, HMC and CC) is to be compared. The test procedures remain identical to those described above.
The tests were performed according to the PMP brake protocol at an environment temperature of 20 ± 2 °C and a relative humidity of 50 ± 5% [25]. Testing is done with production brake and wheel assemblies (unused, brand new brake components). The trip #10 of the novel braking test cycle, derived from the analysis of the WLTP database [13], was selected for the investigations. A series of trip #10 tests were performed starting from unconditioned pads, to characterize the evolution of emissions until their stabilization. For all cycles performed, the initial temperature is set to 40 °C according to the protocol. This last trip #10 corresponds to ~33% of the total cycle duration and total driven distance. Trip #10 includes the top 5% braking events that are considered by the PMP group as indicators for the representativeness of the established temperatures [42]. Disc temperature measurements were measured for all brakes with embedded thermocouples. The thermocouple is positioned radially 10 mm off the centre of the friction path and recessed 0.5 mm deep into the face of the disc, in accordance to the recommendations of the PMP working group.

3. Results

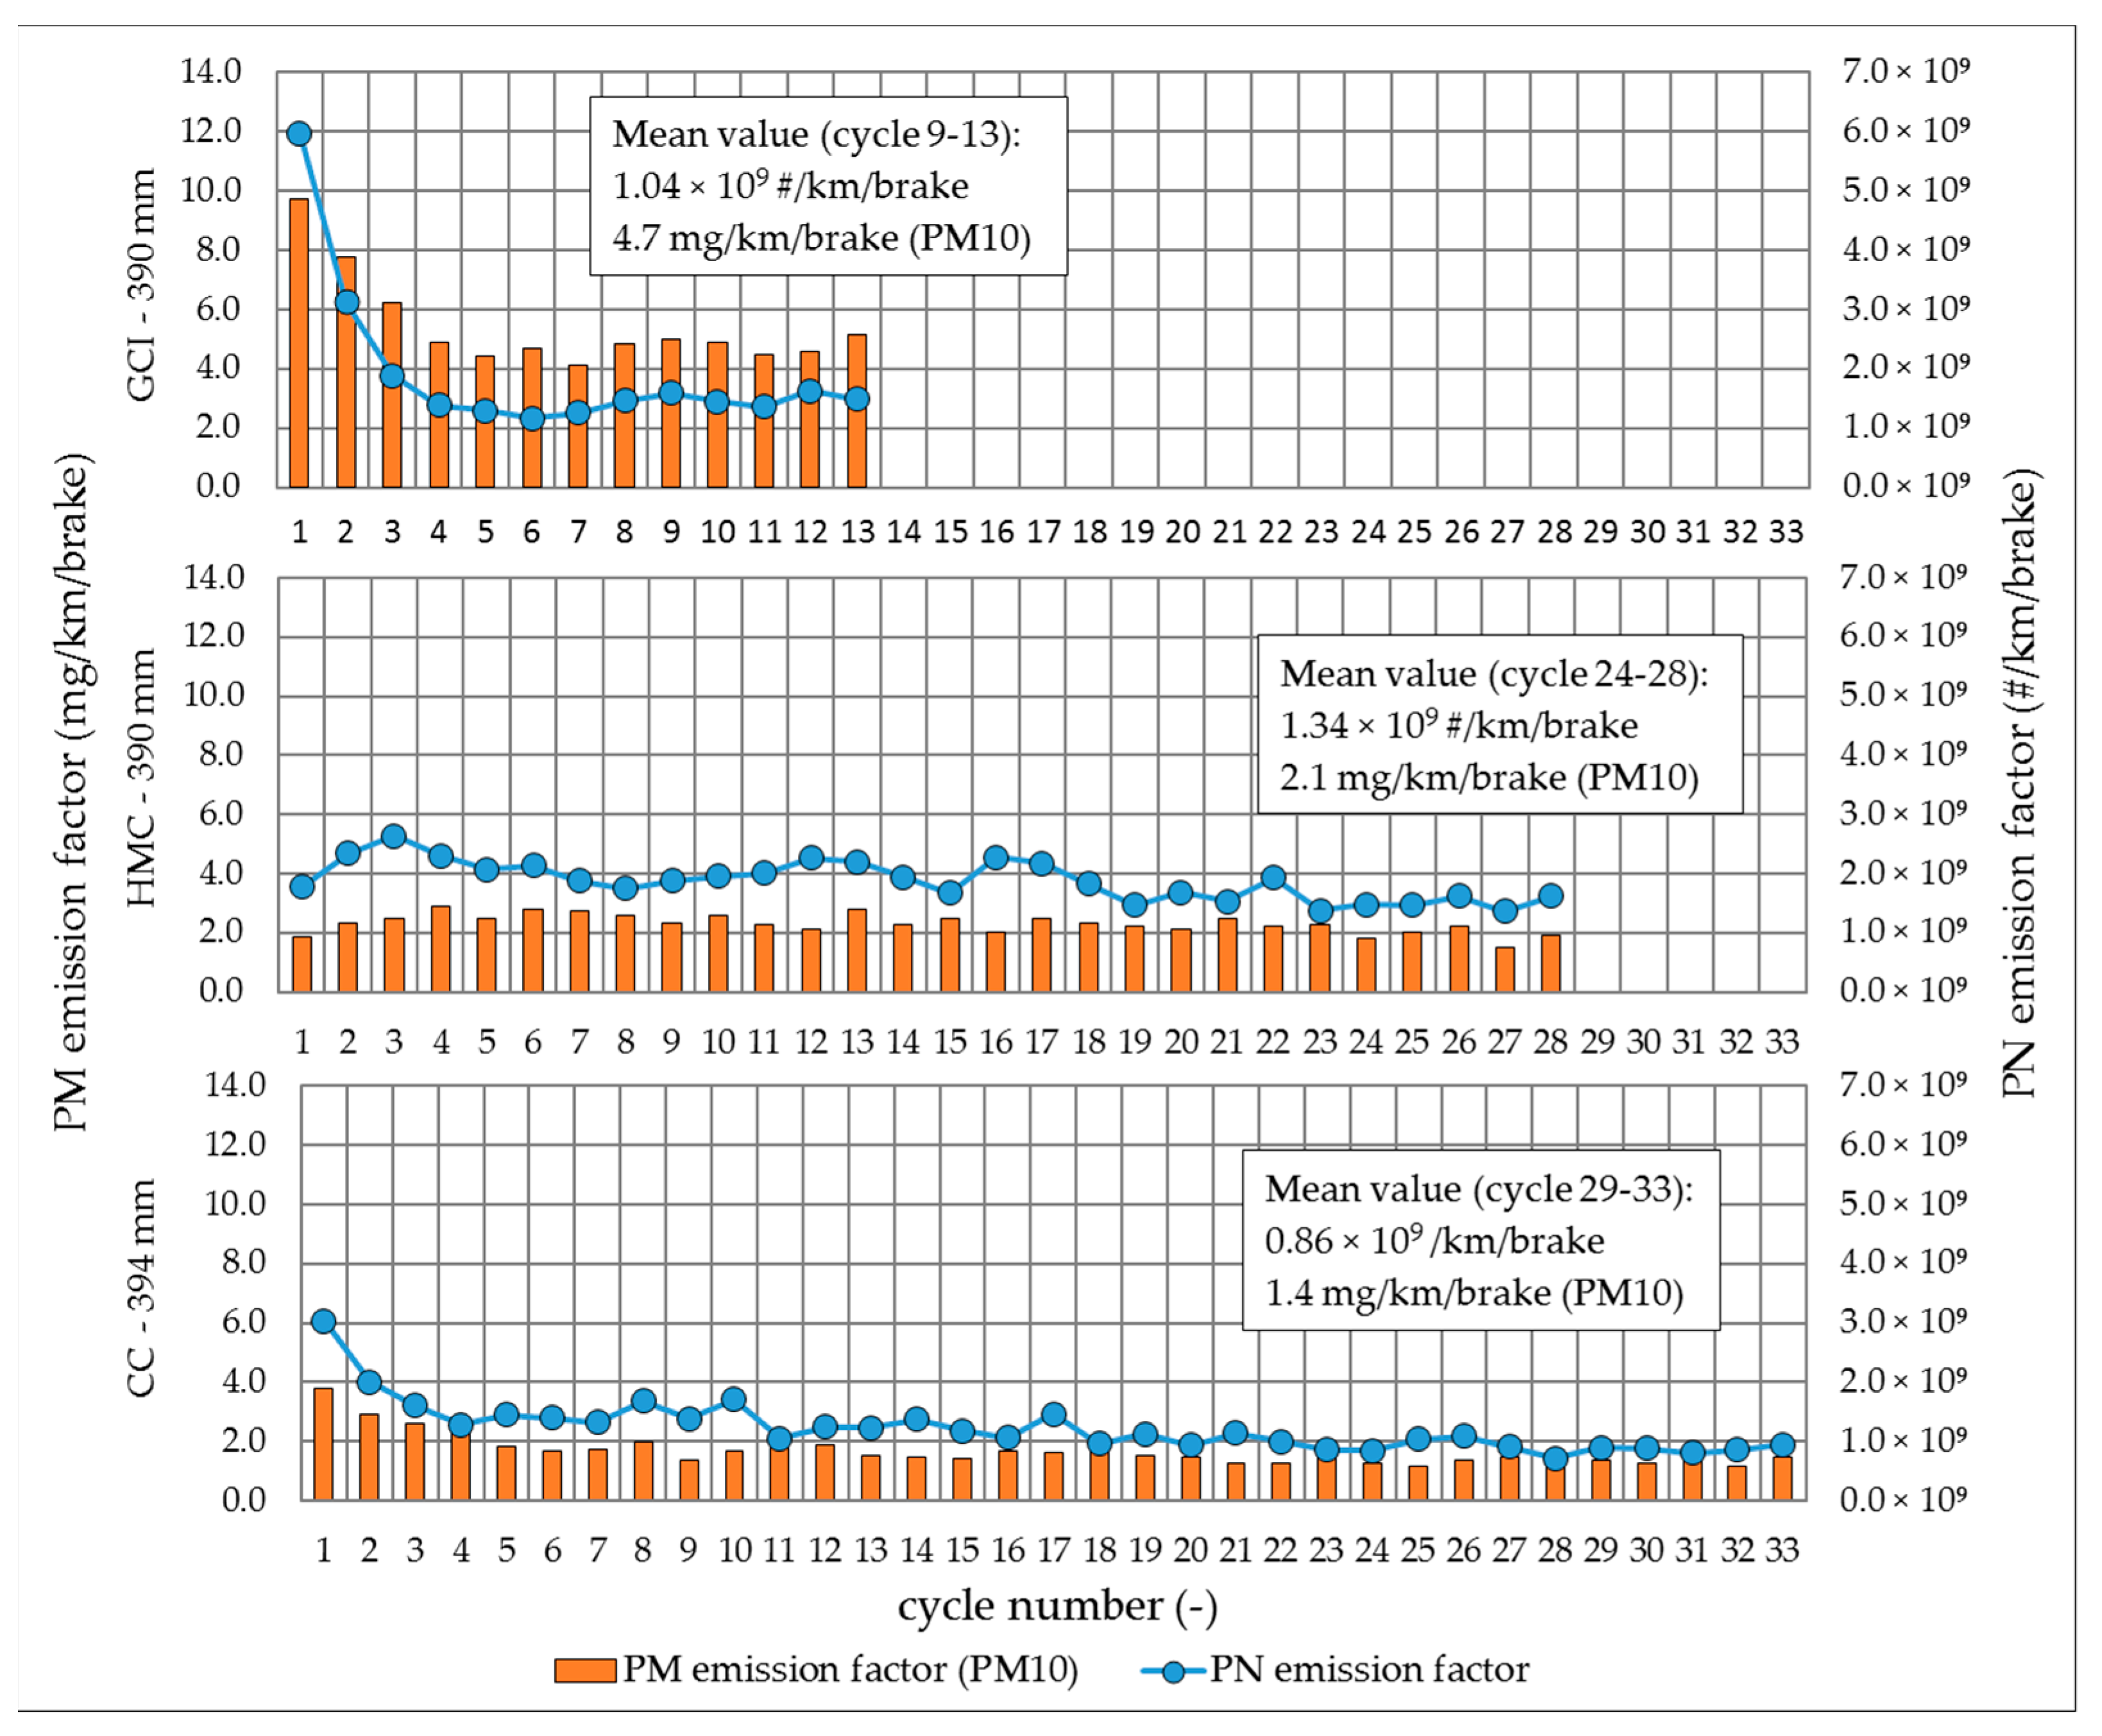
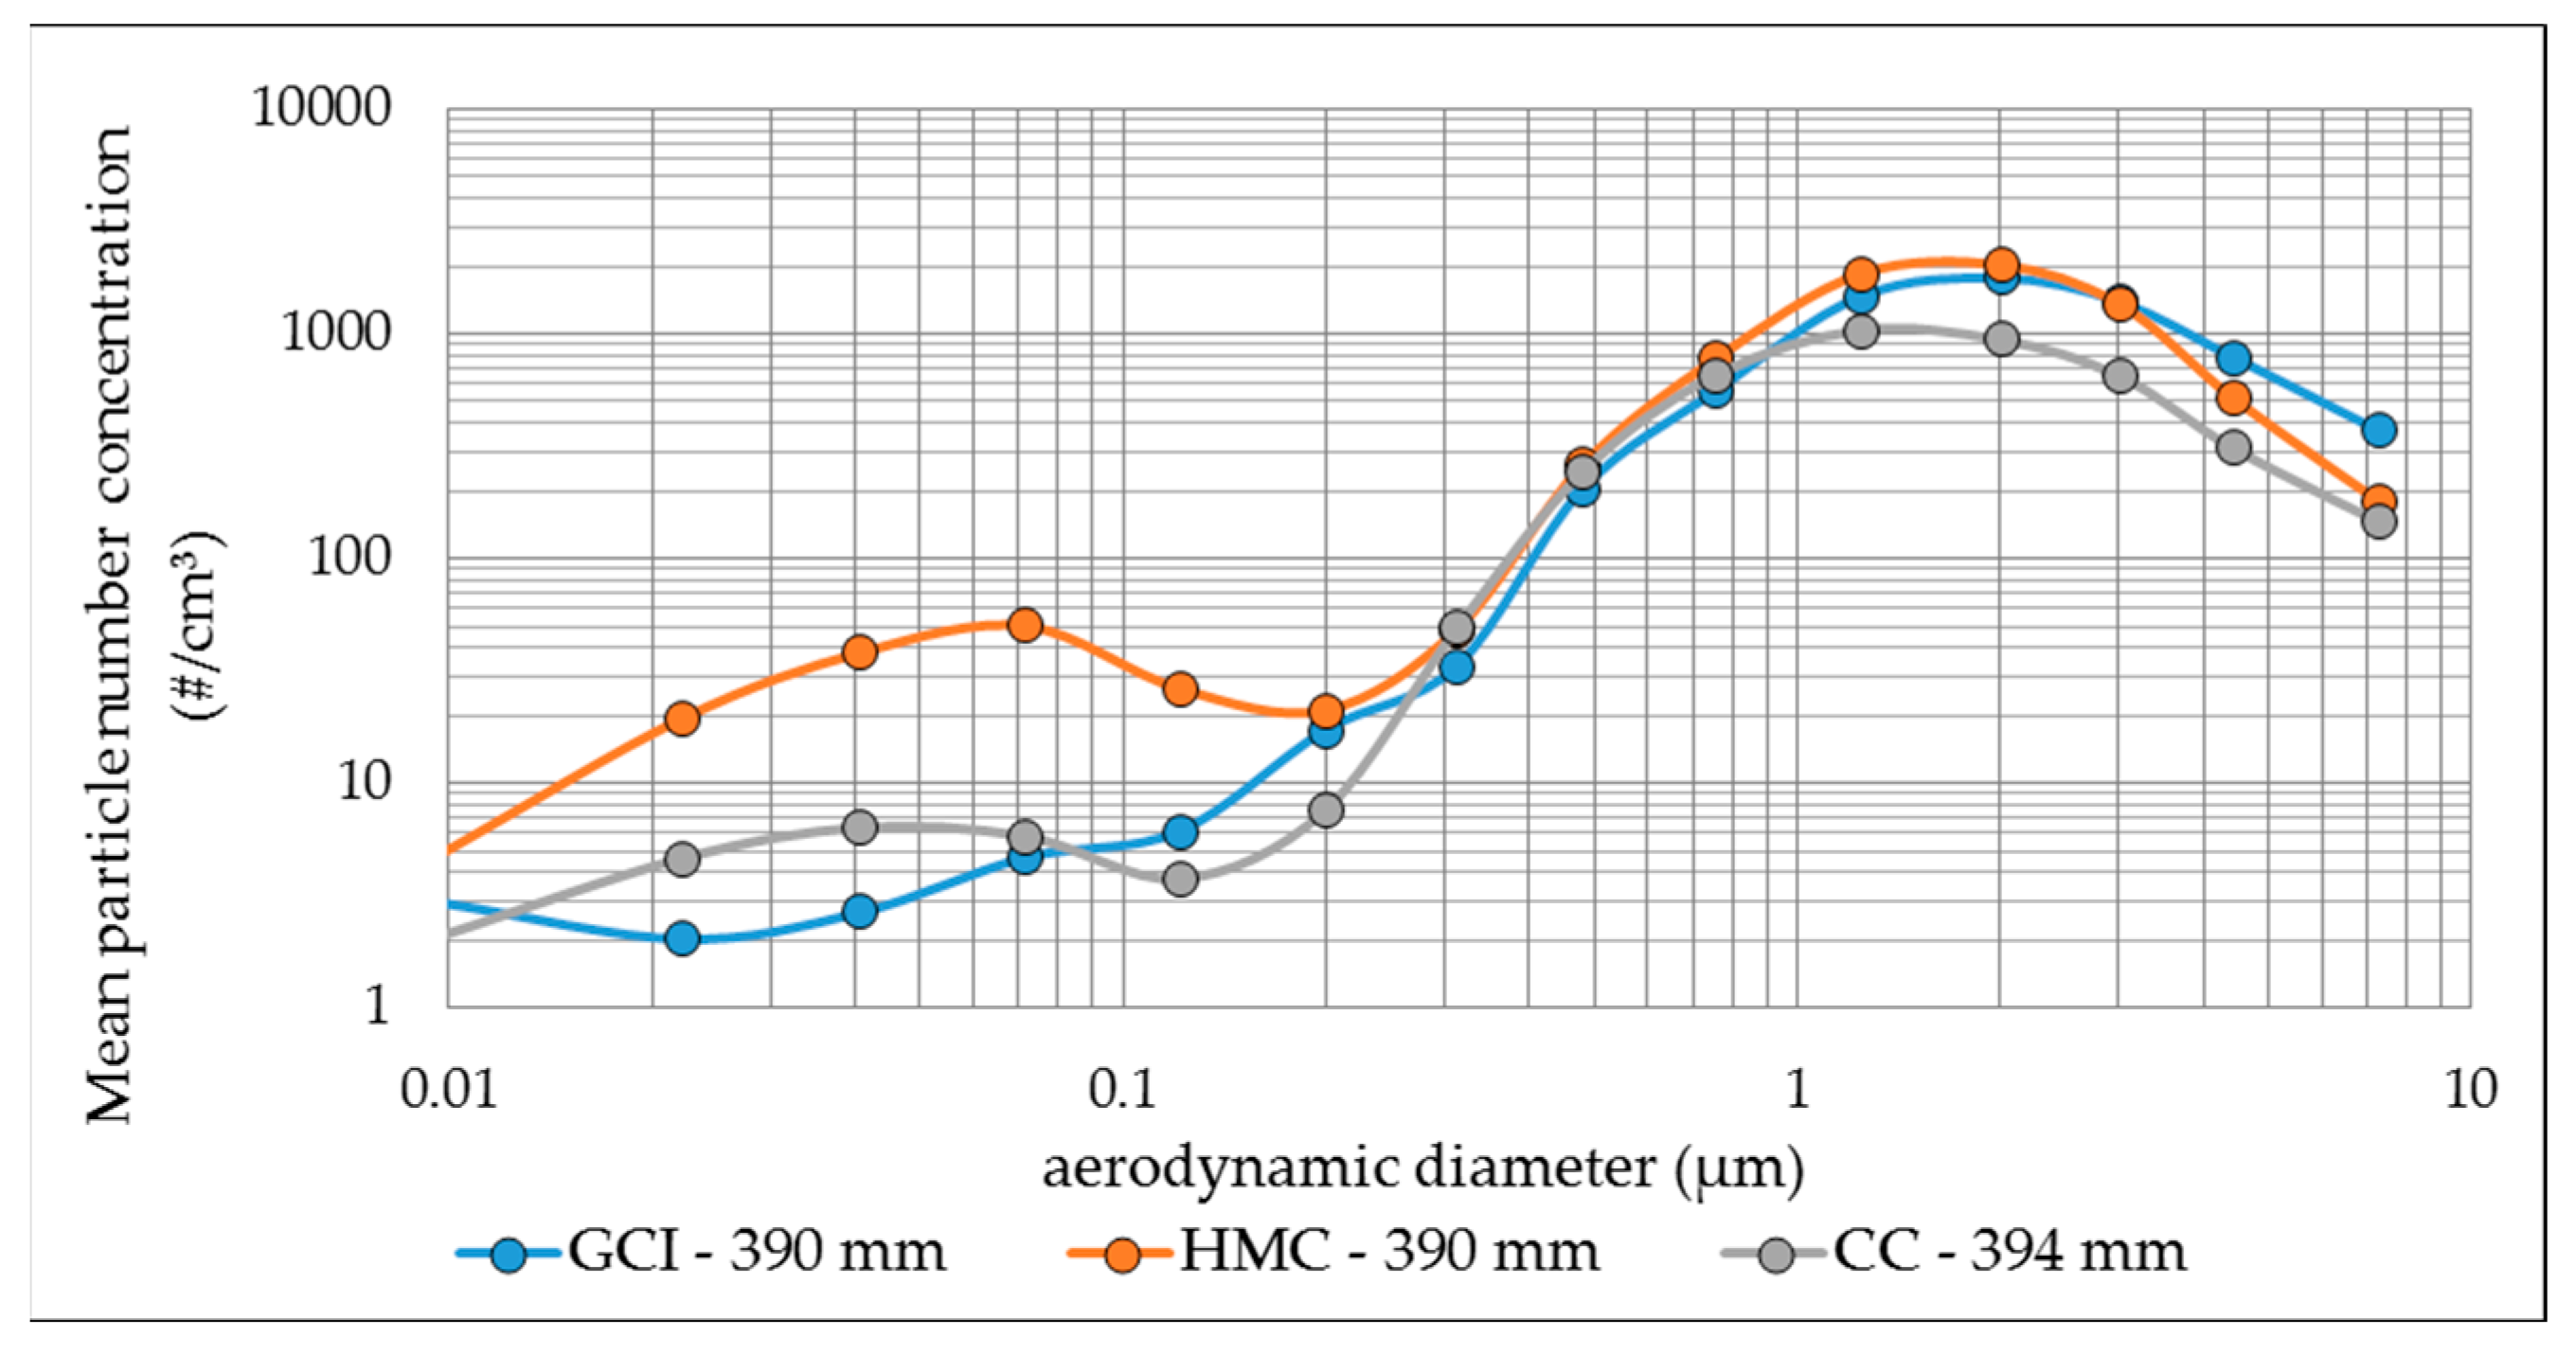
3.1. Correlations between Bedding Process and Brake Wear Particle Emissions

In Figure 5, the number and mass-related emission factors for the tested disc concepts (vehicle 1) are compared. The number of trip #10 simulated until completion of the bedding process differs significantly for the brakes tested. For each disc, characteristic and strongly deviating curves of the number and mass-related emission factors can be identified. The drop in the emission factors observed for the disc brake can be explained by two reasons. The first is the removal of the anti-corrosion coating of the disc in the initial phase. The particle number concentration, measured over the course of a cycle, is particularly high during the first 5 to 10 braking events and then decreases continuously [17,41].
The second reason is the increased wear rate during the bedding process, which results from inhomogeneous contact conditions and surface topography as well as the non-formed friction layer [32]. The measured particle number concentration is considered as a function of the wear rate and decreases continuously. To demonstrate this correlation, Figure 6 shows the particle number concentration of a section of trip #10 of the WLTP brake cycle for the first 5 runs for the GCI disc.
As a result, the number-related emission factor decreases over the course of 5× trip #10 by up to a factor of 5 and the mass-related emission factor decreases by up to a factor of 2.2 (Figure 5). For the CC disc, which is not provided with an anti-corrosion coating, a decrease by the factors 3 (number) and 2 (mass) can be identified. The trend is different for the HMC, the number-related emission factor increasing over the first three cycles. The mass-related emission factors of the GCI are at a significantly higher level compared to the HMC and CC, which suggests a higher proportion of mass-relevant particles > 2.5 μm. While a constant level can be observed for the GCI emission factors after 8× trip #10, the emission level for the CC and HMC is continuously decreasing. This indicates that the bedding process is still ongoing. After a number of cycles > 25 (HMC) and > 30 (CC) the process appears to be completed. A comparison of the number-related emission factors after 10× trip #10 would result in an increased value of up to 22% (HMC disc; cycles 24–28). The HMC disc is assigned the highest and the CC disc the lowest number-related emission factor.
The mean particle size distribution (ELPI+) per test cycle compared in Figure 7 and Figure 8 serve to explain this result. For braking events with high friction energy and friction power, the emissions of the HMC are characterised by a bimodal size distribution. Particle formation is the result of the critical threshold temperature being temporarily exceeded (threshold 1).
In addition to the modal distribution, the particle spectrum emitted by the GCI is characterised by an increased proportion of the particle fraction > 2.5 μm. The concentrations of nanoparticles (≤100 nm) recorded for the GCI and CC (Figure 7) as well as for the HMC and CC (Figure 8) are associated with the noise level of the instrument. The count median diameter (CMD) calculated over the course of trip #10 is 2.13 μm for the GCI, 1.83 μm for HMC, and 1.61 μm for CC. The maximum concentrations of all brakes tested are found in a size range between 0.8–2.2 μm. In addition to the highest concentration in the size spectrum > 1 μm, the 350-mm GCI (Vehicle 2) has a comparatively higher share in the size spectrum < 1 μm. A change in the modal distribution as a result of temporary exceedances of the temperature threshold can be expected for this vehicle brake system configuration.
As discussed above, the high wear in the initial phase can be explained by the inhomogeneous contact conditions (surface topography) and the non-formed friction layer. The consequence of the small contact area is a local moment transfer, which leads to high temperatures of the areas in friction contact. The moment transfer occurs via primary and secondary patches. The primary and secondary patches are assigned a diameter of 50 µm to 500 µm during soft braking maneuvers [43]. The nominal contact area was determined exemplarily for the GCI with 10–20% for different 10 measuring positions, which are evenly distributed in the radial direction of the contact area. A contact area analysed using 3D-laser scanning microscopy is shown in Figure 9.
The nominal contact areas are marked (white) by means of digital image processing software (DatInf Scientific counter). A small contact area over the initial phase is to be expected for unused brake pads due to the inhomogeneous surface topography. For the embedded pad, the contact areas are clearly highlighted. At high temperature and high pressure, the plateaus can be up to 1 mm in size and cover up to 50% of the surface area.
A different result can be derived from the mass-related emission factors (Figure 10). To classify the results, the number- and mass-related emission factors for vehicle 1 and 2 are additionally shown.
Each of the emission factors shown represents the finished bedding process and is the average of the last five values (the measured values for vehicle 1 are compared in Figure 5). The mass-related emission factors were determined via gravimetric measurement. The standard deviation results from weighing the unloaded and loaded filter pads five times after the conditioning procedure described above. The comparison of the 390/394-mm brakes (vehicle 1) reveals a 50% (PM2.5) and 55% (PM10) reduction in the mass-based emission factor of the HMC disc compared to the GCI disc. For the CC disc, the emission factor is even lower (reduction of 63% (PM2.5) and 70% (PM10)). This result can be explained by the increased wear resistance of the HMC and CC discs. Using mass-related PM10 and PM2.5 emission factors, the PM10–PM2.5 ratio can be calculated. For the GCI disc, the highest ratio can be determined with 1.90 (HMC: 1.70; CC: 1.55).
The PM10–PM2.5 ratio remained relatively constant over all trip-10 tests at the nominal tunnel flow rate. Clear changes over the bedding process could not be identified. Therefore, the reduction in the PM emission levels during the bedding of the pads did not affect the mass weighted size distributions. Compared to Vehicle 2, the GCI brake of Vehicle 1 has a brake disc that is approximately 40 mm larger, with a 16.9% increase in pad area and a 22% lower moment of inertia. The weight of the GCI discs is 14.48 kg (Vehicle 1) and 12.13 kg (Vehicle 2). This results in a difference in the number-related emission factor by a factor of 4 and in the mass-related emission factor by a factor of 2.5. The PM10–PM2.5 ratio increases from 1.90 (Vehicle 1) to 2.07 (Vehicle 2). The high increase in the number-related emission factor is due to the described change in modal distribution. From the comparison of the HMC discs, the number-related emission factor observed for Vehicle 1 cannot be observed for Vehicle 2. Instead, the value decreases by > 60%, although the mass-based emission factor increases by 62% (PM10) and 50% (PM2.5) due to different particle size distributions. Although the temperature values (Figure 12) are almost identical for the HMC discs, a reduction of the microscopic temperatures in the contact area can be assumed for the 415 mm disc as a result of an increased contact area. For the CC disc, a holistic reduction of the emission factors occurs due to the 46 mm larger disc of Vehicle 2.
The mass loss (mg/km) of the individual brake components is again used to classify the results. The total wear for the GCI disc results predominantly from the wear of the disc (Figure 11).
This result is identical to the observations in the first part of this study. The alternative brake materials (HMC and CC) are characterised by a high wear resistance and hardly contribute to the total wear. For the CC disc, a reduction of the emission factors can be confirmed despite an increased disc diameter, pad area and simulated moment of inertia. Overall, the mass loss factors correlate in a good approximation with the mass-related emission factors.

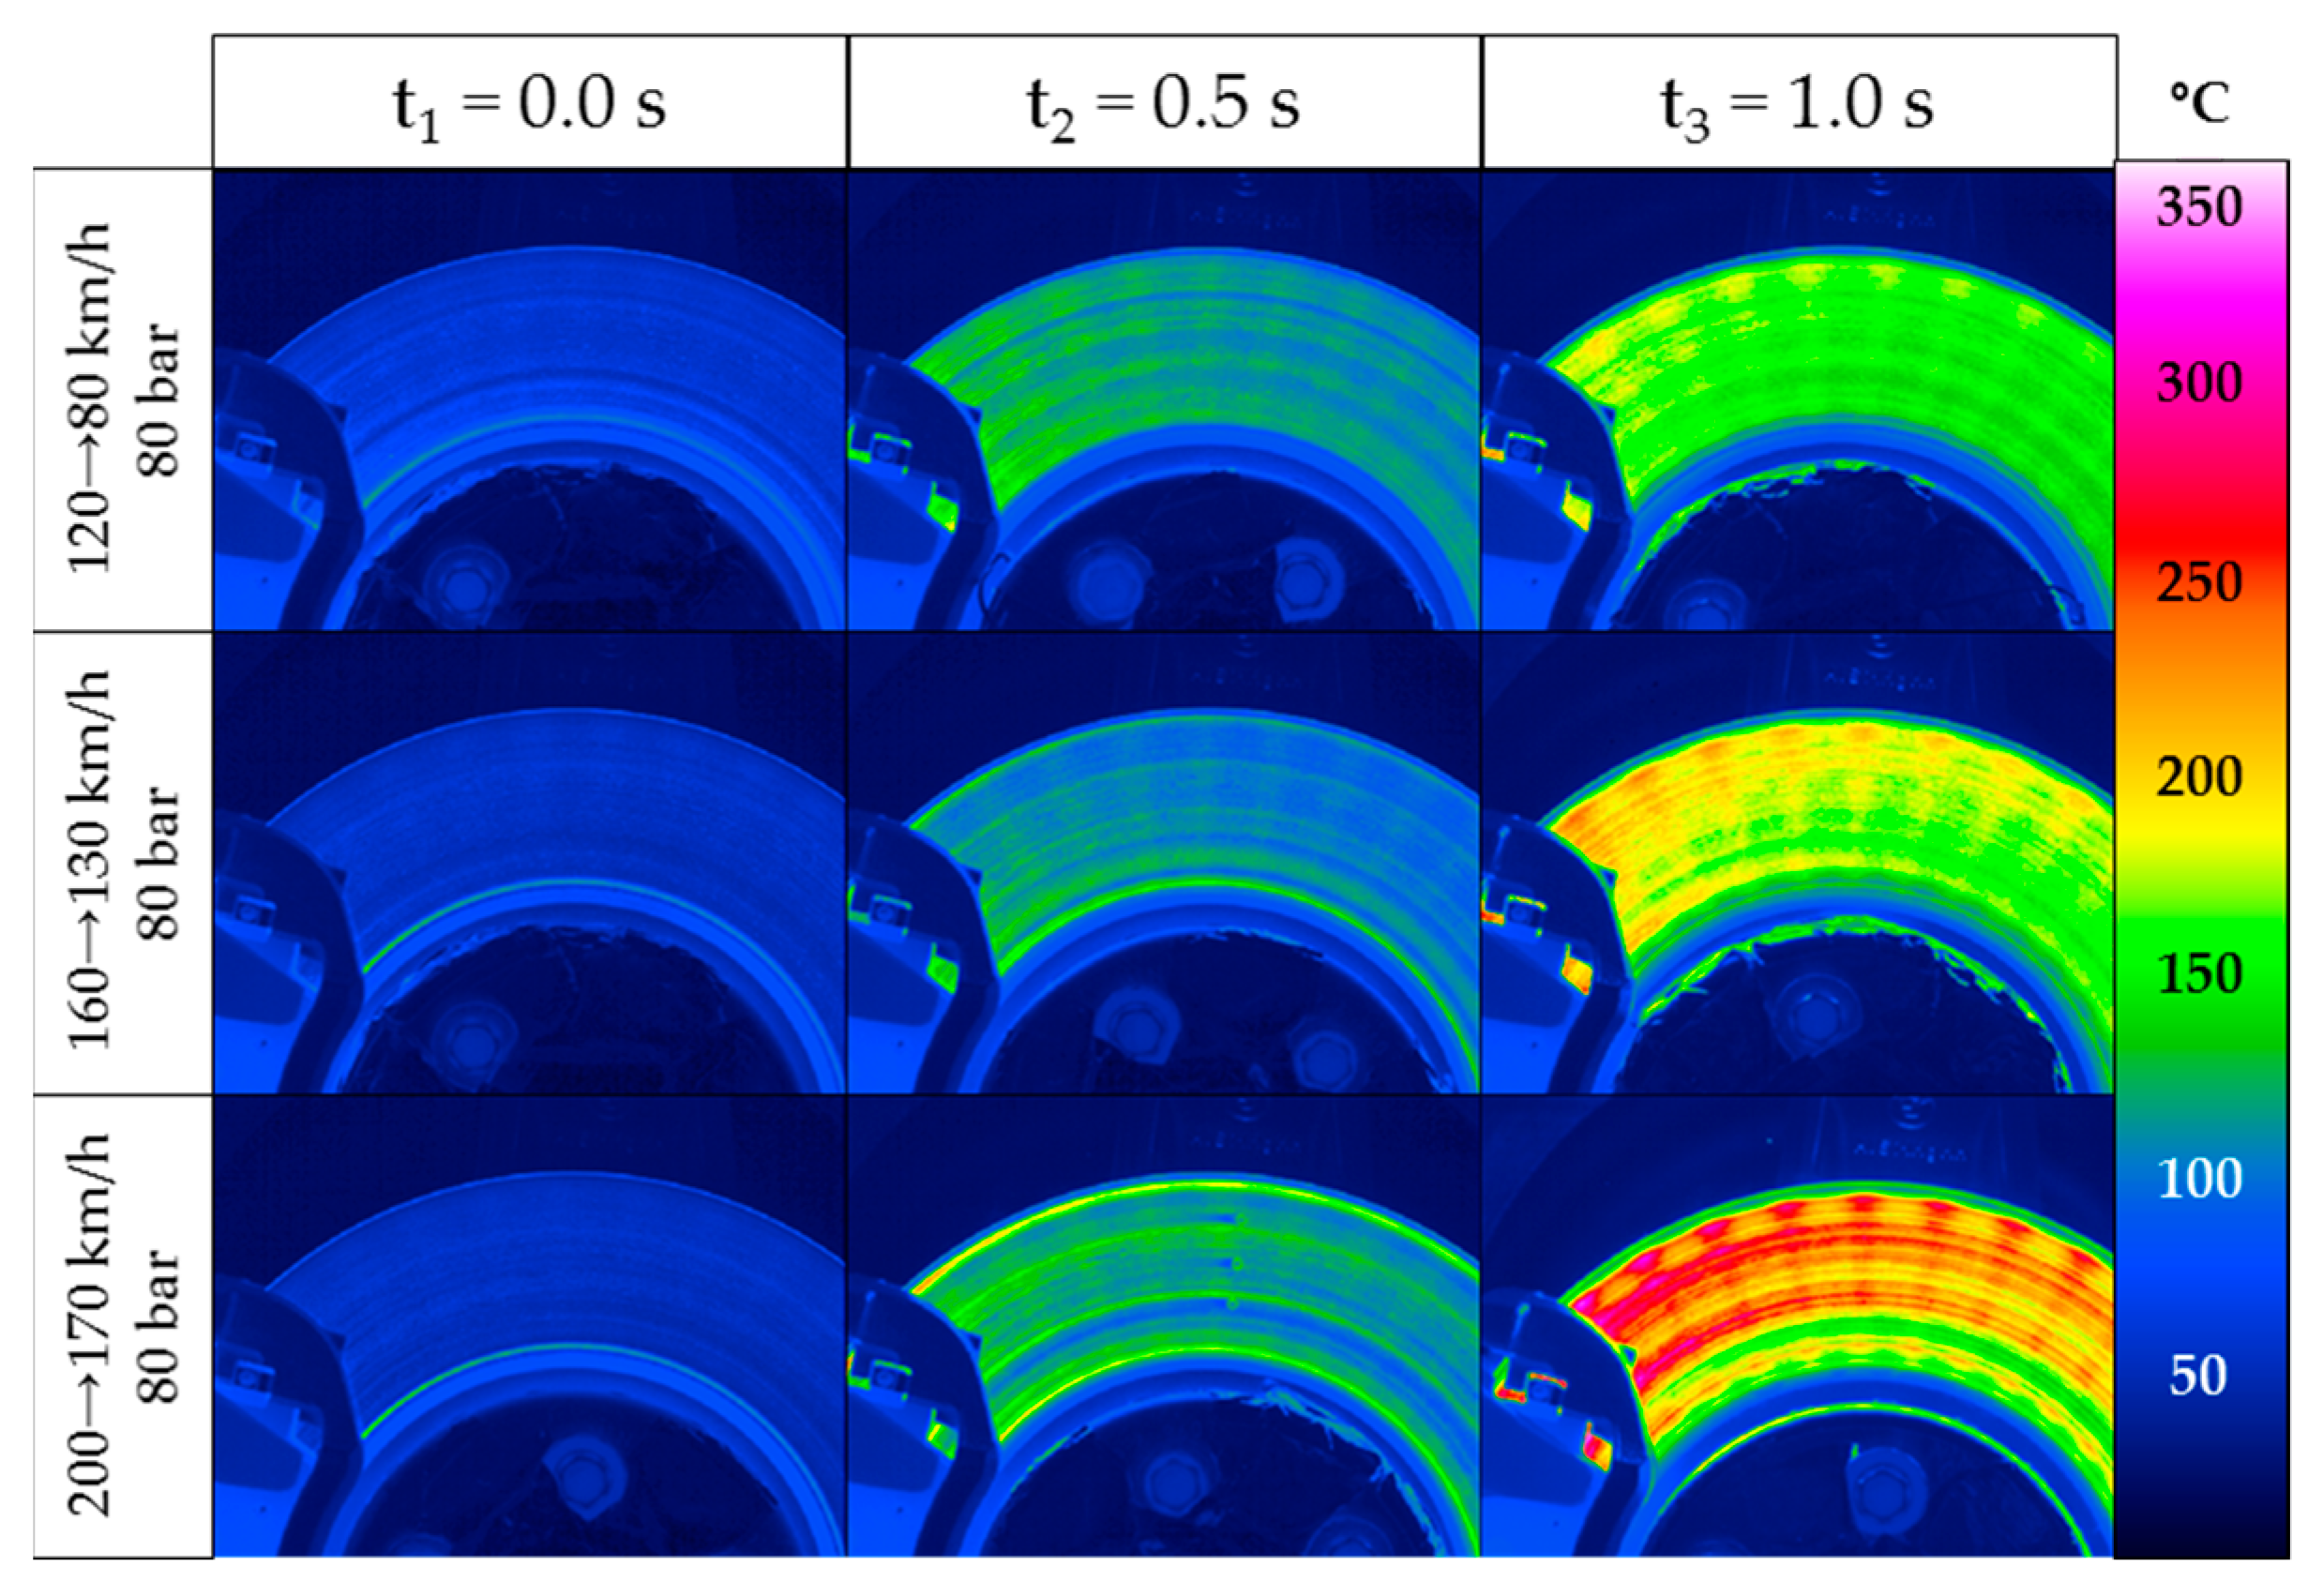
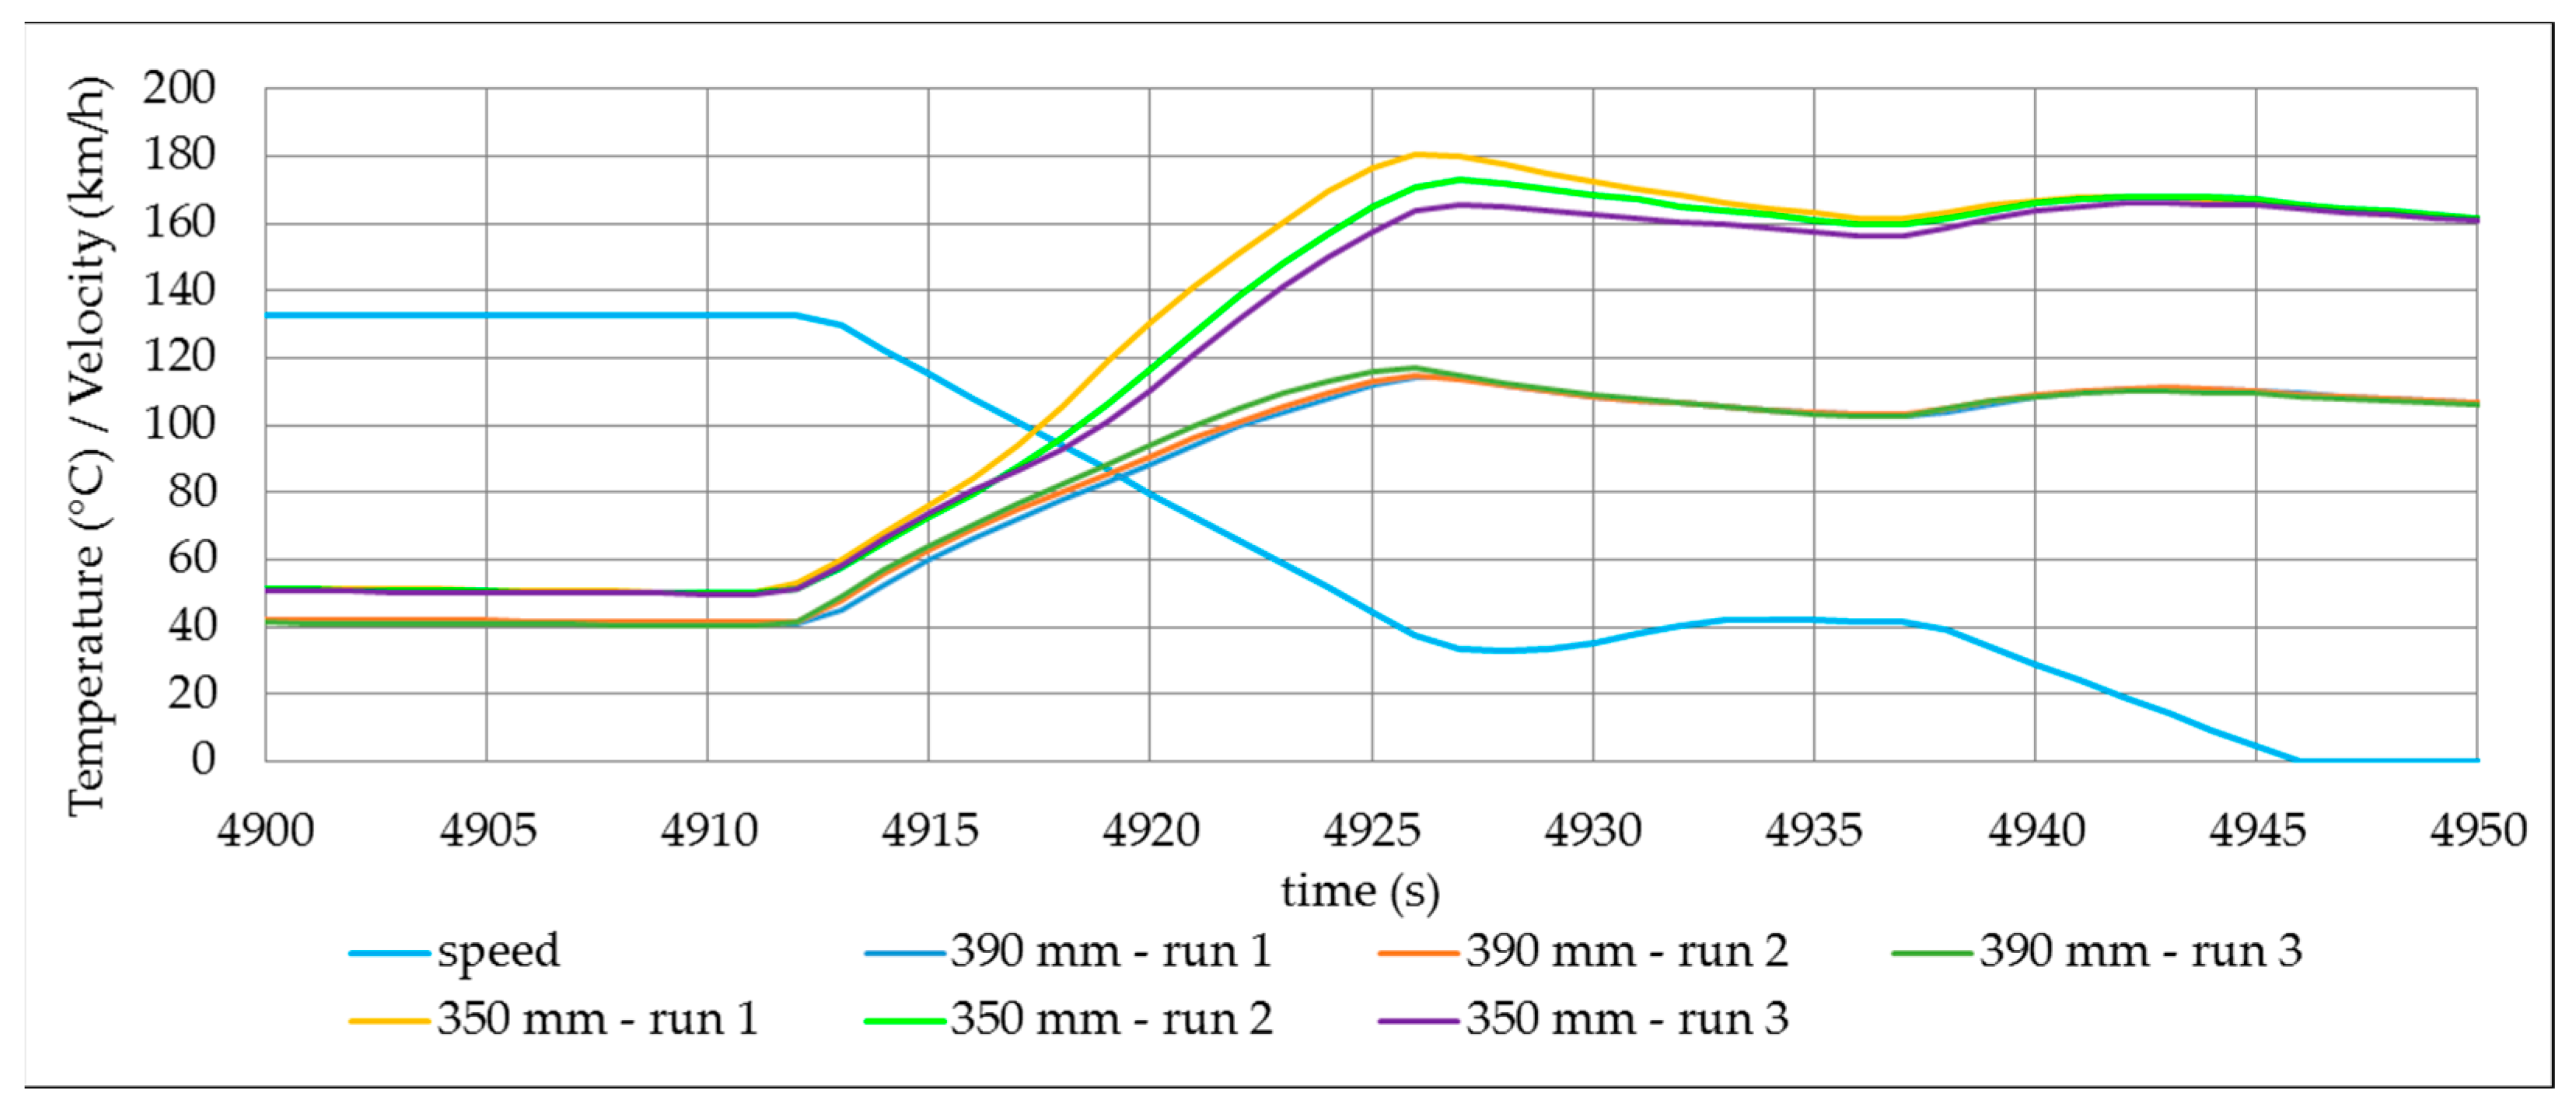
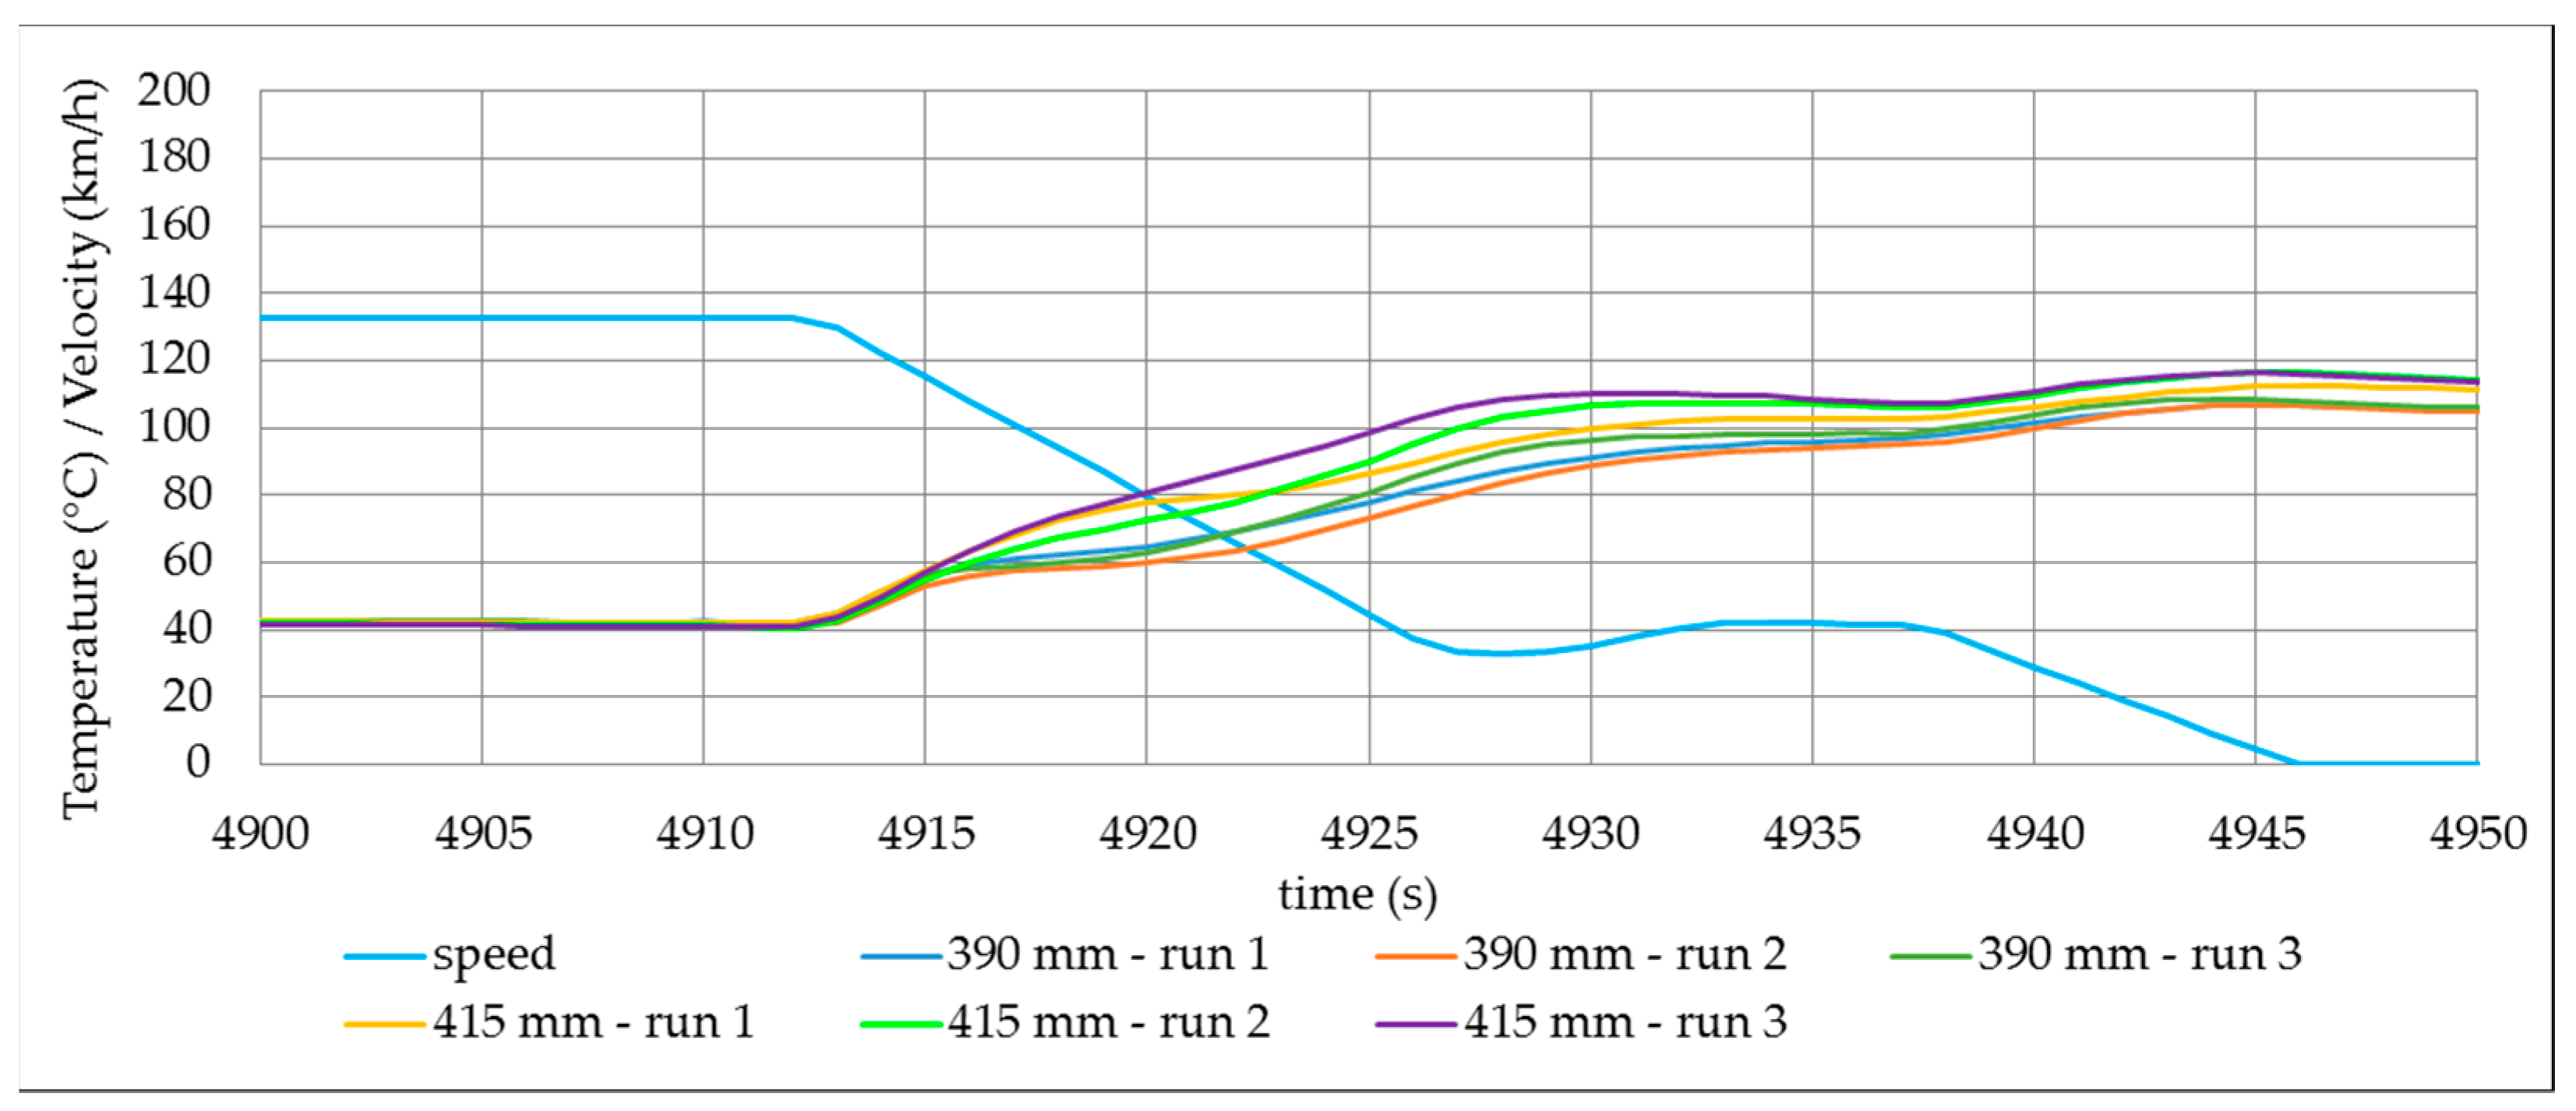
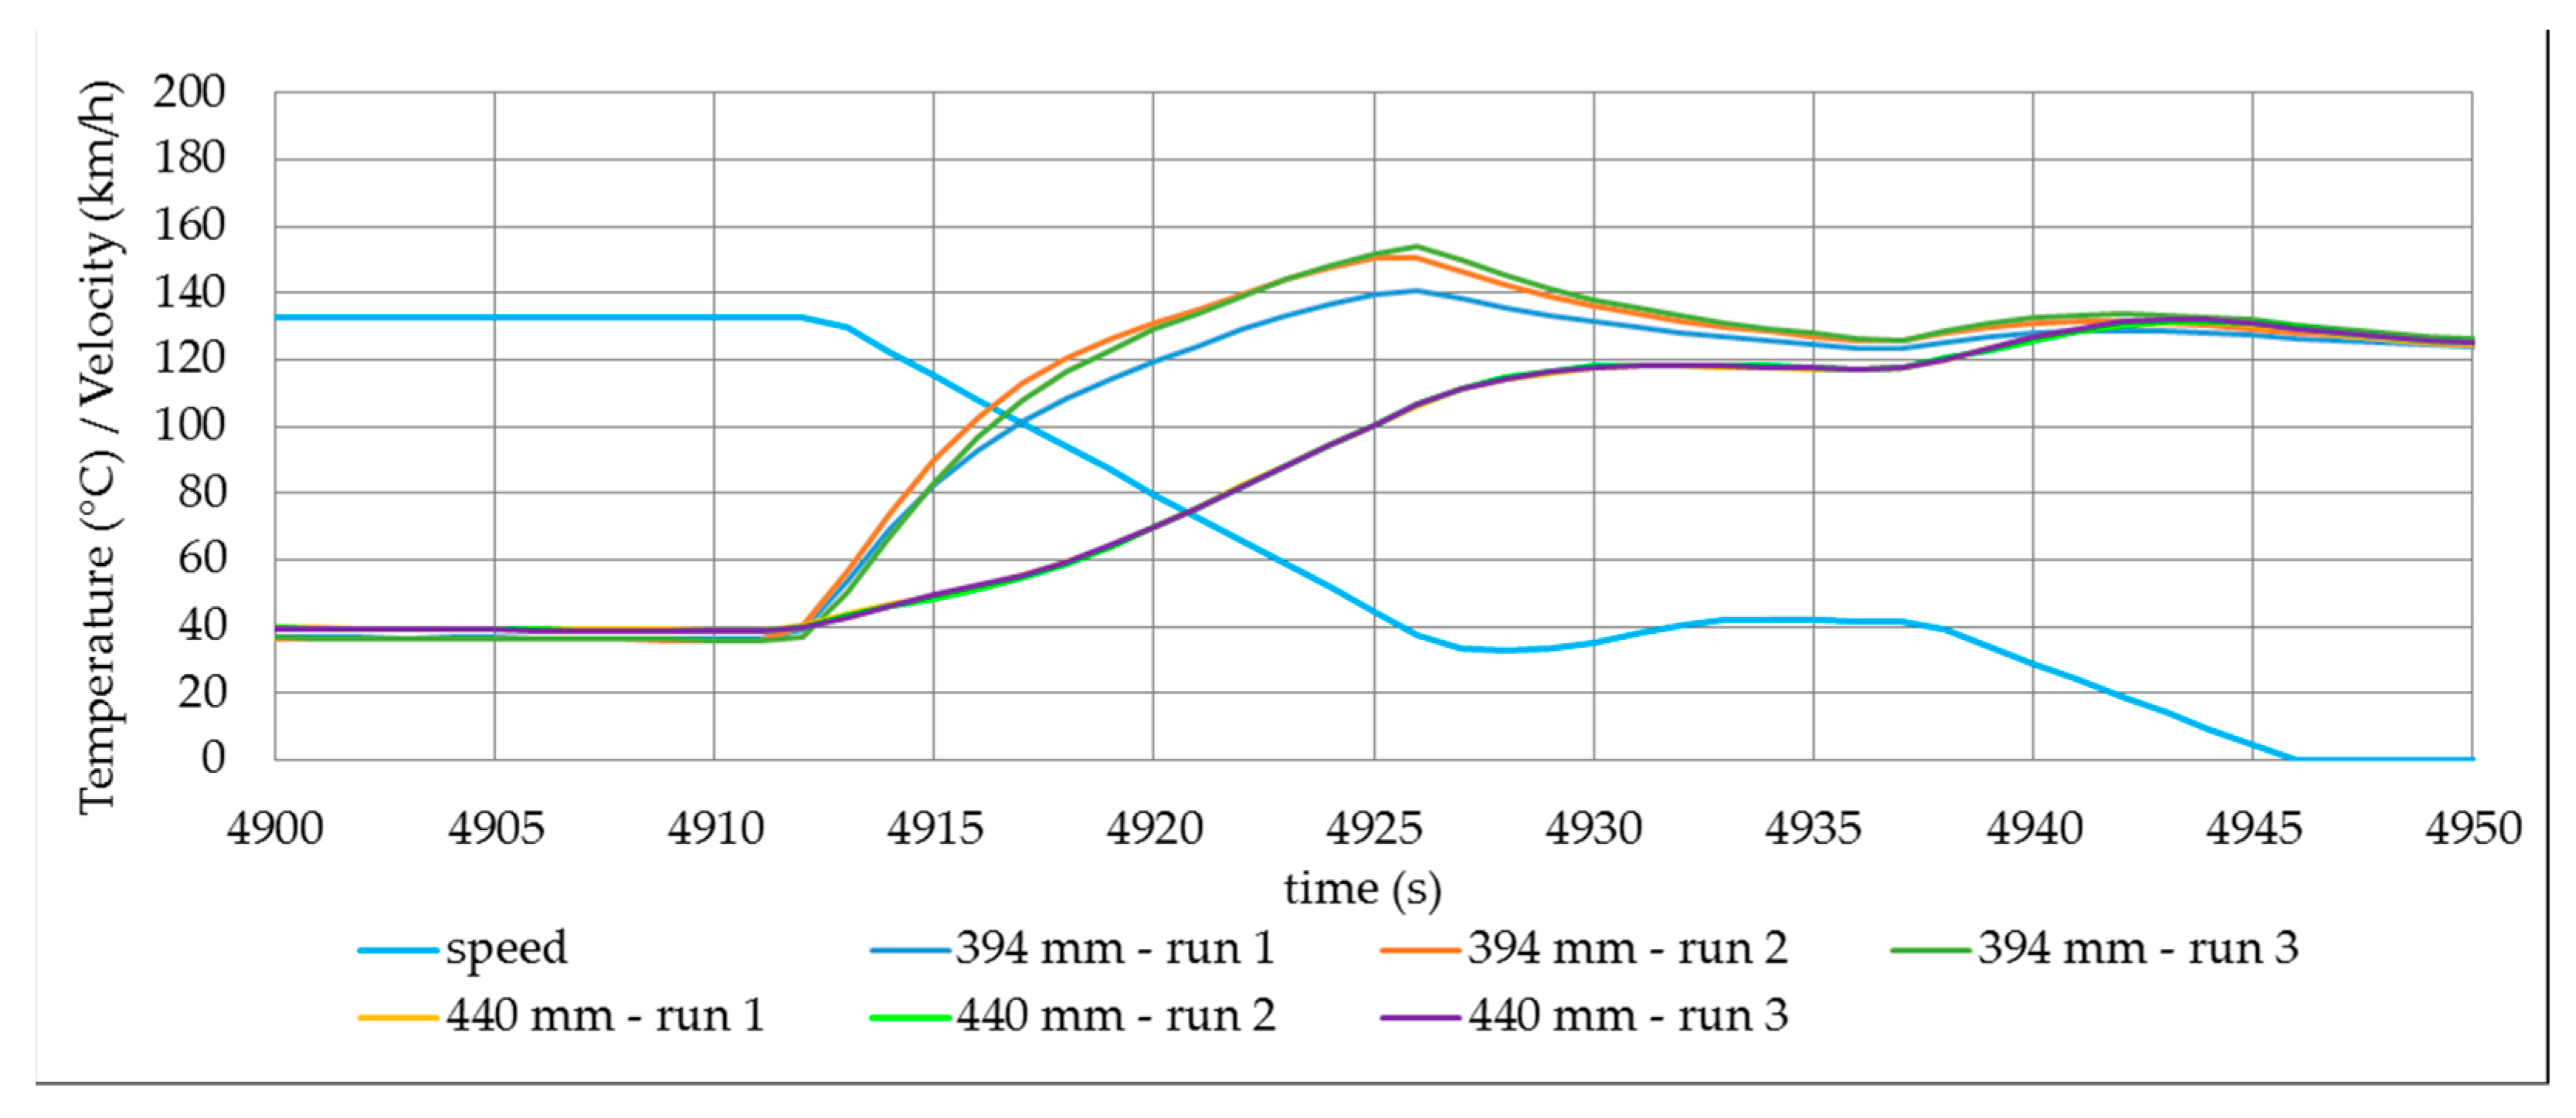
3.2. Correlations between Bedding Process and Temperature

A comparison of the trip #10 cycle results of the brakes tested for vehicles 1 and 2 shows significant differences in the mean and maximum brake temperatures (Figure 12) under the same test conditions (cooling volume flow).
The average temperatures of the tested brake concepts are almost the same for the comparable dimensioning (390–394 mm). In addition, the maximum temperature of the HMC disc is clearly below the level of the CC disc. The course of the average and maximum temperatures per cycle shown in Figure 13 (Vehicle 1) illustrates the already known material-specific differences. While the maximum temperatures per cycle increase by up to 36 °C for the CC, an increase of 9 °C (GCI) to 13 °C (HMC) is measurable for the other brakes. For the HMC disc, the maximum temperature drops from cycle 1 to 2. The average temperatures are at a comparable level. The material-specific influence is primarily limited to the formation of the maximum temperatures.
Overall, the differences in temperature level are higher for Vehicle 2, which is due to the variation in disc diameter and mass. A comparison of the temperature curves over a section of trip #10 is shown for the GCI in Figure 14, for the HMC in Figure 15, and for the CC in Figure 16. The GCI (Vehicle 1/390 mm) and the CC (Vehicle 2/440 mm) have to be assigned a high repeatability. The maximum deviations over the analysed cycles are < 6 °C. The maximum deviations typically occur during a braking event and become larger the higher the energy conversion is.
An example is the marked braking event 106 of trip #10 (braking speed: 132.49 km/h). The hot bands formed during braking arise as a result of uneven distribution of the surface pressure on individual contact areas through dissipation energy. The radial position of these rings changes within the contact region of the pads with time, which can lead to test-to-test deviations when measuring with embedded thermocouples. Deviations of up to 17 °C can be determined with the embedded thermocouples. The HMC can be assigned a comparable temperature level at the beginning of the represented braking (time: 4912 s). This means that the higher the friction energy per braking event, the less precise and reproducible is the method for determining maximum temperatures by means of thermocouples.

4. Discussion

4.1. Bedding Procedure

The main target of the bedding procedure is to ensure a representative and reproducible emission level. As mentioned at the beginning of this study, the PMP brake emissions protocol currently defines the bedding procedure by a fixed number of test cycles. This approach is intended to be universally valid for disc brakes. Alternative friction materials (e.g., tungsten carbide-coated discs) are not currently excluded from this. From the findings presented, the bedding process can be assigned a high significance with regard to the particle emission behaviour. In addition, a correlation could be observed between the properties of the friction partners and the emission factors as well as the friction energy or number of cycles required until completion of the bedding process. The number of cycles differed by up to a factor of 3 (Vehicle 1). A brand-new vehicle is delivered with already actuated brakes. The distance travelled is the result of the transfer drives as well as function tests carried out by the car manufacturer. The distinguishing features of brand-new vehicles are the test conditions, the driving distance and the brake system installed on the vehicle. Consequently, neither a universal bedding procedure nor a universally formed friction layer can be assumed. The driving distance to be completed before delivery is rather to be assessed as partial bedding. In the case of grey cast iron discs, the influence of (micro-) corrosion, which can occur over the period of vehicle delivery, contributes to a change in the wear and emission behaviour. Furthermore, corrosion is an important issue for grey cast iron discs installed on electric vehicles. As a result of numerous differences, the delivery condition of a vehicle cannot be regarded as the basis for a universal bedding procedure.
Following the PMP brake emissions protocol, unused brake components or already embedded brake components can be used. For already embedded brake components, there is currently no restriction regarding the preconditioning procedure. Only bedding procedures should be permitted in which the test conditions (speed, brake pressure and temperature profile) correspond to those of the main emission test. Test cycles that have different operating conditions (thermal, mechanical) compared to the test cycle of the main emission test can lead to a deviating emission value [41]. Conditioning with high speeds and brake pressures (test parameters: 80 bar; 200–170 km/h; 100 °C) leads to an increase in emission factors by up to a factor of 4. In the opposite case, a reduction of the emission level by thermal conditioning to 330 °C could be confirmed. If the aim is to shorten the bedding process by increasing temperature or braking pressure, additional conditioning must be carried out. The simulated operating conditions should be comparable to those of the emission test cycle.
According to the observations, a predefined number of test cycles, derived from investigations using GCI disc, is not sufficient to complete the bedding process for alternative friction materials. Although the reduction of the number-related emission factor after 10× trip #10 is small, the values can be increased by up to 20%. Nevertheless, a trend analysis would have the advantage of statistical validation, but the disadvantage of a high and partly varying time expenditure. It should be mentioned that the brakes of a vehicle are exposed to continuously changing and hardly reproducible load scenarios in real driving tests. The driving and braking conditions simulated on the inertia dynamometer can only be compared to some extent with the field conditions. Furthermore, the influence of climatic conditions (like humidity and temperature) as well as extreme braking events (like emergency braking) have a high impact on the characteristics of the friction layer, on the wear and emission level.
The contact area ratio can be used to evaluate the bedding condition of friction brakes. The approach was presented as an example using the GCI disc. The measurement should be done using surface analysis techniques (e.g., 3D-laser scanning microscope). This allows calculation of the contact area of a brake pad and the ratio between contact area and total pad area. The contact area ratio is the portion of the pad surface that is in frictional contact with the disc and contributes to the torque transmission. As a result of manufacturing tolerances or inhomogeneous surface topographies, the contact area ratio increases continuously during the bedding process [32]. The bedding process is not complete until the contact area ratio converges towards a specific value. Due to the different material properties, this value is expected to differ for different brake concepts (e.g., GCI disc and HMC disc). In addition, it is difficult to check the contact ratio within the scope of a homologation process. If the contact area ratio is checked by removing the brake pads, reconditioning is required afterwards. This makes it difficult to integrate this approach into a potential homologation approach. Trend analysis is another potential approach. The evaluation of the emission behaviour in the form of a trend analysis can only be transferred to a partial section of the real wear and emission behaviour. To ensure comparable test and inspection conditions, especially between different laboratories, the specification of a fixed number of cycles is possible as a compromise. Differentiated specifications between conventional grey cast iron discs and alternative friction materials are conceivable. For this definition, a wide range of different friction materials must be tested. In addition, a combined procedure of specifying a minimum number of cycles and a trend analysis could be a compromise. In addition, the formation of nanoscale particles was observed during the bedding process of the HMC disc. This effect results from exceeding the critical temperature thresholds due to inhomogeneous contact conditions in the initial phase. As the number of cycles increases, the probability of formation decreases. Since these nanoparticles are hardly mass-relevant (especially for PM10), the use of particle mass is recommended for the evaluation of emission stabilisation along the bedding process.
The PM10–PM2.5 ratio should be used as a benchmark for evaluating the measurement capability of electrically-based measurement systems, transport efficiency, and uniformity within a sampling system. Influences of varying parameters can be evaluated in a target-oriented manner or optimal parameter settings (e.g., the evacuation volume flow) can be identified. For example, it can be assumed that a reduced ratio under variation of operating conditions or changes in the design of the sampling system is the result of reduced transport efficiency. This makes the PM10–PM2.5 ratio an integral part of the design of a sampling system.
Using alternative friction materials (HMC and CC discs), emission reduction potentials of up to 70% (PM10) can be achieved (Figure 5 and Figure 10). The significantly lower emission factors compared to the GCI discs are the result of the high wear resistance of the disc. However, the reduction potentials can only be achieved if the temperature regime is in a non-critical range. Exceeding critical threshold temperatures, which result in a change of the modal distribution, must therefore be avoided. This relationship must be taken into account in the development and design process of the brakes. If market penetration of alternative friction materials is possible due to cost, function, and durability, a high contribution to particulate matter reduction is possible.

4.2. Temperature Observations

In this study, embedded thermocouples were used as recommended by the PMP group. The detection of near-surface peak temperatures can only be reconciled with the particle formation process and the critical temperature thresholds to a limited extent due to the dynamic temperature distribution and the rather punctual temperature detection, which can be classified as a disadvantage of this measurement method. This applies in particular to sharp braking with high friction energy and friction power. The higher the friction energy and friction power converted per brake event, the higher the difference to the temperature at the disc surface. It follows that the representative and reproducible measurement of the peak temperature at high friction energy and friction power is the limitation of this measurement method. In addition, the reproducibility can vary when using different disc materials with comparable disc dimensions, which makes the universal use of this approach a challenge. The investigations on the influence of different friction materials with almost identical disc dimensions (Vehicle 1) result in a deviation of up to 35 °C of the maximum disc temperatures. Higher temperatures can be attributed to the inner friction ring, which contributes to a higher proportion of the energy transfer in floating caliper brakes and brake pressures ≤ 30 bar (Figure 1 and Figure 2) [25]. Only at brake pressures > 30 bar is torque transmission primarily to be expected via the centre and outer friction ring. Along trip #10 of the WLTP brake cycle, maximum brake pressures of 14.8 bar could be measured for the GCI disc. In general, the maximum brake disc temperature determined by means of a thermocouple cannot be used directly to explain the formation process of nanoparticles. The formation is less to be defined by a universal temperature threshold, but rather as a material characteristic. For the HMC and CC, the mean temperatures of the different brake sizes differ only slightly. The increased moment of inertia for Vehicle 2 is almost compensated for by the enlarged disc.
The GCI disc has to be assigned a moderate reproducibility with regard to the temperature measurement in the case of decelerations with high friction energy. The temperature deviations have to be considered especially in the development of a robust measurement procedure and have a negative impact on the representativeness of the temperature-based methodology. Only using the 350-mm GCI disc, the PMP temperature specifications were met. According to the PMP brake emissions protocol, a reduction of the cooling volume flow would be necessary for all other brakes tested to comply with the specifications for the average and maximum brake temperature. Since the mean flow velocity around the periphery of the brake is low at 1.66 m/s, further reduction of the cooling effect would not be successful. Tests under deactivation of the cooling volume flow have shown a 4–5 °C higher average and 5–6 °C higher maximum temperature for the GCI disc. This means that, for some of the tested brakes, the temperature ranges predefined by the PMP IWG cannot be met. Based on the results presented in Table 2, the influence of the tunnel flow on the maximum temperature can be considered low compared to the heat capacity of the disc [27]. To meet the targets, the temperature ranges can be divided into classes, whereby the wheel load/disc mass ratio is conceivable as a distinguishing feature. Furthermore, the elimination of the lower mean temperature value per cycle should be discussed, which reduces the probability of a change in the flow rate by several factors. This gives greater consideration to the specific cooling behaviour of each brake system, ensuring a more realistic temperature profile under WLTP brake cycle simulation. In general, the variation of the flow velocity influences the particle transport efficiency, the particle distribution and the particle residence time. This is especially important when comparing two laboratories and sampling systems with different geometries and operating conditions. Due to complex geometric differences, such as cross-sectional transitions and curvatures in the enclosure and in the duct, deviating mass-related emission factors (PM10) are to be expected [16,44]. Variation of the flow velocity should be as small as possible (i.e., not by several factors when using a constant volume sampling system with the same geometry) or completely prevented.
Based on this study and confirmed by numerous other authors, the disc temperature can be identified as a critical parameter [7,8,9,10,15,16,29]. When the critical threshold temperature was exceeded, the release of nanoparticles was observed. The formation process of nanoparticles is particularly influenced by the material composition [17,45]. This results from the evaporation of organic components of the friction material matrix (e.g., phenolic resins in binders). Under high thermal load, carbon single bonds in the particle size range < 0.1 μm were detected, which are typical for organic carbon (OC) [17]. The emission product showed carbon-oxygen double bonds, which can be assigned to organic species. The analysis of the exact chemical composition of the emitted nanoparticles, the identification of the formation mechanisms and the separation between solid and volatile nanoparticles represent research priorities for the future. For a realistic evaluation of brake wear, the PMP IWG aims to reproduce real disc temperatures by specifying threshold temperature ranges on the inertia dynamometer [13,25]. Due to the temporal and spatial non-uniformity, some limitations have to be considered. On the one hand, the measured temperature is influenced by the position of the thermocouple. On the other hand, the measurement methodology is based on the principle of heat conduction, which means that the influence of the thermal conductivity of the material of the brake disc is of particular importance. The latter has a particular influence on the measurement of the maximum temperatures. The average temperature is hardly influenced according to the results described above. The geometry of the friction partners and the composition of the friction partners can be expected to have an influence. The more inhomogeneous the individual components are distributed in the brake pad, the more likely are large temperature differences in the radial direction. Finally, a dependency between the bedding condition and the maximum temperature was observed. Therefore, a reproducible and representative measurement of the maximum temperature is a challenge. The maximum temperature measured by means of thermocouples can be determined with a measurement deviation due to the distance to the friction contact. Although the average temperatures can be at a comparable level when using different friction materials, the maximum temperatures differ significantly.

5. Conclusions

The focus of the present study was initially on comparing the particle emission behaviour of different disc brakes and friction materials. For this purpose, number- and mass-related emission factors as well as the particle size distribution were measured. The emission behaviour along the bedding process was analysed using a series of trip #10 of the WLTP brake cycle. The bedding process is characterised by a reduction of the emission power. The course and duration of the bedding process can differ for different friction materials. At the maximum, the number-related emission factor was reduced by a factor of > 10. A change in the maximum temperatures could be observed, whereas the mean temperatures did not show any noteworthy abnormalities. A stable and reproducible bedding procedure is necessary to ensure comparable and reproducible measurement and test conditions, especially between different laboratories. Using tungsten carbide-coated discs and carbon-ceramic disc, emission reduction potentials of up to 70% (PM10) can be achieved. The findings are an important basis for the further development and finalisation of the PMP brake emissions protocols.
Another focus of this study was the evaluation of the temperature profiles. The temperature profiles recorded with embedded Ni-Cr-Ni thermocouples show high spatial non-uniformities during demanding braking processes. As a result, critical threshold temperatures of 180–200 °C can be exceeded, which can lead to the formation of nanoparticles. The peak temperatures leading to the formation occur in the area close to the surface and are thus difficult to detect with this measurement method. For conventional grey cast iron discs, the deviation of the maximum temperatures over demanding braking under WLTP database amounts to up to 17 °C. This means that the reproducibility is only slightly acceptable. However, when using different friction materials with different material properties (e.g., thermal conductivity), significantly higher differences (up to 35 °C) were observed. Overall, it is questionable to what extent it is possible to reproduce these differences effectively with embedded thermocouples. It should be critically questioned whether the temperature ranges determined on the basis of conventional grey cast iron discs can be adopted for alternative friction materials and serve as a basis for the temperature-based PMP test method. Nevertheless, the measurement method (embedded thermocouples) can be recommended for the measurement of the average temperature, as the differences in the peak temperatures are only of short temporal duration. The investigations have shown that the reproducibility and comparability of the mean temperatures is very high. To further improve data quality, it is recommended to measure the temperature with at least two (or even three) embedded thermocouples in parallel, which minimizes the influence of inhomogeneous temperature distribution.

Author Contributions

Conceptualization, D.H., C.H., K.A., T.W., and A.P.; methodology, D.H., C.H., K.A., and T.W.; validation, D.H. and C.H.; investigation, D.H. and C.H.; data curation, D.H. and C.H.; writing—original draft preparation, D.H.; writing—review and editing, D.H., C.H., and T.W.; supervision, K.A., T.W., and A.P. All authors have read and agreed to the published version of the manuscript.

Funding

This research received no external funding.

Acknowledgments

We acknowledge support for the publication costs by the Open Access Publication Fund of the Technische Universität Ilmenau.

Conflicts of Interest

The authors declare no conflict of interest.

References

  1. Pope, C.A.I.; Dockery, D.W. Health Effects of Fine Particulate Air Pollution: Lines that Connect. J. Air Waste Manag. Assoc. 2006, 56, 709–742. [Google Scholar] [CrossRef]
  2. Pope, C.A., 3rd; Burnett, R.T.; Thun, M.J.; Calle, E.E.; Krewski, D.; Ito, K.; Thurston, G.D. Lung cancer, cardiopulmonary mortality, and long-term exposure to fine particulate air pollution. J. Am. Med. Assoc. 2002, 287, 1132–1141. [Google Scholar] [CrossRef] [PubMed] [Green Version]
  3. Oberdörster, G.; Maynard, A.; Donaldson, K.; Castranova, V.; Fitzpatrick, J.; Ausman, K.; Carter, J.; Karn, B.; Kreyling, W.; Lai, D.; et al. Principles for characterizing the potential human health effects from exposure to nanomaterials: Elements of a screening strategy. Part. Fibre Toxicol. 2005, 2, 8. [Google Scholar] [CrossRef] [PubMed]
  4. Pant, P.; Harrison, R.M. Estimation of the contribution of road traffic emissions to particulate matter concentrations from field measurements: A review. Atmos. Environ. 2013, 77, 78–97. [Google Scholar] [CrossRef]
  5. Thorpe, A.; Harrison, R.M. Sources and properties of non-exhaust particulate matter from road traffic: A review. Sci. Total. Environ. 2008, 400, 270–282. [Google Scholar] [CrossRef] [PubMed]
  6. Harrison, R.M.; Jones, A.M.; Gietl, J.; Yin, J.; Green, D.C. Estimation of the Contributions of Brake Dust, Tire Wear, and Resuspension to Nonexhaust Traffic Particles Derived from Atmospheric Measurements. Environ. Sci. Technol. 2012, 46, 6523–6529. [Google Scholar] [CrossRef] [PubMed]
  7. Kukutschová, J.; Moravec, P.; Tomášek, V.; Matějka, V.; Smolík, J.; Schwarz, J.; Seidlerová, J.; Šafářová, K.; Filip, P. On airborne nano/micro-sized wear particles released from low-metallic automotive brakes. Environ. Pollut. 2011, 159, 998–1006. [Google Scholar] [CrossRef] [PubMed]
  8. Kumar, P.; Pirjola, L.; Ketzel, M.; Harrison, R.M. Nanoparticle emissions from 11 non-vehicle exhaust sources—A review. Atmos. Environ. 2013, 67, 252–277. [Google Scholar] [CrossRef] [Green Version]
  9. Wik, A.; Dave, G. Occurrence and effects of tire wear particles in the environment—A critical review and an initial risk assessment. Environ. Pollut. 2009, 157, 1–11. [Google Scholar] [CrossRef] [PubMed]
  10. Hicks, W.; Beevers, S.; Tremper, A.; Stewart, G.; Priestman, M.; Kelly, F.; Lanoisellé, M.; Lowry, D.; Green, D. Quantification of Non-Exhaust Particulate Matter Traffic Emissions and the Impact of COVID-19 Lockdown at London Marylebone Road. Atmosphere 2021, 12, 190. [Google Scholar] [CrossRef]
  11. Charron, A.; Polo-Rehn, L.; Besombes, J.-L.; Golly, B.; Buisson, C.; Chanut, H.; Marchand, N.; Guillaud, G.; Jaffrezo, J.-L. Identification and quantification of particulate tracers of exhaust and non-exhaust vehicle emissions. Atmos. Chem. Phys. Discuss. 2019, 19, 5187–5207. [Google Scholar] [CrossRef] [Green Version]
  12. Grigoratos, T.; Martini, G. Brake wear particle emissions: A review. Environ. Sci. Pollut. Res. 2015, 22, 2491–2504. [Google Scholar] [CrossRef] [Green Version]
  13. Mathissen, M.; Grochowicz, J.; Schmidt, C.; Vogt, R.; Hagen, F.H.F.Z.; Grabiec, T.; Steven, H.; Grigoratos, T. A novel real-world braking cycle for studying brake wear particle emissions. Wear 2018, 414–415, 219–226. [Google Scholar] [CrossRef]
  14. Grigoratos, T.; Martini, G. Workshop on Brake Emissions—Towards a Regulation on Brake Wear Emissions. In Proceedings of the 82nd UNECE GRPE Session, Virtual Meeting, Brussels, Belgium, 13 January 2021. [Google Scholar]
  15. Mosleh, M.; Blau, P.J.; Dumitrescu, D. Characteristics and morphology of wear particles from laboratory testing of disk brake materials. Wear 2004, 256, 1128–1134. [Google Scholar] [CrossRef]
  16. Mamakos, A.; Arndt, M.; Hesse, D.; Augsburg, K. Physical Characterization of Brake-Wear Particles in a PM10 Dilution Tunnel. Atmosphere 2019, 10, 639. [Google Scholar] [CrossRef] [Green Version]
  17. Hesse, D. Beitrag zur Experimentellen und Analytischen Beschreibung Partikelförmiger Bremsenemissionen; Technische Universität Ilmenau: Ilmenau, Germany, 2020. [Google Scholar]
  18. Grigoratos, T.; Martini, G. Brake Wear Particle Emissions—Current Status within the PMP IWG. In Proceedings of the Eurobrake 2016 Conference, Milan, Italy, 13–15 June 2016. [Google Scholar]
  19. Sanders, P.G.; Xu, N.; Dalka, T.M.; Maricq, M.M. Airborne Brake Wear Debris: Size Distributions, Composition, and a Comparison of Dynamometer and Vehicle Tests. Environ. Sci. Technol. 2003, 37, 4060–4069. [Google Scholar] [CrossRef]
  20. Liati, A.; Schreiber, D.; Lugovyy, D.; Gramstat, S.; Eggenschwiler, P.D. Airborne particulate matter emissions from vehicle brakes in micro- and nano-scales: Morphology and chemistry by electron microscopy. Atmos. Environ. 2019, 212, 281–289. [Google Scholar] [CrossRef]
  21. Wahlström, J.; Olander, L.; Olofsson, U. Size, Shape, and Elemental Composition of Airborne Wear Particles from Disc Brake Materials. Tribol. Lett. 2009, 38, 15–24. [Google Scholar] [CrossRef]
  22. Kwak, J.-H.; Kim, H.; Lee, J.; Lee, S. Characterization of non-exhaust coarse and fine particles from on-road driving and laboratory measurements. Sci. Total. Environ. 2013, 458–460, 273–282. [Google Scholar] [CrossRef]
  23. Olofsson, U.; Olander, L. On the identification of wear modes and transitions using airborne wear particles. Tribol. Int. 2013, 59, 104–113. [Google Scholar] [CrossRef]
  24. Augsburg, K.; Hesse, D. Comparative study of brake particle emissions. In Proceedings of the 11 Internationales AVL Forum Abgas- und Partikelemissionen, Ludwigsburg, Germany, 3–4 March 2020. [Google Scholar]
  25. Heimann, S. Methodische Ansätze zur Untersuchung des Restbremsmomentes von Scheibenbremsen. Ph.D. Thesis, Technische Universität Ilmenau, Ilmenau, Germany, 2012. [Google Scholar]
  26. GRPE Brake Emissions Protocol. Part 1: Inertia Dynamometer Protocol to Measure and Characterise Brake Emissions Using the WLTP-Brake Cycle. In Proceedings of the 81th UNECE GRPE Session, Virtual Meeting, Brussels, Belgium, 20 May 2020. [Google Scholar]
  27. Hesse, D.; Augsburg, K. Temperature Analysis on the Novel Brake Cycle; PMP TaskForce 2; Joint Research Center: Ispra, Italy, 2019. [Google Scholar]
  28. Grochowicz, J.; Mathissen, M.; Grigoratos, T.; Agudelo, C. Some Aspects of Brake Temperature Evaluation in TF1 Testing; PMP TaskForce 2; Joint Research Center: Ispra, Italy, 2019. [Google Scholar]
  29. Perricone, G.; Matĕjka, V.; Alemani, M.; Wahlström, J.; Olofsson, U. A Test Stand Study on the Volatile Emissions of a Passenger Car Brake Assembly. Atmosphere 2019, 10, 263. [Google Scholar] [CrossRef] [Green Version]
  30. Musiol, F. Erklärung der Vorgänge in der Kontaktzone von trockenlaufenden Reibpaarungen über gesetzmäßig auftretende Phänomene im Reibprozess. Ph.D. Thesis, Technische Universität Berlin, Berlin, Germany, 1994. [Google Scholar]
  31. Poeste, T. Untersuchungen zu reibungsinduzierten Veränderungen der Mikrostruktur und Eigenspannungen im System Bremse. Ph.D. Thesis, Technische Universität Darmstadt, Darmstadt, Germany, 2005. [Google Scholar]
  32. Gramstat, S. Methoden der in-situ Visualisierung der Reibzonendynamik trockenlaufender Reibpaarungen unter Ergänzung physikalischer und chemischer Charakterisierungen der Reibpartner. Ph.D. Thesis, Technische Universität Ilmenau, Ilmenau, Germany, 2014. [Google Scholar]
  33. Schumann, M. Analysemethode zur Beurteilung des ungleichförmigen Bremsscheibenverschleißes an Pkw-Scheibenbremsen. Ph.D. Thesis, Technische Universität Darmstadt, Darmstadt, Germany, 2006. [Google Scholar]
  34. Severin, D.; Musiol, F. Der Reibprozess in trockenlaufenden mechanischen Bremsen und Kupplungen. Konstruktion 1995, 47, 59–68. [Google Scholar]
  35. Eriksson, M.; Lord, J.; Jacobson, S. Wear and contact conditions of brake pads: Dynamical in situ studies of pad on glass. Wear 2001, 249, 272–278. [Google Scholar] [CrossRef]
  36. Hagino, H.; Oyama, M.; Sasaki, S. Laboratory testing of airborne brake wear particle emissions using a dynamometer system under urban city driving cycles. Atmos. Environ. 2016, 131, 269–278. [Google Scholar] [CrossRef] [Green Version]
  37. Hagen, F.H.F.Z.; Mathissen, M.; Grabiec, T.; Hennicke, T.; Rettig, M.; Grochowicz, J.; Vogt, R.; Benter, T. Study of Brake Wear Particle Emissions: Impact of Braking and Cruising Conditions. Environ. Sci. Technol. 2019, 53, 5143–5150. [Google Scholar] [CrossRef] [PubMed]
  38. Augsburg, K.; Hesse, D.; Feißel, T.; Wenzel, F.; Germanow, P. Cfd Based Analysis of Particle-Air Interaction within a Sampling Device for Brake Dust Emissions; FISITA: The Hague, The Netherlands, 2018; ISBN 978-0-9572076-5-3. [Google Scholar]
  39. VDI 2066-1: Messen von Partikeln—Staubmessungen in Strömenden Gasen, Gravimetrische Bestimmung der Staubbeladung; Beuth-Verlag: Berlin, Germany, 2006.
  40. NECE Regulations No. 83, Uniform Provisions Concerning the Approval of Vehicles with Regard to the Emission of Pollutants According to Engine fuel Requirements, Published: 27 December 2006. 2012. Available online: https://op.europa.eu/en/publication-detail/-/publication/2f8f0ce5-66fb-4a38-ae68-558ae1b04a5f/language-en (accessed on 26 March 2021).
  41. Hesse, D.; Augsburg, K.; Kuhn, U.; Leicht, R. Influence of Different Process Parameters during the Run-in Procedure on the Emission Behavior; 45th PMP-MEETING, PMP-45-11; Joint Research Center: Ispra, Italy, 2017. [Google Scholar]
  42. Mamakos, A.; Arndt, M.; Augsburg, K.; Hesse, D. First insights on brake wear PN over the novel cycle; PMP TaskForce 2; Joint Research Center: Ispra, Italien, 2018. [Google Scholar]
  43. Loemba, A. Einfluss des Reibwerkstoffs auf die Eigenschaften von Reibpaarungen, besonders auf die Wirkmechanismen in der Kontaktfläche trocken laufender Bremsen. Ph.D. Thesis, Technische Universität Berlin, Berlin, Germany, 2006. [Google Scholar]
  44. Mamakos, A.; Arndt, M.; Hesse, D.; Hamatschek, C.; Augsburg, K. Comparison of Particulate Matter and Number Emissions from a Floating and a Fixed Caliper Brake System of the Same Lining Formulation. In SAE Technical Paper Series; SAE International: Warrendale, PA, USA, 2020. [Google Scholar]
  45. Plachá, D.; Vaculík, M.; Mikeska, M.; Dutko, O.; Peikertová, P.; Kukutschová, J.; Kutláková, K.M.; Růžičková, J.; Tomášek, V.; Filip, P. Release of volatile organic compounds by oxidative wear of automotive friction materials. Wear 2017, 376–377, 705–716. [Google Scholar] [CrossRef]
Figure 1. Temperature distribution over the disc surface—Speed variation at 10 bar [24].
Atmosphere 12 00436 g001
Figure 2. Temperature distribution over the disc surface—Speed variation at 80 bar [24].
Atmosphere 12 00436 g002
Figure 3. Comparison of friction materials—left: GCI (Grey Cast Iron) brake pad; centre: HMC (Hard Metal Coated) brake pad; right: CC (Carbon Ceramic) brake pad.
Atmosphere 12 00436 g003
Figure 4. Constant volume sampling (CVS) system—A HEPA filter is installed on the right side of the enclosure. Arrows indicate the PM and PN sampling probes employed in the study [38].
Atmosphere 12 00436 g004
Figure 5. Course of the number-related emission factors over the bedding process over a series of trip #10 of the WLTP brake cycles (Vehicle 1)—WLTP brake cycle trip #10.
Atmosphere 12 00436 g005
Figure 6. Course of the particle number concentration of a section of trip #10 of the WLTP brake cycle for the first 5 runs (GCI disc—vehicle 1).
Atmosphere 12 00436 g006
Figure 7. Mean particle size distribution of different friction materials (vehicle 1)—WLTP brake cycle trip #10.
Atmosphere 12 00436 g007
Figure 8. Mean particle size distribution of different friction materials (vehicle 2)—WLTP brake cycle trip #10.
Atmosphere 12 00436 g008
Figure 9. Microscopy images of the surface structure of a GCI brake pad; left: unused condition; right: after 10× trip #10 of the WLTP brake cycle.
Atmosphere 12 00436 g009
Figure 10. Number- and mass-related emission factors of the tested disc concepts (Vehicles 1 and 2)—WLTP brake cycle trip #10.
Atmosphere 12 00436 g010
Figure 11. Comparison of different friction materials in terms of mass loss (Vehicles 1 and 2)—WLTP brake cycle trip #10.
Atmosphere 12 00436 g011
Figure 12. Comparison of the average and maximum temperatures of the different friction materials (Vehicles 1 and 2)—WLTP brake cycle trip #10.
Atmosphere 12 00436 g012
Figure 13. Course of the average and maximum temperatures per cycle over the bedding process (Vehicle 1)—WLTP brake cycle trip #10.
Atmosphere 12 00436 g013
Figure 14. Temperature profile of the conventional grey cast iron (GCI) discs along brake event 106 of trip #10 of the WLTP brake cycle (Vehicles 1 and 2).
Atmosphere 12 00436 g014
Figure 15. Temperature profile of the tungsten carbide-coated (HMC) discs along brake event 106 of trip #10 of the WLTP brake cycle (Vehicles 1 and 2).
Atmosphere 12 00436 g015
Figure 16. Temperature profile of the carbon–ceramic (CC) discs along brake event 106 of trip #10 of the WLTP brake cycle (Vehicles 1 and 2).
Atmosphere 12 00436 g016
Table 1. PMP (Particle Measurement Program) temperature specifications for brake discs during trip #10 of the WLTP (Worldwide harmonized Light-Duty vehicles Test Procedure) brake cycle (IBT = initial brake temperature; FBT = final brake temperature) [14,26].
AxleBrake TypeAverage Temp. [°C]Average
IBT [°C]
Average
FBT [°C]
Maximum Temp. [°C]
FrontDisc vented8585135170
RearDisc vented656595115
RearDisc solid8085135180
RearDrum6065120175
Acceptance±10±15±25±25
Table 2. Influence of varying flow rates on the disc temperature of a disc brake of a C-segment car (IBT = initial brake temperature; FBT = final brake temperature) [27].
Flow Speed (km/h)Average Temp. (°C)Average
IBT (°C)
Average
FBT (°C)
Maximum Temp. (°C)
09091154191
68686147185
257079142180
506275137173
Table 3. Chemical composition of the serial brake pads used (GCI, HMC, CC)—X-Ray analysis (vehicle 1).
Weight Percentage (%)
COMgAlSiSCaTiCrFeZnZrSn
GCI brake pad51.718.05.15.31.42.30.00.01.29.41.30.04.4
HMC brake pad48.921.02.33.80.90.90.90.03.08.44.02.13.8
CC brake pad52.016.83.22.02.01.30.71.92.410.63.60.03.6
Publisher’s Note: MDPI stays neutral with regard to jurisdictional claims in published maps and institutional affiliations.

