Abstract
The increasing anthropogenic aerosols (AAs) over East Asia have caused significant regional climate responses, but the role of urban land-use changes which occur simultaneously, in altering these AA-induced changes, is not well understood. Here, the modulation of the AAs’ effect on the East Asian winter (November–January) climate by the urban cover in eastern China was investigated using the Community Atmosphere Model version 5.1 coupled with the Community Land Model version 4. Results show that the winter sulfate aerosol burden is higher from central eastern China to southern Japan in the case with the presence of urban cover than in the case without it, resulting from urban-induced circulation changes. Such aerosol changes markedly increase the cloud fraction and precipitation over northern China and the adjacent ocean to the east, especially convection activities around southern Japan. This leads to a cooling effect near the surface over northern China and in the mid-upper troposphere to the east due to aerosol direct and indirect effects. The resulting circulation responses act to shift the mid-tropospheric East Asian trough southward and the upper-level East Asian westerly jet-stream as well, further supporting the surface changes. These winter climate responses to the urban-modulated aerosols can largely offset or even reverse those to the AAs forcing without the urban cover in the model, especially in northern East Asia. This study highlights the need to consider the modulating role of urban land-use changes in assessing the AAs’ climatic effect over East Asia and other regions.
1. Introduction
Emissions of anthropogenic aerosols (AAs) have been increasing in recent decades over East Asia mainly due to accelerated industrial activities, including sulfate (SO4), black carbon (BC), and organic carbon (OC) aerosols. These aerosols are believed to change the radiative balance of the climate system through directly scattering and absorbing solar radiation [1,2] or indirectly altering cloud microphysical processes [3,4] and thus cause atmospheric thermal and circulation responses [5,6,7,8], although such effects may differ among different aerosol types [9,10,11].
The global AAs can perturb the extratropical large-scale circulation through exciting anomalous Rossby wave trains due to their radiative forcing [7,12,13], while regional climate responses also exist in and around aerosol source regions like South Asia and East Asia [9,10,14,15]. For instance, the East Asian AAs forcing cools the land surface in the source region and reduces the land–sea contrast during summer, thus weakening the East Asian summer monsoon (EASM) circulation [10,16]; and this is also true for the East Asian spring circulation [17,18]. Anthropogenic forcings, including both greenhouse gases and AAs, have played roles in both the interdecadal and long-term weakening of the East Asian winter monsoon (EAWM) in recent decades [19,20]; it would be interesting to see how the East Asian winter climate would respond to the increasing AAs; however, this aspect has rarely been investigated. It is suggested that, in winter, the absorbing aerosols (mainly BC) can warm the Tibetan Plateau via reducing the surface albedo and then cool the surface over northern East Asia through accelerating the East Asian westerly jet-stream (EAWJ) and shifting the East Asian trough (EAT) westward, thus intensifying the EAWM northern mode [21]. In contrast, the EAWM may be weakened to the south of ~30° N due to the BC-induced warming effect [22] or the AA-induced tropical response [23]. This implies that AA-forced EAWM changes may result from the competition between tropical and extratropical responses [23]. However, a few studies reported an overall weakening of the EAWM circulation (i.e., for both northern and southern East Asia) caused by the AAs forcing [9,24]. As a result, the AAs’ effect on the East Asian winter climate is still debated. As eastern China is densely populated, urban land cover can also affect the balance of the surface energy budget through modifying surface albedo, thus warming the surface, namely, the urban heat island effect [25,26,27]. Such an urbanization effect acts to oppose the AAs’ cooling effect and can also significantly cause regional circulation responses over East Asia [28,29,30,31,32]. Both regional and global climate models simulated a weakening of the EASM due to large-scale urban expansion [29,31]; however, the urban-forced EASM responses may have obvious sub-seasonal features [32]. In particular, Chen and Zhang [28] found that the urban cover in eastern China increases winter thermal heating from the surface to the atmosphere, thus weakening the EAWM over the urban region but strengthening it in northeastern China.
Clearly, both AAs and urban forcings have exerted great influences on the East Asian climate. Given the coexistence of these two forcing factors in eastern China, one may wonder how they would behave jointly to change the East Asian climate as they have nearly opposite thermal effects. The observational data showed that both urban cover and AAs act to enhance the cloud-to-ground lightning over the urban areas [33]. Based on a state-of-the-art regional model coupled with online chemistry (WRF-Chem) and a single-layer urban canopy model (UCM) to investigate the combined effect of urban land use and aerosols, Zhong et al. [34,35] found an opposite effect on summer precipitation over two typical urban areas of China due to the expanded urban land cover and increased aerosols, with a dominant role of the latter; however, their effects on individual precipitation events largely depend on the background synoptic weather patterns. Sarangi et al. [36] also pointed out that the urban land effect could increase precipitation over the urban area while the AAs’ effect enhances precipitation over the downwind region. Moreover, Fan et al. [37] suggested that the AAs could accelerate and intensify convective precipitation after the urban land cover transfers the warm cloud into mixed-phase cloud. For the large-scale circulation response, Jiang et al. [38] showed that when both AAs and urban cover are combined in an atmospheric general circulation model, their joint effect on the EASM circulation is controlled by the AAs’ effect but the magnitude is partially reduced by the urbanization effect. Our previous studies [39,40] compared the combined effect of these two forcing factors to the linear combination of their individual effects and further proposed their possible nonlinear effect on the East Asian summer and spring climate. It was found that such a nonlinear effect acts to reduce the linear combination of both individual effects, which may be initiated by thermodynamic interactions between the two. In addition, Deng et al. [8] suggested that the circulation changes induced by CO2 (which also produces a surface warming effect) could redistribute winter European aerosol loading and further cause thermal responses to weaken their combined effect. As a result, one may need to know whether and how urban cover can modulate East Asian aerosols (and thus their climatic effects) during winter due to such a coexistence.
This study aimed to address the following questions by conducting and analyzing a series of numerical experiments using prescribed AAs and urban cover alone or in combination: (1) whether the urban cover can modulate the AAs’ effect on East Asian winter climate? If so, what are the differences between AA-induced changes with and without the presence of urban cover? (2) How does the urban forcing trigger such differences? This study differs from previous studies [33,34,35,36,37,38,39,40] in that the possible role of urban cover in modulating the AAs’ effect on East Asian winter climate and the underlying physical mechanism (specifically the changed aerosol loading due to urban forcing) are examined. This would improve our understanding on how anthropogenic forcing agents can individually or jointly change regional climate.
The remainder of the paper is organized as follows. In Section 2, we briefly describe the methodology, including the data, model simulations, and analysis method. Section 3 compares climate responses to the AAs forcing with and without the presence of urban cover, with a specific focus on the urban-modulated aspects. Section 4 presents the summary and discussions.
2. Methodology
2.1. Data and Model Simulations
We used the Community Atmosphere Model version 5.1 (CAM5.1) [41] coupled with the Community Land Model version 4 (CLM4) [42], which serve as the atmosphere and land components of the Community Earth System Model version 1.0.3 (CESM1) [43] from NCAR, respectively. The CAM5 model provides a three-mode Modal Aerosol Model (MAM3) [44], which is coupled to two-moment cloud microphysics [45] by droplet activation [46] and ice nucleation [47] to present aerosol–cloud interactions. Specifically, the Köhler theory is used to relate the aerosol size distribution and composition to the number activated as a function of maximum supersaturation [46]. The model was run with a horizontal grid spacing of 2.5° longitude × ~1.9° latitude and used the climatological monthly mean sea surface temperatures (SSTs) averaged over 1986–2005 as the surface boundary condition. The model has been widely used in previous similar studies [30,31,38,39,40] regarding East Asian spring and summer climate.
To explore the AAs’ effect on the East Asian winter climate and the modulating role of the urban forcing, four simulations were performed in this study, which were described in detail and used by Deng and Xu [39] and Deng et al. [40]; here, we describe them briefly. The first experiment was run with all external forcing agents prescribed at the level for year 2000, including both aerosols and urban cover (labeled as BOTH). The other three experiments are the same as BOTH, except with neither AAs nor urban forcing (labeled as NOUA), only AAs forcing (labeled as AERO), and only urban forcing (labeled as URBN) prescribed over eastern China (100°–125° E, 20°–45° N). That is, URBN is based on BOTH but removes the AAs effect over eastern China by replacing the surface and tropospheric AA emissions at the level of the year 2000 with those at the level of year 1850, while AERO is based on BOTH but removes the urban effect by replacing the urban cover fraction in the same region with the dominating plant functional type (PFT) at each grid cell; and both effects were removed in NOUA. In CAM5.1, AA emissions are taken from the Intergovernmental Panel on Climate Change (IPCC) Fifth Assessment Report (AR5) emission data set [48] for the levels of year 1850 and year 2000. In CLM4, urban areas are based on a population density dataset (LandScan 2004) derived from census data, nighttime lights satellite observations, road proximity and slope [49] as described by Jackson et al. [50]. Each of these experiments includes three ensemble members and each member is integrated for 25 model years using difference initial conditions that are randomly selected from NOUA. The outputs of the last 20 years from all ensemble members were analyzed and often averaged. Such averaging could substantially reduce the internal variations (to about 1/√60 = 13% of those in individual years) in averaged fields.
Here, the winter was defined as November–December–January (NDJ) throughout the study, as little influence of urban cover on the AAs’ effect was found in February (not shown). To validate the model performance in simulating the East Asian winter climate, we used monthly mean surface and atmospheric fields from European Centre for Medium-Range Weather Forecasts (ECMWF) reanalysis data version 5 (ERA5) [51] from November 2000 to January 2020, including surface air temperature (SAT), total precipitation rate (PRECT), total cloud fraction (CLDTOT), tropospheric air temperature (T), zonal wind (U), meridional wind (V), and geopotential height (Z) on a 1° grid. We also used the monthly mean aerosol optical depth (AOD) field from the Multiangle Imaging Spectroradiometer (MISR) [52] level 3 data on board the Earth Observing System (EOS) satellites to validate the CAM5-simulated aerosol loading. The MISR level 3 data used in this study has a horizontal resolution of 1° × 1° and covers the same period as ERA5. Figure 1 shows the spatial distribution of NDJ-mean AOD over East Asia from the MISR data and the BOTH experiment. It was found that a higher AOD was observed over southern China in winter (Figure 1a), which was considerably underestimated in the CAM5 model (Figure 1b); however, the AA-caused AOD changes (Figure 1c) agree well with observations in space. This implies that CAM5 may underestimate the emissions of anthropogenic aerosols and precursor gases, as also noticed previously [53]. In addition, the single-scattering albedo (SSA) of biomass burning aerosols (e.g., black carbon) is also underestimated in this model and many other climate models [54,55]. Figure 2 compares the simulated and observed climatological NDJ-mean fields over East Asia. In winter, the Siberian high is located over Eurasian continent and the Aleutian low over the North Pacific high latitudes, thus northwesterly flowing from Central Siberia to the Northwest Pacific and bringing northern cold air into lower latitudes; meanwhile, total precipitation and cloud fraction is underestimated over southern China (Figure 2a–d). In the troposphere, the 500-hPa EAT extends from the Okhotsk Sea to the Japan Islands, while the upper-level EAWJ lies along ~35° N in the south (Figure 2e,f). Overall, the CAM5 model can reasonably simulate the winter AOD and climatic fields over East Asia.
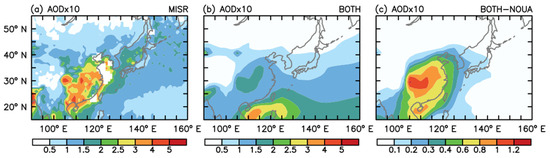
Figure 1.
Climatological November–December–January (NDJ) mean aerosol optical depth (AOD; multiplied by 10, unitless) in East Asia averaged over the period (a) 2000–2020 from Multiangle Imaging Spectroradiometer (MISR) data and (b) the last 20 years from the BOTH experiment. (c) Same as (b) but for the BOTH-minus-NOUA difference. Note the smaller interval in (c).
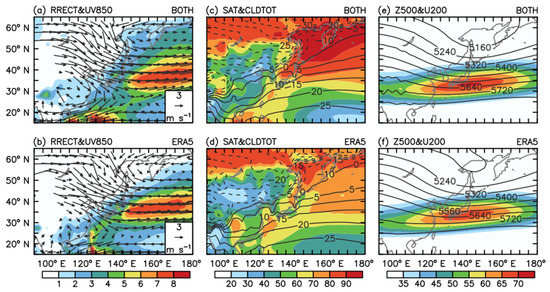
Figure 2.
Climatological NDJ-mean (a,b) total precipitation (PRECT; color shading, in mm/day) and 850 hPa horizontal winds (vectors, in m/s); (c,d) surface air temperature (SAT; contours, in °C) and total cloud fraction (CLDTOT; color shading, in %), and (e,f) 500 hPa geopotential height (Z500; contours, in gpm) and 200 hPa zonal wind (U200; color shading, in m/s) in East Asia averaged over (a,c,e) the last 20 years from the BOTH experiment and (b,d,f) 2000–2020 from the ERA5 data. The spatial pattern correlations of PRECT, 850 hPa U and V, SAT, CLDTOT, 500 hPa Z, and 200 hPa U between BOTH and ERA-Interim are 0.94, 0.95, 0.89, 0.99, 0.99, 0.99, and 0.99, respectively.
2.2. Analysis Methods
Based on the above four experiments, changes in the East Asian winter climate due to the AAs forcing can be evaluated in two ways: one is the difference between AERO and NOUA (i.e., AERO−NOUA) and the other is the difference between BOTH and URBN (i.e., BOTH−URBN). Accordingly, the latter effect considers the presence of urban cover while the former does not. As a result, any difference between these two effects (i.e., (BOTH−URBN)−(AERO−NOUA)) can be regarded as the changes modulated by the urban cover.
In this study, we used the Monte-Carlo (MC) test to test whether the change or difference of a given climate variable (which does not satisfy the normal distribution in this case with a small sample size) is statistically significant. In the MC test, the given variable at each grid box from any two specific experiments (40 samples) is randomly divided into two groups (20 samples each) for 1000 times. Their differences are then increasingly sorted and the 10% (90%) quantile is chosen as the lower (higher) confidence bound for the 0.1 significance level.
3. Results
3.1. Changes in Aerosol Column Burdens and the Modulating Role of Urban Cover
The concentrations of winter AAs increased remarkably over East Asia by year 2000 relative to the level of year 1850, including anthropogenic SO4, BC, and primary organic matters (POMs) (Table 1). The BC burden over eastern China was greatly increased by about four times with respect to the level of year 1850, followed by the increase in POM burden (by ~two times) and SO4 burden (by ~1.5 times). Figure 3 shows spatial patterns of NDJ-mean changes in aerosol column burdens due to East Asian AA emissions. It is found that the maximum increases in the SO4 burden appear over southwestern China exceeding 8 mg/m2 (Figure 3a,b), while the BC burden largely increases over the North China Plain with a maximum up to 2.4 mg/m2 (Figure 3d,e); and the POM burden shows a similar spatial pattern to the BC burden but with larger increases (Figure 3g,h). In addition, higher aerosol burdens over land can also be advected to some degree to the adjacent ocean in the west by the wintertime westerly or northwesterly wind (cf. Figure 2), thus moderately increasing aerosol concentrations in these regions. However, comparisons between the BOTH−URBN and AERO−NOUA cases show that the presence of urban cover could evidently increase the SO4 burden over eastern China by 0.07 mg/m2 (2.81%) and such an increase extends from central eastern China to southern Japan (Figure 3c); in contrast, the BC and POM burdens are reduced by 0.01 and 0.03 mg/m2 (2.87% and 2.20%), respectively, but these reductions fail to pass the significance test (Figure 3f,i). This implies that the presence of urban cover may play a role in modulating the East Asian aerosol concentrations during winter, especially the SO4 aerosols. As a result, the aerosol SSA is widely reduced by the increase in aerosols over eastern China, especially over the North China Plain, primarily due to higher BC and POM burdens in this region (not shown), while the presence of urban cover could slightly weaken such SSA reductions by modulating scattering sulfate aerosols.

Table 1.
NDJ-mean anthropogenic aerosol (AA)-induced changes in aerosol optical depth (AOD; unitless) and column burdens (in mg/m2) of sulfate (SO4) aerosols, black carbon (BC) aerosols, and primary organic matters (POMs) averaged over eastern China (105°–125° E, 20°–45° N) from AERO−NOUA, BOTH−URBN, and their difference (i.e., (BOTH−URBN)−(AERO−NOUA). Here, AOD is multiplied by a factor of 100. The values in parentheses denote their percentage changes relative to NOUA.
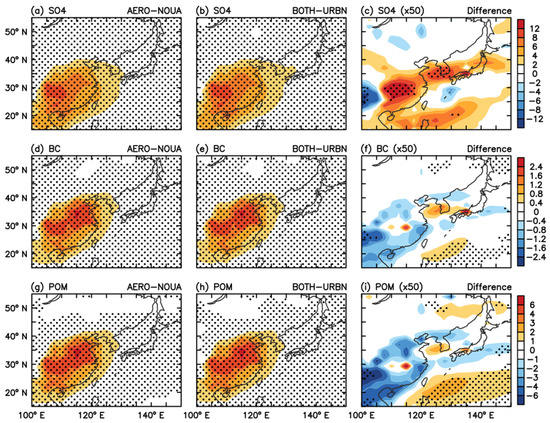
Figure 3.
(a–c) NDJ-mean change in sulfate (SO4) aerosol column burden (in mg/m2) over East Asia from (a) AERO−NOUA; (b) BOTH−URBN; and (c) their difference (i.e., (b) minus (a): multiply by a factor of 50 in order to use the same color table). (d–f) Same as (a–c), respectively, but for black carbon (BC). (g–i) Same as (a–c), respectively, but for primary organic matters (POMs). The stippling indicates the change or difference is statistically significant at the 90% confidence level based on the Monte-Carlo (MC) test.
Thus, one may wonder how the urban forcing can cause such aerosol redistribution, since the same AA emissions are applied in BOTH and AERO. Winter SAT is generally increased by 0.1 to 0.5 K over a large region of eastern China, especially over the North China Plain with higher urban fraction (Figure 4a). Such land-surface warming due to urban cover would reduce the land–sea thermal contrast, resulting in remarkable southerly/southwesterly wind anomalies between 35° N and 45° N over eastern China (Figure 4a), thus weakening the prevailing northwesterly wind in the lower troposphere (cf. Figure 2a,b). These results are consistent with the findings of Chen and Zhang [28]. As a result, when urban cover is considered in the model, more aerosols (mainly SO4) would accumulate over central eastern China (Figure 3c) due to the weakened low-level northerly wind in the upstream region. On the other hand, the sub-grid updraft is enhanced in the mid-lower troposphere over northern China due to the urban forcing (Figure 4b), which would favor the activation of aerosol particles [56]. Meanwhile, the urban-forced anticyclonic anomaly circulation in the mid-upper troposphere (Figure 4b) also facilitates both the aerosols’ accumulation in southern China and their export to southern Japan across the Yellow Sea (Figure 3c). Overall, the urban cover can cause more aerosols (mainly SO4) accumulated in central eastern China and even lifted up into the middle troposphere, and then diffused eastward to the downstream North Pacific region by the northward shifted EAWJ. In addition, urban-induced changes in the large-scale environment also benefit the cloud initiation and development. As shown in Figure 4c, the urban forcing causes anomalous ascending (descending) motion below (above) 600 hPa over ~25°–35° N, which may be favorable for middle clouds [57] over this region in the case with urban cover. In addition, the mid-upper tropospheric relative humidity (RH) decreases between 20° N and 30° N, together with anomalous subsidence, which would facilitate the cloud reduction here (as shown later). Again, these urban-induced changes in dynamic environments only act as a trigger for the differences between BOTH−URBN and AERO−NOUA.
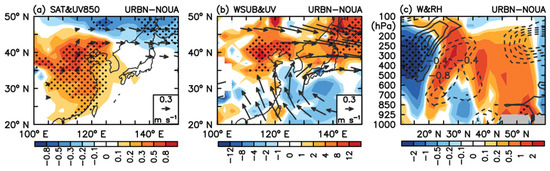
Figure 4.
NDJ-mean changes in (a) SAT (color shading, in K) and 850 hPa horizontal winds (vectors, in m/s) and (b) sub-grid vertical velocity (color shading, in 10−3 m/s) averaged over 1000–700 hPa and horizontal winds (vectors, in m/s) averaged over 500–200 hPa in East Asia due to the urban forcing alone (i.e., URBN−NOUA). (c) The vertical distribution of NDJ-mean changes in vertical velocity (ω; color shading, in hPa/day) and relative humidity (RH; contours, at an interval of 0.4%; dashed contours are for negative values and the zero contour is omitted for clarity) averaged over 105°–140° E due to the urban forcing. The stippling and vectors indicate the changes are statistically significant at the 90% confidence level based on the MC test.
3.2. Responses of East Asian Winter Climate
3.2.1. Atmospheric Circulation
In the AERO−NOUA case, the increasing AAs prominently decrease the sea level pressure (SLP) over a large area of the North Pacific and cause an anomalous surface cyclone, thus strengthening the Aleutian low (Figure 5a); meanwhile, such an anomalous cyclone is accompanied by the northerly wind anomaly at ~50° N over land. In addition, negative mid-tropospheric Z anomalies are seen from East Siberia to the North Pacific due to the AAs forcing, which tends to deepen the EAT (Figure 5d). By comparisons, the AA-induced circulation changes in the BOTH−URBN case exhibit some different features. Due to the increasing AAs, the SLP is decreased over the mid-latitude North Pacific but increased in the north, resulting a southward displacement of the Aleutian low (Figure 5b). There also exits an anomalous anticyclone in the low-latitude ocean and the anomalous westerly wind in its north acts to transport some aerosols from land to ocean (Figure 3c,f,i). At 500 hPa, the negative height anomalies move from the higher latitudes to northern East Asia (Figure 5e), thus a southward shift of the EAT with a more northeast–southwest oriented EAT axis. Figure 6 shows the vertical distribution of NDJ-mean changes of zonal wind and vertical motion. The northern part of the upper-level EAWJ is evidently intensified and thus the EAWJ is shifted northward by the AAs forcing alone in the AERO−NOUA case (Figure 6a), causing anomalous descending (ascending) motion between 25° N and 45° N (to the south of 25° N) over East Asia (Figure 6d). In contrast, the AAs forcing markedly strengthens the southern part of the EAWJ (Figure 6b) when the urban cover is presented, thereby shifting the EAWJ southward. Accordingly, in the BOTH−URBN case the AA-induced changes in vertical motions are largely weakened or even reversed (Figure 6e) relative to those in AERO−NOUA, indicative of an offset effect from the urban-modulated changes (Figure 6f). As a result, the AAs forcing mainly acts to strengthen the East Asian winter climate system in the case without the presence of urban cover, while it causes a southward displacement of the winter circulation system when the urban cover is considered in the model, which is dominated by the modulation effect of urban-caused AA changes (Figure 5c,f and Figure 6c,f).
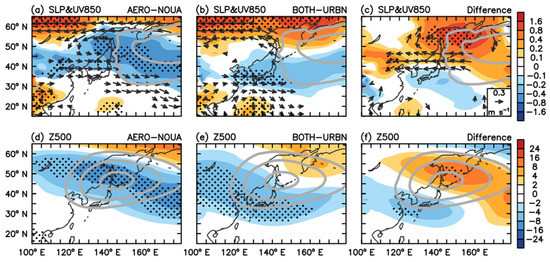
Figure 5.
(a–c) NDJ-mean AA-induced changes in sea level pressure (SLP; color shading, in hPa) and 850 hPa horizontal winds (vectors, in m/s) over East Asia from (a) AERO−NOUA; (b) BOTH−URBN; and (c) their difference (i.e., (b) minus (a)). (d–f) Same as (a–c), but for changes in Z500 (color shading, in gpm). Thick gray contours denote the climatology of (a–c) zonal deviation of SLP with values of −10 and −5 hPa (donating the Aleutian low) and (d–f) zonal deviation of Z500 with values of −200, −150, and −100 gpm (donating the East Asian trough) in BOTH.
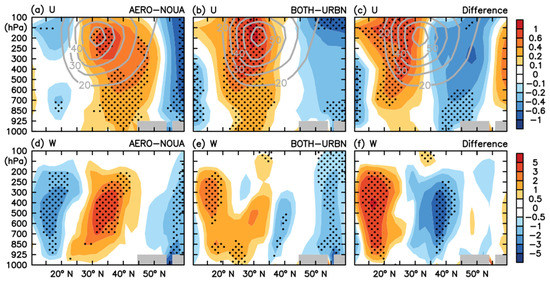
Figure 6.
(a–c) Vertical distributions of NDJ-mean AA-induced changes in zonal wind (U; color shading, in m/s) averaged over 105°–140° E from (a) AERO−NOUA; (b) BOTH−URBN; and (c) their difference (i.e., (b) minus (a)). (d–f) Same as (a–c), but for changes in vertical velocity (ω; color shading, in hPa/day). The gray contours in (a–c) indicate the climatology of U (≥20 m/s, with an interval of 10 m/s) in BOTH, donating the East Asian westerly jet-stream.
3.2.2. Cloud Properties and Surface Radiation Budget
Figure 7 shows the NDJ-mean changes in the cloud fraction due to the East Asian AAs forcing. In the AERO−NOUA case, the AAs forcing causes a decrease in cloud fraction between 30° N and 40° N and an increase in cloud fraction in the mid-upper troposphere to the south of 30° N over East Asia (Figure 7a,d). However, such changes in the cloud amount can be greatly cancelled by the urban-modulated AA burdens in the BOTH−URBN case (Figure 7b,e); that is, the changed AA concentrations act to increase the cloud fraction over the most areas of eastern China and around the Korean Peninsula as well (Figure 7c,f), especially where the SO4 aerosols are increased by the urban cover (Figure 3c). In addition, some cloud reduction also occurs in the south of 30° N over the North Pacific due to the modulated AA effect (Figure 7c,f). In CAM5.1, the simulated changes of cloud fraction can be also affected or even determined by the responses of T, RH, and vertical motion [39,40]. In the AERO−NOUA case, the AAs forcing decreases (increases) the tropospheric RH and causes anomalous descending (ascending) motion between 25° N and 45° N (to the south of 25° N) over East Asia, leading to less (more) clouds in this region (Figure 6d and Figure 7d). However, such AA-induced changes in cloud fraction are greatly weakened or even reversed in the BOTH−URBN (Figure 7e) because the presence of urban cover act to produce nearly opposite differences (Figure 7f) to those in the AERO−NOUA case. These results suggest a close connection among cloud fraction, vertical motion and RH; that is, the AA-induced increases (decreases) of cloud fraction are in association with the anomalous upward (downward) motion and increased (decreased) RH in the troposphere. However, T changes (not shown) have little impacts on these cloud anomalies. Note that changes in vertical motion and RH in the troposphere due to the urban forcing alone (Figure 4c) may also benefit such differences in cloud fraction.
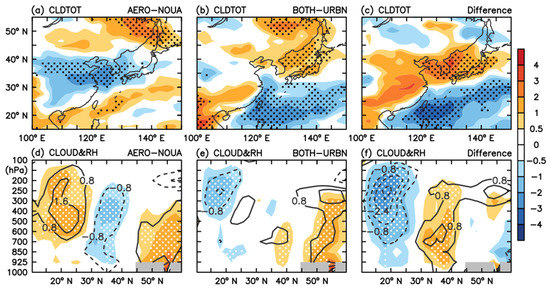
Figure 7.
(a–c) The NDJ-mean AA-induced change in total cloud fraction (in %) over East Asia from (a) AERO−NOUA; (b) BOTH−URBN; and (c) their difference (i.e., (b) minus (a)). (d–f) Same as (a–c), respectively, but for vertical distributions of changes in cloud fraction (color shading, in %) and relative humidity (contours, at an interval of 0.8%; dashed contours are for negative values and the zero contour is omitted for clarity) averaged over 105°–140° E. The stippling indicates the change or difference in cloud fraction is statistically significant at the 90% confidence level based on the MC test.
Previous studies showed that aerosols can serve as cloud condensation nuclei (CCN) and thus change cloud properties [3,4,10,18,21]. In southern China, the AA-caused increase in CCN tends to increase the cloud droplet number concentration (CDNC) and reduce the cloud droplet effective radius (Reff), leading to a remarkable increase in cloud liquid water path (LWP) over this region (Figure 8a,b,d,e and Table 2). In addition to the aerosol–cloud interactions, the AA-altered meteorological conditions may also contribute to such LWP increases, such as low tropospheric stability (LTS) and relative humidity (RH) [58,59]. For example, the increased LTS is favorable for the increased LWP in the AERO−NOUA case, while both LTS and RH jointly work for the LWP increase in the BOTH−URBN case (Table 2). As a result, higher LWP would enhance the shortwave (SW) cloud forcing (SWCF) (Figure 8g,h) and thus a surface cooling effect (note that negative SWCF means reduced solar radiation reaching the surface). However, as the SO4 aerosol burden and low-level RH is increased in BOTH−URBN (relative to AERO−NOUA) due to the presence of urban cover, some additional increases in CCN, CDNC and LWP are also found over central eastern China (Figure 8c,f), which would further strengthen the negative SWCF in this region (Figure 8i). This is consistent with previous findings [10,21,53] in that SO4 aerosols may play a more effective and efficient role than BC aerosols in causing negative SWCF via acting as CCN. Overall, the urban-caused AA burden changes act to increase the cloud fraction over eastern China and downstream regions in the east, thus largely enhancing the SWCF there.
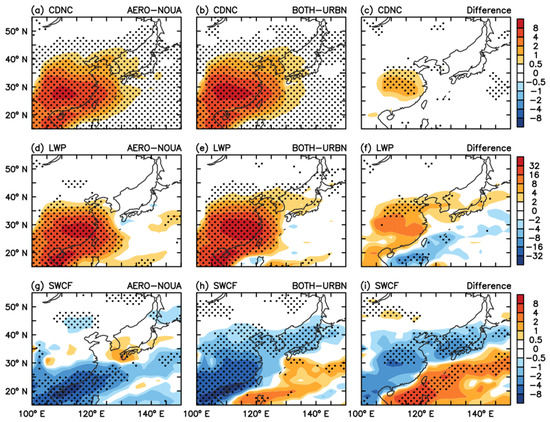
Figure 8.
Same as Figure 5, but for (a–c) vertically integrated cloud droplet number concentration (CDNC; in 106 #/cm2), (d–f) cloud liquid water path (LWP; in g/m2), and (g–i) shortwave cloud forcing (SWCF; in W/m2). A negative (positive) SWCF indicates that clouds reduce (enhance) the downward solar radiation at the surface, leading to a surface cooling (warming) effect.
Table 2.
NDJ-mean AA-induced changes in cloud condensation nuclei (CCN) number concentration at the supersaturation of 0.1% (CCN0.1; in #/cm3) at 850 hPa, vertically integrated cloud droplet number concentration (CDNC; in 106 #/cm2), cloud droplet effective radius (Reff; in μm) at 850 hPa, low tropospheric stability (LTS; in K), RH at 700 hPa (RH700; in %), cloud liquid water path (LWP; in g/m2), and shortwave cloud forcing (SWCF, in W/m2) averaged over southern China (105°–125° E, 20°–35° N) from AERO−NOUA, BOTH−URBN, and their difference (i.e., (BOTH−URBN)−(AERO−NOUA)). Here, LTS is defined as the difference in potential temperature (θ) between 700 hPa and the surface (LTS = θ700 − θsurf).
The increases in AA emissions markedly reduce the NDJ-mean surface net radiation flux (SRFRAD) over southern China, with a maximum reduction exceeding −12 W/m2 along the southern coastal region (Figure 9a,b), although higher AA loading is seen in the north (Figure 3). This is because the SW radiation reaching the surface can be prominently reduced (Figure 9d,e) by the direct reflection and absorption of increasing AAs and by the AA-induced LWP increases (Figure 8d,e) and the resulting negative SWCF (Figure 8g,h), as also noticed previously [10,21,53,60]. In particular, some increases in SRFRAD (mainly the SW radiation) can also be found in northern China (Figure 9a,d) due to the AA-caused cloud reduction in this region (Figure 7a,d) when the urban cover is absent in the model; however, such changes are reversed after the urban cover is presented (Figure 9b,e), as the urban-modulated AAs burden changes could further reduce the SW radiation arriving at the surface over northern China (Figure 9c) via increasing the cloud fraction there (Figure 7c). Overall, the urban-modulated changes in cloud fraction and surface net SW radiation match well in space over East Asia but with roughly opposite signs, indicating a connection between the two. Moreover, there also exists some weaker reductions in surface turbulent (sensible plus latent) heat fluxes over northern China due to the urban modulation (Figure 9i), whereas the AAs forcing mainly acts to significantly decrease surface heat fluxes below 40° N (Figure 9g,h) over the East Asian continent. Therefore, the above results suggest a crucial role of the urban cover in modulating the AAs’ effect on NDJ-mean clouds and surface radiation fluxes over East Asia via altering the aerosol burdens and the resulting large-scale circulation.
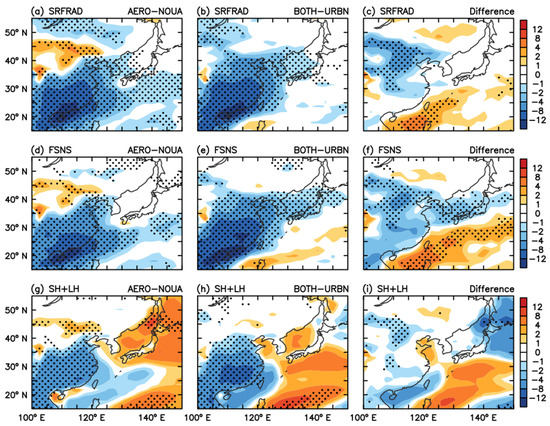
Figure 9.
Same as Figure 5, but for (a–c) the surface net radiation flux (positive downward; in W/m2), (d–f) surface net shortwave flux (positive downward; in W/m2), and (g–i) turbulent (sensible + latent) heat fluxes (positive upward; in W/m2).
3.2.3. Air Temperature
As the increasing AA emissions could change the surface radiative budget (Figure 9), the NDJ-mean SAT is markedly decreased over southern China (south of ~30° N) by about 0.3–0.5 K for both AAs’ effects (i.e., with and without the presence of urban cover in the model; Figure 10a,b). However, an obvious AA-induced surface cooling over northern China (above ~35° N) is simulated in the case with the urban cover presented (Figure 10b), in contrast to warmer SAT simulated in the case without the presence of urban cover (Figure 10a). This results from a relatively strong cooling (Figure 10c) caused by urban-modulated AA loading (Figure 3c) and the resulting SW flux reduction (Figure 9f) in this region. In addition, the southward shifted EAT can also advect cold air southward and thus negative SAT anomalies over northern China. Wang et al. [61] suggested a close connection between the 500 hPa EAT axis and the cold outbreaks over the East Asia–North Pacific sector during winter; and the East Asian atmospheric responses to the urban-induced AA burden changes in this study (Figure 5c,f and Figure 6c) share many similar features with the observational circulation anomaly related to a more northeast–southwest tilt of EAT (see their Figure 6). This implies that the urban-induced AAs act to bring more cold air to East Asia via altering large-scale circulation, and thus further cooling the surface in northern China (Figure 10c), which could reverse the AA-induced SAT change in the case without the role of urban cover (Figure 10a).
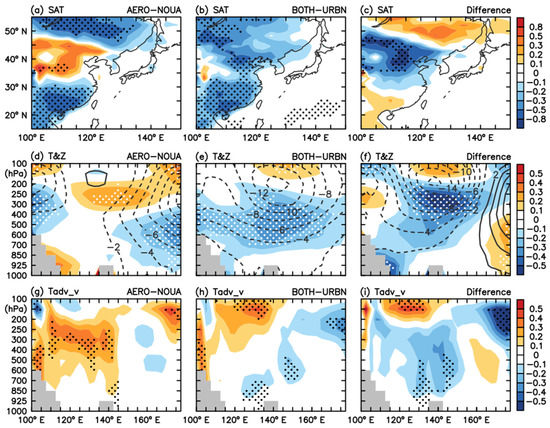
Figure 10.
(a–c) The NDJ-mean AA-induced change in surface air temperature (SAT; in K) over East Asia from (a) AERO−NOUA; (b) BOTH−URBN; and (c) their difference (i.e., (b) minus (a)). (d–f) and (g–i) Same as (a–c), respectively, but for vertical distributions of changes in (d–f) air temperature (T; color shading, in K) and geopotential height (Z; contours, at an interval of 2 gpm; dashed contours are for negative values and the zero contour is omitted for clarity) and (g–i) vertical temperature advection (Tadv_v; in K/day) along 35° N. The stippling indicates the change or difference in SAT, T, and Tadv_v is statistically significant at the 90% confidence level based on the MC test.
Figure 10 also shows the vertical distributions of AA-induced T and Z changes along 35° N over the East Asia–North Pacific sector. In the AERO−NOUA case (Figure 10d), the lower troposphere (below 700 hPa) is warmed over eastern China due primarily to the warming effects of absorbing aerosols (e.g., BC and POM; Figure 3d,g) and reduced cloud fraction (Figure 7a) in this area; however, tropospheric T changes are generally small in the downstream North Pacific between 120° E and 150° E, despite some colder T below 300 hPa over the central North Pacific with negative Z anomalies. In contrast, the BOTH–URBN case (Figure 10e) displays a remarkable tropospheric cooling between 700 hPa and 200 hPa, extending from the Tibetan Plateau to the central North Pacific with its maximum near 140° E, together with strong negative Z anomalies centered at 200 hPa over this region. The differences between these two cases (Figure 10f) show an evident cooling in the lower troposphere over eastern China due to more scattering SO4 aerosols there (Figure 3c), and such a cooling could markedly extend westward and upward to the upper troposphere over southern Japan, which may be partly linked to the aerosol-induced convective clouds (as shown later in Section 3.2.4). Accordingly, large negative Z anomalies appear in the entire troposphere over the East Asia–central North Pacific, centered at 200 hPa; and such Z anomalies (the cyclonic circulation anomaly) act to shift the EAT southwestward (Figure 5f), which dominates the BOTH−URBN case. In addition to aerosol–radiation and aerosol–cloud interactions, large-scale circulation changes may also contribute to such T (and thus Z) changes. It was found that changes of lower-tropospheric temperature over the East Asian continent were controlled by anomalous horizontal temperature advections (not shown), while the mid-upper tropospheric temperature responses over the North Pacific are closely related to changes in the adiabatic processes (Figure 10g–h) induced by anomalous vertical motions (Figure 6d–f). Overall, the increases in SO4 aerosols caused by urban cover can cool the atmosphere over northern East Asia and the downstream North Pacific, resulting in some thermal and circulation responses that further regulate the East Asian AAs’ effect on the winter temperature. Therefore, East Asian winter temperature changes can be affected by the AA-caused large-scale atmospheric responses and the aerosol–radiation and aerosol–cloud interactions.
3.2.4. Precipitation
In association with the cloud reduction (Figure 7a), the NDJ-mean total precipitation is significantly suppressed by up to 0.5 mm/day between 30° N and 40° N due to the increasing AAs when the urban cover is removed (Figure 11a); while such precipitation reduction is greatly overwhelmed in the case considering the urban cover (Figure 11b), primarily due to the increased cloud fraction and thus precipitation there (Figure 11c) by urban-modulated AA burdens. Similar features of precipitation changes can also be found over the lower-latitude ocean areas for both effects, but with roughly opposite signs. In the BOTH−URBN case, the weaker precipitation reduction over land may lead to smaller increases in BC and POM burdens relative to the AERO−NOUA case (Figure 3d–i). In addition, these precipitation anomalies are also closely related the anomalous vertical motion (Figure 6d–f), implying a role of the AA-induced large-scale atmospheric adjustment in causing precipitation changes in and around the source regions, as also reported previously [39,60].
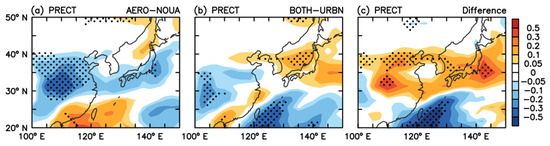
Figure 11.
Same as in Figure 5, but for total precipitation (in mm/day) over East Asia from (a) AERO−NOUA; (b) BOTH−URBN; and (c) their difference (i.e., (b) minus (a)).
In addition, we also noticed remarkable increases in winter total precipitation extending from South Korea to central–southern Japan due to the modulation of aerosols by the urban cover, especially over the ocean areas (Figure 11c), which mainly results from enhanced convective precipitation in this region (Figure 12a). As suggested previously [62,63], the Asian AAs, especially SO4 aerosols, can intensify the wintertime North Pacific storm track through its interaction with cloud processes. Thus, we further explore the difference in the AAs’ effects on convections (Figure 12b–d). Clearly, the NDJ-mean convection is evidently deepened over the North Pacific region between 130° E and 150° E (Figure 12b) due to the AAs forcing in the case with the presence of urban cover (relative to those in the case without the urban forcing), which is spatially coherent with the increased convective precipitation there (Figure 12a). Meanwhile, the vertical profiles (along 35° N) of the convective cloud amount and in-cloud ice content fraction show that convective clouds increase with height over the Northwest Pacific from 120° E to 150° E in the BOTH−URBN case (with the urban cover) than in the AERO−NOUA case (without the urban cover), especially the increases in middle-level convective clouds between 850 and 400 hPa (Figure 12c); while the in-cloud ice content also increases with longitude from the near-surface to the middle troposphere over this region (Figure 12d). These results imply that the urban-induced AA burden changes may enhance the downstream precipitation efficiency, mainly through their interaction with dynamics of deep convective clouds [63], thus modulating (offsetting) the AAs’ effect on precipitation when the urban cover is missing. Note that such enhancement of convective precipitation is only confined to the west of 150° E over the Northwest Pacific, due partially to the poorly simulated long-range AAs transport. In addition, we found that the occurrence of deep convection is also moderately increased over central eastern China (not shown), implying that the urban land–aerosol interaction favors the development of convective clouds over the downwind region, as reported previously [36,37]. However, this aspect still requires further investigations due to the lack of multiscale modeling framework in this model [63] and the limitation of a relatively coarse horizontal resolution used in this study.
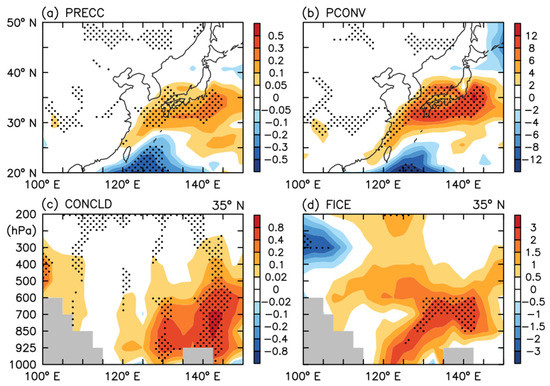
Figure 12.
(a,b) The NDJ-mean difference in AA-induced (a) convective precipitation (in mm/day) and (b) convection depth (measured by the convection base-minus-top pressure; in hPa) over East Asia between BOTH−URBN and AERO−NOUA. (c,d) Same as (a,b), but for the vertical distribution of the NDJ-mean difference in (c) convective cloud fraction (in %) and (d) in-cloud ice content fraction (in %) along 35° N. The stippling indicates the difference is statistically significant at the 90% confidence level based on the MC test.
4. Summary and Discussions
This study examines the modulation of atmospheric responses to anthropogenic aerosols (AAs) over East Asia by the urban cover during boreal winter (November–December–January here) and the possible physical processes. Toward this goal, we performed and analyzed a set of CAM5 experiments to compare the climatic effects of AAs simulated with and without the presence of urban cover. These experiments include a run with neither AAs nor urban forcings (NOUA), a run with the AAs forcing only (AERO), a run with the urban forcing only (URBN), and a run with both AAs and urban forcings (BOTH) prescribed in eastern China. Accordingly, the AERO-minus-NOUA differences donate the AAs’ effect without urban cover in the model, while the BOTH-minus-URBN differences donate the effect with the inclusion of urban cover; and their differences define the modulation role of urban cover.
When AA emissions were increased from the year 1850 level to the year 2000 level in the model, the winter AA column burden was significantly increased over East Asia, including sulfate, black carbon and primary organic matters. The AAs forcing reduces the cloud amount over the North China Plain but increases it in southern China, mainly through altering the vertical motion and relative humidity. Such changes in the AA concentrations and the resulting cloud fractions lead to a warmer surface in northern China while a colder surface in the south (and higher latitudes) through the aerosol–radiation–cloud interaction. In this case, the major components of the East Asian winter climate system are strengthened by the increasing AAs burden, such as the intensified Aleutian low at the surface, the deepened East Asian trough (EAT) in the middle troposphere, and the accelerated (and slightly northward shifted) East Asian westerly jet-stream (EAWJ) at the upper level. In addition, the winter precipitation is suppressed over the North China Plain by the AA-induced anomalous subsidence (and also the resulting cloud reduction), and the higher AA burden increases the cloud liquid water path (LWP) by ~25 g/m2 in southern China.
It was found that the urban cover alone can warm the surface over northern China and thus weaken the prevailing northwesterly wind at the lower level via reducing the land–sea thermal contrast, and the sub-grid updraft in the lower troposphere was also enhanced in this area. In addition, stronger anticyclonic circulation anomaly appears in the mid-upper troposphere to the south of Japan, which is characterized by southeasterly (southwesterly or westerly) wind anomalies covering southern China (from the Korean Peninsula to southern Japan). Therefore, when the urban cover was presented in the model, such urban-induced circulation changes would lead to more aerosols (mainly sulfate aerosols) accumulated in central eastern China, which can be even lifted up into mid-upper troposphere and then diffused downstream to the adjacent North Pacific, despite a relatively smaller magnitudes of these aerosol changes; and these urban-related changes can also precondition for the cloud initiation and development. This suggests a crucial role of urban cover in redistributing the aerosol burden. As a result, the cloud fraction and precipitation are markedly increased (relative to the AERO−NOUA case) from northern China to southern Japan in association with changes in vertical motion, relative humidity, and cloud microphysical processes (e.g., LWP). The resulting reduction in surface net shortwave radiation decreases air temperature both at the surface and in the mid-lower troposphere over northern China. In particular, the increasing aerosols over the adjacent ocean in the west (which is exported by the urban forcing) act to enhance the convection precipitation there via their effect on convective clouds. Furthermore, tropospheric temperature is also decreased below 200 hPa around southern Japan due to the changed AA burden, which results in evident negative height (cyclonic) anomalies, thus causing a southward displacement of the EAT (and thus the EAWJ); meanwhile, these circulation changes may further maintain and enlarge the associated changes in surface fields. Overall, atmospheric responses to the urban-modulated aerosols act to largely offset or even reverse those to the AAs forcing simulated without the urban cover over East Asia, especially from northern China to southern Japan.
These significant differences between the AAs’ effects on the East Asian winter climate simulated with and without the presence of urban cover highlight the crucial role of other anthropogenic forcing factors in affecting or modulating AA-induced changes, which is likely through redistributing aerosol loading, as also noticed in our previous study [8] but for the CO2 forcing. Please note that these differences could also affect changes induced by the urban forcing only; for example, the urban-caused surface warming (Figure 4a) can be greatly cancelled by the modulated surface cooling (Figure 10c) due to the coexistence of both forcing factors. However, there still exists large uncertainties among models in simulating climate responses to the AAs forcing [64], making it difficult to reliably and realistically evaluate the responses modulated by the urban land-use change. In addition, the urban cover may behave differently on the modulation of the AAs’ effect in a stand-alone atmosphere model and a fully coupled model, considering the AAs-related ocean feedback effect [14,15]. Thus, further studies are still needed using multiple and fully coupled models.
Author Contributions
Conceptualization, J.D.; methodology, J.D. and L.Z.; formal analysis, J.D.; writing—original draft preparation, J.D.; writing—review and editing, L.Z., J.M. and D.C. All authors have read and agreed to the published version of the manuscript.
Funding
This work was jointly supported by the National Natural Science Foundation of China (Grant Nos. 41705054, 42005033, and 41805051), Startup Foundation for Introducing Talent of NUIST (Grant Nos. 2016r051 and 2017r057), and Priority Academic Program Development of Jiangsu Higher Education Institutions (PAPD).
Institutional Review Board Statement
Not applicable.
Informed Consent Statement
Not applicable.
Data Availability Statement
The ERA5 reanalysis dataset is publicly available and can be downloaded from https://cds.climate.copernicus.eu/cdsapp#!/search?type=dataset (accessed on 8 April 2021). The CAM5 model data used in this study are available from the authors upon requests.
Acknowledgments
The authors appreciate two anonymous reviewers’ comments and suggestions, which led to a much-improved manuscript. The model simulations in this study are conducted in the High-Performance Computing Center of NUIST.
Conflicts of Interest
The authors declare no conflict of interest.
References
- Giorgi, F.; Bi, X.; Qian, Y. Indirect vs. Direct Effects of Anthropogenic Sulfate on the Climate of East Asia as Simulated with a Regional Coupled Climate-chemistry/Aerosols Model. Clim. Chang. 2003, 58, 345–376. [Google Scholar] [CrossRef]
- Myhre, G. Consistency between Satellite-derived and Modeled Estimates of the Aerosol Effect. Science 2009, 325, 187–190. [Google Scholar] [CrossRef]
- Twomey, S. The Influence of Pollution on the Shortwave Albedo of Clouds. J. Atmos. Sci. 1977, 34, 1149–1152. [Google Scholar] [CrossRef]
- Albrecht, B. Aerosols, Cloud Microphysics, and Fractional Cloudiness. Science 1989, 245, 1227–1230. [Google Scholar] [CrossRef] [PubMed]
- Ming, Y.; Ramaswamy, V. A Model Investigation of Aerosol-induced Changes in Tropical Circulation. J. Clim. 2011, 24, 5125–5133. [Google Scholar] [CrossRef]
- Wang, H.; Xie, S.P.; Liu, Q. Comparison of Climate Response to Anthropogenic Aerosol vs. Greenhouse Gas Forcing: Distinct Patterns. J. Clim. 2016, 29, 5175–5188. [Google Scholar] [CrossRef]
- Shen, Z.; Ming, Y. The Influence of Aerosol Absorption on the Extratropical Circulation. J. Clim. 2018, 31, 5961–5975. [Google Scholar] [CrossRef]
- Deng, J.; Dai, A.; Xu, H. Nonlinear Climate Responses to Increasing CO2 and Anthropogenic Aerosols Simulated by CESM1. J. Clim. 2020, 33, 281–301. [Google Scholar] [CrossRef]
- Liu, Y.; Sun, J.; Yang, B. The Effects of Black Carbon and Sulphate Aerosols in China Regions on East Asia Monsoons. Tellus B 2009, 61, 642–656. [Google Scholar] [CrossRef]
- Jiang, Y.; Liu, X.; Yang, X.Q.; Wang, M. A Numerical Study of the Effect of Different Aerosol Types on East Asian Summer Clouds and Precipitation. Atmos. Res. 2013, 70, 51–63. [Google Scholar] [CrossRef]
- Ocko, I.B.; Ramaswamy, V.; Ming, Y. Contrasting Climate Responses to the Scattering and Absorbing Features of Anthropogenic Aerosol Forcings. J. Clim. 2014, 27, 5329–5345. [Google Scholar] [CrossRef]
- Kim, M.K.; Lau, W.K.M.; Chin, M.; Kim, K.M.; Sud, Y.C.; Walker, G.K. Atmospheric Teleconnection over Eurasia Induced by Aerosol Radiative Forcing during Boreal Spring. J. Clim. 2006, 19, 4700–4718. [Google Scholar] [CrossRef]
- Ming, Y.; Ramaswamy, V.; Chen, G. A Model Investigation of Aerosol Induced Changes in Boreal Winter Extratropical Circulation. J. Clim. 2011, 24, 6077–6091. [Google Scholar] [CrossRef]
- Ganguly, D.; Rasch, P.J.; Wang, H.L.; Yoon, J. Fast and Slow Responses of the South Asian Monsoon System to Anthropogenic Aerosols. Geophys. Res. Lett. 2012, 39, L18804. [Google Scholar] [CrossRef]
- Wang, H.; Xie, S.P.; Kosaka, Y.; Liu, Q.; Du, Y. Dynamics of Asian summer monsoon response to anthropogenic aerosol forcing. J. Clim. 2019, 32, 843–858. [Google Scholar] [CrossRef]
- Song, F.; Zhou, T.; Qian, Y. Responses of East Asian Summer Monsoon to Natural and Anthropogenic Forcings in the 17 Latest CMIP5 Models. Geophys. Res. Lett. 2014, 41, 596–603. [Google Scholar] [CrossRef]
- Kim, M.K.; Lau, W.K.M.; Kim, K.M.; Lee, W.S. A GCM Study of Effects of Radiative Forcing of Sulfate Aerosol on Large Scale Circulation and Rainfall in East Asia during Boreal Spring. Geophys. Res. Lett. 2007, 34, L24701. [Google Scholar] [CrossRef]
- Deng, J.; Xu, H.; Ma, H.; Jiang, Z. Numerical Study of the Effect of Anthropogenic Aerosols on Spring Persistent Rain over Eastern China. J. Meteorol. Res. 2014, 28, 341–353. [Google Scholar] [CrossRef]
- Miao, J.; Wang, T.; Wang, H.; Zhu, Y.; Sun, J. Interdecadal Weakening of the East Asian Winter Monsoon in the Mid-1980s: The Roles of External Forcings. J. Clim. 2018, 31, 8985–9000. [Google Scholar] [CrossRef]
- Hao, X.; He, S.; Wang, H.; Han, T. Quantifying the Contribution of Anthropogenic Influence to the East Asian Winter Monsoon in 1960–2012. Atmos. Chem. Phys. 2019, 19, 9903–9911. [Google Scholar] [CrossRef]
- Jiang, Y.; Yang, X.Q.; Liu, X.; Yang, D.; Sun, X.; Wang, M.; Ding, A.; Wang, T.; Fu, C. Anthropogenic Aerosol Effects on East Asian Winter Monsoon: The Role of Black Carbon-induced Tibetan Plateau Warming. J. Geophys. Res. Atmos. 2017, 122, 5883–5902. [Google Scholar] [CrossRef]
- Zhuang, B.L.; Li, S.; Wang, T.J.; Liu, J.; Chen, H.M.; Chen, P.L.; Li, M.M.; Xie, M. Interaction between the Black Carbon Aerosol Warming Effect and East Asian Monsoon Using RegCM4. J. Clim. 2018, 31, 9367–9388. [Google Scholar] [CrossRef]
- Liu, Z.; Ming, Y.; Wang, L.; Bollasina, M.; Luo, M.; Lau, N.C.; Yim, S.H.L. A Model Investigation of Aerosol-induced Changes in the East Asian Winter Monsoon. Geophys. Res. Lett. 2019, 46, 10186–10195. [Google Scholar] [CrossRef]
- Lou, S.; Yang, Y.; Wang, H.; Smith, S.J.; Qian, Y.; Rasch, P.J. Black Carbon Amplifies Haze over the North China Plain by Weakening the East Asian Winter Monsoon. Geophys. Res. Lett. 2019, 46, 452–460. [Google Scholar] [CrossRef]
- Kalnay, E.; Cai, M. Impact of Urbanization and Land-use Change on Climate. Nature 2003, 423, 528–531. [Google Scholar] [CrossRef]
- Ren, G.Y.; Zhou, Y.Q.; Chu, Z.Y.; Zhou, J.; Zhang, A.; Guo, J.; Liu, X. Urbanization Effects on Observed Surface Air Temperature Trends in North China. J. Clim. 2008, 21, 1333–1348. [Google Scholar] [CrossRef]
- Yang, X.C.; Hou, Y.L.; Chen, B.D. Observed Surface Warming Induced by Urbanization in East China. J. Geophys. Res. 2011, 116, D14113. [Google Scholar] [CrossRef]
- Chen, H.S.; Zhang, Y. Sensitivity Experiments of Impacts of Large-scale Urbanization in East China on East Asian Winter Monsoon. Chin. Sci. Bull. 2013, 58, 809–815. [Google Scholar] [CrossRef]
- Shao, H.; Song, J.; Ma, H. Sensitivity of the East Asian Summer Monsoon Circulation and Precipitation to an Idealized Large-scale Urban Expansion. J. Meteorol. Soc. Jpn. 2013, 91, 163–177. [Google Scholar] [CrossRef]
- Deng, J.; Xu, H. Atmospheric Responses to Idealized Urban Land Surface Forcing in Eastern China during the Boreal Spring. J. Geophys. Res. Atmos. 2015, 120, 10022–10039. [Google Scholar] [CrossRef]
- Ma, H.; Jiang, Z.; Song, J.; Dai, A.; Yang, X.; Fei, H. Effects of Urban Land-use Change in East China on the East Asian Summer Monsoon Based on the CAM5.1 Model. Clim. Dyn. 2016, 46, 2977–2989. [Google Scholar] [CrossRef]
- Chen, H.S.; Zhang, Y.; Yu, M.; Hua, W.; Sun, S.; Li, X.; Gao, C. Large-scale Urbanization Effects on Eastern Asian Summer Monsoon Circulation and Climate. Clim. Dyn. 2016, 47, 117–136. [Google Scholar] [CrossRef]
- Kar, S.K.; Liou, Y.-A. Influence of Land Use and Land Cover Change on the Formation of Local Lightning. Remote Sens. 2019, 11, 407. [Google Scholar] [CrossRef]
- Zhong, S.; Qian, Y.; Zhao, C.; Leung, R.; Yang, X.Q. A Case Study of Urbanization Impact on Summer Precipitation in the Greater Beijing Metropolitan Area: Urban Heat Island vs. Aerosol Effects. J. Geophys. Res. Atmos. 2015, 120, 10903–10914. [Google Scholar] [CrossRef]
- Zhong, S.; Qian, Y.; Zhao, C.; Leung, R.; Wang, H.; Yang, B.; Fan, J.; Yan, H.; Yang, X.Q. Urbanization-induced Urban Heat Island and Aerosol Effects on Climate Extremes in the Yangtze River Delta Region of China. Atmos. Chem. Phys. 2017, 17, 5439–5457. [Google Scholar] [CrossRef]
- Sarangi, C.; Tripathi, S.N.; Qian, Y.; Kumar, S.; Leung, L.R. Aerosol and Urban Land Use Effect on Rainfall Around Cities in Indo-Gangetic Basin from Observations and Cloud Resolving Model Simulations. J. Geophys. Res. Atmos. 2018, 123, 3645–3667. [Google Scholar] [CrossRef]
- Fan, J.; Zhang, Y.; Li, Z.; Hu, J.; Rosenfeld, D. Urbanization-induced Land and Aerosol Impacts on Sea-breeze Circulation and Convective Precipitation. Atmos. Chem. Phys. 2020, 20, 14163–14182. [Google Scholar] [CrossRef]
- Jiang, Z.; Huo, F.; Ma, H.; Song, J.; Dai, A. Impact of Chinese Urbanization and Aerosol Emissions on the East Asian Summer Monsoon. J. Clim. 2017, 30, 1019–1039. [Google Scholar] [CrossRef]
- Deng, J.; Xu, H. Nonlinear Effect on the East Asian Summer Monsoon Due to Two Coexisting Anthropogenic Forcing Factors in Eastern China: An AGCM Study. Clim. Dyn. 2016, 46, 3767–3784. [Google Scholar] [CrossRef]
- Deng, J.; Xu, H.; Zhang, L. Nonlinear Effects of Anthropogenic Aerosol and Urban Land Surface Forcing on Spring Climate in Eastern China. J. Geophys. Res. Atmos. 2016, 121, 4581–4599. [Google Scholar] [CrossRef][Green Version]
- Neale, R.B.; Chen, C.-C.; Gettelman, A.; Lauritzen, P.H.; Park, S.; Williamson, D.L.; Conley, A.J.; Garcia, R.; Kinnison, D.; Lamarque, J.-F.; et al. Description of the NCAR Community Atmosphere Model (CAM5.0). NCAR Tech. Note NCAR/TN-4861STR; National Center for Atmospheric Research: Boulder, CL, USA, 2012; p. 274. [Google Scholar]
- Oleson, K.W.; Niu, G.Y.; Yang, Z.L.; Lawrence, D.M.; Thornton, P.E.; Lawrence, P.J.; Stöckli, R.; Dickinson, R.E.; Bonan, G.B.; Levis, S.; et al. Improvements to the Community Land Model and Their Impact on the Hydrological Cycle. J. Geophys. Res. 2008, 113, G01021. [Google Scholar] [CrossRef]
- Hurrell, J.W.; Holland, M.M.; Gent, P.R.; Ghan, S.; Kay, J.E.; Kushner, P.J.; Lamarque, J.-F.; Large, W.G.; Lawrence, D.; Lindsay, K.; et al. The Community Earth System Model: A Framework for Collaborative Research. Bull. Amer. Meteor. Soc. 2013, 94, 1339–1360. [Google Scholar] [CrossRef]
- Liu, X.; Easter, R.C.; Ghan, S.J.; Zaveri, R.; Rasch, P.; Shi, X.; Lamarque, J.-F.; Gettelman, A.; Morrison, H.; Vitt, F.; et al. Toward a Minimal Representation of Aerosols in Climate Models: Description and Evaluation in the Community Atmosphere Model CAM5. Geosci. Model Dev. 2012, 5, 709–739. [Google Scholar] [CrossRef]
- Gettelman, A.; Liu, X.; Ghan, S.J.; Morrison, H.; Park, S.; Conley, A.J.; Klein, S.A.; Boyle, J.; Mitchell, D.L.; Li, J.-L.F.; et al. Global Simulations of Ice Nucleation and Ice Supersaturation with an Improved Cloud Scheme in the Community Atmosphere Model. J. Geophys. Res. 2010, 115, D18216. [Google Scholar] [CrossRef]
- Abdul-Razzak, H.; Ghan, S.J. A Parameterization of Aerosol Activation: 2. Multiple Aerosol Types. J. Geophys. Res. 2000, 105, 6837–6844. [Google Scholar] [CrossRef]
- Liu, X.; Penner, J.E.; Ghan, S.J.; Wang, M. Inclusion of Ice Microphysics in the NCAR Community Atmosphere Model Version 3 (CAM3). J. Clim. 2007, 20, 4526–4547. [Google Scholar] [CrossRef]
- Lamarque, J.F.; Bond, T.C.; Eyring, V.; Granier, C.; Heil, A.; Klimont, Z.; Lee, D.; Liousse, C.; Mieville, A.; Owen, B.; et al. Historical (1850–2000) Gridded Anthropogenic and Biomass Burning Emissions of Reactive Gases and Aerosols: Methodology and Application. Atmos. Chem. Phys. 2010, 10, 7017–7039. [Google Scholar] [CrossRef]
- Dobson, J.E.; Bright, E.A.; Coleman, P.R.; Durfee, R.C.; Worley, B.A. LandScan: A Global Population Database for Estimating Populations at Risk. Photogramm. Eng. Remote Sens. 2000, 66, 849–857. [Google Scholar]
- Jackson, T.L.; Feddema, J.J.; Oleson, K.W.; Bonan, G.B.; Bauer, J.T. Parameterization of Urban Characteristics for Global Climate Modeling. Ann. Assoc. Am. Geogr. 2010, 100, 848–865. [Google Scholar] [CrossRef]
- Hersbach, H.; Bell, B.; Berrisford, P.; Hirahara, S.; Horányi, A.; Muñoz-Sabater, J.; Nicolas, J.; Peubey, C.; Radu, R.; Schepers, D.; et al. The ERA5 Global Reanalysis. Quart. J. Roy. Meteor. Soc. 2020, 146, 1999–2049. [Google Scholar] [CrossRef]
- Diner, D.J.; Beckert, J.C.; Reilly, T.H.; Bruegge, C.J.; Conel, J.E.; Kahn, R.A.; Martonchik, J.V.; Ackerman, T.P.; Davies, R.; Gerstl, S.A.W.; et al. Multi-angle Imaging Spectroradiometer (MISR) Instrument Description and Experiment Overview. IEEE Trans. Geosci. Remote Sens. 1998, 36, 1072–1087. [Google Scholar] [CrossRef]
- Jiang, Y.; Yang, X.Q.; Liu, X. Seasonality in Anthropogenic Aerosol Effects on East Asian Climate Simulated with CAM5. J. Geophys. Res. Atmos. 2015, 120, 10837–10861. [Google Scholar] [CrossRef]
- Brown, H.; Liu, X.; Feng, Y.; Jiang, Y.; Wu, M.; Lu, Z.; Wu, C.; Murphy, S.; Pokhrel, R. Radiative Effect and Climate Impacts of Brown Carbon with the Community Atmosphere Model (CAM5). Atmos. Chem. Phys. 2018, 18, 17745–17768. [Google Scholar] [CrossRef]
- Brown, H.; Liu, X.; Pokhrel, R.; Murphy, S.; Lu, Z.; Saleh, R.; Mielonen, T.; Kokkola, H.; Bergman, T.; Myhre, G.; et al. Biomass Burning Aerosols in Most Climate Models are too Absorbing. Nat. Commun. 2021, 12, 277. [Google Scholar] [CrossRef]
- Malavelle, F.F.; Haywood, J.M.; Field, P.R.; Hill, A.A.; Abel, S.J.; Lock, A.P.; Shipway, B.J.; McBeath, K. A Method to Represent Subgrid-scale Updraft Velocity in Kilometer-scale Models: Implication for Aerosol Activation. J. Geophys. Res. Atmos. 2014, 119, 4149–4173. [Google Scholar] [CrossRef]
- Li, Y.; Gu, H. Relationship between Middle Stratiform Clouds and Large-scale Circulation over Eastern China. Geophys. Res. Lett. 2006, 33, L09706. [Google Scholar] [CrossRef]
- Chen, Y.C.; Christensen, M.W.; Stephens, G.L.; Seinfeld, J.H. Satellite-based Estimate of Global Aerosol–cloud Radiative Forcing by Marine Warm Clouds. Nat. Geosci. 2014, 7, 643–646. [Google Scholar] [CrossRef]
- Gryspeerdt, E.; Goren, T.; Sourdeval, O.; Quaas, J.; Mülmenstädt, J.; Dipu, S.; Unglaub, C.; Gettelman, A.; Christensen, M. Constraining the Aerosol Influence on Cloud Liquid Water Path. Atmos. Chem. Phys. 2019, 19, 5331–5347. [Google Scholar] [CrossRef]
- Wang, Q.; Wang, Z.; Zhang, H. Impact of Anthropogenic Aerosols from Global, East Asian, and Non-East Asian Sources on East Asian Summer Monsoon System. Atmos. Res. 2017, 183, 224–236. [Google Scholar] [CrossRef]
- Wang, L.; Chen, W.; Zhou, W.; Huang, R. Interannual Variations of East Asian trough Axis at 500 hPa and Its Association with the East Asian Winter Monsoon Pathway. J. Clim. 2009, 22, 600–614. [Google Scholar] [CrossRef]
- Zhang, R.; Li, G.; Fan, J.; Wu, D.L.; Molina, M.J. Intensification of Pacific Storm Track Linked to Asian Pollution. Proc. Natl. Acad. Sci. USA 2007, 104, 5295–5299. [Google Scholar] [CrossRef] [PubMed]
- Wang, Y.; Wang, M.; Zhang, R.; Ghan, S.J.; Lin, Y.; Hu, J.; Pan, B.; Levy, M.; Jiang, J.H.; Molina, M. Assessing the Effects of Anthropogenic Aerosols on Pacific Storm Track Using a Multiscale Global Climate Model. Proc. Natl. Acad. Sci. USA 2014, 111, 6894–6899. [Google Scholar] [CrossRef] [PubMed]
- Myhre, G.; Shindell, D.; Bréon, F.M. Anthropogenic and Natural Radiative Forcing. In Climate Change 2013: The Physical Science Basis; Stocker, T.F., Ed.; Cambridge University Press: Cambridge, UK, 2014; pp. 659–740. [Google Scholar]


Publisher’s Note: MDPI stays neutral with regard to jurisdictional claims in published maps and institutional affiliations. |
© 2021 by the authors. Licensee MDPI, Basel, Switzerland. This article is an open access article distributed under the terms and conditions of the Creative Commons Attribution (CC BY) license (https://creativecommons.org/licenses/by/4.0/).