
Unregulated Emissions from Natural Gas Taxi Based on IVE Model

Abstract
1. Introduction
2. Materials and Methods
2.1. Data Collection and Test Methods
2.2. Taxi IVE Model Calculation Method
- ν is the instantaneous velocity (m/s);
- a is acceleration (m/s2);
- ;
- h is altitude (m).
2.3. VMAS Experiments
3. Results and Discussion
3.1. Driving Condition and VSP Distribution
3.2. Correction of the Vehicle Emission Factor
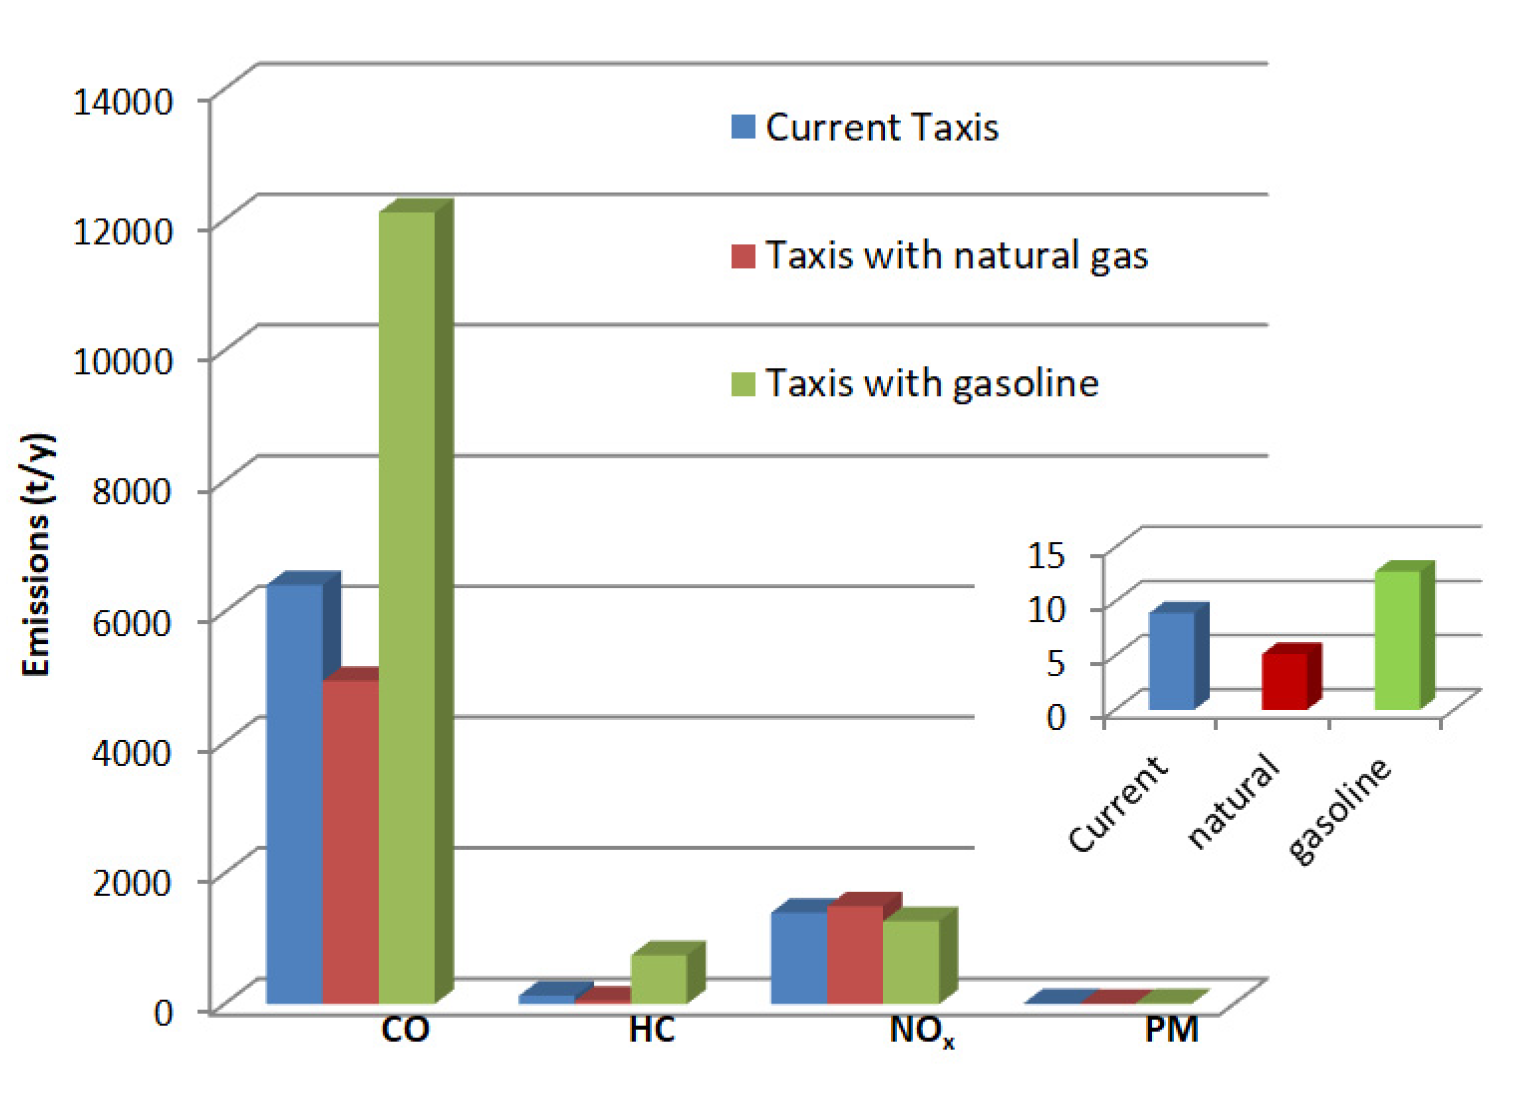
3.3. Regulated Emission Characteristics of Taxis with Different Fuels
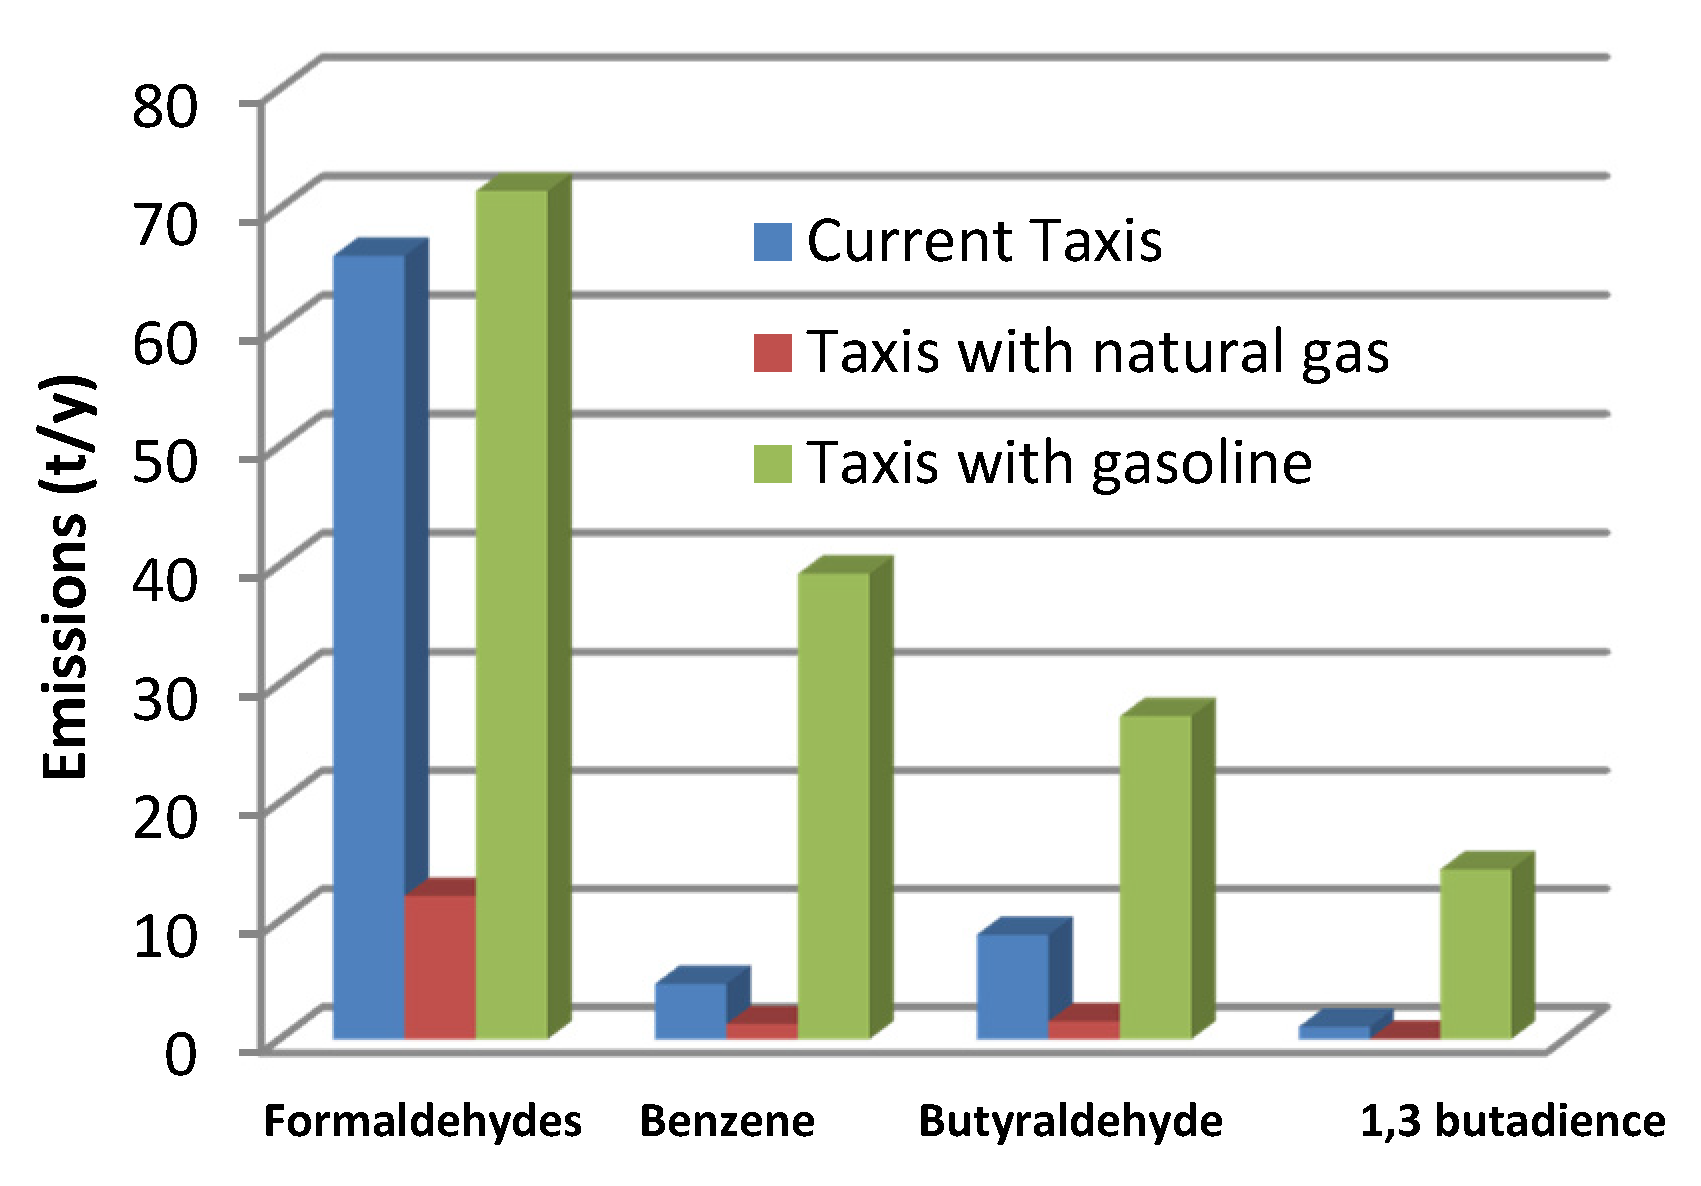
3.4. Unregulated Emission Characteristics of Taxis with Different Fuels
4. Conclusions
Author Contributions
Funding
Institutional Review Board Statement
Informed Consent Statement
Data Availability Statement
Conflicts of Interest
References
- Beer, T.; Carras, J.; Worth, D.; Coplin, N.; Campbell, P.K.; Jalaludin, B.; Angove, D.; Azzi, M.; Brown, S.; Campbell, I.; et al. The Health Impacts of Ethanol Blend Petrol. Energies 2011, 4, 352–367. [Google Scholar] [CrossRef]
- Crosignani, P.; Nanni, A.; Pepe, N.; Pozzi, C.; Silibello, C.; Poggio, A.; Conte, M. The Effect of Non-Compliance of Diesel Vehicle Emissions with Euro Limits on Mortality in the City of Milan. Atmosphere 2021, 12, 342. [Google Scholar] [CrossRef]
- Luo, M.; Ji, Y.; Ren, Y.; Gao, F.; Zhang, H.; Zhang, L.; Yu, Y.; Li, H. Characteristics and Health Risk Assessment of PM2.5-Bound PAHs during Heavy Air Pollution Episodes in Winter in Urban Area of Beijing, China. Atmosphere 2021, 12, 323. [Google Scholar] [CrossRef]
- Shigeta, N.; Hosseini, S.E. Sustainable Development of the Automobile Industry in the United States, Europe, and Japan with Special Focus on the Vehicles’ Power Sources. Energies 2021, 14, 78. [Google Scholar] [CrossRef]
- Dias, D.; Antunes, A.P.; Tchepel, O. Modelling of Emissions and Energy Use from Biofuel Fuelled Vehicles at Urban Scale. Sustainability 2019, 11, 2902. [Google Scholar] [CrossRef]
- Ouyang, M.G.; Zhang, W.L.; Wang, E.H.; Yang, F.Y.; Li, J.Q.; Li, Z.Y.; Yu, P.; Ye, X. Performance analysis of a novel coaxial power-split hybrid powertrain using a CNG engine and supercapacitors. Appl. Energy 2015, 157, 595–606. [Google Scholar] [CrossRef]
- Li, L.G.; Gong, Y.C.; Deng, J.; Gong, X.H. CO2 Reduction Request and Future High-Efficiency Zero-Emission Argon Power Cycle Engine. Automot. Innov. 2018, 1, 43–53. [Google Scholar] [CrossRef]
- Huang, Y.H.; Yu, Y.; Yam, Y.S.; Zhou, J.L.; Lei, C.W.; Organ, B.; Zhuang, Y.; Mok, W.C.; Chan, E.F.C. Statistical evaluation of on-road vehicle emissions measurement using a dual remote sensing technique. Environ. Pollut. 2020, 267, 115456. [Google Scholar] [CrossRef]
- Shan, X.; Chen, X.; Jia, W.; Ye, J. Evaluating Urban Bus Emission Characteristics Based on Localized MOVES Using Sparse GPS Data in Shanghai, China. Sustainability 2019, 11, 2936. [Google Scholar] [CrossRef]
- Liu, H.; Barth, M. Identifying the effect of vehicle operating history on vehicle running emissions. Atomos. Atmos. Environ. 2012, 59, 22–29. [Google Scholar] [CrossRef]
- Zhang, W.B.; Qi, Y.; Yan, Y.; Tang, J.J.; Wang, Y.H. A method of emission and traveller behavior analysis under multimodal traffic condition. Transp. Res. Part. D 2017, 52, 139–155. [Google Scholar] [CrossRef]
- Guo, D.; Wang, Z.G.; Sun, L.; Li, K.; Wang, J.; Sun, F.; Zhang, H. Study on Gasoline Vehicle Emission Inventory Considering Regional Differences in China. J. Adv. Transp. 2018, 2018, 7497354. [Google Scholar] [CrossRef]
- Yang, W.; Yu, C.Y.; Yuan, W. High-resolution vehicle emission inventory and emission control policy scenario analysis, a case in the Beijing-Tianjin-Hebei (BTH) region. China. J. Clean. Prod. 2018, 203, 530–539. [Google Scholar] [CrossRef]
- Bruce, O.; Huang, Y.H.; Zhou, J.L.; Surawski, N.C.; Yam, Y.S.; Mok, W.C.; Hong, G. A remote sensing emissions monitoring programme reduces emissions of gasoline and LPG vehicles. Environ. Res. 2019, 177, 108614. [Google Scholar]
- Huang, Y.H.; Surawski, N.; Yam, Y.S. Re-evaluating effectiveness of vehicle emission control programmes targeting high-emitters. Nat. Sustain. 2020, 3, 904–907. [Google Scholar] [CrossRef]
- Al-Arkawazi, S.A.F. The gasoline fuel quality impact on fuel consumption, air-fuel ratio (AFR), lambda (lambda) and exhaust emissions of gasoline-fueled vehicles. Cogent Eng. 2019, 6, 1616866. [Google Scholar] [CrossRef]
- Al-Rawi, Y.A.; Imlus, M.H.; Yusup, Y.; Yahya, S.B. Factors affecting vehicle exhaust emissions, driver motivations as a mediator. Environ. Econ. Policy Stud. 2020, 23, 361–407. [Google Scholar] [CrossRef]
- Giechaskiel, B.; Casadei, S.; Mazzini, M.; Sammarco, M.; Montabone, G.; Tonelli, R.; Deana, M.; Costi, G.; Tanno, F.D.; Prati, M.V. Inter-Laboratory Correlation Exercise with Portable Emissions Measurement Systems (PEMS) on Chassis Dynamometers. Appl. Sci. 2018, 8, 2275. [Google Scholar] [CrossRef]
- Huang, Y.; Mok, W.C.; Yam, Y.S.; Zhou, J.L.; Surawski, N.C.; Organ, B.; Chan, E.F.C.; Mofijur, M.; Mahlia, T.M.I.; Ong, H.C. Evaluating in-use vehicle emissions using air quality monitoring stations and on-road remote sensing systems. Sci. Total Environ. 2020, 740, 139868. [Google Scholar] [CrossRef]
- Yao, Z.L.; Cao, X.Y.; Shen, X.B.; Zhang, Y.Z.; Wang, X.T.; He, K.B. On-road emission characteristics of CNG-fueled bi-fuel taxis. Atmos. Environ. 2014, 94, 198–204. [Google Scholar] [CrossRef]
- Yue, T.T.; Chai, F.H.; Hu, J.N.; Jia, M.; Bao, X.F.; Li, Z.H.; He, L.Q.; Zu, L. Gaseous emissions from compressed natural gas buses in urban road and highway tests in China. J. Environ. Sci. 2016, 48, 193–199. [Google Scholar] [CrossRef] [PubMed]
- Huang, X.Y.; Wang, Y.; Xing, Z.Y.; Du, K. Emission factors of air pollutants from CNG-gasoline bi-fuel vehicles: Part II. CO, HC and NOx. Sci. Total Environ. 2016, 565, 698–705. [Google Scholar] [CrossRef] [PubMed]
- Wang, Y.; Xing, Z.Y.; Xu, H.; Du, K. Emission factors of air pollutants from CNG-gasoline bi-fuel vehicles: Part I. Black carbon. Sci. Total Environ. 2016, 572, 1161–1165. [Google Scholar] [CrossRef]
- Liu, J.; Dong, J.J.; Shi, X.P.; Wang, H.Z.; Yang, H.M. Research for NOx Emission of Nanjing Vehicle Based on IVE Model. Arch. Build. Mater. 2011, 99–100, 1341. [Google Scholar]
- Bruce, O.; Huang, Y.H.; Zhou, J.L.; Yam, Y.S.; Mok, W.C.; Chan, E.F.C. Simulation of engine faults and their impact on emissions and vehicle performance for a liquefied petroleum gas taxi. Sci. Total. Environ. 2020, 716, 137066. [Google Scholar]
- Apt, J.; Peterson, S.B.; Whitacre, J.F. Battery Vehicles Reduce CO2 Emissions. Science 2011, 33, 823. [Google Scholar] [CrossRef]
- Choi, K.; Zhang, M. The net effects of the built environment on household vehicle emissions: A case study of Austin, TX. Transp. Res. Part. D-Transp. Environ. 2017, 50, 254–268. [Google Scholar] [CrossRef]
- Nesamani, K.S. Estimation of automobile emissions and control strategies in India. Sci. Total Environ. 2010, 408, 1800–1811. [Google Scholar] [CrossRef] [PubMed]
- Cao, X.Y.; Yao, Z.L.; Shen, X.B.; Ye, Y.; Jiang, X. On-road emission characteristics of VOCs from light-duty gasoline vehicles in Beijing, China. Atmos. Environ. 2016, 124, 146–155. [Google Scholar] [CrossRef]
- Idris, N.; Sukri, S.; Saadon, I.M. Development of volatile organic compounds (VOC) removal filter for transport air-conditioner and VOC removal test. Proc. Mech. Eng. Res. Day 2018, 2018, 38–39. [Google Scholar]
- Buss, W.; Masek, O. High-VOC biochar-effectiveness of post-treatment measures and potential health risks related to handling and storage. Environ. Sci. Pollut. Res. 2016, 23, 19580–19589. [Google Scholar] [CrossRef]
- Fontaras, G.; Martini, G.; Manfred, U.; Marotta, A.; Krasenbrink, A.; Maffioletti, F.; Terenghi, R.; Colombo, M. Assessment of on-road emissions of four Euro V diesel and CNG waste collection trucks for supporting air-quality improvement initiatives in the city of Milan. Sci. Total Environ. 2012, 426, 65–72. [Google Scholar] [CrossRef] [PubMed]
- Wang, H.Y.; Huang, C.; Hu, Q.Y. Correlations of Light-duty Gasoline Vehicle Emissions Based on VMAS and CVS Measurement Systems. Huanjing Kexue 2017, 38, 2294–2300. [Google Scholar]
- Zhang, X.; Liu, F.J.; Cai, F.T.; Dong, G.L.; Liu, J.X. Research on Influencing Factors on Errors of Vehicle Fuel Consumption Measured by Carbon Balance Method Based on Vmas. Gonglu Jiaotong Keji. 2010, 27, 138–142. [Google Scholar] [CrossRef]
- Liu, P.; Li, R.X. Speed Signal Processing of VMAS (Vehicle Mass Analysis System) Based on Adaptive Kalman Filter. Mech. Sci. Technol. 2011, 30, 1850–1854. [Google Scholar]
- Wang, M.L.; Jin, B.Q.; Li, S.Y. Study on Emission Limits under VMAS for In-use Vehicles in Zhengzhou. Environ. Sci. Technol. 2019, 42, 214–220. [Google Scholar]
- Zamboni, G.; André, M.; Roveda, A.; Capobianco, M. Experimental evaluation of Heavy Duty Vehicle speed patterns in urban and port areas and estimation of their fuel consumption and exhaust emissions. Transp. Res. Part. D 2015, 35, 1–10. [Google Scholar] [CrossRef]
- Zhao, Q.; Chen, Q.; Song, G.H. Comparative Study of VSP Binning Methods for Estimating Fuel consumptions of LDVs on Urban Roads. ESAT 2018 2019, 2066, 20059. [Google Scholar]
- Zhang, H.L.; Wu, W.; Wang, C. Model Established on Exhaust Emissions of Vehicle Based on Speed and Vehicle Specific Power. ECAR 2018 2018, 307, 756–767. [Google Scholar]
- Song, G.H.; Yu, L.; Wu, Y.Z. Development of Speed Correction Factors Based on Speed-Specific Distributions of Vehicle Specific Power for Urban Restricted-Access Roadways. Transp. Eng. J. ASCE 2016, 142, 04016. [Google Scholar] [CrossRef]
- Lents, J.; Davis, N. IVE Model Users Manual; ISSRC—2004. Available online: http://www.issrc.org/ive/downloads/manuals/UsersManual.pdf (accessed on 8 April 2021).


| No. | Model Year | Engine Size (L) | Temperature (℃) | Atmospheric Pressure (kPa) | Relative Humidity (%) | CO (g/km) | HC (g/km) | NOX (g/km) |
|---|---|---|---|---|---|---|---|---|
| #01 | 2008 | 1.6 | 11.7 | 99.5 | 10.1 | 0.3 | 1.60 | 0.90 |
| #02 | 2008 | 1.6 | 5 | 100.1 | 56.9 | 0.01 | 0.10 | 0.06 |
| #03 | 2008 | 1.6 | 9.3 | 99.9 | 50.7 | 0.82 | 1.04 | 0.59 |
| #04 | 2008 | 1.6 | 10.1 | 99.6 | 20.3 | 0.32 | 0.04 | 0.02 |
| #05 | 2008 | 1.8 | 7.2 | 99.7 | 22.5 | 4.34 | 0.71 | 0.40 |
| #06 | 2008 | 1.8 | 9.3 | 100.1 | 28.7 | 1.67 | 0.81 | 0.46 |
| #07 | 2008 | 1.6 | 5.4 | 100.8 | 30.9 | 0.22 | 1.11 | 0.62 |
| #08 | 2008 | 1.8 | 6.2 | 100.8 | 31.9 | 0.17 | 1.11 | 0.62 |
| #09 | 2008 | 1.6 | 7 | 100.8 | 30.5 | 0.77 | 1.32 | 0.75 |
| #10 | 2008 | 1.8 | 6.8 | 100.9 | 29.7 | 0.77 | 0.70 | 0.39 |
| #11 | 2008 | 1.8 | 6.5 | 100.9 | 30.4 | 2.49 | 0.58 | 0.33 |
| #12 | 2009 | 1.8 | 11.7 | 99.4 | 9.3 | 5.09 | 0.86 | 0.48 |
| #13 | 2009 | 1.8 | 5.2 | 100.5 | 52.5 | 0.16 | 0.01 | 0.01 |
| #14 | 2009 | 1.8 | 9.1 | 100.1 | 29.7 | 0.59 | 0.69 | 0.39 |
| #15 | 2009 | 1.8 | 5.9 | 100.8 | 31.7 | 0.26 | 1.05 | 0.59 |
| #16 | 2009 | 1.6 | 9.4 | 100.1 | 28.9 | 0.11 | 0.56 | 0.31 |
| #17 | 2009 | 1.8 | 6.6 | 100.8 | 29.2 | 5.56 | 1.20 | 0.68 |
| #18 | 2009 | 1.8 | 13.4 | 99.1 | 13.2 | 0.35 | 0.03 | 0.01 |
| #19 | 2009 | 1.8 | 7.1 | 100.8 | 31.7 | 2.67 | 1.46 | 0.82 |
| #20 | 2009 | 1.8 | 4.6 | 100.1 | 56.5 | 0.25 | 0.08 | 0.05 |
| #21 | 2009 | 1.8 | 6.3 | 100.8 | 32.1 | 8.21 | 0.83 | 0.47 |
| #22 | 2009 | 1.8 | 7.7 | 99.9 | 50.2 | 0.46 | 0.04 | 0.03 |
| #23 | 2009 | 1.8 | 8 | 100.7 | 21.1 | 0.61 | 0.04 | 0.03 |
| #24 | 2009 | 1.8 | 13.6 | 99.1 | 11.3 | 0.58 | 0.06 | 0.03 |
| #25 | 2009 | 1.6 | 6.6 | 100.9 | 29.7 | 1.81 | 1.74 | 0.98 |
| #26 | 2009 | 1.6 | 6.6 | 100.9 | 29.7 | 1.81 | 1.90 | 1.07 |
| #27 | 2010 | 1.8 | 13.1 | 100 | 34.5 | 2.47 | 0.88 | 0.49 |
| #28 | 2010 | 1.8 | 7.4 | 100 | 54.3 | 2.83 | 1.04 | 0.58 |
| #29 | 2010 | 1.8 | 7.4 | 100 | 54.3 | 2.83 | 1.04 | 0.58 |
| #30 | 2011 | 1.8 | 0.3 | 101.1 | 33.4 | 1.93 | 0.22 | 0.12 |
| #31 | 2011 | 1.8 | 0.1 | 101.2 | 34.6 | 0.35 | 0.05 | 0.03 |
| #32 | 2011 | 1.8 | −0.5 | 101.1 | 34.5 | 6.95 | 0.90 | 0.51 |
| #33 | 2011 | 1.8 | 0.3 | 101.1 | 33.4 | 1.93 | 0.22 | 0.12 |
| #34 | 2011 | 1.8 | −1.1 | 101.1 | 34.6 | 7.07 | 0.91 | 0.51 |
| #35 | 2011 | 1.8 | −0.9 | 101.2 | 34.4 | 11.32 | 9.84 | 5.54 |
| #36 | 2011 | 1.8 | 1.5 | 101.1 | 33.5 | 5.25 | 1.49 | 0.84 |
| #37 | 2011 | 1.8 | 6.5 | 100.9 | 31.5 | 8.16 | 2.15 | 1.21 |
| #38 | 2011 | 1.8 | 11.5 | 100.1 | 20.1 | 1.36 | 0.46 | 0.26 |
| #39 | 2012 | 1.6 | 6.8 | 99.1 | 21.5 | 8.02 | 1.40 | 0.78 |
| #40 | 2012 | 1.6 | 10.4 | 99.9 | 17.4 | 5.83 | 1.10 | 0.62 |
| #41 | 2012 | 1.6 | 6.8 | 99.1 | 21.5 | 8.02 | 1.40 | 0.78 |
| #42 | 2012 | 1.6 | 10.4 | 99.9 | 17.4 | 5.83 | 1.10 | 0.62 |
| #43 | 2012 | 1.6 | 2.5 | 99.2 | 21.6 | 2.16 | 0.34 | 0.19 |
| #44 | 2012 | 1.8 | −0.5 | 101.1 | 38.7 | 8.87 | 0.92 | 0.52 |
| #45 | 2013 | 1.8 | 6.5 | 101.1 | 38.7 | 1.62 | 0.84 | 0.47 |
| #46 | 2013 | 1.8 | 6.8 | 99.1 | 21.5 | 2.08 | 0.74 | 0.41 |
| #47 | 2013 | 1.8 | 6.8 | 99.1 | 21.5 | 2.53 | 0.41 | 0.23 |
| #48 | 2013 | 1.8 | 6.5 | 100.9 | 31.5 | 1.02 | 0.56 | 0.31 |
| #49 | 2013 | 1.8 | 5.2 | 100.5 | 52.5 | 1.93 | 0.77 | 0.43 |
| #50 | 2013 | 1.8 | 5.2 | 100.5 | 52.5 | 2.31 | 0.88 | 0.50 |
| v/km/h | Morning Peak (%) | Off Peak (%) | Evening Peak (%) |
|---|---|---|---|
| 0 < v ≤ 10 | 26.4 | 13.1 | 27.6 |
| 10 < v ≤20 | 34.8 | 28.2 | 40.1 |
| 20 < v ≤30 | 20.4 | 25.5 | 27.3 |
| 30 < v ≤40 | 15.1 | 14.1 | 5 |
| 40 < v ≤50 | 3.3 | 18.1 | 0 |
| 50 < v ≤60 | 0 | 1 | 0 |
| idle ratio | 54.1 | 49.4 | 66.1 |
| acceleration ratio | 19.4 | 22 | 15 |
| constant ratio | 6.7 | 7.1 | 4.2 |
| deceleration ratio | 19.8 | 21.5 | 14.7 |
| ES Low Load | ES Middle Load | ES High Load | |
|---|---|---|---|
| VSP range(kW/t) | [−1.6, 3.1) | [3.1, 7.8) | [7.8, 12.6) |
| [−80.0, −44.0) | 0.000 | 0.000 | 0.000 |
| [−44.0, −39.9) | 0.000 | 0.000 | 0.000 |
| [−39.9, −35.8) | 0.000 | 0.000 | 0.000 |
| [−35.8, −31.7) | 0.000 | 0.000 | 0.000 |
| [−31.7, −27.6) | 0.000 | 0.000 | 0.000 |
| [−27.6, −23.4) | 0.000 | 0.000 | 0.000 |
| [−23.4, −19.3) | 0.000 | 0.000 | 0.000 |
| [−19.3, −15.2) | 0.002 | 0.000 | 0.000 |
| [−15.2, −11.1) | 0.006 | 0.000 | 0.000 |
| [−11.1, −7.0) | 0.017 | 0.000 | 0.000 |
| [−7.0, −2.9) | 0.062 | 0.000 | 0.000 |
| [−2.9, 1.2) | 0.618 | 0.000 | 0.000 |
| [1.2, 5.3) | 0.169 | 0.000 | 0.000 |
| [5.3, 9.4) | 0.086 | 0.000 | 0.000 |
| [9.4, 13.6) | 0.027 | 0.000 | 0.000 |
| [13.6, 17.7) | 0.007 | 0.002 | 0.000 |
| [17.7, 21.8) | 0.002 | 0.001 | 0.000 |
| [21.8, 25.9) | 0.001 | 0.000 | 0.000 |
| [25.9, 30) | 0.000 | 0.000 | 0.000 |
| [30, 1000) | 0.000 | 0.000 | 0.000 |
| CO | HC | NOX | SOX | PM | |
|---|---|---|---|---|---|
| business district | 14.96 | 0.13 | 0.95 | 0.005 | 0.001 |
| higher income area | 14.17 | 0.12 | 0.85 | 0.004 | 0.001 |
| low income area | 10.53 | 0.1 | 0.7 | 0.004 | 0.001 |
| comprehensive | 10.6 | 0.1 | 0.74 | 0.005 | 0.001 |
| CO | HC | NOX | |
|---|---|---|---|
| measurements of VMAS for the emissions | 2.771 | 0.64 | 0.36 |
| IVE analog value of the emissions | 10.6 | 2.59 | 0.74 |
| parameter correction factor | 0.26 | 0.25 | 0.5 |
| CO | HC | NOX | SOX | PM | |
|---|---|---|---|---|---|
| business district | 3.45 | 0.13 | 0.48 | 0.005 | 0.001 |
| higher income area | 3.4 | 0.12 | 0.42 | 0.004 | 0.001 |
| low income area | 2.53 | 0.1 | 0.35 | 0.004 | 0.001 |
| comprehensive | 2.55 | 0.1 | 0.37 | 0.004 | 0.001 |
Publisher’s Note: MDPI stays neutral with regard to jurisdictional claims in published maps and institutional affiliations. |
© 2021 by the authors. Licensee MDPI, Basel, Switzerland. This article is an open access article distributed under the terms and conditions of the Creative Commons Attribution (CC BY) license (https://creativecommons.org/licenses/by/4.0/).
Share and Cite
Zhao, H.; Mu, L.; Li, Y.; Qiu, J.; Sun, C.; Liu, X. Unregulated Emissions from Natural Gas Taxi Based on IVE Model. Atmosphere 2021, 12, 478. https://doi.org/10.3390/atmos12040478
Zhao H, Mu L, Li Y, Qiu J, Sun C, Liu X. Unregulated Emissions from Natural Gas Taxi Based on IVE Model. Atmosphere. 2021; 12(4):478. https://doi.org/10.3390/atmos12040478
Chicago/Turabian StyleZhao, Hong, Liang Mu, Yan Li, Junzheng Qiu, Chuanlong Sun, and Xiaotong Liu. 2021. "Unregulated Emissions from Natural Gas Taxi Based on IVE Model" Atmosphere 12, no. 4: 478. https://doi.org/10.3390/atmos12040478
APA StyleZhao, H., Mu, L., Li, Y., Qiu, J., Sun, C., & Liu, X. (2021). Unregulated Emissions from Natural Gas Taxi Based on IVE Model. Atmosphere, 12(4), 478. https://doi.org/10.3390/atmos12040478