Changes in Air Quality Associated with Mobility Trends and Meteorological Conditions during COVID-19 Lockdown in Northern England, UK
Abstract
:1. Introduction
2. Methodology
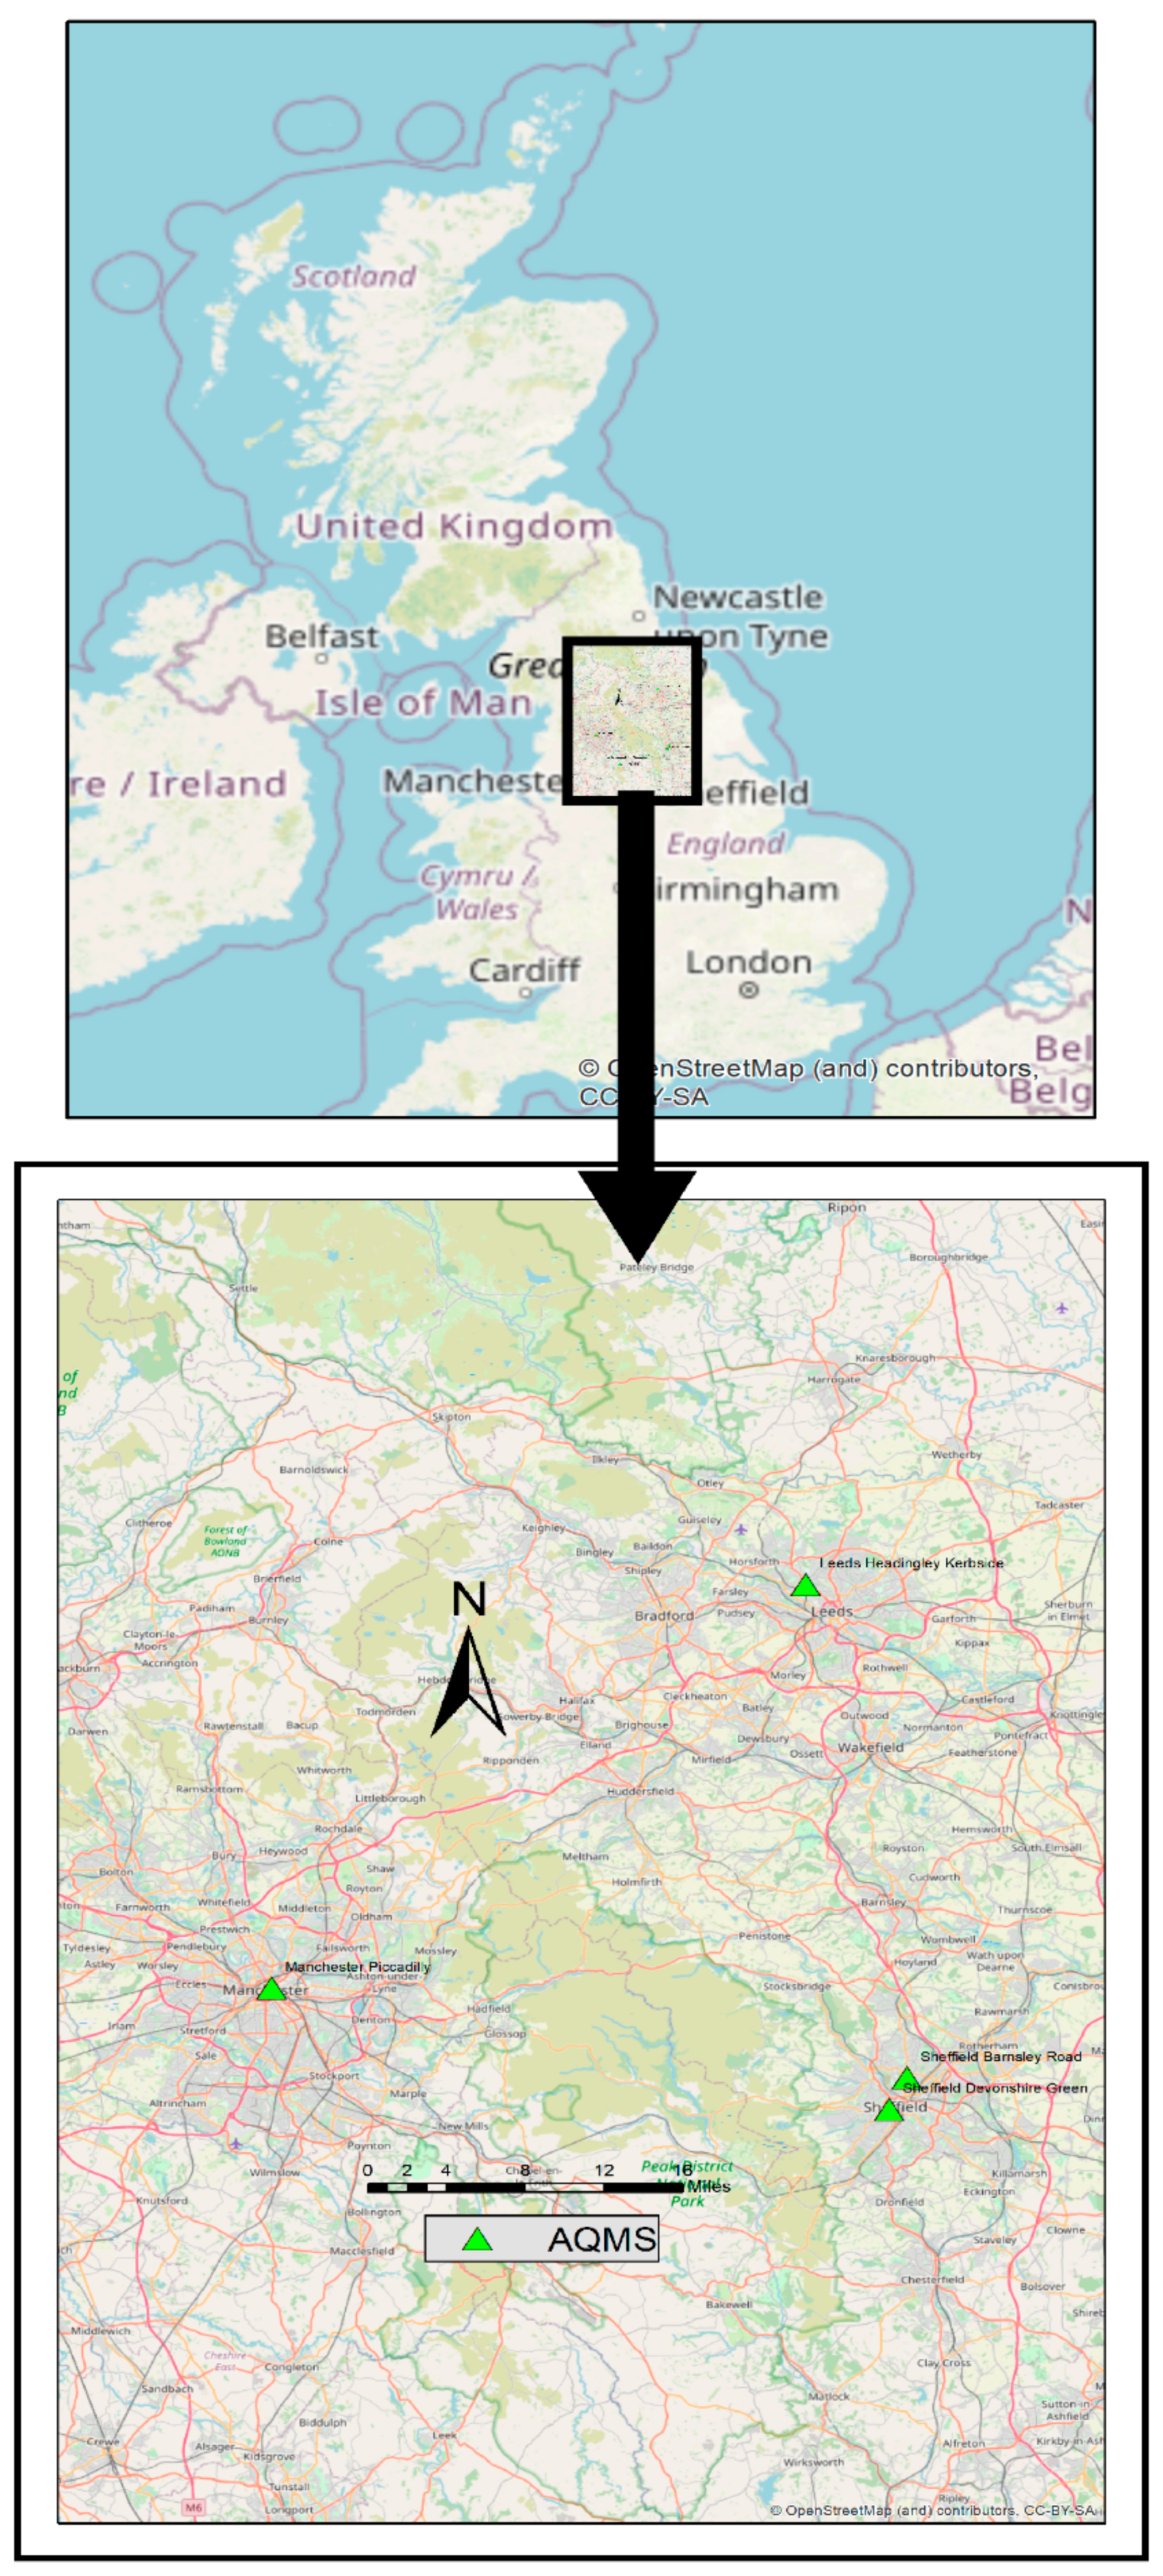
2.1. Study Area and Air Quality Monitoring Stations (AQMS)
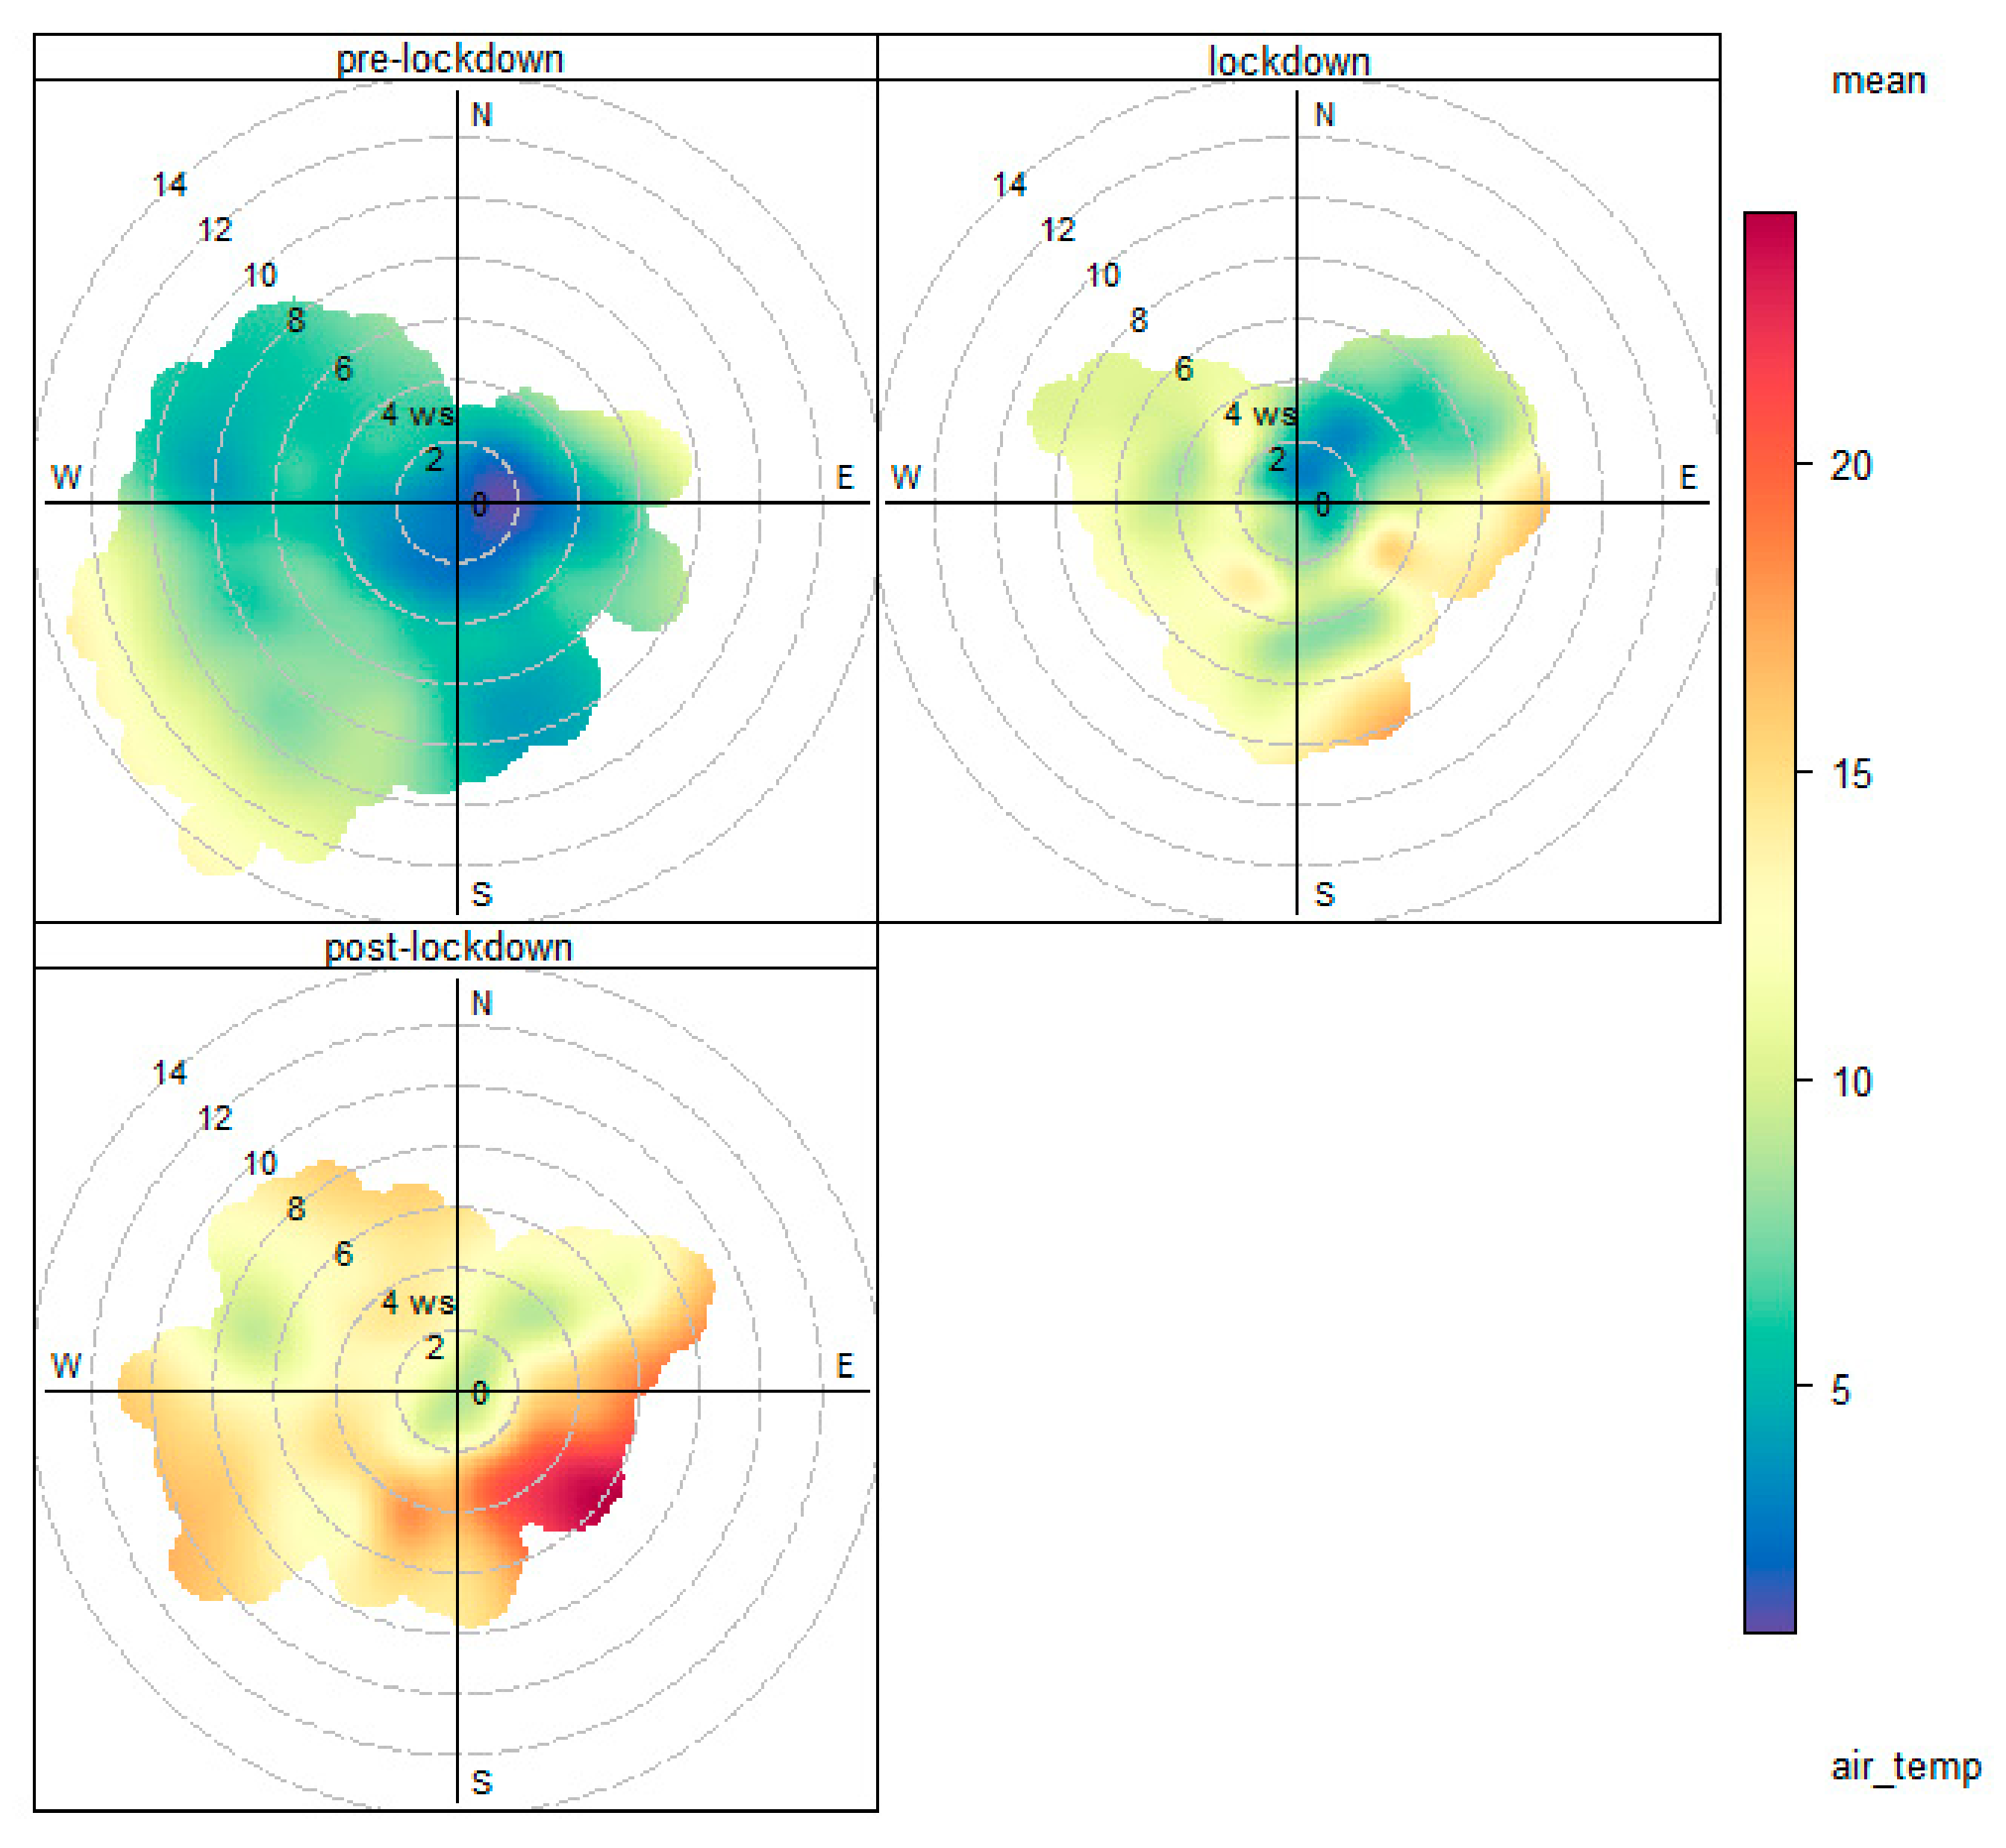
2.2. Air Quality and Meteorological Data
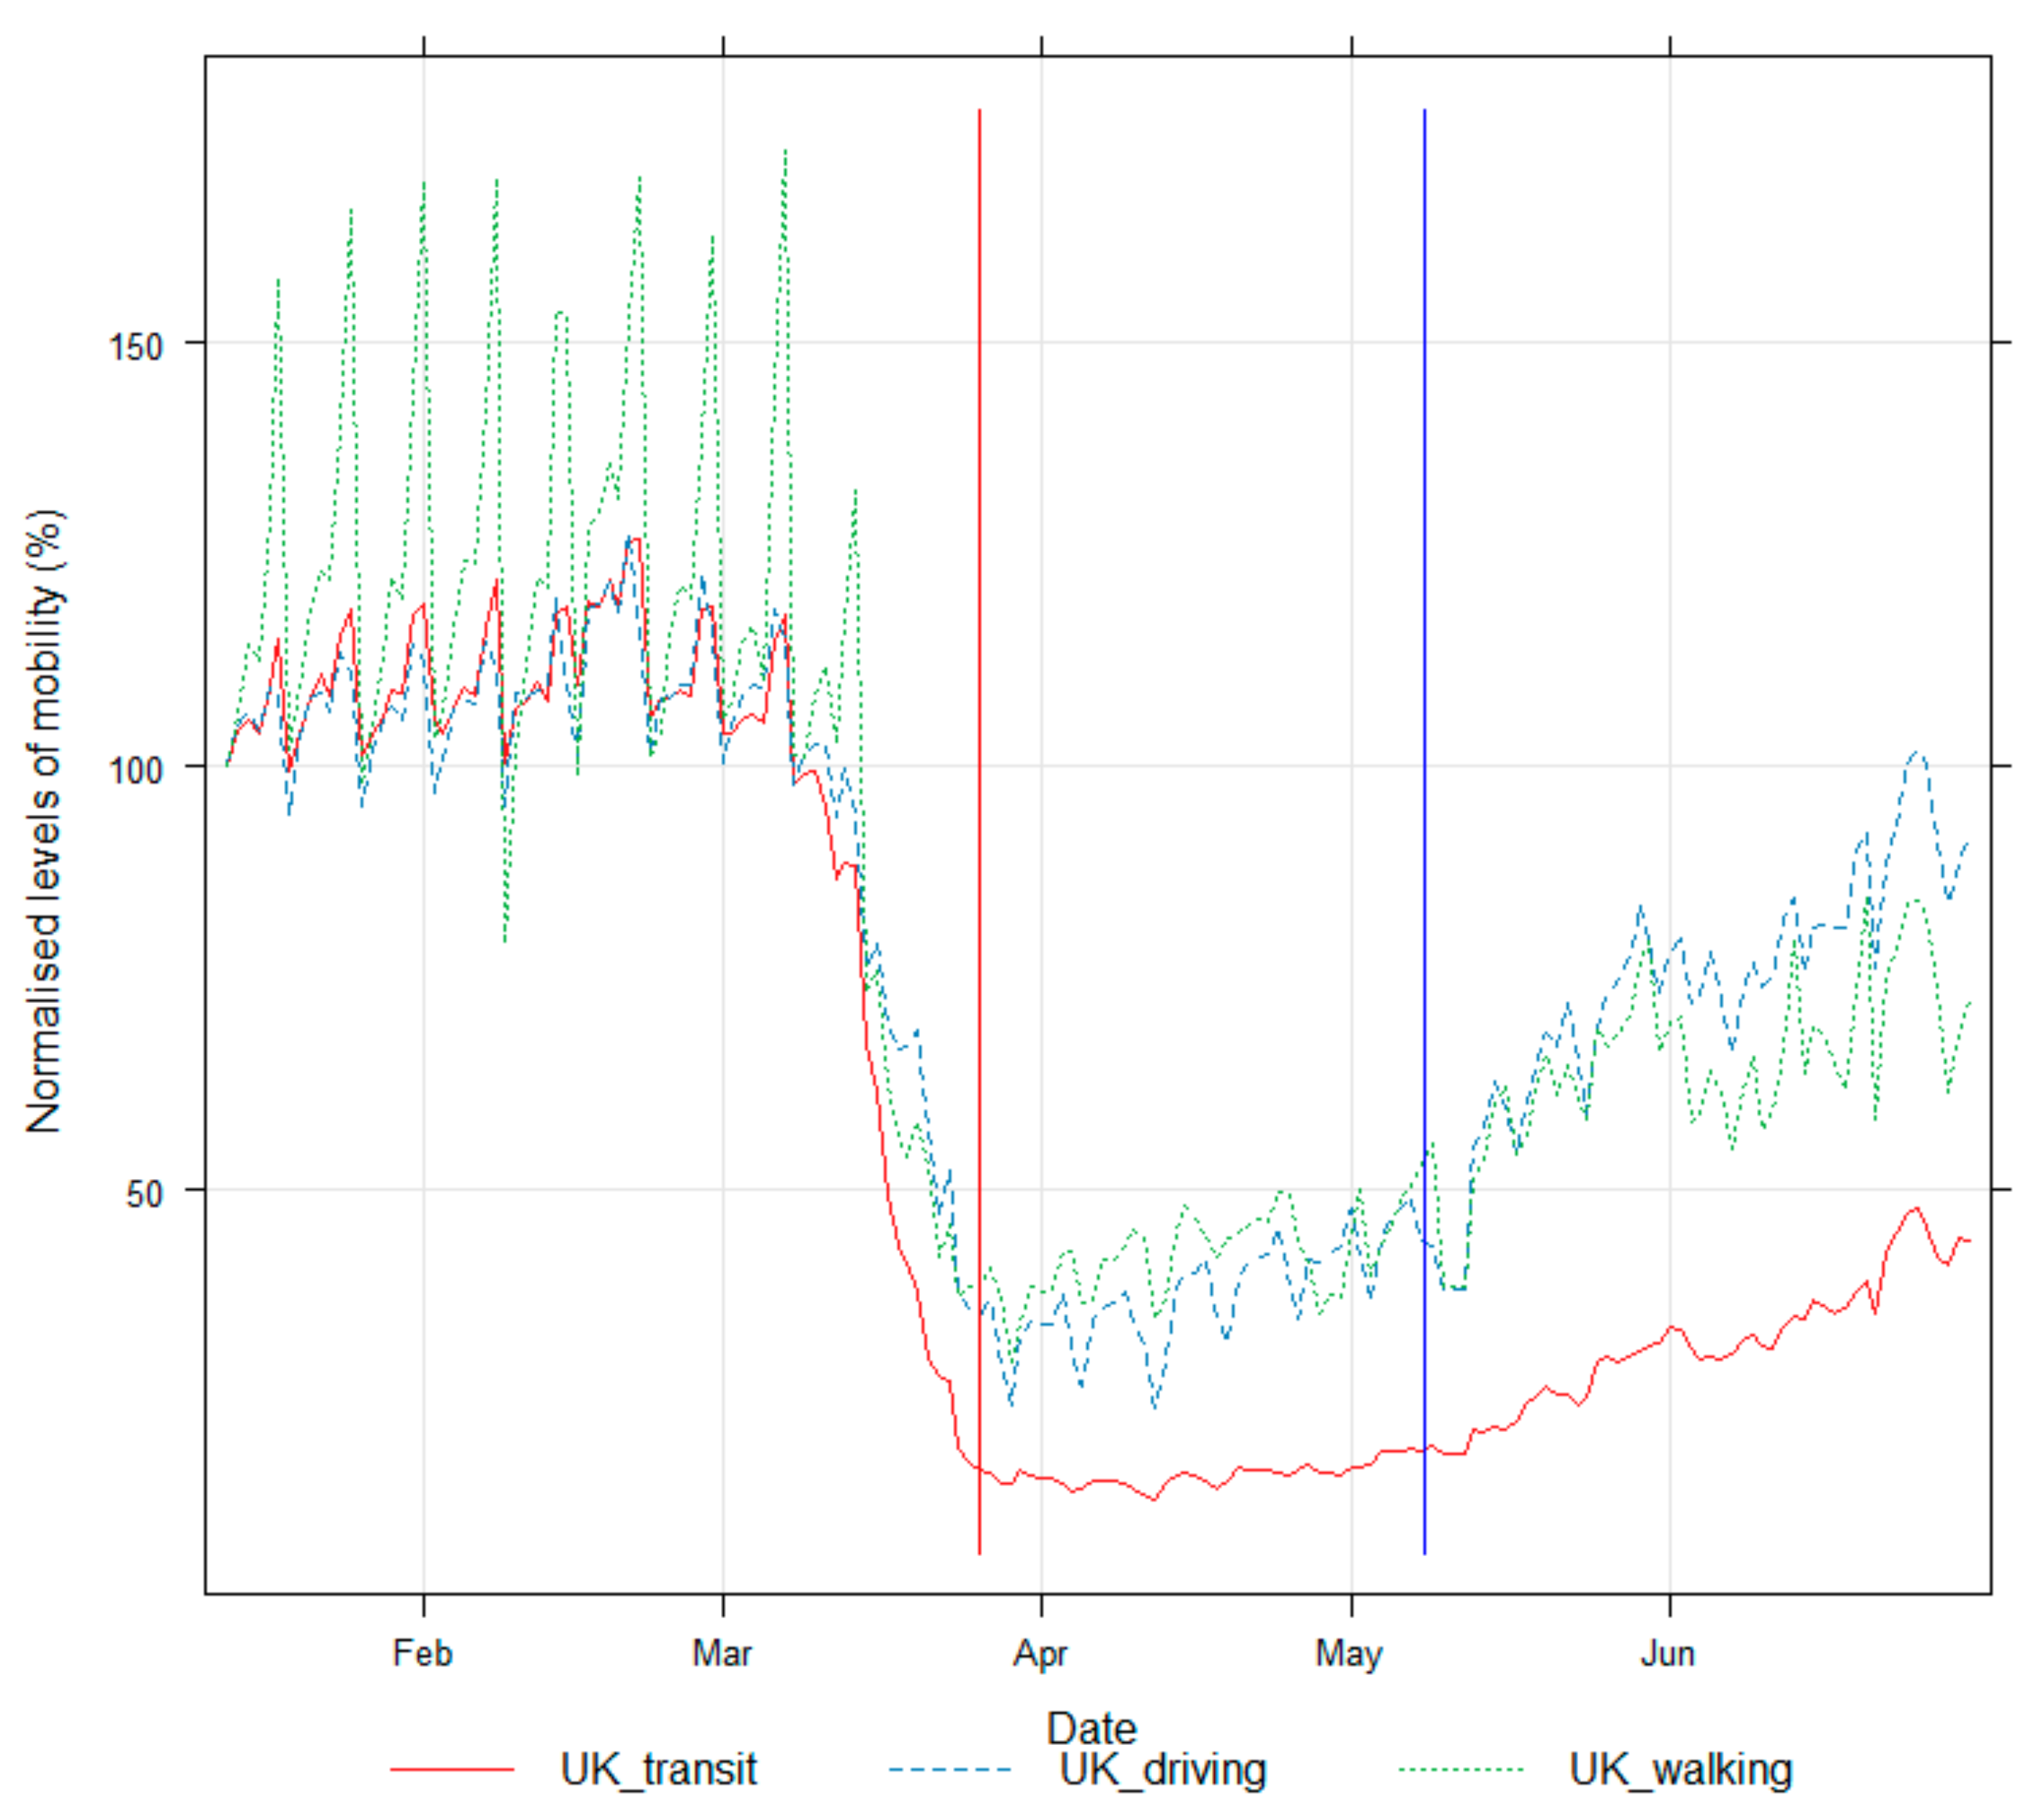
2.3. Mobility Data
2.4. Building a Generalised Additive Model (GAM)
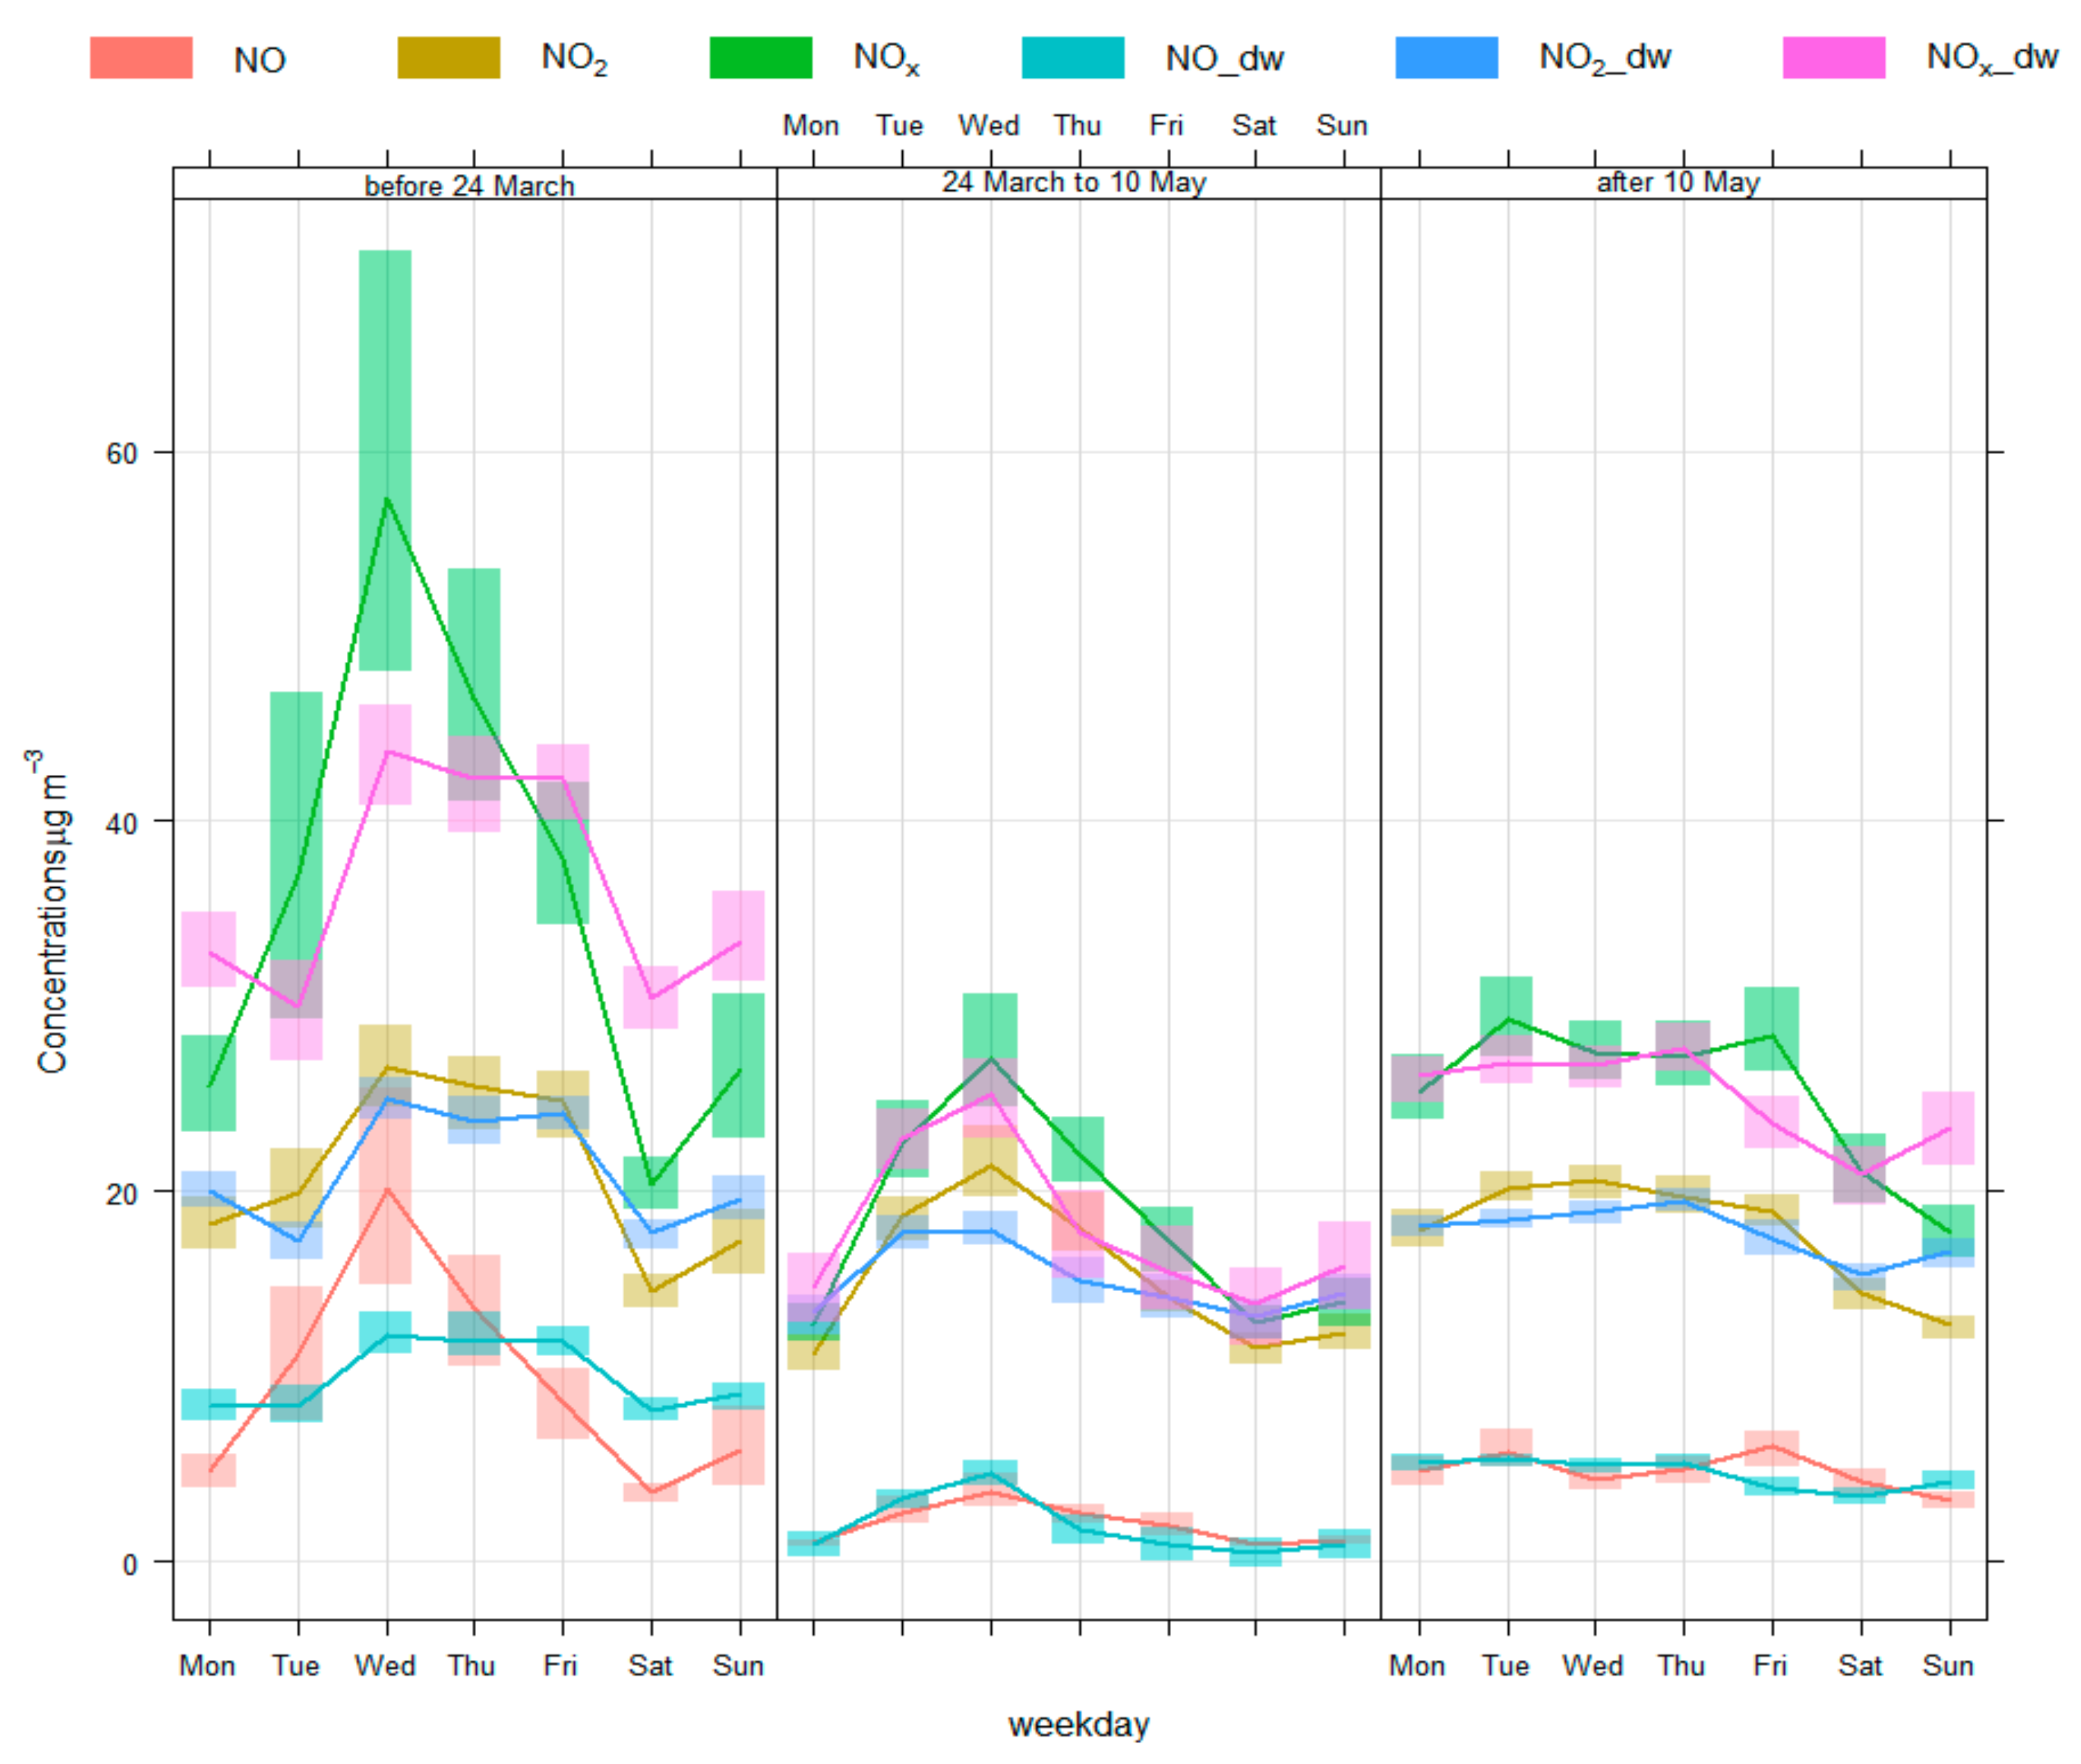
2.5. Statistical Analysis and Deweathering of Air Quality Data
- Comparing pre-lockdown, lockdown, and post lockdown periods using data from 2020.
- Comparing COVID-19 lockdown period in 2020 with the equivalent period in 2019. This approach has the benefit of comparing the same season in different years and therefore produces more realistic results.
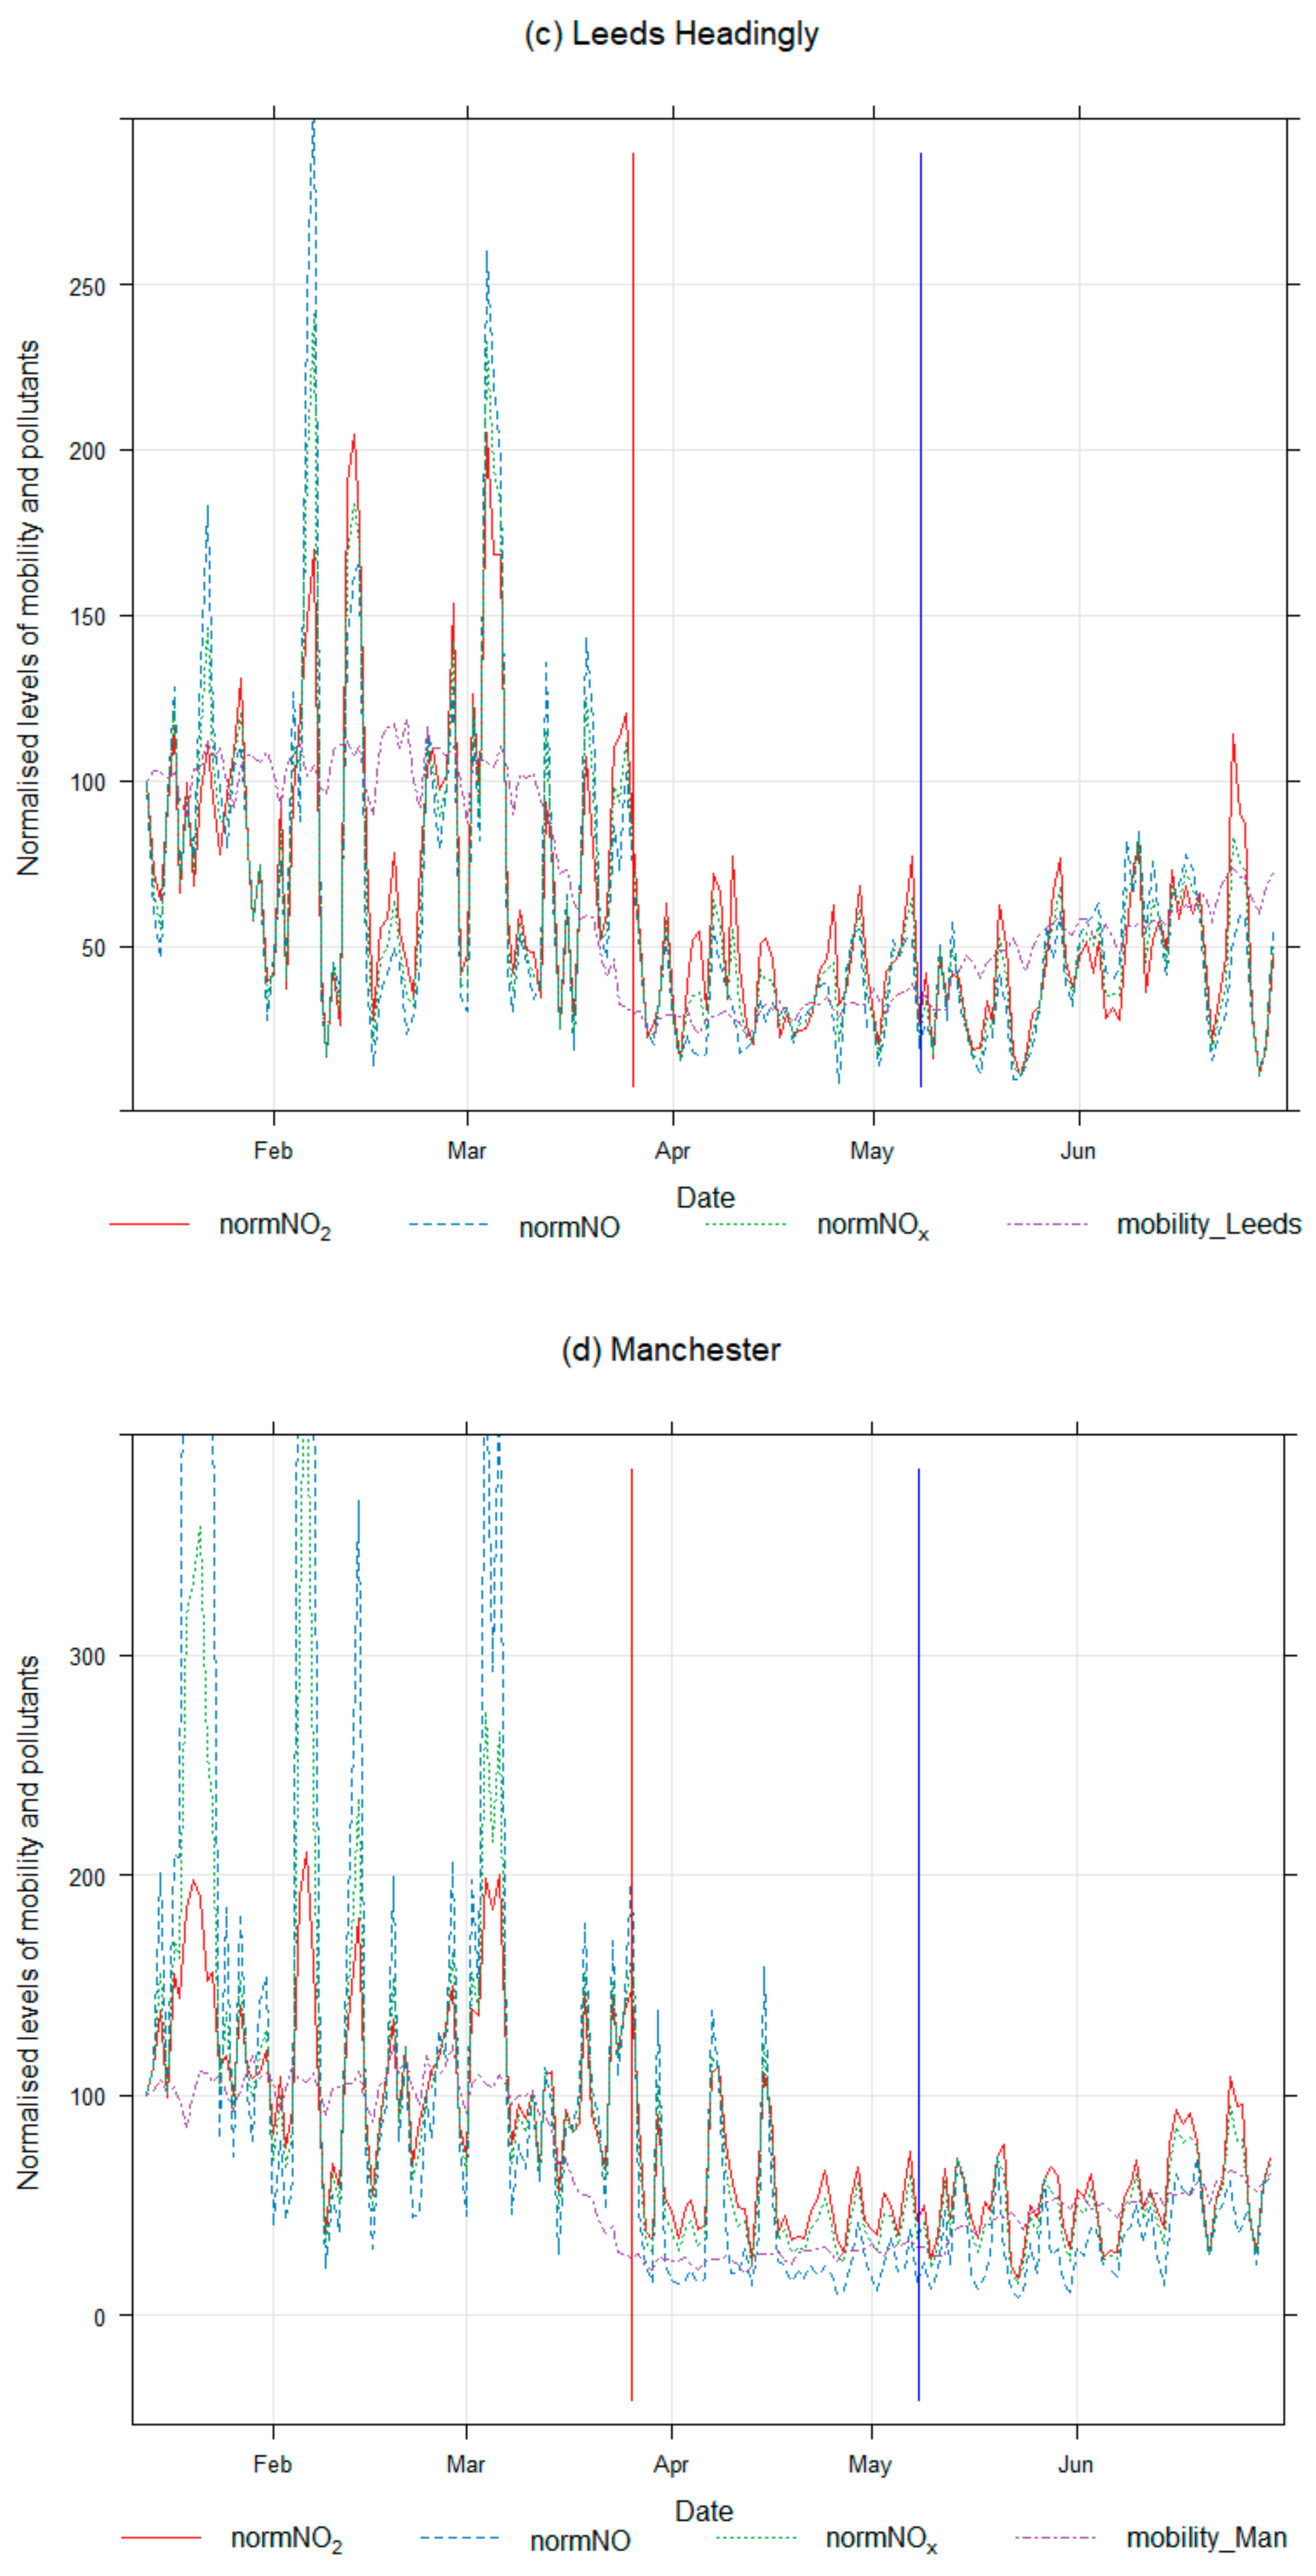
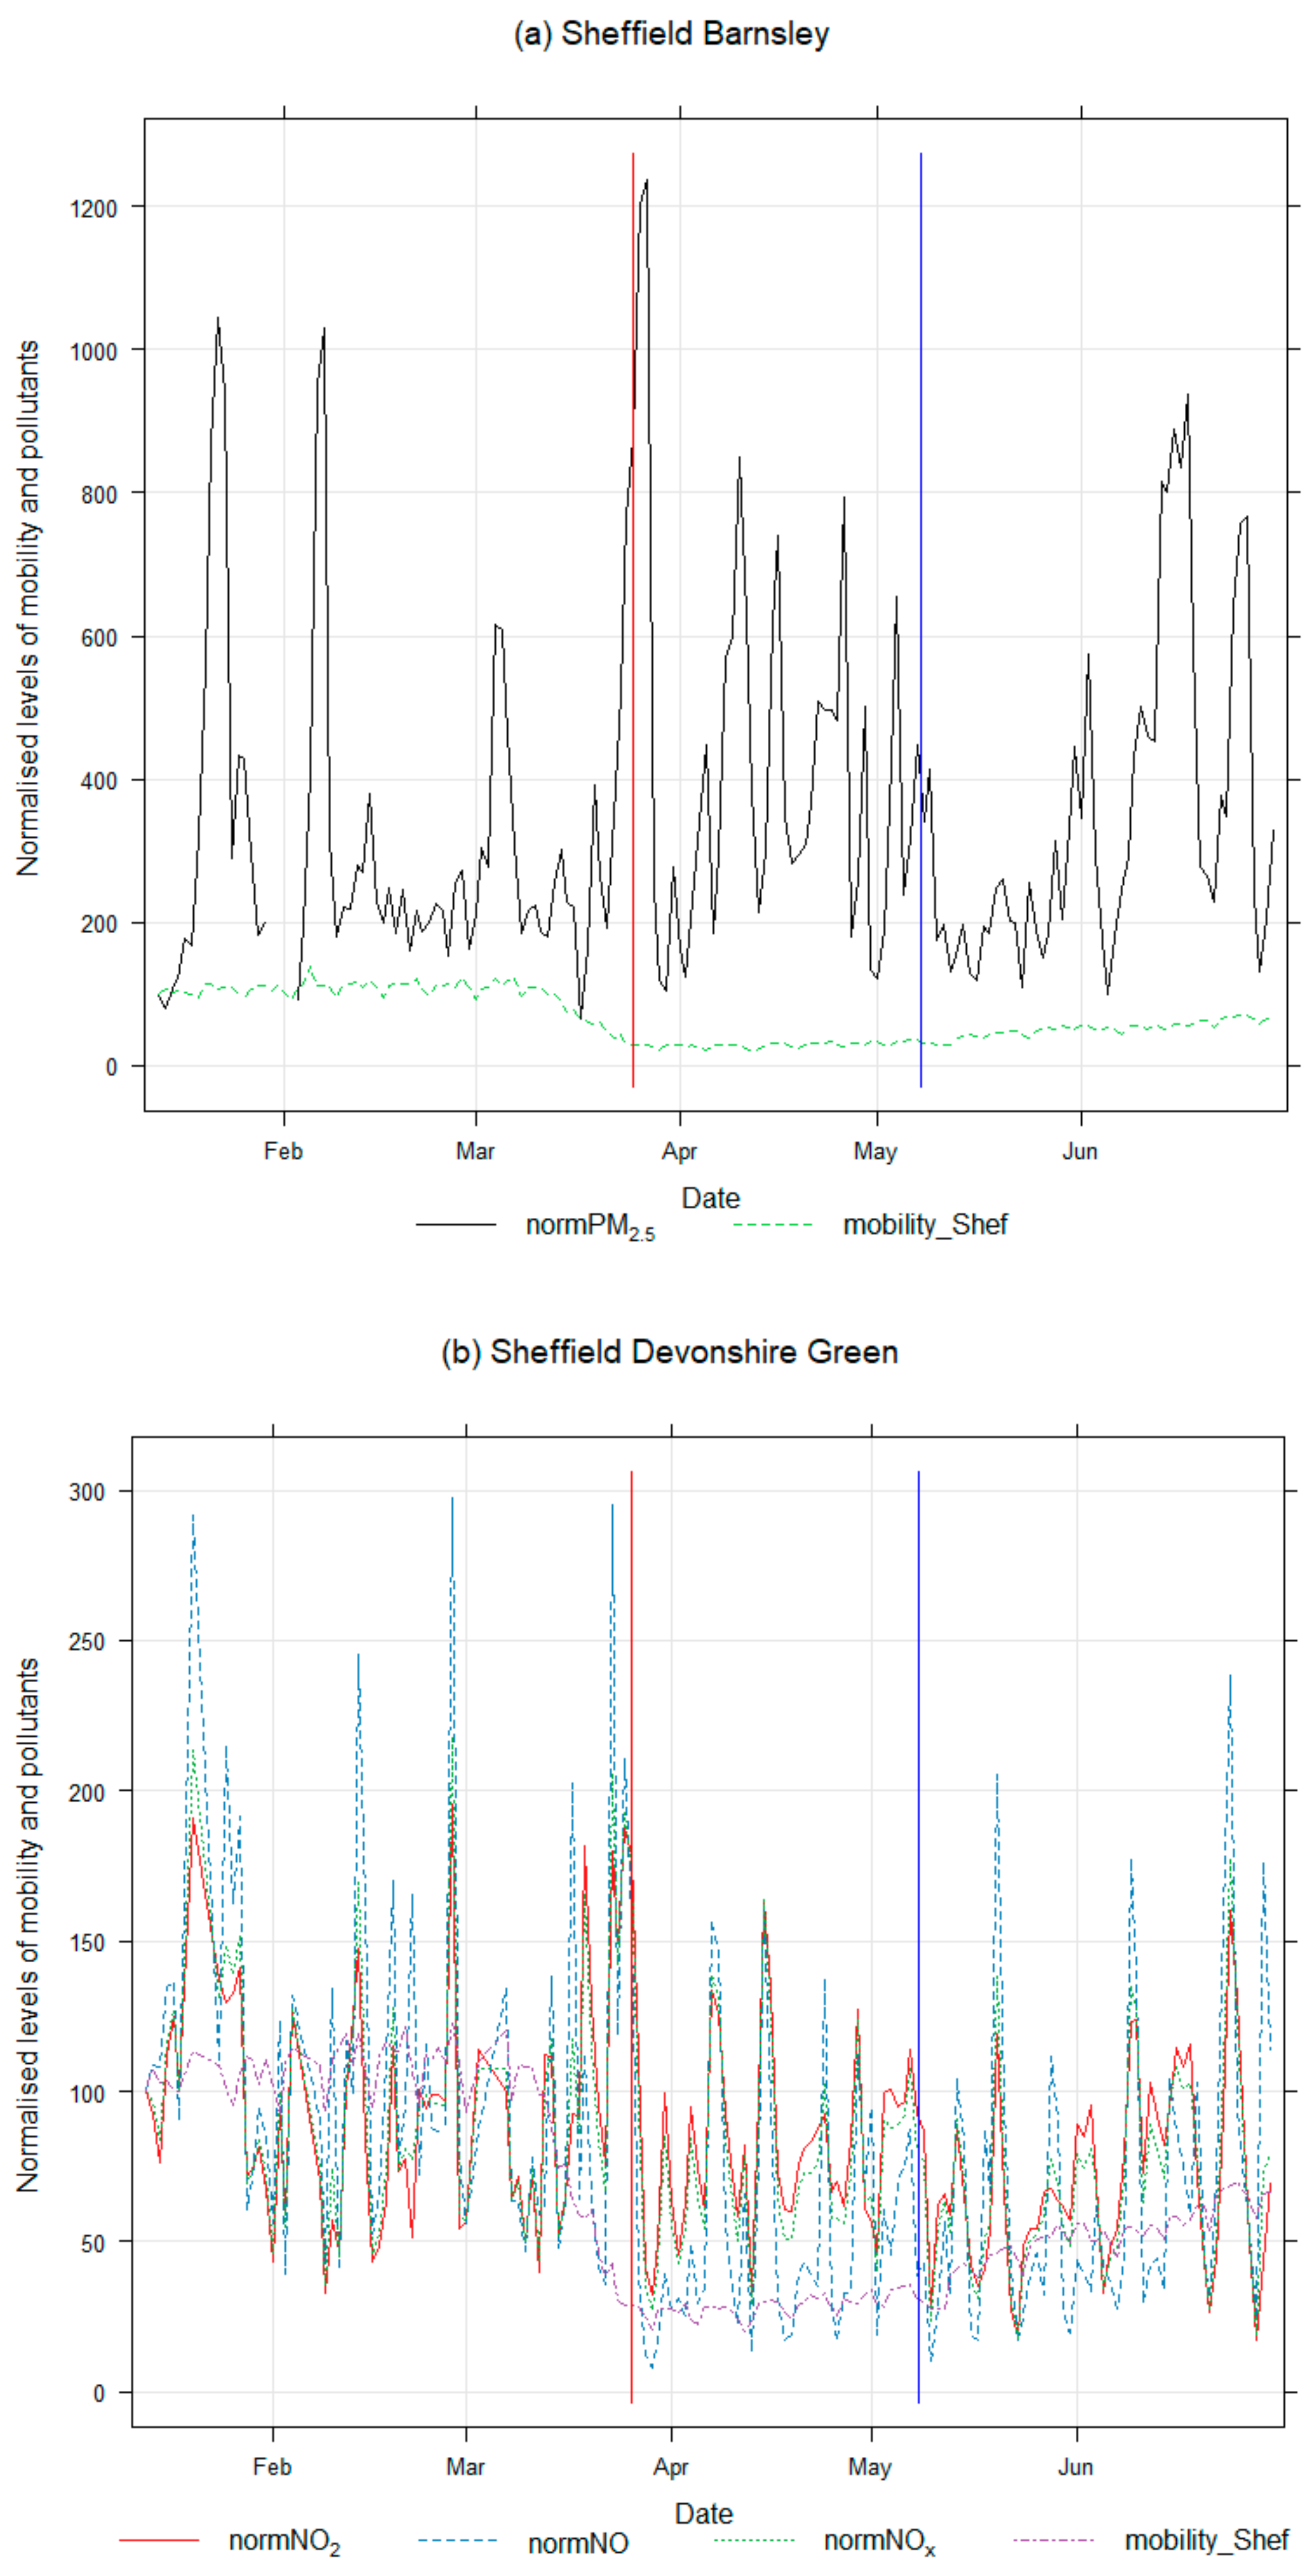
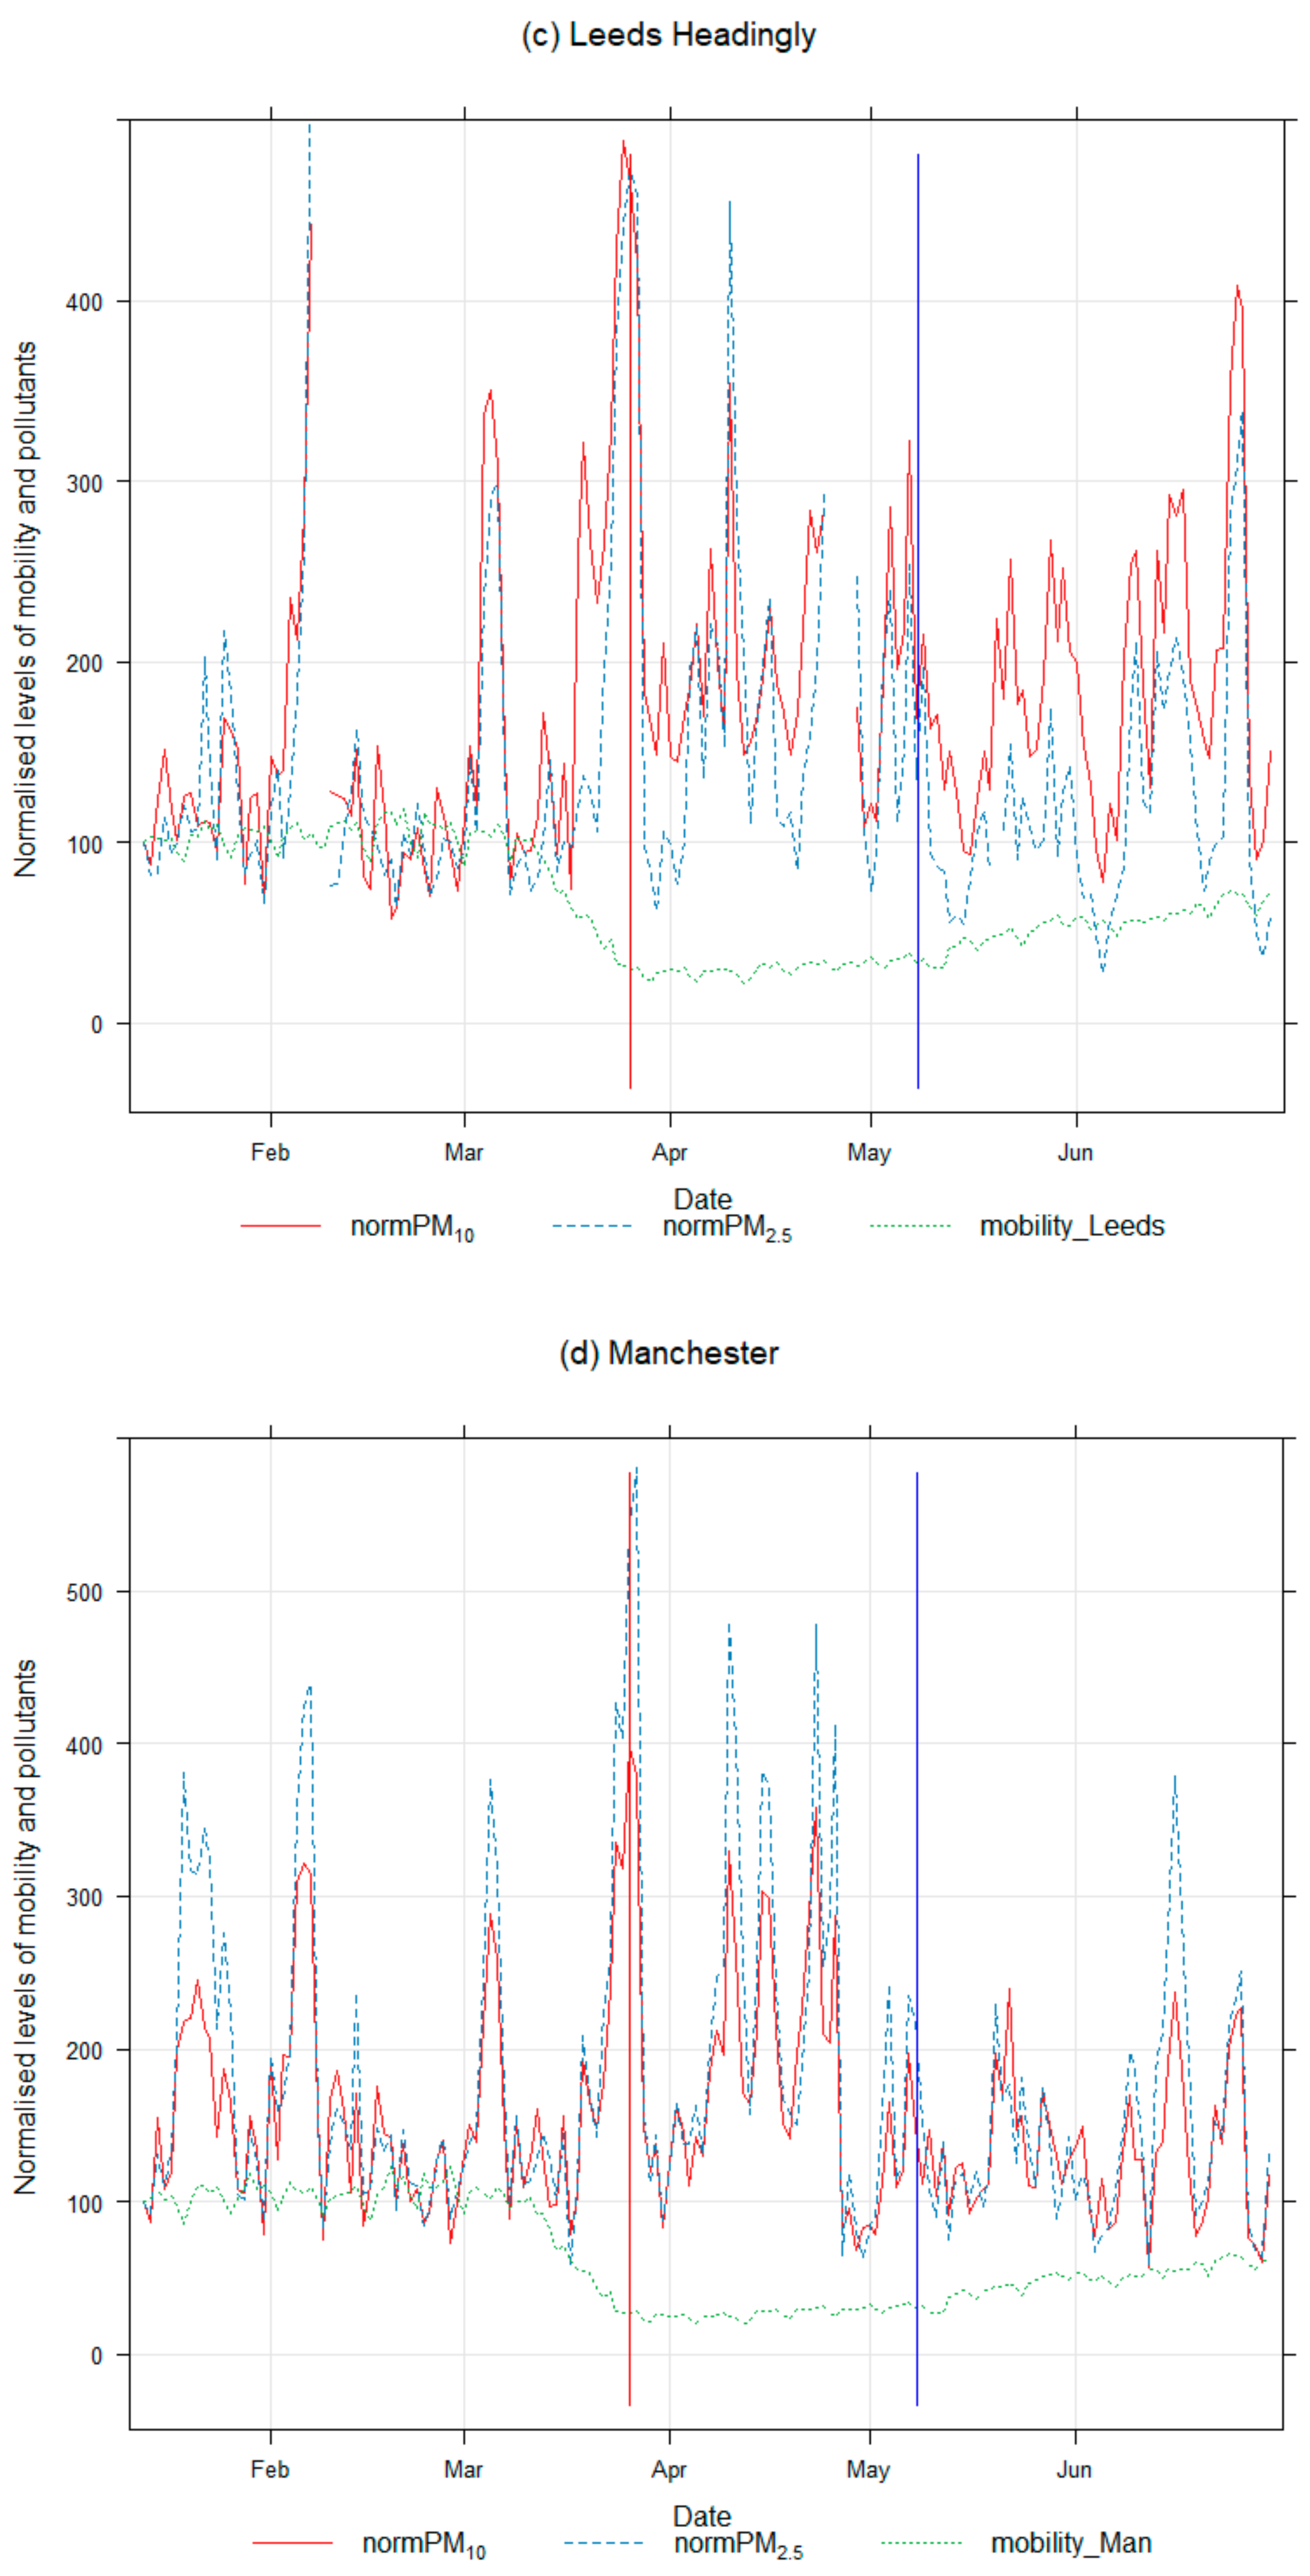
- Comparing mobility trend with the trend of air pollutant concentrations.
3. Results and Discussion
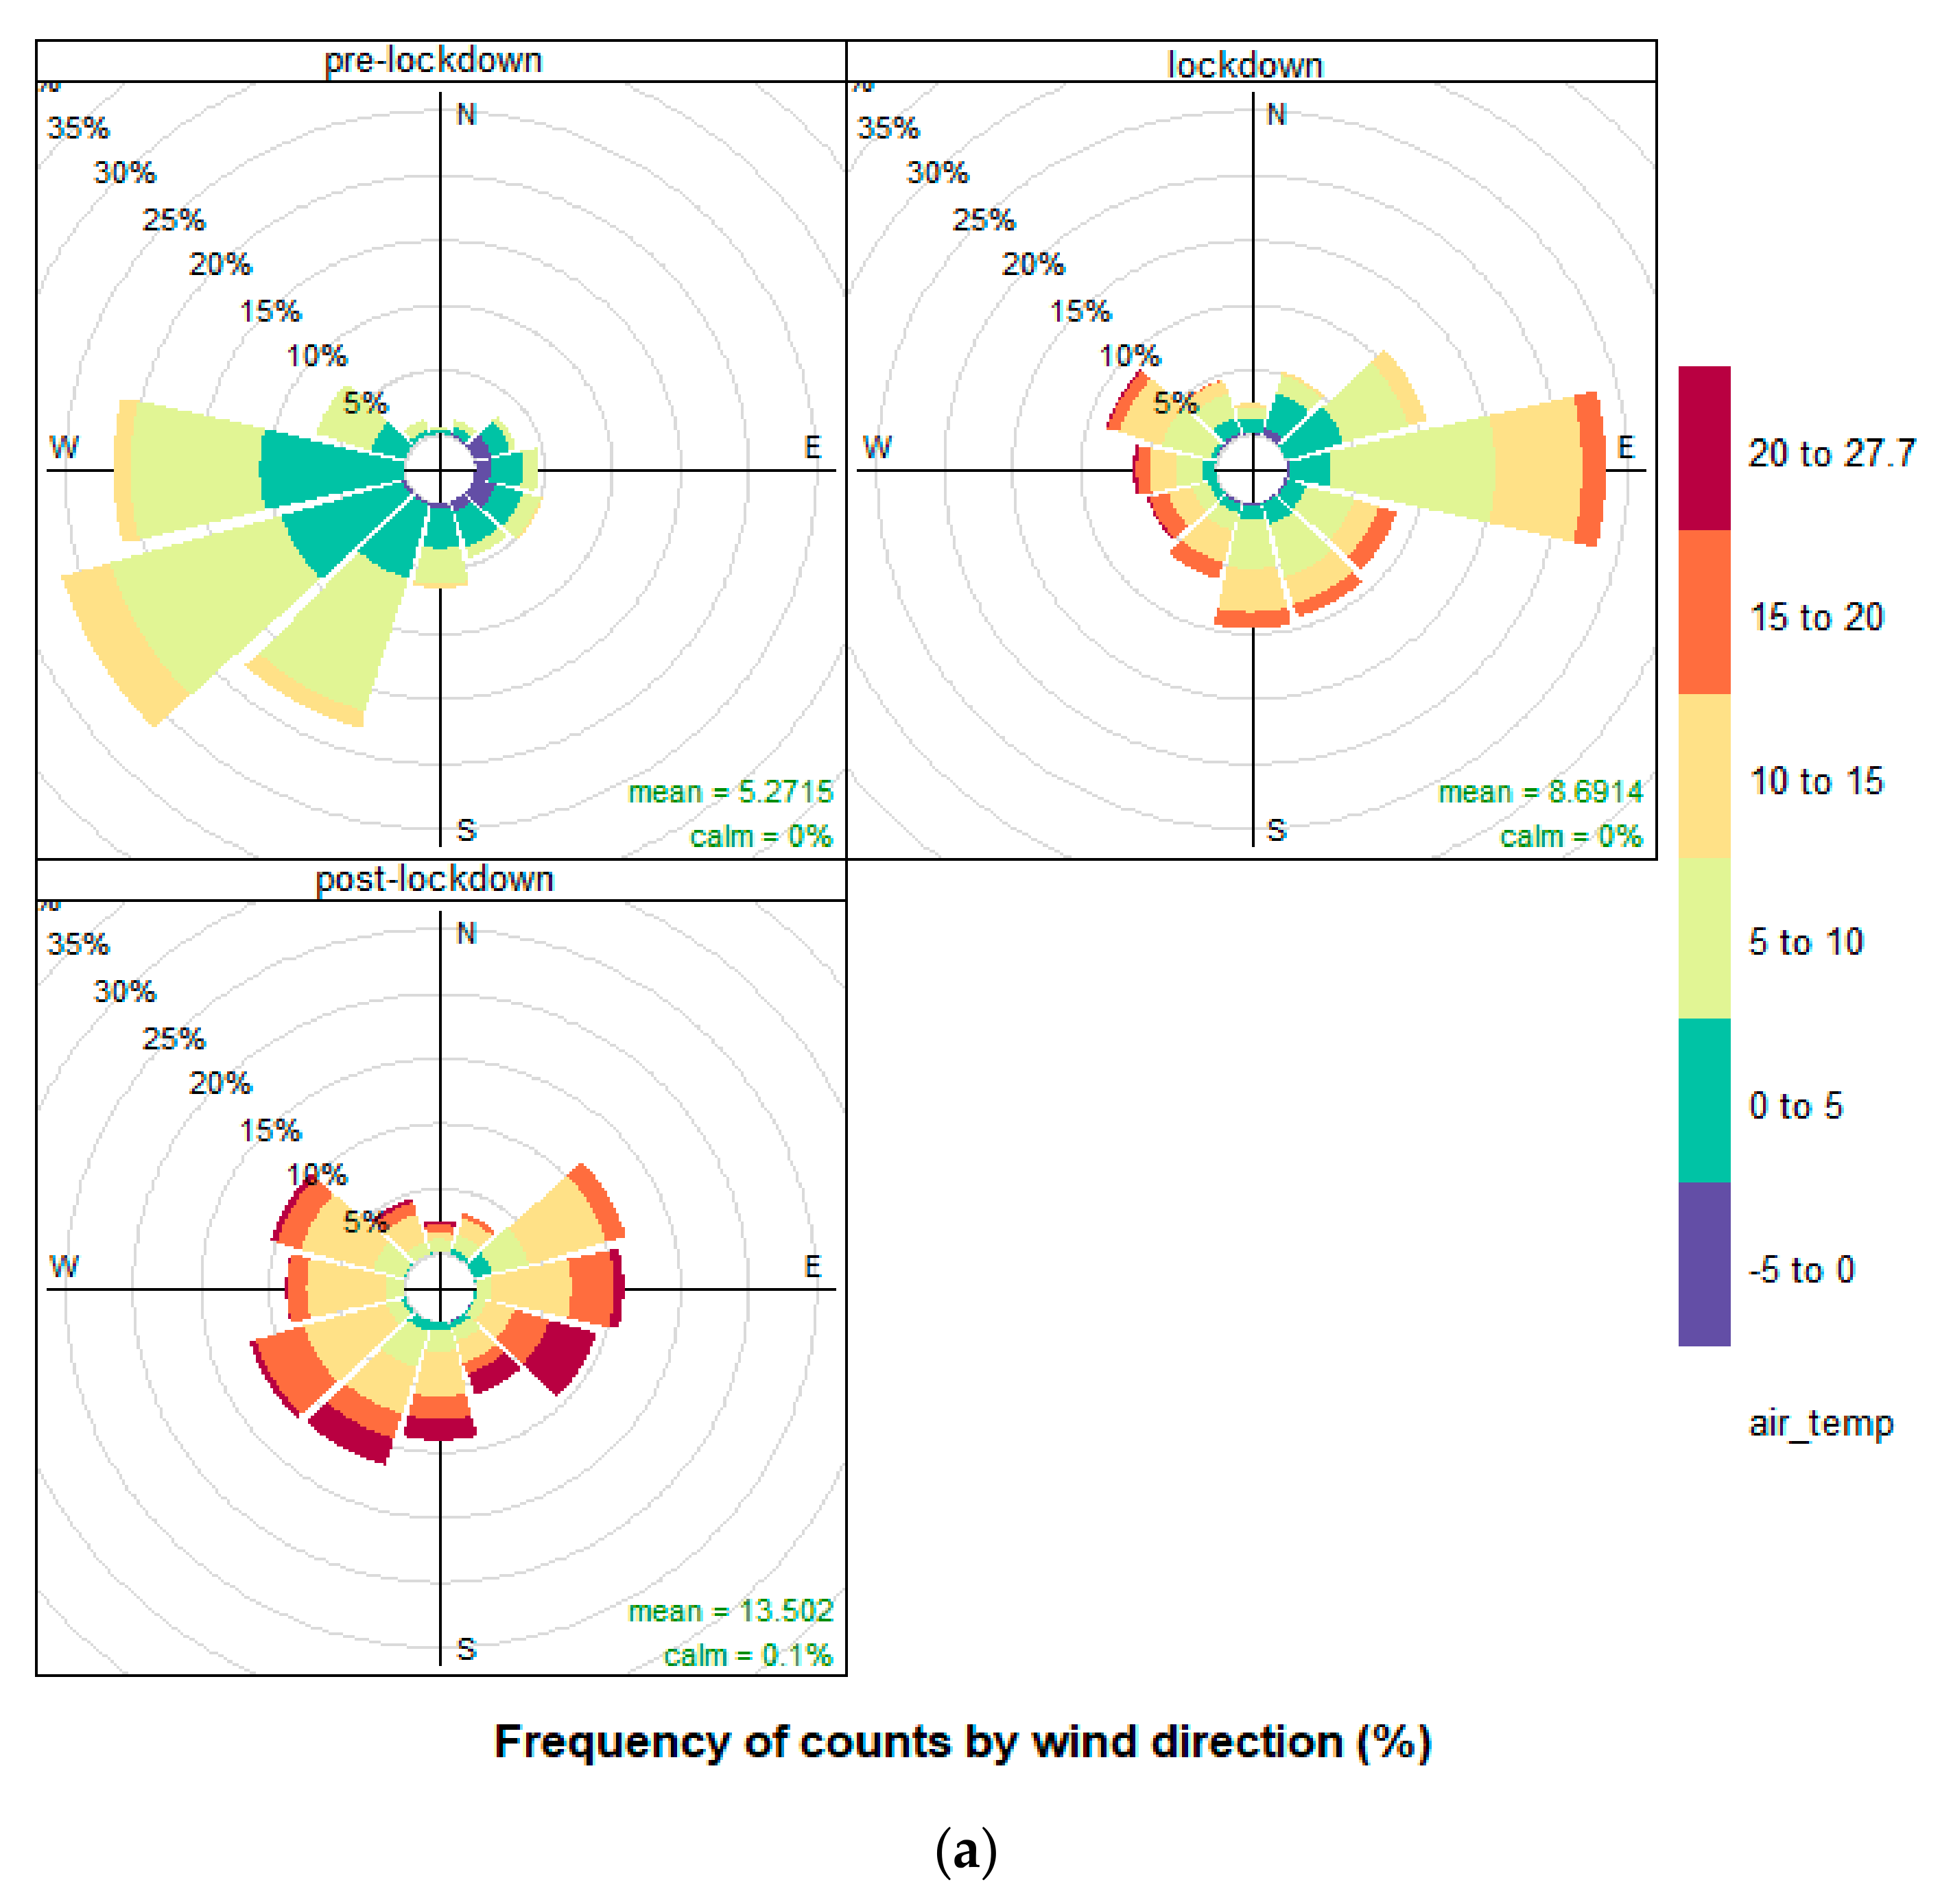
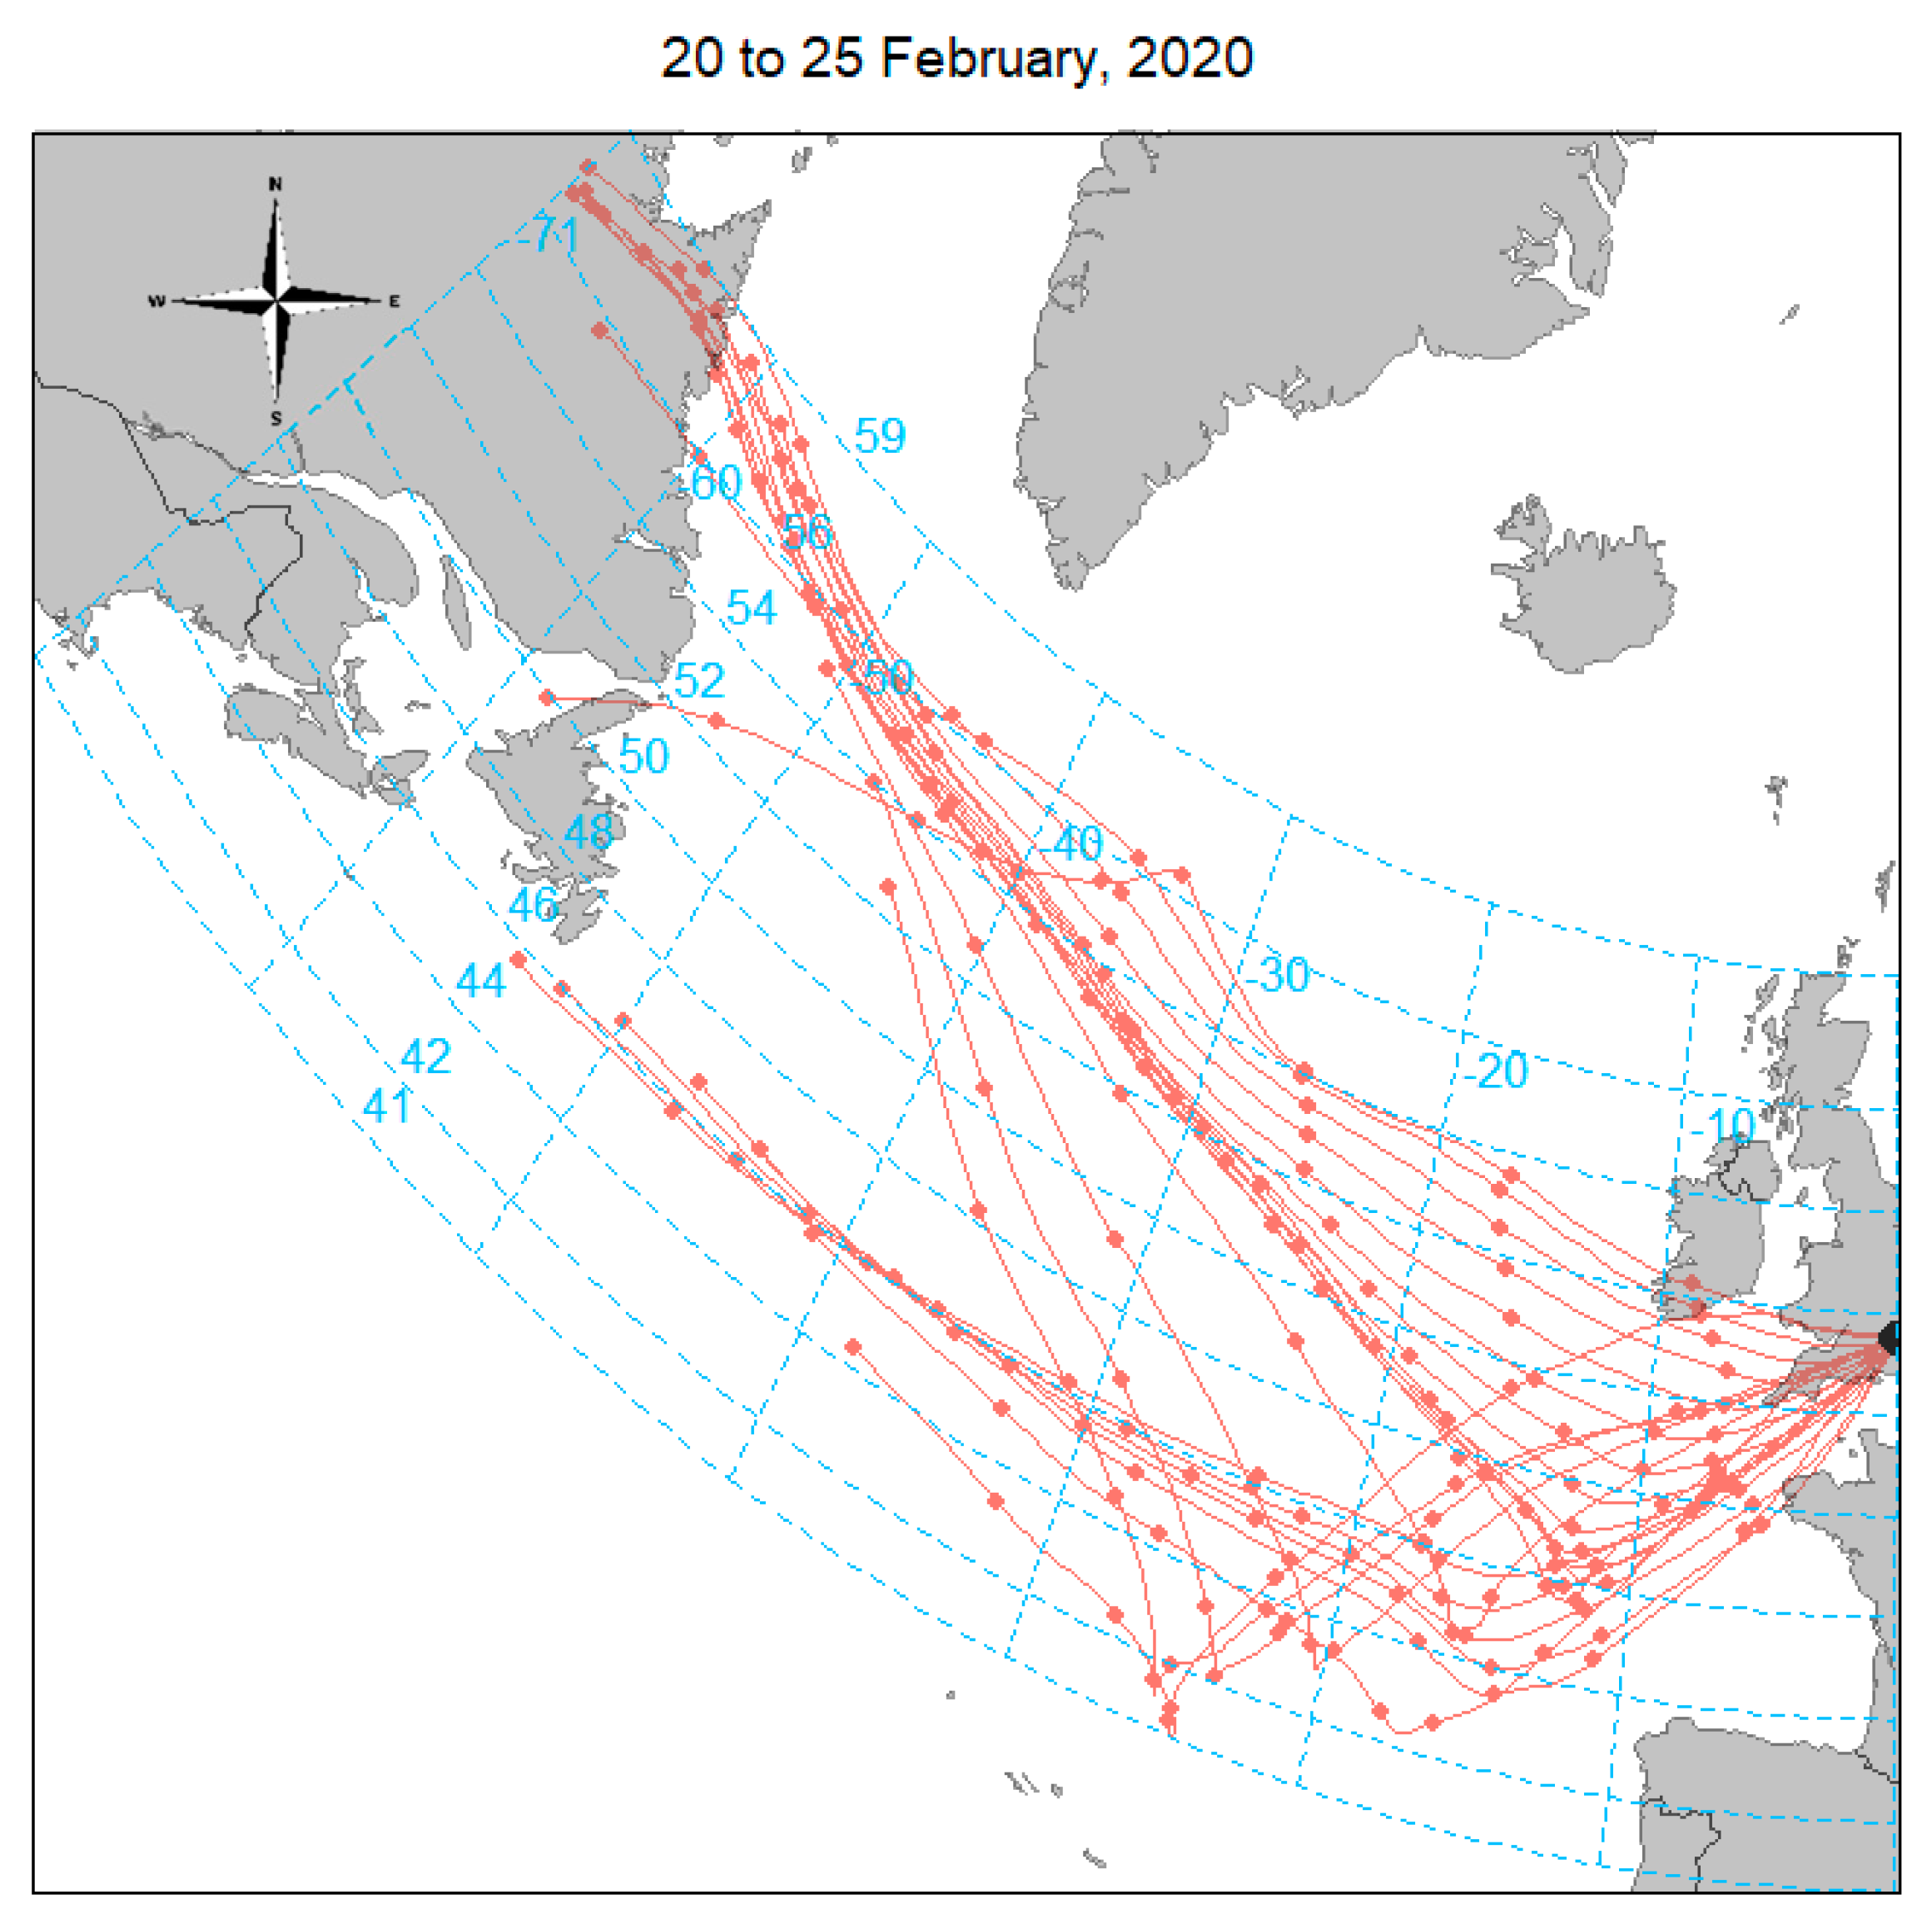
3.1. Changes in Air Pollutant Concentrations during Pre-Lockdown, Lockdown, and Post Lockdown Periods
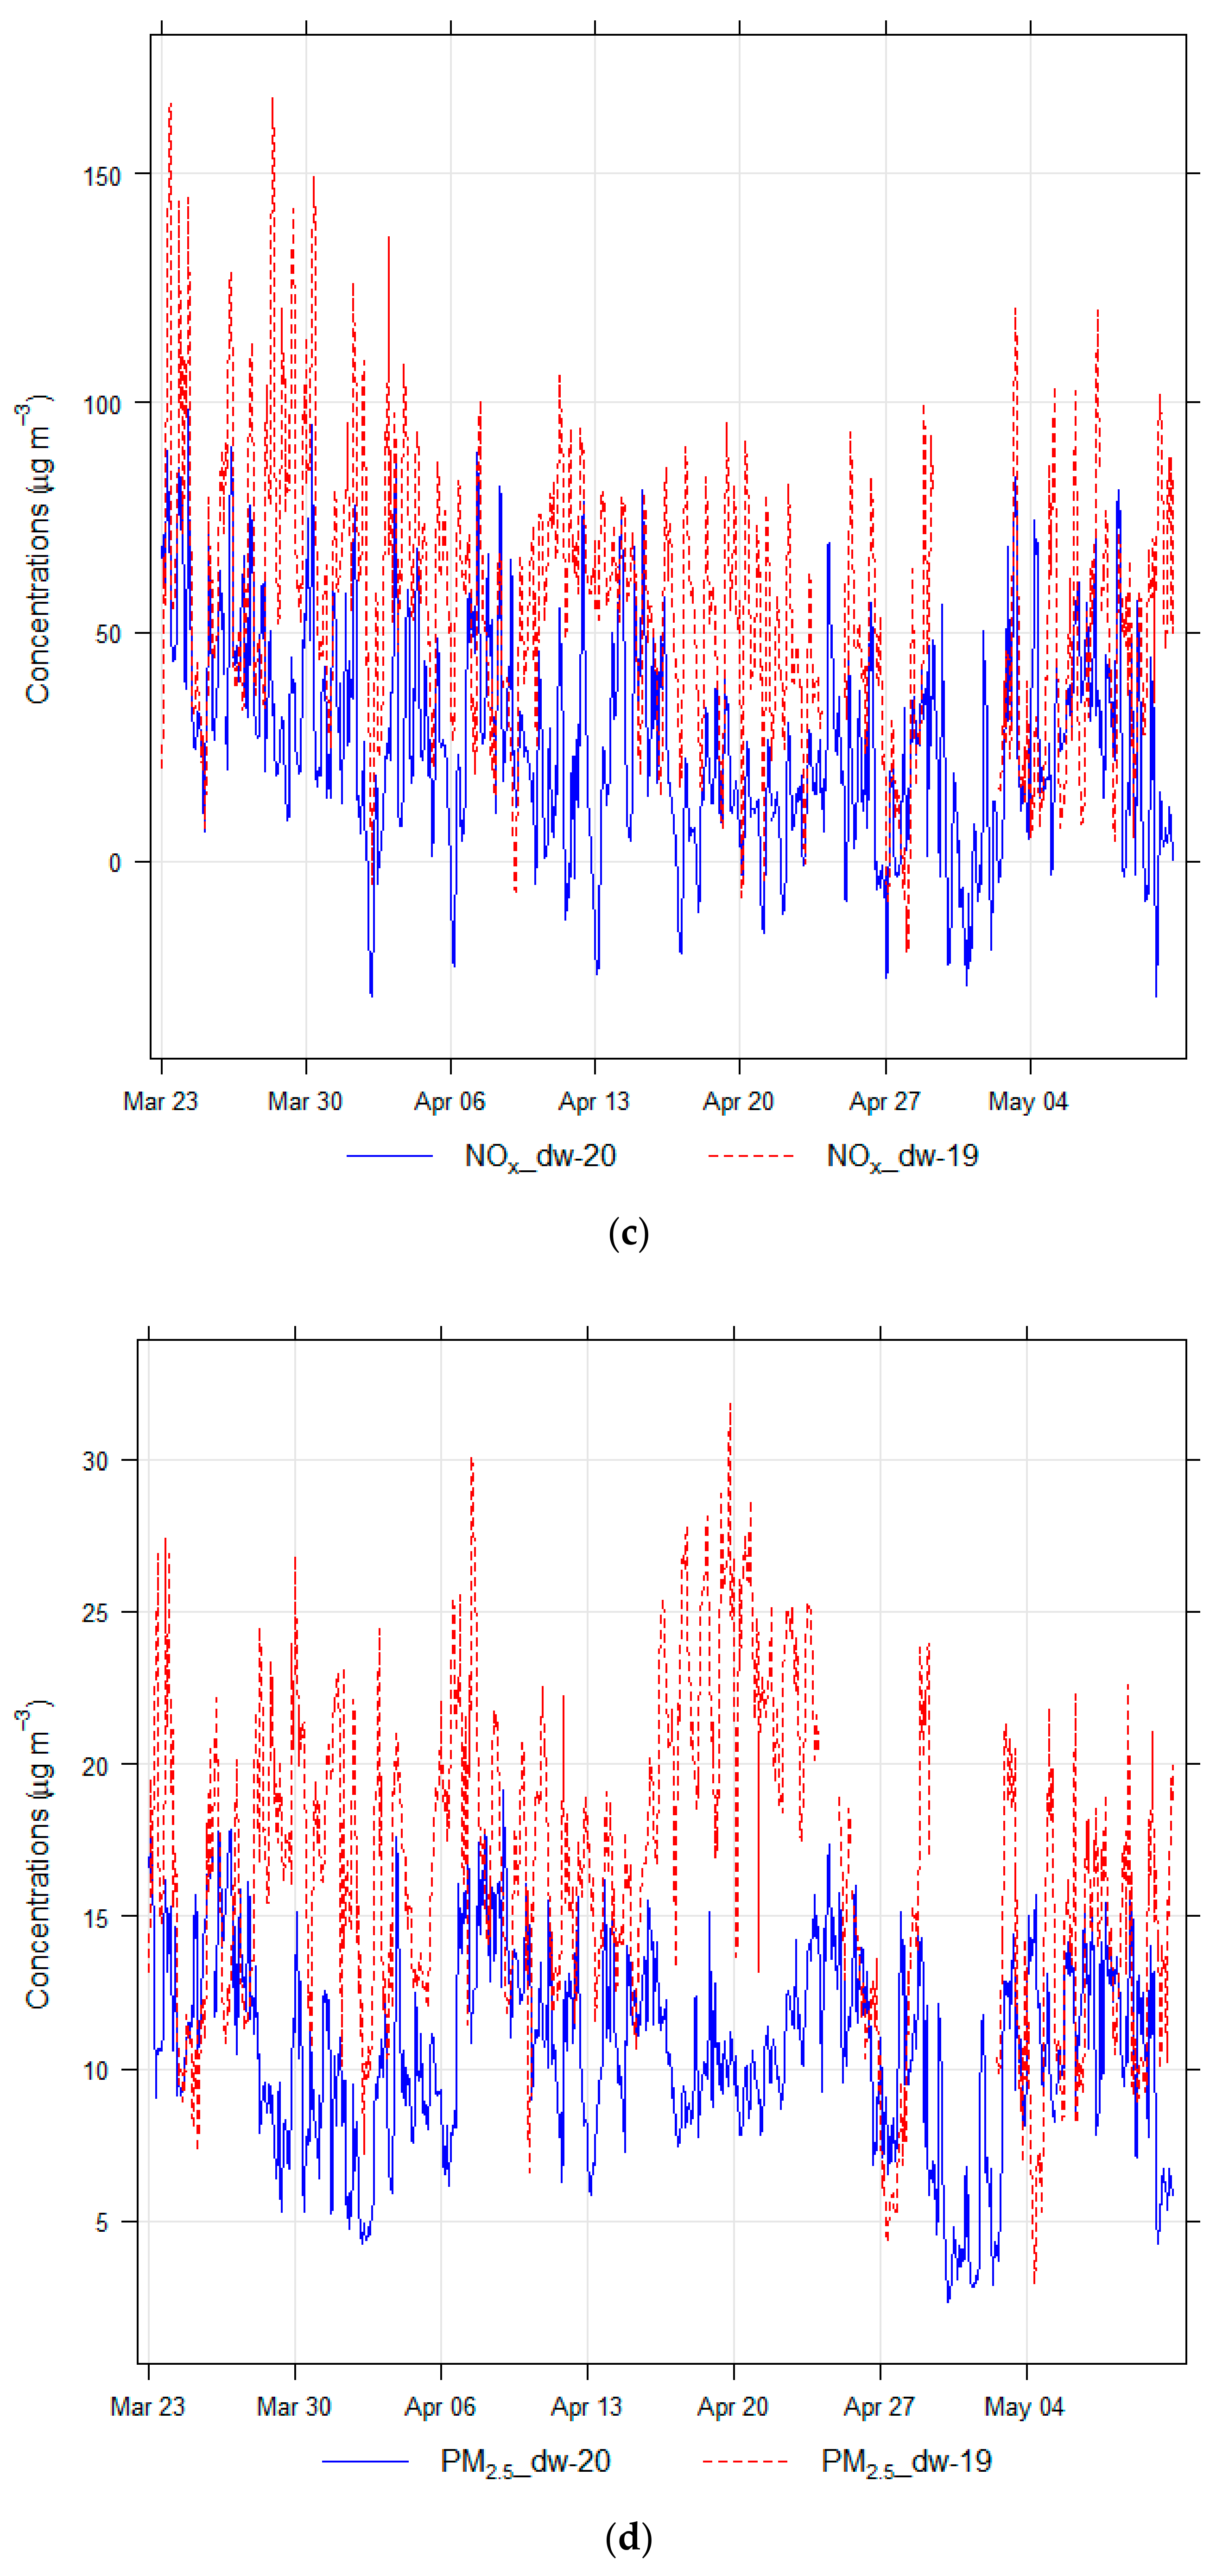
3.2. Changes in Air Quality during Lockdown Period—2020 vs. 2019
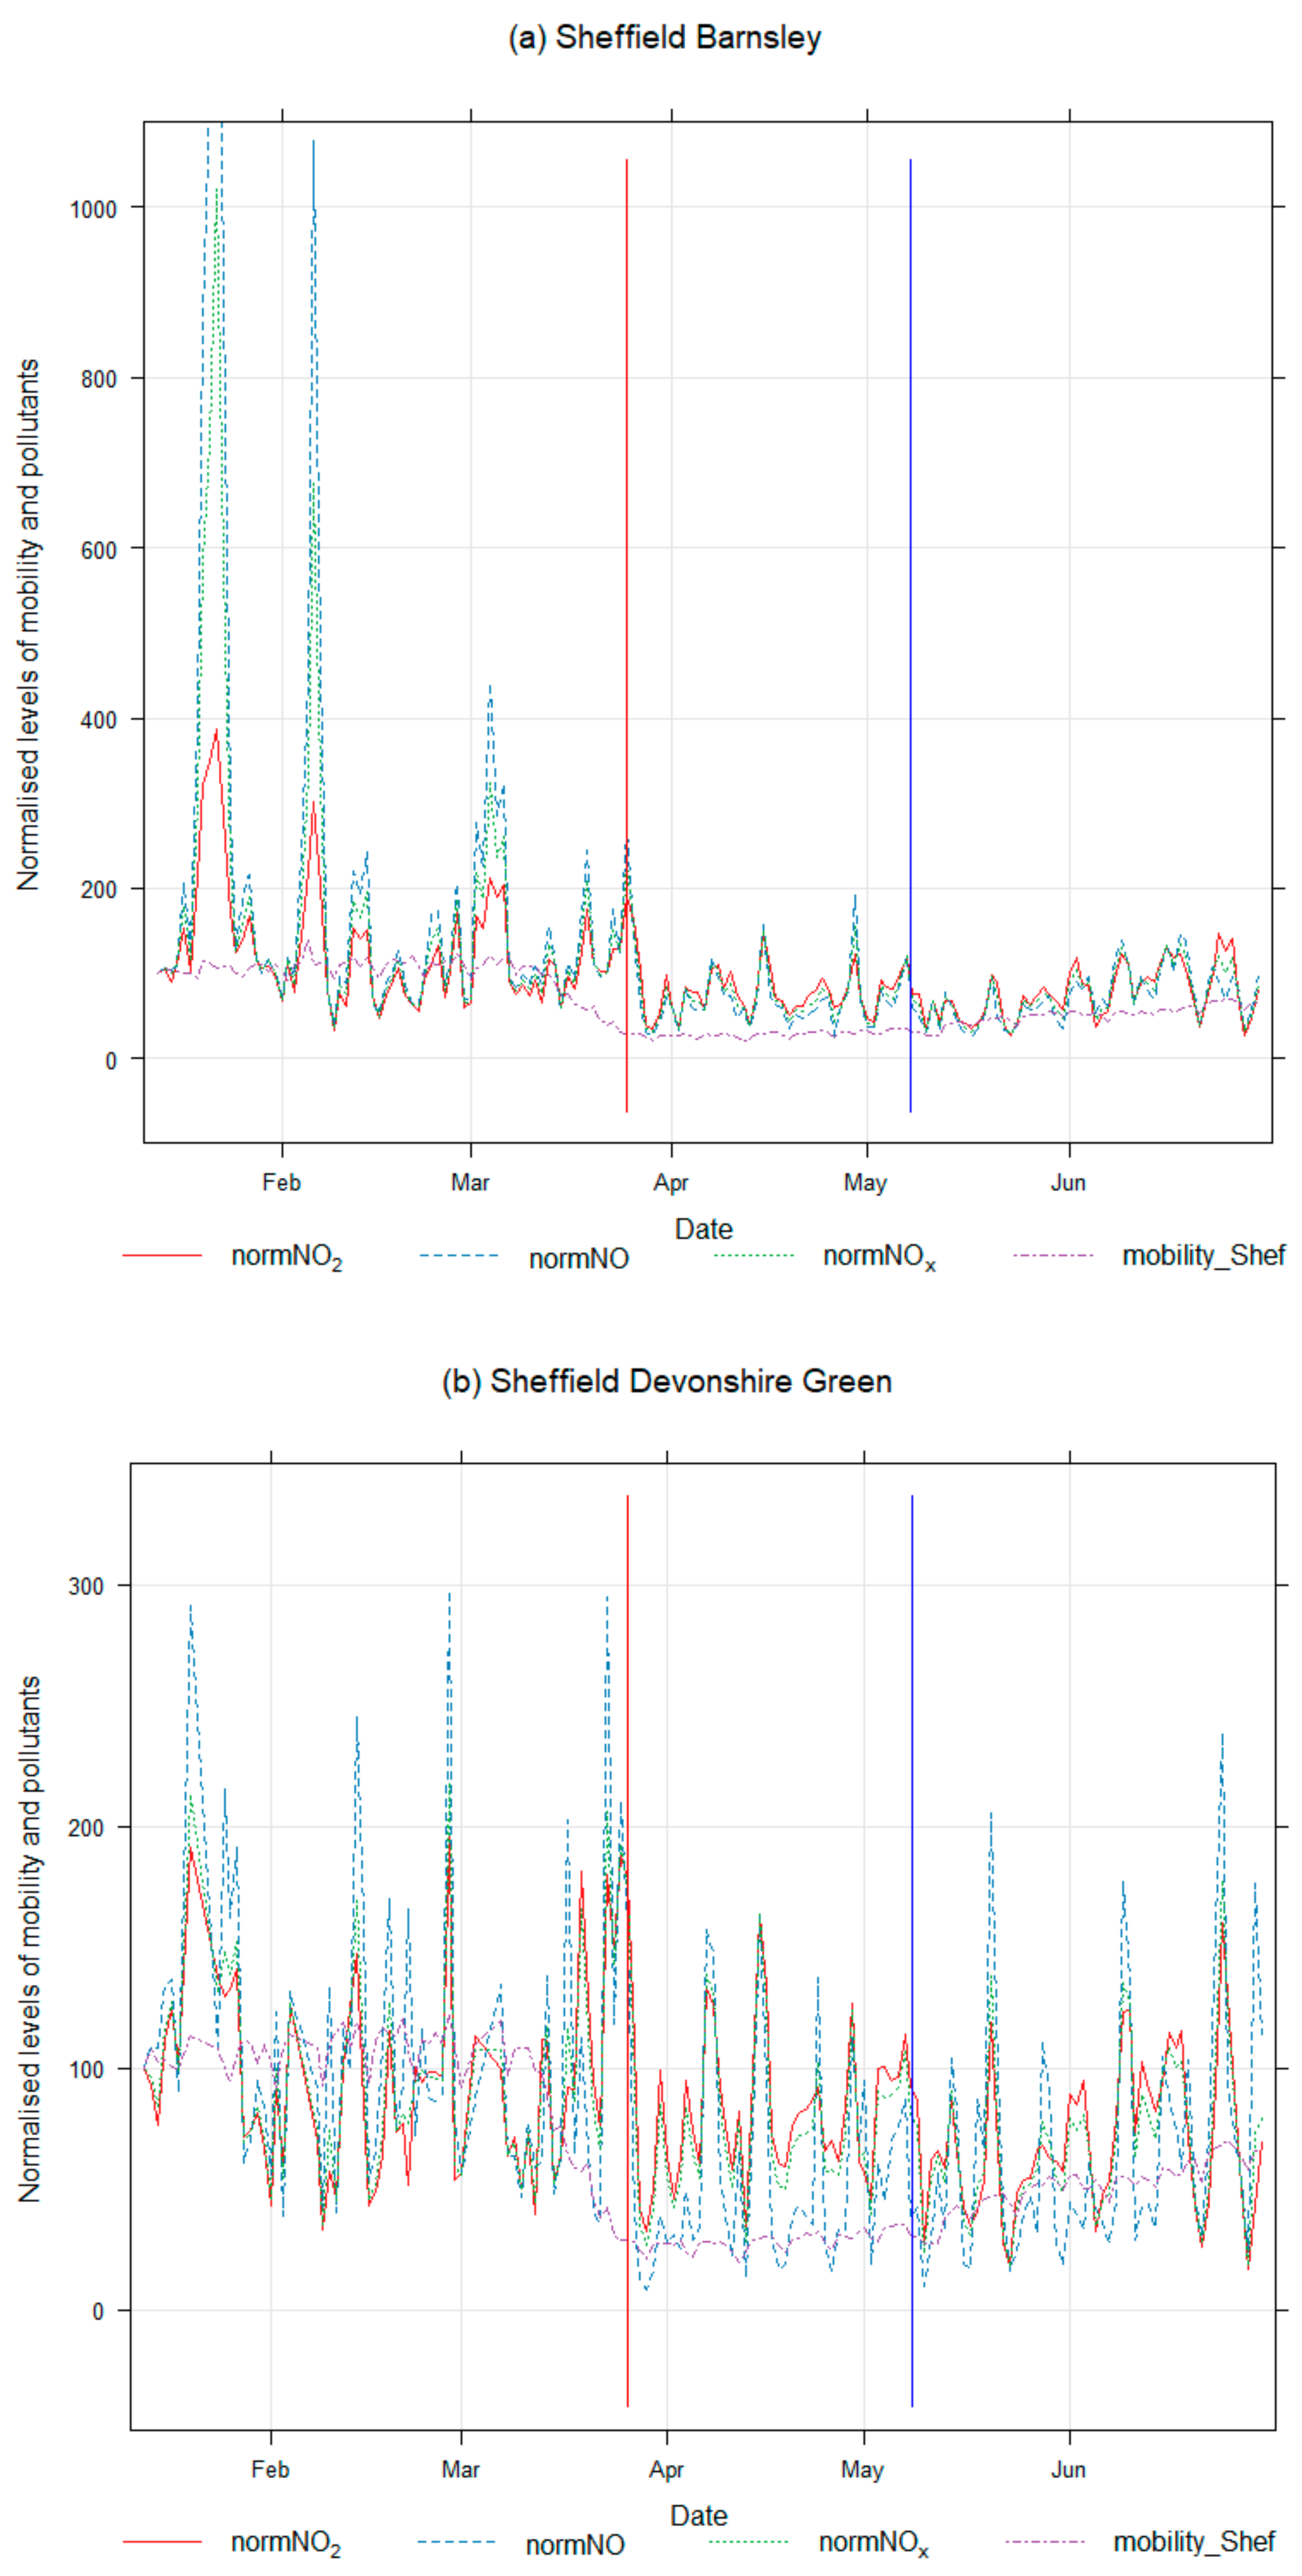
3.3. Relationship between Air Pollutant Concentrations and Mobility
- (a)
- Waste burning (as they were not timely collected and people started burning them in their gardens;
- (b)
- Formation of secondary PM controlled by meteorological conditions and PM emissions precursors;
- (c)
- Regional transport of PM from other polluted regions;
- (d)
- Increase in indoor emissions as more people worked from home and used their indoor heating system more frequently, including wood burner stoves;
- (e)
- Public transport, especially buses, did not stop in many areas during the lockdown period, which did not let the PM levels decrease.
4. Conclusions
Author Contributions
Funding
Data Availability Statement
Acknowledgments
Conflicts of Interest
References
- WHO. Coronavirus Disease (COVID-19). Available online: https://www.who.int/emergencies/diseases/novel-coronavirus-2019 (accessed on 2 February 2021).
- Azevedo, L.; Pereira, M.J.; Ribeiro, M.C.; Soares, A. Geostatistical COVID-19 infection risk maps for Portugal. Int. J. Health Geogr. 2020, 19, 1–8. [Google Scholar] [CrossRef] [PubMed]
- Vinceti, M.; Filippini, T.; Rothman, K.J.; Ferrari, F.; Goffi, A.; Maffeis, G.; Orsini, N. Lockdown timing and efficacy in controlling COVID-19 using mobile phone tracking. EClinicalMedicine 2020, 25, 100457. [Google Scholar] [CrossRef] [PubMed]
- Kroll, J.H.; Heald, C.L.; Cappa, C.D.; Farmer, D.K.; Fry, J.L.; Murphy, J.G.; Steiner, A.L. The complex chemical effects of COVID-19 shutdowns on air quality. Nat. Chem. 2020, 12, 777–779. [Google Scholar] [CrossRef]
- Aina, Y.A.; Van der Merwe, J.H.; Alshuwaikhat, H.M. Spatial and temporal variations of satellite-derived multi-year particulate data of Saudi Arabia: An exploratory analysis. Int. J. Environ. Res. Public Health 2014, 11, 11152–11166. [Google Scholar] [CrossRef] [PubMed] [Green Version]
- Gowers, A.M.; Walton, H.; Exley, K.S.; Hurley, J.F. Using epidemiology to estimate the impact and burden of exposure to air pollutants. Philos. Trans. R. Soc. A 2020, 378, 20190321. [Google Scholar] [CrossRef] [PubMed]
- Wu, X.; Nethery, R.C.; Sabath, M.B.; Braun, D.; Dominici, F. Air pollution and COVID-19 mortality in the United States: Strengths and limitations of an ecological regression analysis. Sci. Adv. 2020, 6, eabd4049. [Google Scholar] [CrossRef] [PubMed]
- Yao, M.; Wu, G.; Zhao, X.; Zhang, J. Estimating health burden and economic loss attributable to short-term exposure to multiple air pollutants in China. Environ. Res. 2020, 183, 109184. [Google Scholar] [CrossRef]
- Travaglio, M.; Yu, Y.; Popovic, R.; Selley, L.; Leal, N.S.; Martins, L.M. Links between air pollution and COVID-19 in England. Environ. Pollut. 2021, 268, 115859. [Google Scholar] [CrossRef]
- Venter, Z.S.; Aunan, K.; Chowdhury, S.; Lelieveld, J. Air pollution declines during COVID-19 lockdowns mitigate the global health burden. Environ. Res. 2021, 192, 110403. [Google Scholar] [CrossRef]
- Kumari, P.; Toshniwal, D. Impact of lockdown on air quality over major cities across the globe during COVID-19 pandemic. Urban Clim. 2020, 34, 100719. [Google Scholar] [CrossRef]
- Pacheco, H.; Díaz-López, S.; Jarre, E.; Pacheco, H.; Méndez, W.; Zamora-Ledezma, E. NO2 levels after the COVID-19 lockdown in Ecuador: A trade-off between environment and human health. Urban Clim. 2020, 34, 100674. [Google Scholar] [CrossRef]
- Rodríguez-Urrego, D.; Rodríguez-Urrego, L. Air quality during the COVID-19: PM2.5 analysis in the 50 most polluted capital cities in the world. Environ. Pollut. 2020, 266, 115042. [Google Scholar] [CrossRef]
- Habibi, H.; Awal, R.; Fares, A.; Ghahremannejad, M. COVID-19 and the improvement of the global air quality: The bright side of a pandemic. Atmosphere 2020, 11, 1279. [Google Scholar] [CrossRef]
- Wang, Q.; Li, S. Nonlinear impact of COVID-19 on pollutions–Evidence from Wuhan, New York, Milan, Madrid, Bandra, London, Tokyo and Mexico City. Sustain. Cities Soc. 2021, 65, 102629. [Google Scholar] [CrossRef]
- Fu, F.; Purvis-Roberts, K.L.; Williams, B. Impact of the covid-19 pandemic lockdown on air pollution in 20 major cities around the world. Atmosphere 2020, 11, 1189. [Google Scholar] [CrossRef]
- Baldasano, J.M. COVID-19 lockdown effects on air quality by NO2 in the cities of Barcelona and Madrid Spain. Sci. Total Environ. 2020, 741, 140353. [Google Scholar] [CrossRef]
- Collivignarelli, M.C.; Abba, A.; Bertanza, G.; Pedrazzani, R.; Ricciardi, P.; Miino, M.C. Lockdown for CoViD-2019 in Milan: What are the effects on air quality? Sci. Total Environ. 2020, 732, 139280. [Google Scholar] [CrossRef]
- Fenech, S.; Aquilina, N.J.; Vella, R. COVID-19-related changes in NO2 and O3 concentrations and associated health effects in Malta. Front. Sustain. Cities 2021, 3, 631280. [Google Scholar] [CrossRef]
- Donzelli, G.; Cioni, L.; Cancellieri, M.; Llopis Morales, A.; Morales Suarez-Varela, M.M. The effect of the Covid-19 lockdown on air quality in three Italian medium-sized cities. Atmosphere 2021, 11, 1118. [Google Scholar] [CrossRef]
- Grivas, G.; Athanasopoulou, E.; Kakouri, A.; Bailey, J.; Liakakou, E.; Stavroulas, I.; Kalkavouras, P.; Bougiatioti, A.; Kaskaoutis, D.G.; Ramonet, M.; et al. Integrating in situ measurements and city scale modelling to assess the COVID–19 lockdown effects on emissions and air quality in Athens, Greece. Atmosphere 2020, 11, 1174. [Google Scholar] [CrossRef]
- Hörmann, S.; Jammoul, F.; Kuenzer, T.; Stadlober, E. Separating the impact of gradual lockdown measures on air pollutants from seasonal variability. Atmos. Pollut. Res. 2021, 12, 84–92. [Google Scholar] [CrossRef] [PubMed]
- Lonati, G.; Riva, F. Regional scale impact of the COVID-19 lockdown on air quality: Gaseous pollutants in the Po Valley, Northern Italy. Atmosphere 2021, 12, 264. [Google Scholar] [CrossRef]
- Marinello, S.; Lolli, F.; Gamberini, R. The impact of the COVID-19 emergency on local vehicular traffic and its consequences for the environment: The case of the city of Reggio Emilia (Italy). Sustainability 2020, 13, 118. [Google Scholar] [CrossRef]
- Piccoli, A.; Agresti, V.; Balzarini, A.; Bedogni, M.; Bonanno, R.; Collino, E.; Colzi, F.; Lacavalla, M.; Lanzani, G.; Pirovano, G. Modeling the effect of COVID-19 lockdown on mobility and NO2 concentration in the Lombardy region. Atmosphere 2020, 11, 1319. [Google Scholar] [CrossRef]
- Tobías, A.; Carnerero, C.; Reche, C.; Massagué, J.; Via, M.; Minguillón, M.C.; Alastuey, A.; Querol, X. Changes in air quality during the lockdown in Barcelona (Spain) one month into the SARS-CoV-2 epidemic. Sci. Total Environ. 2020, 726, 138540. [Google Scholar] [CrossRef]
- Dacre, H.F.; Mortimer, A.H.; Neal, L.S. How have surface NO2 concentrations changed as a result of the UK’s COVID-19 travel restrictions? Environ. Res. Lett. 2020, 15, 104089. [Google Scholar] [CrossRef]
- Jephcote, C.; Hansell, A.L.; Adams, K.; Gulliver, J. Changes in air quality during COVID-19 ’lockdown’ in the United Kingdom. Environ. Pollut. 2021, 272, 116011. [Google Scholar] [CrossRef]
- Shi, Z.; Song, C.; Liu, B.; Lu, G.; Xu, J.; Van Vu, T.; Elliot, R.J.R.; Li, W.; Bloss, W.J.; Harrison, R.M. Abrupt but smaller than expected changes in surface air quality attributable to COVID-19 lockdowns. Sci. Adv. 2021, 7, eabd6696. [Google Scholar] [CrossRef]
- Ropkins, K.; Tate, J.E. Early observations on the impact of the COVID-19 lockdown on air quality trends across the UK. Sci. Total Environ. 2021, 754, 142374. [Google Scholar] [CrossRef]
- Air Quality Expert Group. Fine Particulate Matter (PM2.5) in the United Kingdom; Crown: New York, NY, USA, 2012. [Google Scholar]
- Zhao, Y.; Zhang, K.; Xu, X.; Shen, H.; Zhu, X.; Zhang, Y.; Hu, Y.; Shen, G. Substantial changes in nitrogen dioxide and ozone after excluding meteorological impacts during the COVID-19 outbreak in mainland China. Environ. Sci. Technol. Lett. 2020, 7, 402–408. [Google Scholar] [CrossRef]
- Menut, L.; Bessagnet, B.; Siour, G.; Mailler, S.; Pennel, R.; Cholakian, A. Impact of lockdown measures to combat Covid-19 on air quality over western Europe. Sci. Total Environ. 2020, 741, 140426. [Google Scholar] [CrossRef]
- Solberg, S.; Walker, S.E.; Schneider, P.; Guerreiro, C. Quantifying the impact of the Covid-19 lockdown measures on nitrogen dioxide levels throughout Europe. Atmosphere 2021, 12, 131. [Google Scholar] [CrossRef]
- Lawal, O.; Nwegbu, C. Movement and risk perception: Evidence from spatial analysis of mobile phone-based mobility during the COVID-19 lockdown, Nigeria. GeoJournal 2020, 1–16. [Google Scholar] [CrossRef]
- Li, J.; Tartarini, F. Changes in air quality during the COVID-19 lockdown in Singapore and associations with human mobility trends. Aerosol Air Qual. Res. 2020, 20, 1748–1758. [Google Scholar] [CrossRef]
- Venter, Z.S.; Aunan, K.; Chowdhury, S.; Lelieveld, J. COVID-19 lockdowns cause global air pollution declines. Proc. Natl. Acad. Sci. USA 2020, 117, 18984–18990. [Google Scholar] [CrossRef]
- Munir, S.; Mayfield, M.; Coca, D. Understanding spatial variability of NO2 in urban areas using spatial modelling and data fusion approaches. Atmosphere 2021, 12, 179. [Google Scholar] [CrossRef]
- Apple Inc. COVID-19–Mobility Trends Reports. 2020. Available online: https://www.apple.com/covid19/mobility (accessed on 14 February 2021).
- Ravindra, K.; Rattan, P.; Mor, S.; Aggarwal, A.N. Generalized additive models: Building evidence of air pollution, climate change and human health. Environ. Int. 2019, 132, 104987. [Google Scholar] [CrossRef]
- Bertaccini, P.; Dukic, V.; Ignaccolo, R. Modeling the short-term effect of traffic and meteorology on air pollution in Turin with generalized additive models. Adv. Meteorol. 2012. [Google Scholar] [CrossRef]
- Dehghan, A.; Khanjani, N.; Bahrampour, A.; Goudarzi, G.; Yunesian, M. The relation between air pollution and respiratory deaths in Tehran, Iran-using generalized additive models. BMC Pulm. Med. 2018, 18, 1–9. [Google Scholar] [CrossRef]
- Frengut, J.; Tomar, A.; Burwell, A.; Francis, R. Analysis of real-time particulate matter (PM 2.5) concentrations in Washington, DC, using generalized additive models (GAMs). In Proceedings of the 2020 Systems and Information Engineering Design Symposium (SIEDS), Charlottesville, VA, USA, 24 April 2020; pp. 1–5. [Google Scholar]
- Li, W.; Pei, L.; Li, A.; Luo, K.; Cao, Y.; Li, R.; Xu, Q. Spatial variation in the effects of air pollution on cardiovascular mortality in Beijing, China. Environ. Sci. Pollut. Res. 2019, 26, 2501–2511. [Google Scholar] [CrossRef]
- Wood, S.N. Generalized Additive Models: An Introduction with R; Chapman and Hall/CRC: Boca Raton, FL, USA, 2006. [Google Scholar]
- Hastie, T.J.; Tibshirani, R.J. Generalised Additive Models; Chapman & Hall: London, UK, 1990. [Google Scholar]
- Wood, S. The mgcv Package: Mixed GAM Computation Vehicle with Automatic Smoothness Estimation. Version 1.8–33. 2020. Available online: https://rdrr.io/cran/mgcv/ (accessed on 2 February 2021).
- R Core Team. R: A Language and Environment for Statistical Computing. R Foundation for Statistical Computing: Vienna, Austria, 2020. Available online: https://www.R-project.org/ (accessed on 2 February 2021).
- Carslaw, D.C. The Openair Manual–Open-Source Tools for Analysing Air Pollution Data. Manual for Version 2.6–6; University of York: New York, NY, USA, 2019. [Google Scholar]
- Coskuner, G.; Jassim, M.S.; Munir, S. Characterizing temporal variability of PM2.5/PM10 ratio and its relationship with meteorological parameters in Bahrain. Environ. Forensics 2018, 19, 315–326. [Google Scholar] [CrossRef]
- Schober, P.; Christa Boer, M.; Schwarte, L.A. Correlation coefficients: Appropriate use and interpretation. Anesth. Analg. 2018, 126, 1763–1768. [Google Scholar] [CrossRef]
- Munir, S.; Mayfield, M.; Coca, D.; Mihaylova, L.S.; Osammor, O. Analysis of air pollution in urban areas with Airviro dispersion model—A case study in the city of Sheffield, United Kingdom. Atmosphere 2020, 11, 285. [Google Scholar] [CrossRef] [Green Version]




| City, Country | Pollutant Studied | Reduction (−)/Gain (+) | Reference |
|---|---|---|---|
| Barcelona, Spain | NO2 | −50.0% | [17] |
| Madrid, Spain | −62.0% | ||
| Milan, Italy | PM10 | −39.5% | [18] |
| Milan, Italy | PM2.5 | −37.1% | |
| Milan, Italy | NO2 | −43.1% | |
| Msida, Malta | NO2 | −54.0% | [19] |
| Florence, Italy | −36.0% | [20] | |
| Pisa, Italy | NO2 | −41.0% | |
| Lucca, Italy | −37.0% | ||
| Florence, Italy | PM10 | −31.0%, | [20] |
| Pisa, Italy | PM2.5 | +33.0% | |
| Florence, Italy | PM2.5 | −50.0% | |
| Athens, Greece | NO2 | −32.0% | [21] |
| Athens, Greece | PM2.5 | −18.0% | |
| Graz, Austria | NO2 | −(35.0% to 41.0%) | [22] |
| Po Valley, Italy | NO2 | −40.0% | [23] |
| Reggio Emilia, Italy | NO2 | −30.0% | [24] |
| Reggio Emilia, Italy | PM10 | +46.0% | |
| Milan, Italy | NO2 | −33.0% | [25] |
| Barcelona, Spain | NO2 | −51.0% | [26] |
| Barcelona, Spain | PM10 | −(28.0% to 31.0%) | |
| London, UK | NO2 | −42.0% | [27] |
| Glasgow, UK | −30.0% | ||
| Belfast, UK | −71.0% | ||
| Newport, UK | −26.0% | ||
| Eastbourne, UK | +46.0% | ||
| Chilbolton Observatory, UK | +36.0% | ||
| Reading, UK | +6.0% | ||
| UK | NO2 | −38.0% | [28] |
| UK | PM2.5 | −17.0% | |
| Milan, Italy | NO2 | −16.0% | [29] |
| Rome, Italy | −27.0% | ||
| Madrid, Spain | −35.0% | ||
| London, UK | −8.0% | ||
| Paris, France | −26.0% | ||
| Berlin, Germany | −11.0% | ||
| Rome, Italy | PM2.5 | −1.0% | [29] |
| Madrid, Spain | −24.0% | ||
| London, UK | +11.0% | ||
| Paris, France | +27.0% | ||
| UK | NO2 | −(32.0% to 50.0%) | [30] |
| AQMS | Latitude (y) | Longitude (x) | Code | AQMS Type |
|---|---|---|---|---|
| Sheffield Devonshire Green | 53.378622 | −1.47810 | SHDG | UB |
| Sheffield Barnsley Road | 53.404950 | −1.45582 | SHBR | UT |
| Manchester Piccadilly | 53.481520 | −2.23788 | MAN3 | UT |
| Leeds Headingly | 53.819972 | −1.57636 | LED6 | UT |
| Devonshire Green | Sheffiel Barnsley Rd | Manchester Piccadilly | Leeds Headingly | |||||
|---|---|---|---|---|---|---|---|---|
| Pollutant | LD | PLD | LD | PLD | LD | PLD | LD | PLD |
| NOx | −35.81 | 11.52 | −44.71 | 4.03 | −56.52 | 5.94 | −53.75 | 7.33 |
| NOx(dw) | −44.49 | 12.81 | −50.30 | 4.14 | −57.42 | 7.83 | −49.02 | 0.29 |
| NO2 | −18.06 | 17.35 | −27.93 | 5.49 | −46.55 | 5.02 | −47.15 | 2.89 |
| NO2(dw) | −22.70 | 16.71 | −31.63 | 4.19 | −46.39 | 7.44 | −45.59 | 3.50 |
| NO | −68.26 | 15.99 | −56.68 | 2.30 | −74.16 | 9.33 | −60.35 | 20.97 |
| NO(dw) | −77.59 | 5.93 | −62.74 | 4.03 | −76.12 | 9.86 | −52.35 | 3.15 |
| PM10 | 62.00 | −6.02 | N/A | N/A | 21.96 | −29.09 | 30.86 | −14.87 |
| PM10(dw) | 48.02 | −12.58 | N/A | N/A | 14.45 | −29.08 | 26.04 | −15.77 |
| PM2.5 | 80.31 | −27.24 | 41.43 | −17.67 | 36.24 | −35.79 | 43.87 | −35.93 |
| PM2.5(dw) | 49.34 | −29.46 | 45.94 | −17.56 | 23.05 | −35.45 | 29.59 | −36.25 |
| Sheffield Devonshire | Barnsley Rd | Manchester Piccadilly | Leeds Headingly | |||||||||
|---|---|---|---|---|---|---|---|---|---|---|---|---|
| Air Pollutant | (ug/m3) 2019 | (ug/m3) 2020 | (%) Diff. | (ug/m3) 2019 | (ug/m3) 2020 | (%) Diff. | (ug/m3) 2019 | (ug/m3) 2020 | (%) Diff. | (ug/m3) 2019 | (ug/m3) 2020 | (%) Diff. |
| NO | 32.38 | 18.36 | 43.31 | 23.71 | 12.78 | 46.07 | 9.91 | 3.33 | 66.40 | 21.82 | 6.60 | 69.75 |
| NO(dw) | 31.70 | 17.68 | 44.23 | 23.80 | 12.09 | 49.22 | 10.75 | 3.20 | 70.22 | 21.65 | 7.56 | 65.05 |
| NO2 | 25.85 | 15.29 | 40.83 | 37.59 | 23.64 | 37.13 | 38.30 | 18.80 | 50.90 | 30.37 | 13.50 | 55.54 |
| NO2(dw) | 25.51 | 15.02 | 41.10 | 37.14 | 23.00 | 38.06 | 38.16 | 19.01 | 50.19 | 30.10 | 13.68 | 54.55 |
| NOx | 4.26 | 2.00 | 53.12 | 73.94 | 43.24 | 41.52 | 53.50 | 23.91 | 55.30 | 63.82 | 23.62 | 62.99 |
| NOx(dw) | 4.06 | 1.75 | 57.01 | 73.69 | 41.54 | 43.63 | 54.64 | 23.88 | 56.28 | 63.25 | 25.25 | 60.07 |
| PM10 | 24.54 | 19.87 | 19.02 | N/A | N/A | N/A | N/A | N/A | N/A | 22.00 | 22.52 | 2.36 |
| PM10(dw) | 24.22 | 19.47 | 19.60 | N/A | N/A | N/A | N/A | N/A | N/A | 22.10 | 22.08 | 0.10 |
| PM2.5 | 19.62 | 11.72 | 40.26 | 20.95 | 12.67 | 39.53 | 17.25 | 11.15 | 35.38 | 17.53 | 12.29 | 29.93 |
| PM2.5(dw) | 19.43 | 10.97 | 43.54 | 20.43 | 11.73 | 42.58 | 16.62 | 10.57 | 36.42 | 17.18 | 11.69 | 31.94 |
| Location of AQMS | Air Pollutant | Correlation Coefficient | Type of Correlation |
|---|---|---|---|
| Sheffield Devonshire Green | NO NO2 NOx PM10 PM2.5 | 0.30 0.35 0.33 −0.28 −0.26 | Weak positive Weak positive Weak positive Weak negative Weak negative |
| Sheffield Barnsley Rd | NO NO2 NOx PM10 PM2.5 | 0.39 0.45 0.41 N/A −0.10 | Weak positive Moderate positive Moderate positive N/A Weak negative |
| Manchester Piccadilly | NO NO2 NOx PM10 PM2.5 | 0.48 0.66 0.58 −0.10 −0.10 | Moderate positive Moderate positive Moderate positive Weak negative Weak negative |
| Leeds Headingly | NO NO2 NOx PM10 PM2.5 | 0.51 0.53 0.53 −0.34 −0.19 | Moderate positive Moderate positive Moderate positive Weak negative Weak negative |
Publisher’s Note: MDPI stays neutral with regard to jurisdictional claims in published maps and institutional affiliations. |
© 2021 by the authors. Licensee MDPI, Basel, Switzerland. This article is an open access article distributed under the terms and conditions of the Creative Commons Attribution (CC BY) license (https://creativecommons.org/licenses/by/4.0/).
Share and Cite
Munir, S.; Coskuner, G.; Jassim, M.S.; Aina, Y.A.; Ali, A.; Mayfield, M. Changes in Air Quality Associated with Mobility Trends and Meteorological Conditions during COVID-19 Lockdown in Northern England, UK. Atmosphere 2021, 12, 504. https://doi.org/10.3390/atmos12040504
Munir S, Coskuner G, Jassim MS, Aina YA, Ali A, Mayfield M. Changes in Air Quality Associated with Mobility Trends and Meteorological Conditions during COVID-19 Lockdown in Northern England, UK. Atmosphere. 2021; 12(4):504. https://doi.org/10.3390/atmos12040504
Chicago/Turabian StyleMunir, Said, Gulnur Coskuner, Majeed S. Jassim, Yusuf A. Aina, Asad Ali, and Martin Mayfield. 2021. "Changes in Air Quality Associated with Mobility Trends and Meteorological Conditions during COVID-19 Lockdown in Northern England, UK" Atmosphere 12, no. 4: 504. https://doi.org/10.3390/atmos12040504
APA StyleMunir, S., Coskuner, G., Jassim, M. S., Aina, Y. A., Ali, A., & Mayfield, M. (2021). Changes in Air Quality Associated with Mobility Trends and Meteorological Conditions during COVID-19 Lockdown in Northern England, UK. Atmosphere, 12(4), 504. https://doi.org/10.3390/atmos12040504


