1. Introduction
Haifa Bay Area (HBA) is one of Israel’s largest metropolises and contains its principal industrial area. The latter includes heavy industry, such as refineries and a petrochemical complex, a power plant, petrol and chemical storage tanks, distribution centers, and many small industrial plants (such as metal processing, chemical and pharmaceutical factories, garages, printing houses, and others). In addition, the unique topography of the area results in complex local micrometeorological conditions that affect the atmospheric dispersion of emitted pollutants.
Air pollution measurements in HBA are not available for the period before the early 1980s. The combination of intense industrial activity and lack of emission control measures suggests elevated levels of various air pollutants in the 20th century. Anecdotal evidence can be found in an epidemiological study that reported very high monthly mean and maximal monthly concentrations of SO
2 in 1982–1984 in two HBA locations [
1]. The maximal concentrations exceeded the current hourly standard (350 µg/m
3) in both locations almost every month in the study period. Despite a dramatic decline in the emissions of most of the criteria air pollutants, the current HBA’s emissions inventory is still very high in some cases and for specific pollutants. Specifically, the Haifa region volatile organic compounds (VOC) emissions are the largest in Israel per unit area.
An extensive air quality monitoring (AQM) array was established in HBA in the early-1980s. It has expanded since then to include about 20 stations, which observe various criteria pollutants: SO2, particulate matter (PM, including PM10 and PM2.5), CO, ozone, and nitrogen oxides (NOx). The AQM array was the first in Israel to include a four VOC analyzer for benzene, toluene, ethylbenzene, and xylene (BTEX) since the early 2000s in two stations and many more AQM stations since 2015. A nationwide biweekly sampling of about 15 additional VOCs commenced by the Ministry of Environmental Protection in the second decade of the 21st century. Since 2015 it has included eight locations in HBA and a different background site 20 km away. The samples are also analyzed for concentrations of seven metals in the particulate matter (arsenic, cadmium, chromium, lead, mercury, nickel, and vanadium).
Despite the high emissions inventory, the ambient concentrations of all the pollutants observed by HBA’s extensive AQM array are similar or lower than the corresponding concentrations in other major urban centers in Israel. They have been so since the early 2000s. Specifically, the concentration of NO
x, the best proxy to ultrafine PM [
2], is about 40% of those observed in Tel Aviv, the largest metropolis in Israel [
2,
3,
4]. In addition, the concentrations of VOCs and particulate metals observed by the biweekly sampling are similar or lower than corresponding observations in the rest of the country.
In the long term, VOCs are mostly known for increasing the risk of various malignancies [
5,
6]. In the short term, and specifically for exposure through inhalation—which is the most relevant exposure pathway in the current context—VOCs such as BTEX, aldehydes, and PAHs irritate the respiratory tract in children [
6,
7,
8,
9], and mechanistic explanations for this effect are generally known [
8,
10]. Children are more sensitive to environmental pollution because their lungs are still developing, their ventilation rate is higher, their airways are smaller, and they spend more time outdoors. A previous report showed that HBA presents the highest pediatric hospitalizations incidence due to asthma in Israel (114.5 per 100,000 children: more than twice the Tel Aviv area incidence and 7-fold the Jerusalem area rate) [
11]. High levels of environmental exposure to specific metals have deleterious clinical outcomes [
12], and metal contents in aerosols are associated with asthma in several independent epidemiological studies [
13,
14].
There is substantial public concern about excess morbidity in HBA, particularly for malignant, cardiovascular, and respiratory diseases. Given that these illnesses are affected by chronic exposures, current morbidity may have been impacted by past exposures that no longer exist in the area. Therefore, to study factors that influenced current, recent, or past morbidity, one must obtain some exposure assessment based on historical measures.
Previous epidemiological studies mainly used variations of ecological study designs, in which both exposures and outcomes were assessed using aggregated measures, without any individual-level data [
15,
16,
17,
18,
19]. One exception for this design is a study on cancer incidence in adults, in which individual-level cancer incidence data was used, but no exposure assessment was made [
20]. Furthermore, these studies examined associations with criteria pollutants (such as NO
x, SO
2, or PM) but not with VOCs or metals. The ecological design in epidemiology is methodologically inferior since it is prone to the “ecological fallacy” [
21] and is highly susceptible to confounding. It cannot be used to test epidemiological hypotheses, and its primary use in modern epidemiology is limited to generating new ideas. Besides, criteria pollutants do not represent the unique exposures at HBA and cannot be attributed to industrial emissions (SO
2 is an exception to this under certain assumptions, as explained below). Therefore, the existing epidemiological literature on HBA cannot teach us much about the possible health effects of specific industrial HBA emissions on the HBA population.
Due to HBA complex topography and wind field, it is unknown how pollutant emissions disperse in space and whether exposure to industrial pollutant emissions has any health effects on HBA residents. These fundamental questions are highly dependent and require a new approach that will overcome three major obstacles. Firstly, most VOCs and toxic metals are rarely measured. The methods to measure them are technically complicated and expensive. Secondly, the complex topography of HBA and its effects on wind patterns make it very challenging to model spatial patterns of air pollutant concentrations. The cost of a full-scale, highly spatially resolved model is prohibitive, but simple dispersion models without data assimilation of AQM data are insufficient. Thirdly, emissions from the HBA industry changed with time, and even in the late 1990s, there was no substantial air monitoring.
This study examines associations between exposure to air pollution emitted by HBA industries with the prevalence of asthma and other atopic diseases at the age of 17. It estimates these associations using a new approach for exposure assessment. Accordingly, we have developed a new exposure model to estimate historical exposure to air pollution from the HBA industry. This model is based on historical SO2 measurements from when these measurements can be attributed to industrial sources in HBA. The study is unique since this exposure does not represent a specific pollutant but is meant to represent a mix of measured and unmeasured contaminants from the industrial area. The exposure estimates were linked to the Israeli medical corps database that included health examinations for all Israeli candidates for mandatory military service between 1967 and 2017.
2. Methods
2.1. Study Design and Study Population
This is a cross-sectional study. The study population included all adolescents aged 16–18 born in Israel and whose medical status was evaluated for mandatory military recruitment by the Israeli medical corps during 1967–2017 (n = 2,523,745). Ethical permission for the study was granted by the ethics committee of the medical corps institutional review board.
2.2. Outcome Assessment
Identifications of health outcomes at regional military recruitment centers have been described previously [
22]. Briefly, as part of a medical assessment to mandatory military service, Israeli adolescents routinely undergo a medical evaluation approximately at the age of 17 years. The medical assessment includes a thorough review of medical history made by a physician and a physical examination. Abnormal findings are followed by additional tests and consultation, as appropriate. Subsequently, a specific standardized numerical code is assigned to each examinee to denote a medical diagnosis documented in a central database. This database was used recently in several epidemiological studies [
22,
23,
24,
25,
26,
27].
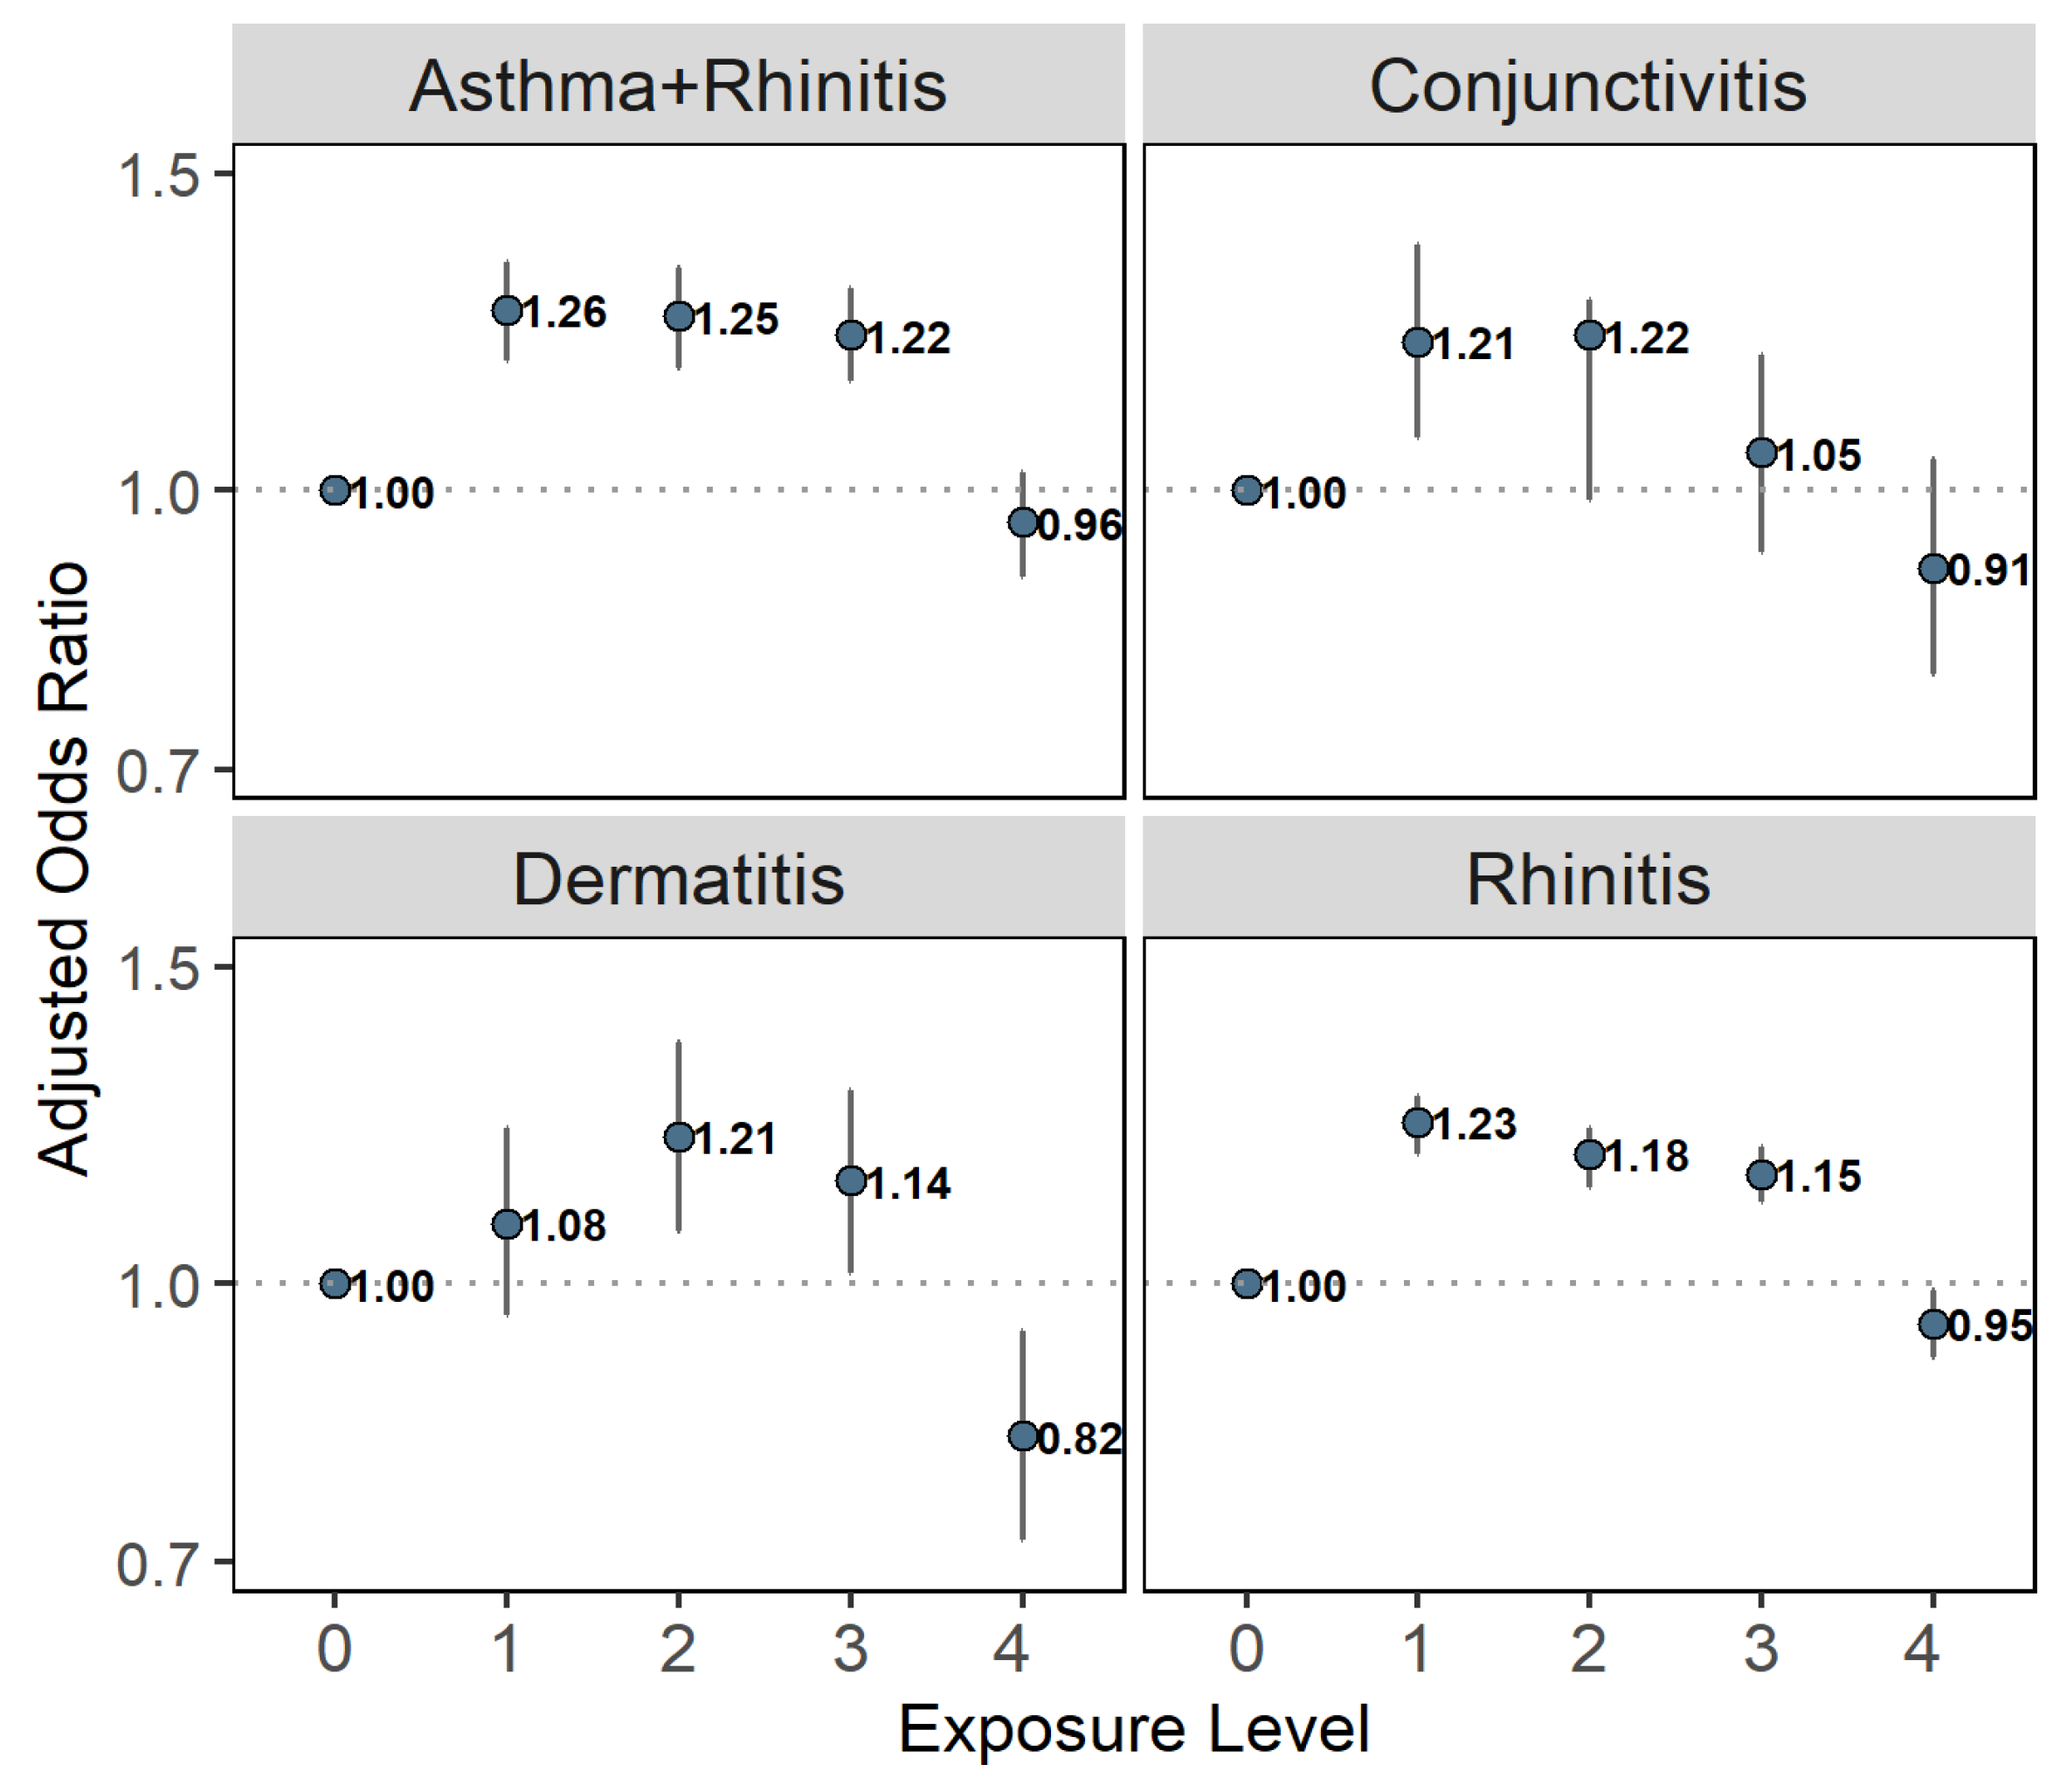
The health outcomes were prevalent asthma, allergic rhinitis, atopic dermatitis, and rhinoconjunctivitis for the current study. Asthma has been a reason for rejection from combat military service to noncombat services, hence suspected asthma cases are strictly evaluated by the medical corps. Subjects with a known diagnosis of these conditions were obliged to provide a documented diagnosis made by a relevant specialist (dermatologist, pulmonologist, or allergist) stating their current disease status and current medical treatment. Examinees suspected of having an undiagnosed illness at the time of medical evaluation were referred for further medical assessment by the relevant specialist. An appropriate board-specific specialist approved any diagnostic code for the study outcomes [
28].
2.3. Exposure Data
The AQM array in HBA included during the study period up to 26 stations, which observed selected ambient pollutants and meteorological variables. This work uses only the SO
2 concentrations data observed when the number of SO
2 analyzers reached its maximum of 21.
Figures S1 and S2 show the 21 SO
2 monitoring sites’ locations and the number of stations that monitored SO
2 per year in 1991–2016.
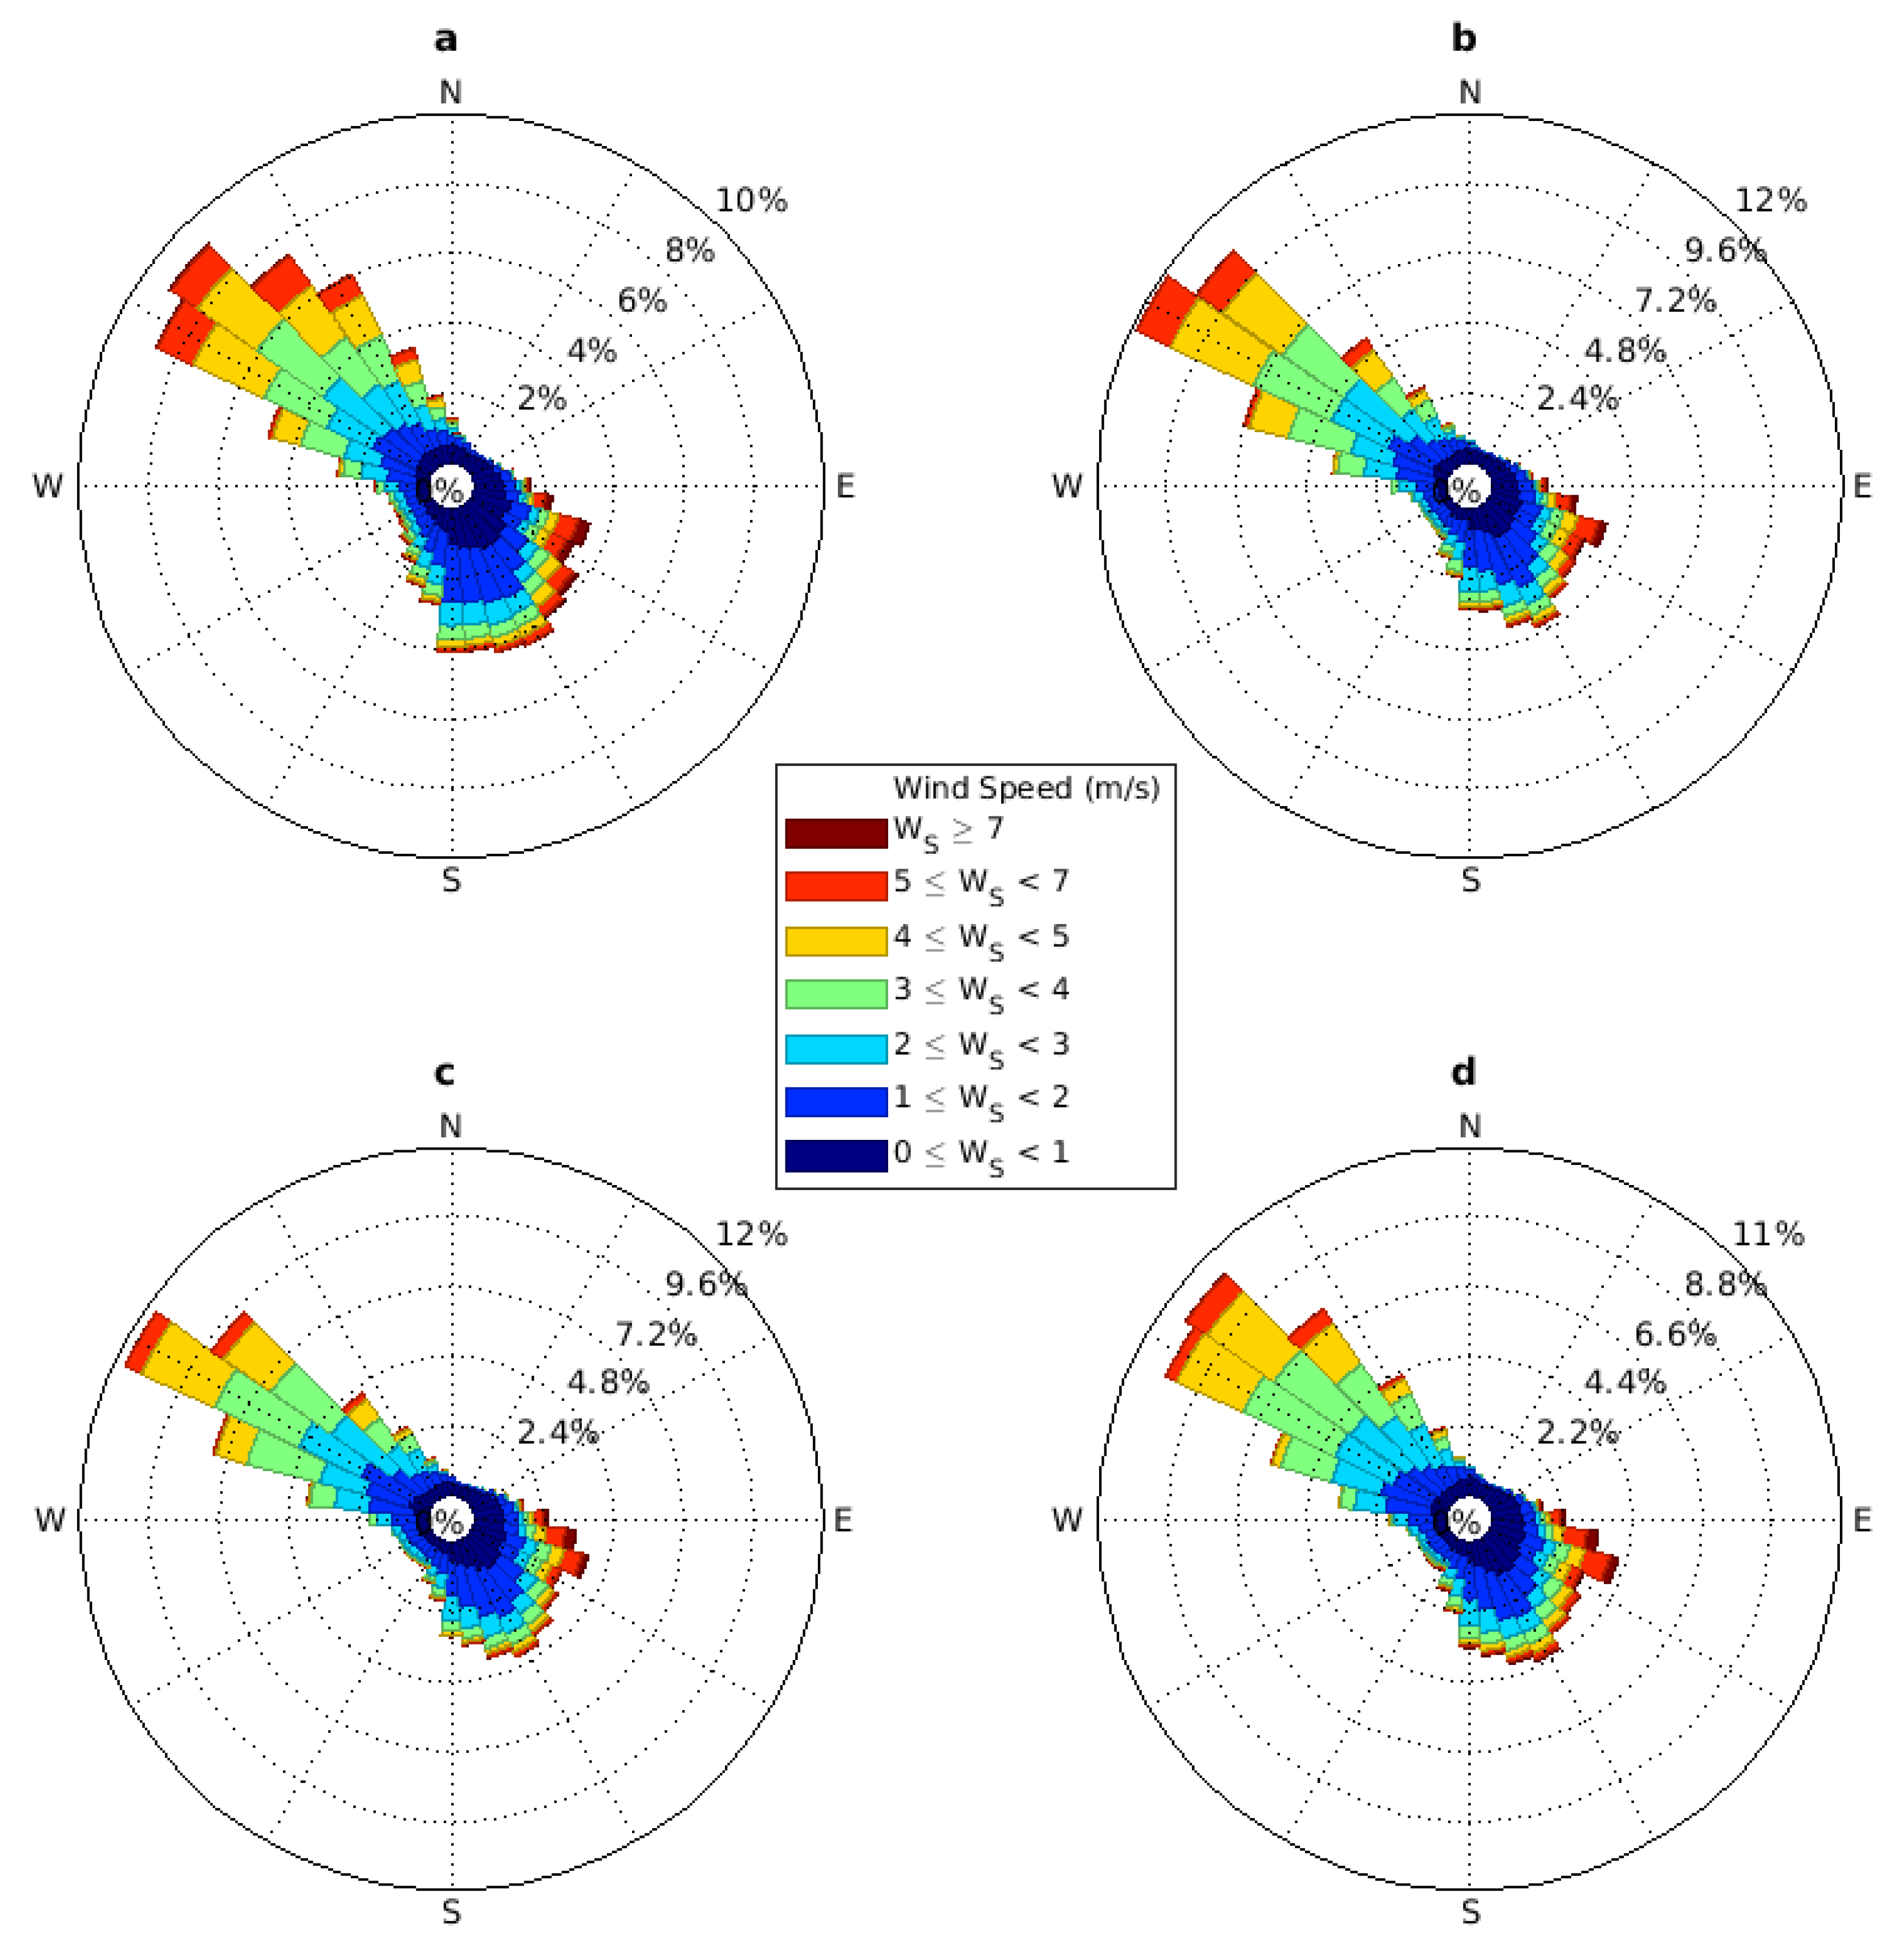
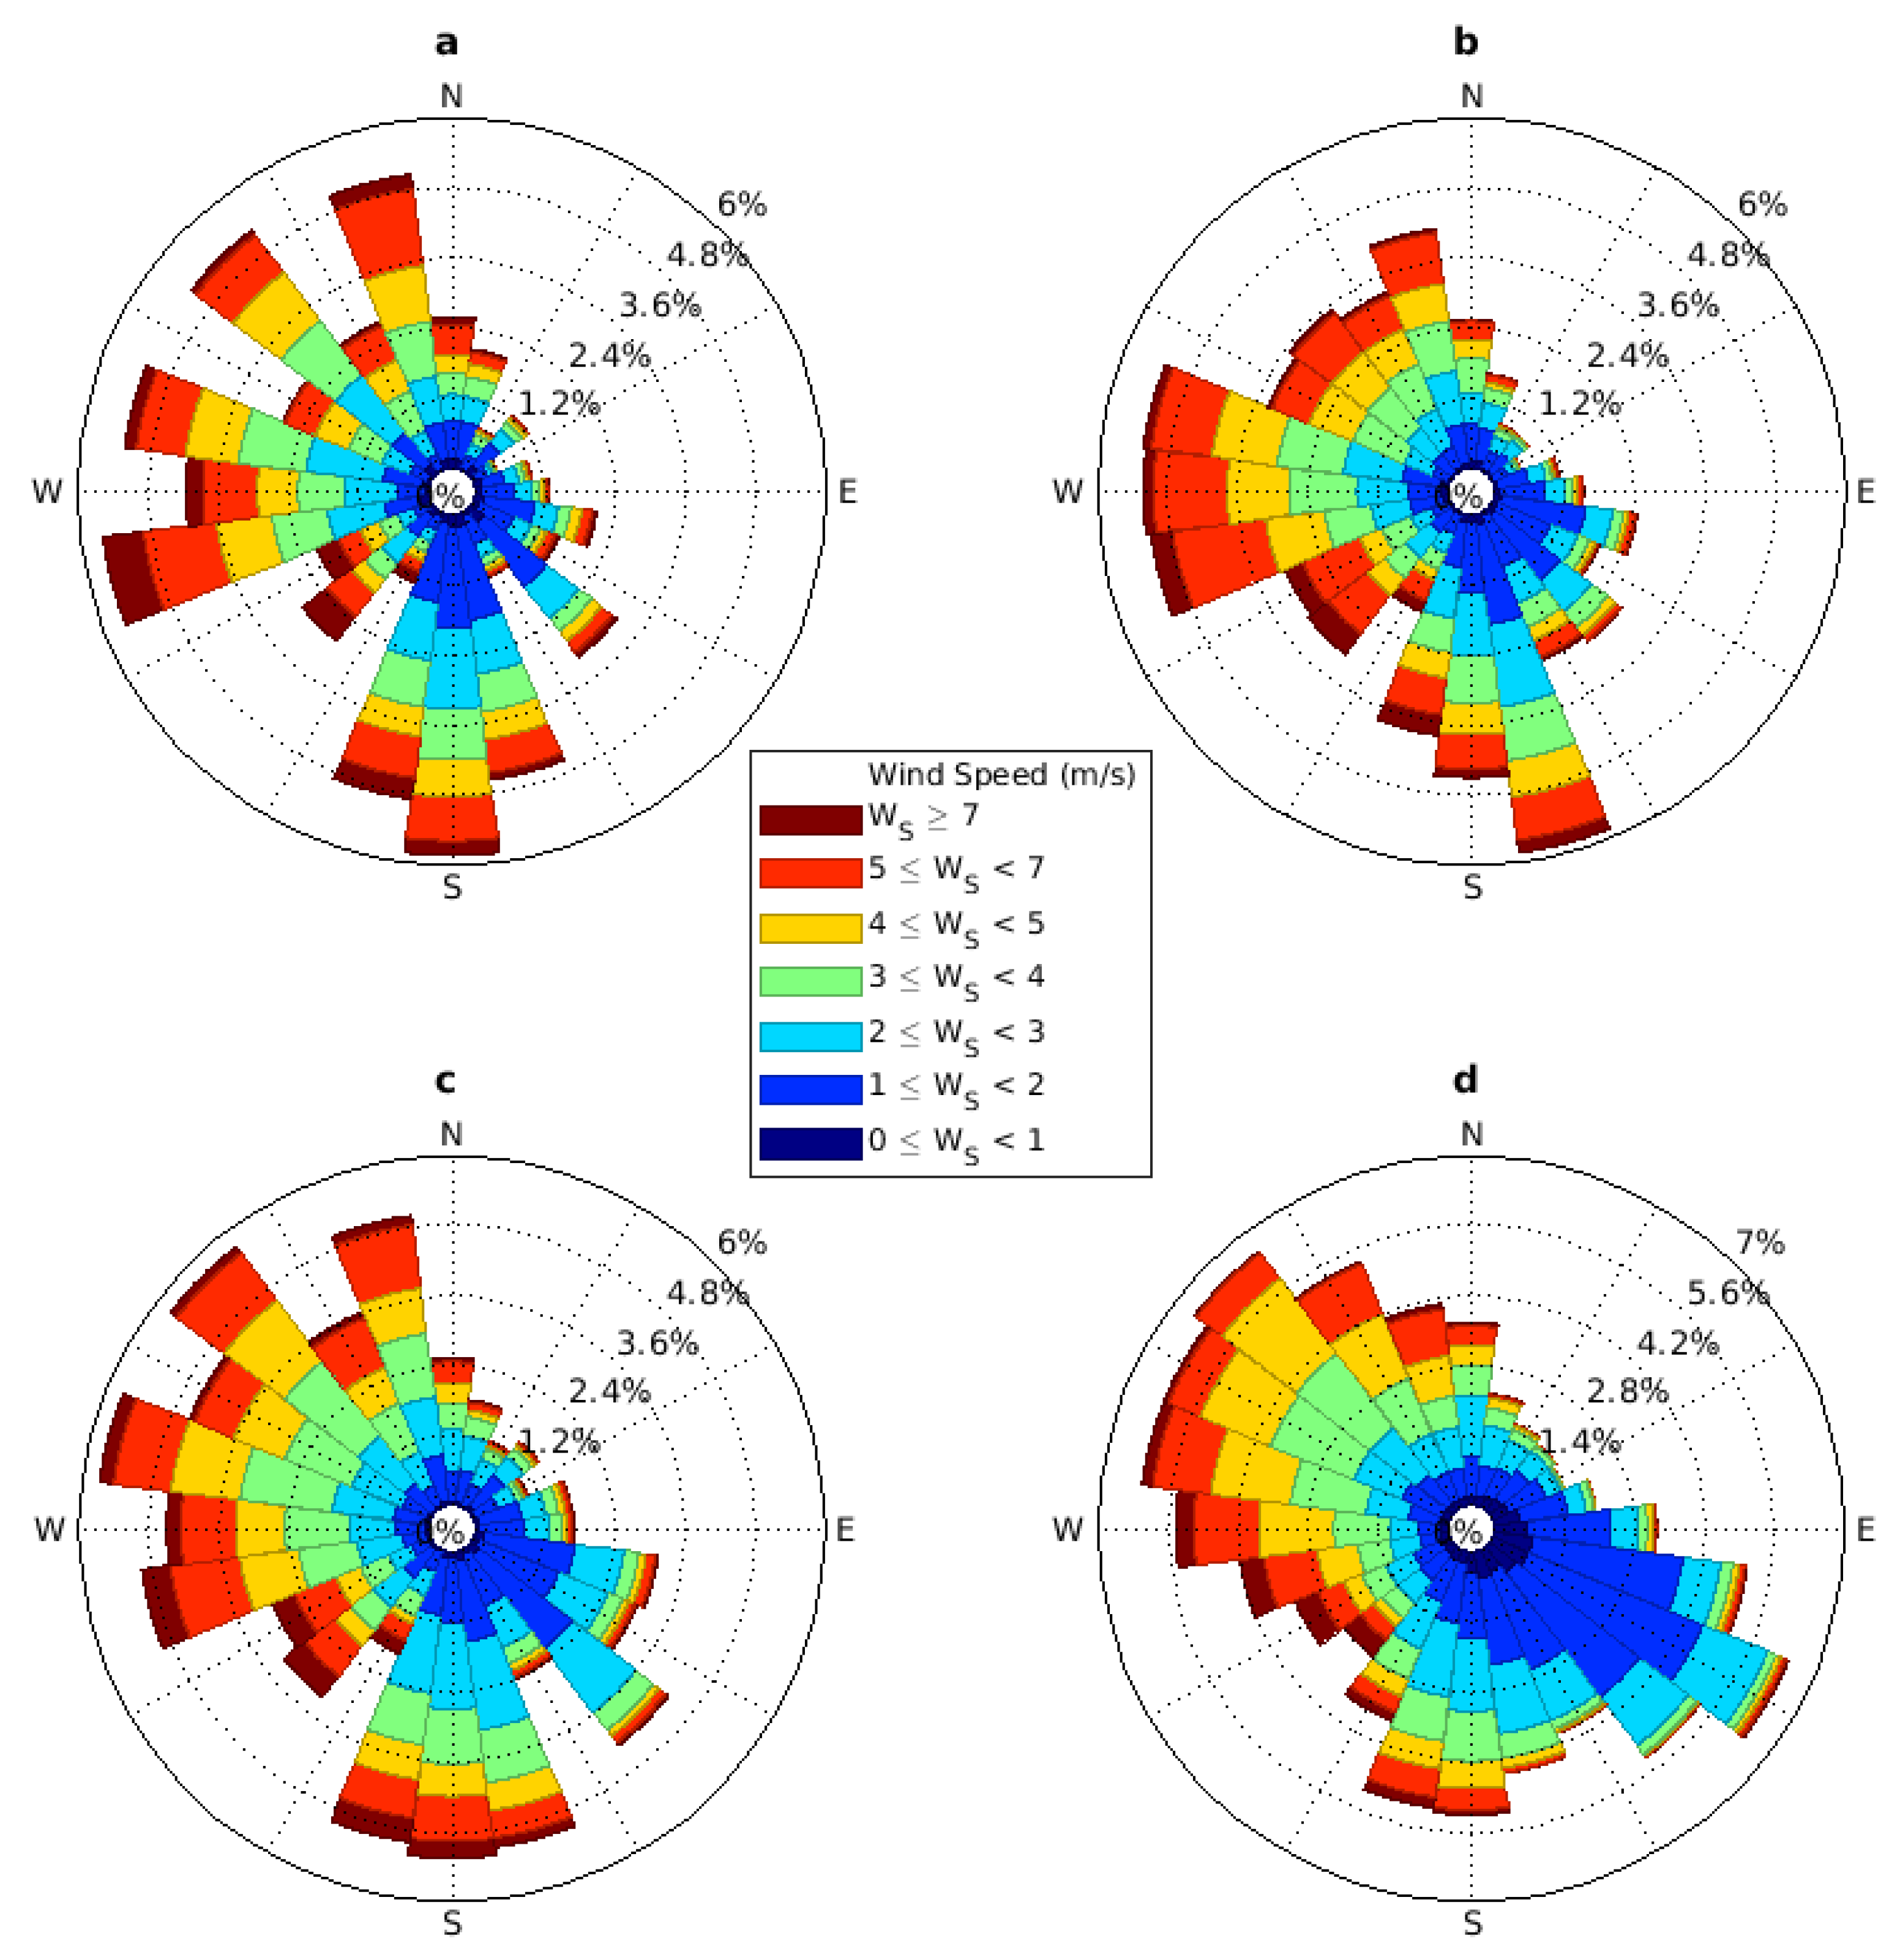
Meteorological variables were observed by many of the HBA air quality stations and by four meteorological stations operated by the Israeli Meteorological Service (IMS). For this work, only the 10-min resolution wind data (direction and speed) from the IMS Afeq station, away from the Carmel ridge and representing regional airflow patterns, were used (its location is shown in
Figure S1). To get an idea about possible long-timescale changes in the typical wind patterns, we also used data from the Bet Dagan station (100 km south of HBA), which has operated since 1970. Historical Bet Dagan wind data at three h resolution were extracted for 1971–2000. The manually-operated Bet Dagan station was replaced in the early 2000s by an automatic station, reporting at a 10-min resolution. Three hour averages were extracted from the new records to continue the measures of the historic station.
2.4. Exposure Assessment: Rationale and Method
Lack of emission inventories and monitoring data for most of the study period forms a formidable hindrance in specifying the exposure to specific industry-sourced pollutants in HBA. Thus, we have decided to use a proxy variable to represent the spatial pattern of relative exposure intensities to ambient concentrations of pollutants emitted by the industrial complex to be used for the entire study period. A good candidate for such a proxy is the pattern of ambient SO2 concentrations. Several considerations justify but also somewhat constrain its use for this purpose:
- (1)
Exposure to pollution from HBA industrial emissions occurs only where the emitted pollution can be transported by airflows previously passed by the industrial stacks. Thus, the industrial center location, the boundaries of residential areas, and the typical wind patterns that can bring air from the former to the latter are the most critical general considerations.
- (2)
Since the late 1970s, heavy industry and, to a lesser degree, the seaport were the only substantial emitters of SO
2 in HBA [
29]. In recent years, with the port remaining by far its largest source, SO
2 levels have been shallow and close to the monitoring analyzer’s detection and quantification limits. Thus, we assume that SO
2 observations at the beginning of the 21st century, which were higher by a factor of 4–10 compared with current levels (
Figure S3), were dominated by HBA heavy industry emissions. Background SO
2 concentrations are not negligible [
30]. Still, they can be considered in the limited aerial extent of HBA to be homogeneous without impacting the shape of the SO
2 spatial patterns.
- (3)
We expect SO2 dispersion and the shape of its spatial concentrations pattern to be similar to those of other industrial pollutants with comparable or a longer atmospheric lifetime.
- (4)
Dispersion of industry-emitted pollutants with atmospheric lifetime shorter than that of SO2 (e.g., most VOCs) may result in different spatial patterns. Still, we expect that their dispersion lobes’ central axes will be along those of the SO2 spatial distribution (i.e., they will be contained within those of the SO2).
- (5)
Use of the observed SO2 concentrations in the early years of the 21st century for assessing exposures to industrial pollution emitted in the last decades of the 20th century is warranted, only if the relevant meteorological factors (mainly the wind field) have not changed substantially. This is indeed the case in HBA (see below).
- (6)
Due to the possible large decline in industry-born ambient concentrations during the study period, driven by a parallel reduction in the industrial emissions, an analysis using the spatial SO2 pattern must account for its temporal concentration variability.
- (7)
SO
2 spatial patterns based on relatively sparse observed concentrations (at the AQM stations) might be affected by the locations of the observations [
31]. To minimize this effect, it is desirable to use as many observation sites as possible (see
Figure S2). Still, reliance on small-scale details of the spatial patterns should be avoided, and only their general outline should be used.
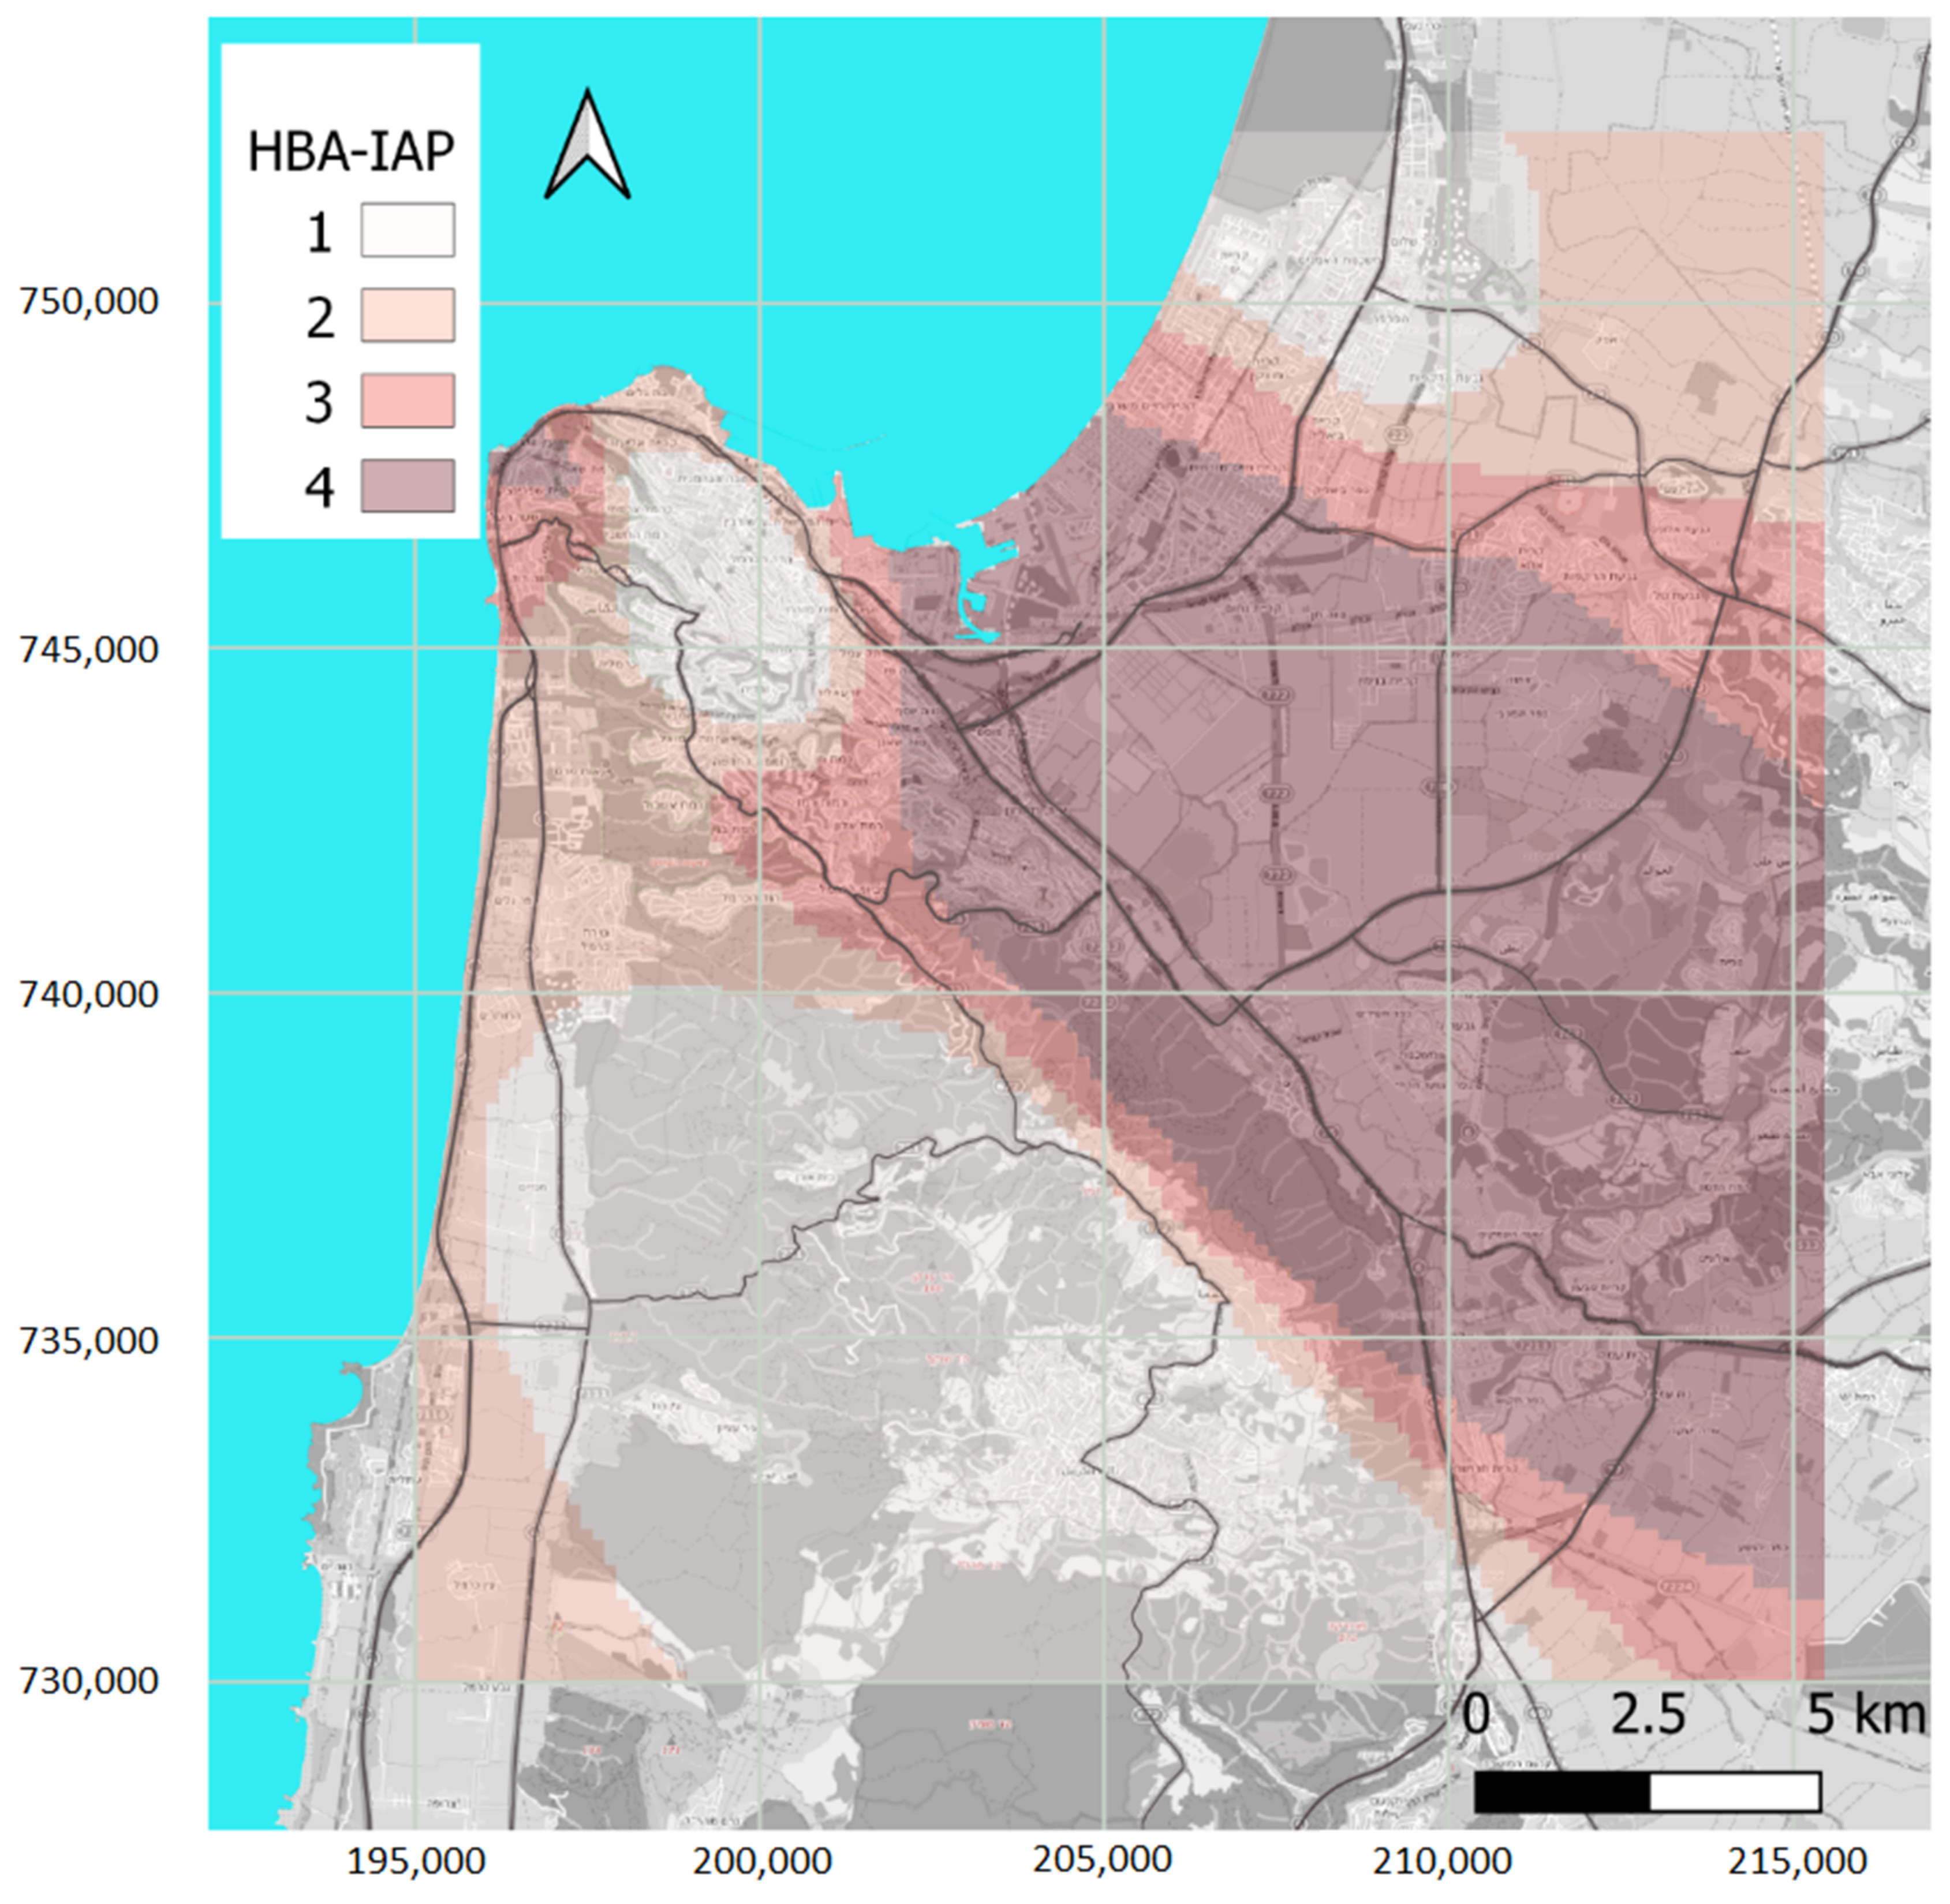
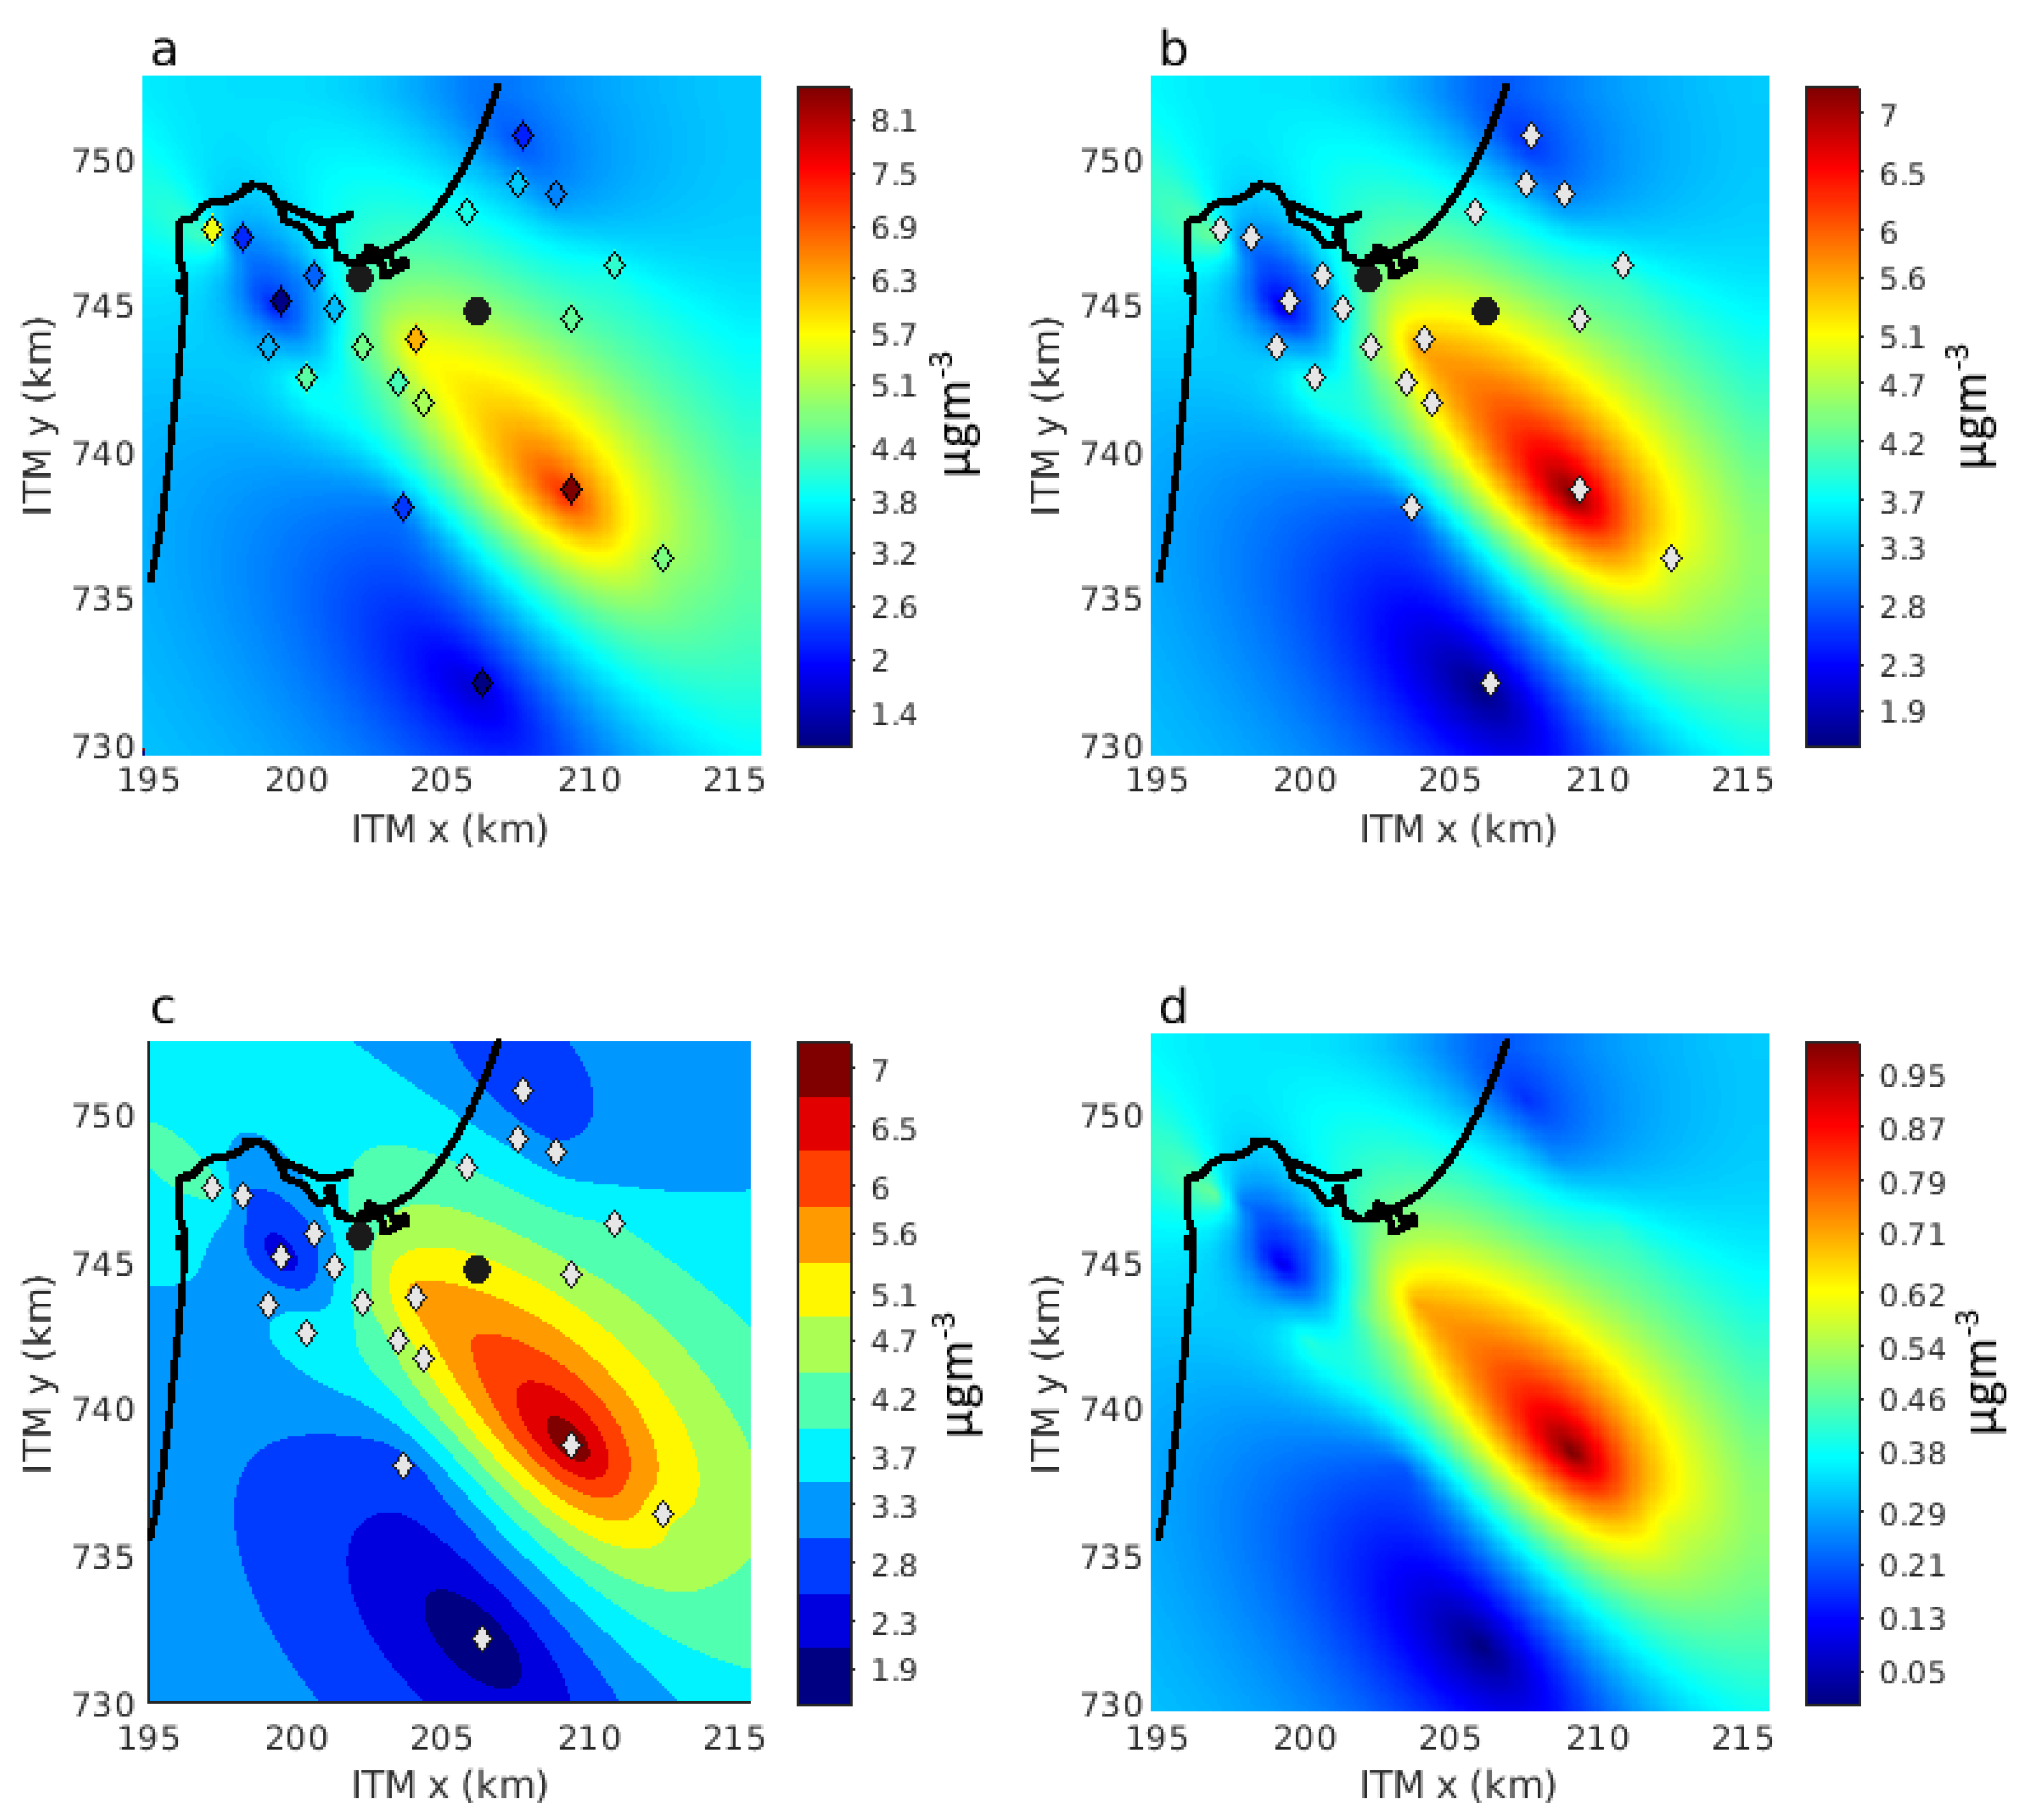
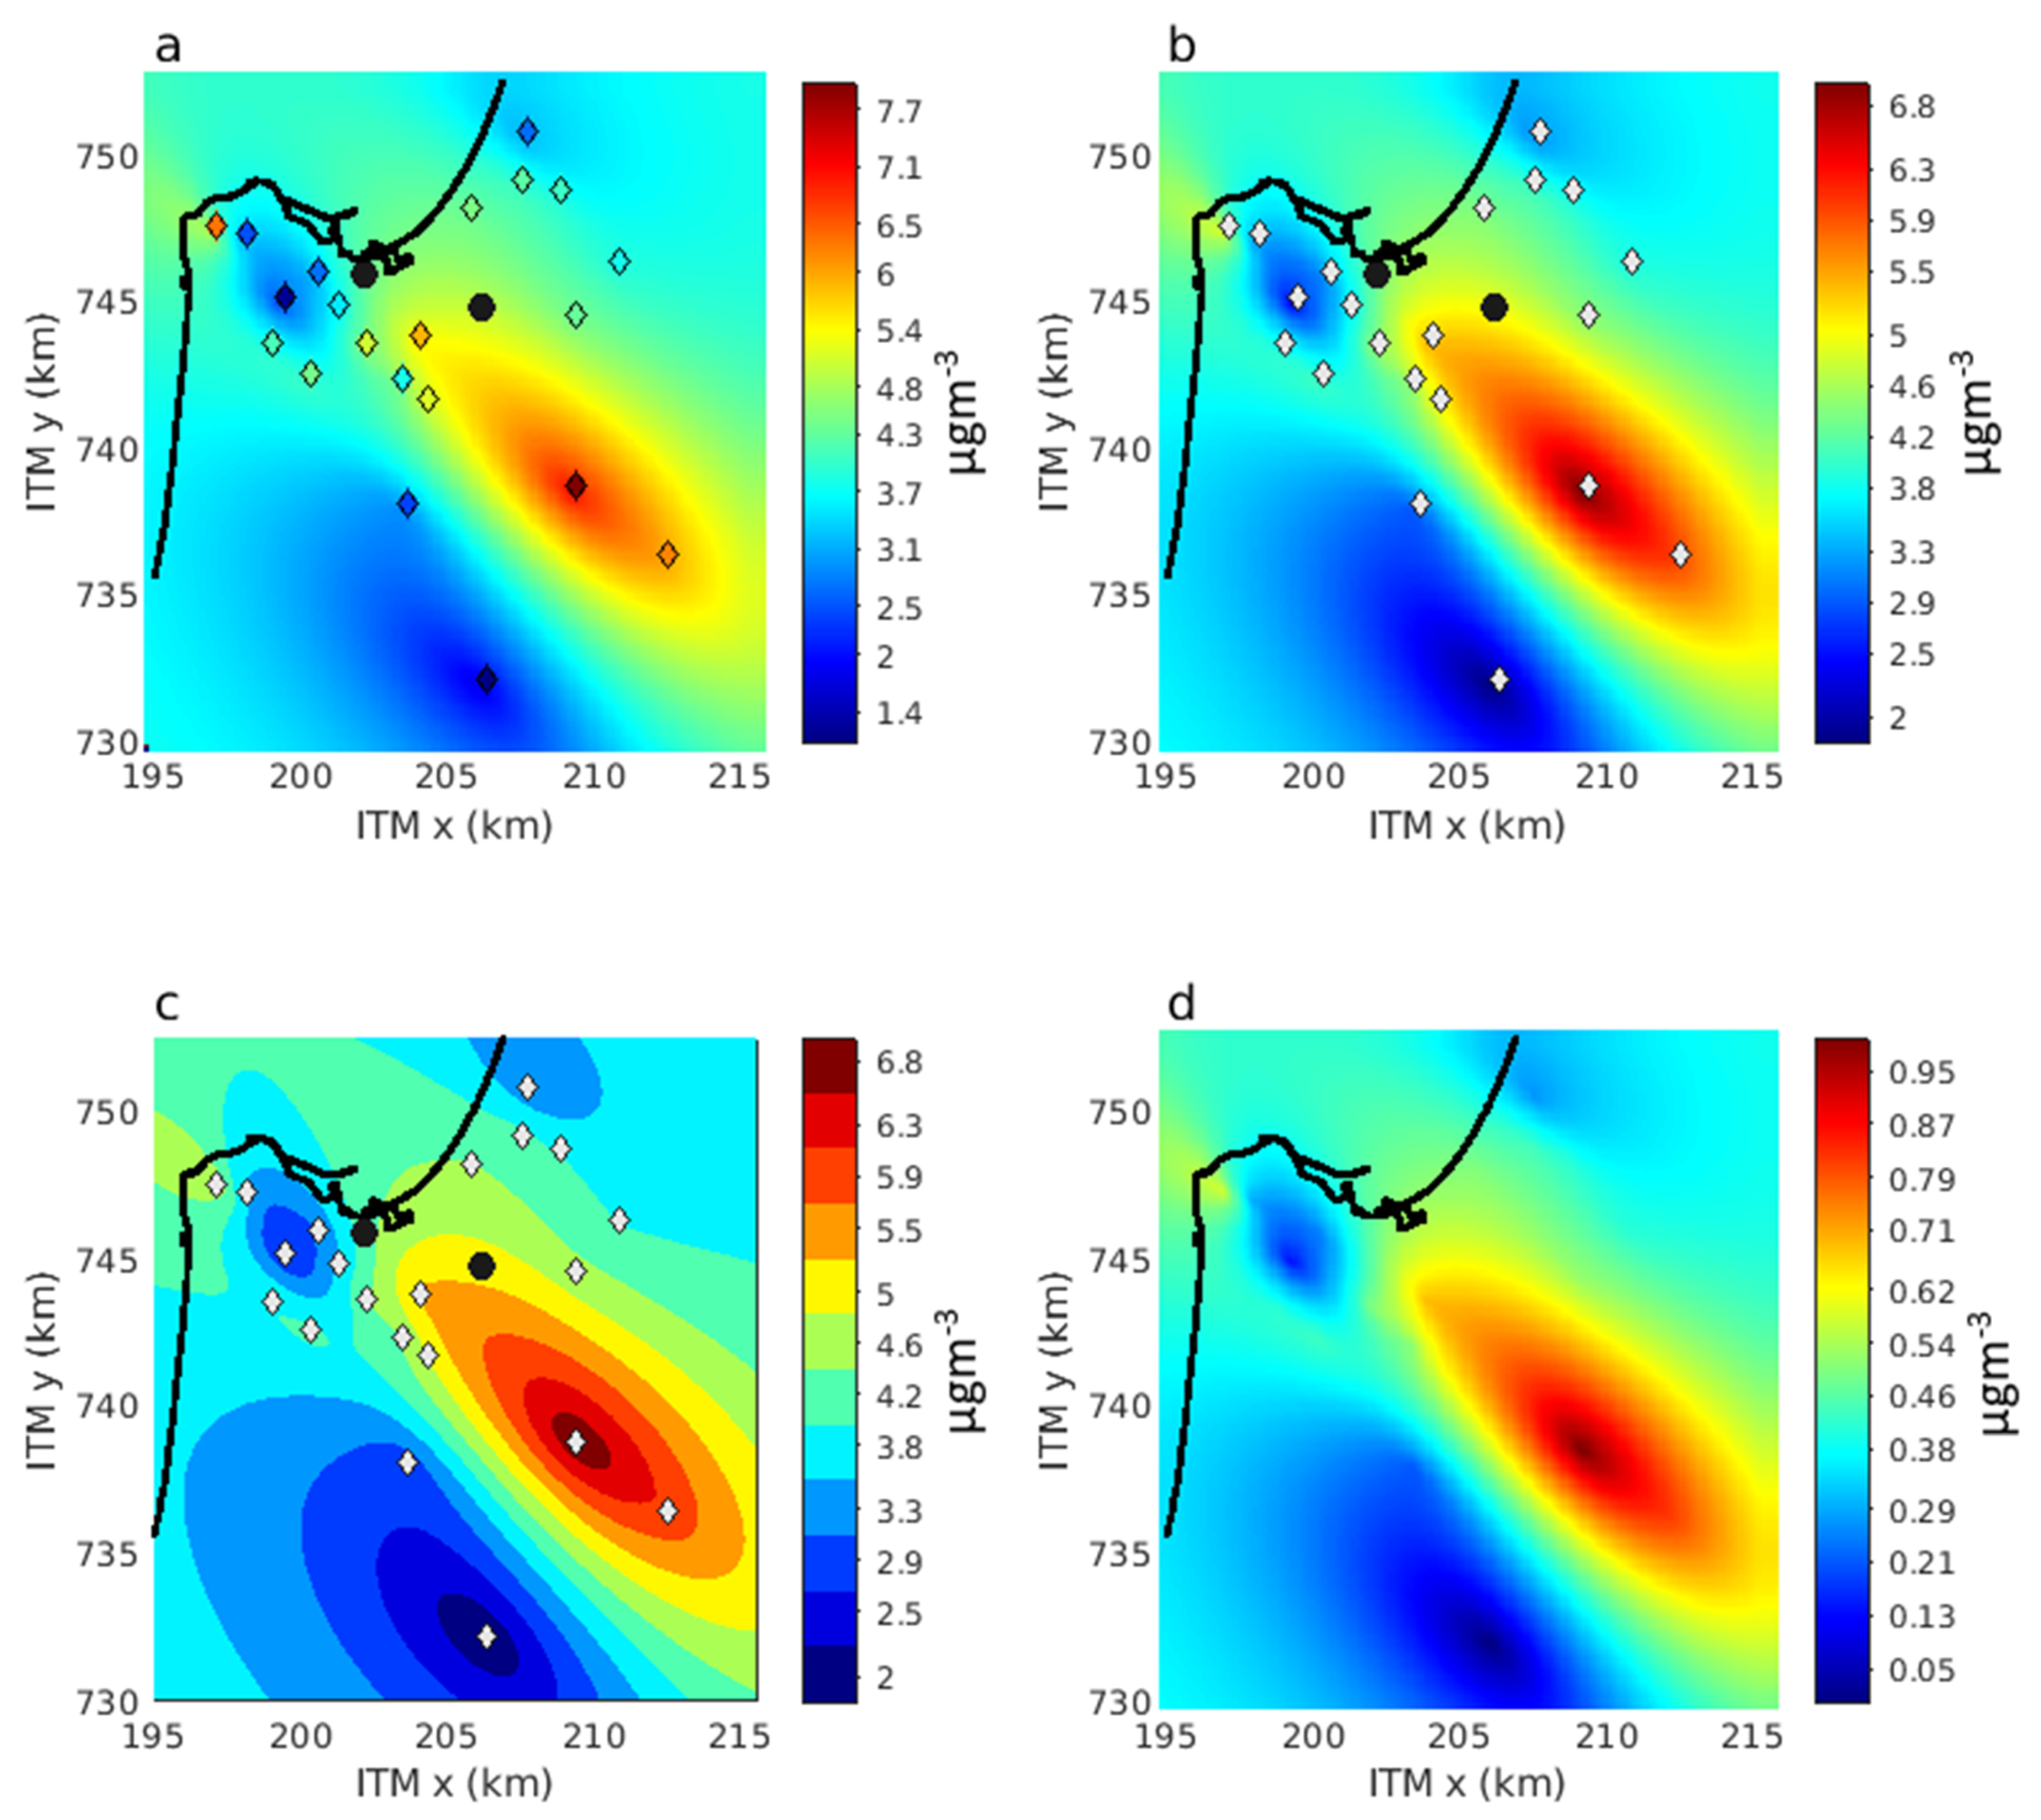
Given these considerations, we estimated the exposure to industrial emissions by a kriging interpolation of the 2002–2004 mean SO
2 observations. During this period, the number of SO
2 monitoring stations was maximal (
Figure S2), and the ambient concentrations were still relatively high (
Figure S3). The background SO
2 level in this period is known [
30], and a comparison to past investigation [
31], which studied air pollution patterns in HBA in a similar period, is possible [
17]. We used a kriging nugget effect of 1 µg/m
3 to account for potential differences in the instrument calibration. We tested the sensitivity to the selected period using various combinations of years 2001–2006. We further compared the wind patterns in different periods observed in HBA by the longest-serving IMS station in the area (Afeq,
Figure S1) to detect possible variability in the local wind pattern. The Afeq station’s records go back only to 2003, so we examined possible long-timescale changes in the typical winds patterns in Israel’s coastal area using data from the Bet Dagan station (100 km south of HBA) which has operated since 1970.
Appendix A contains more details on the sensitivity of the SO
2 spatial pattern and the long-term wind patterns.
2.5. Statistical Analyses
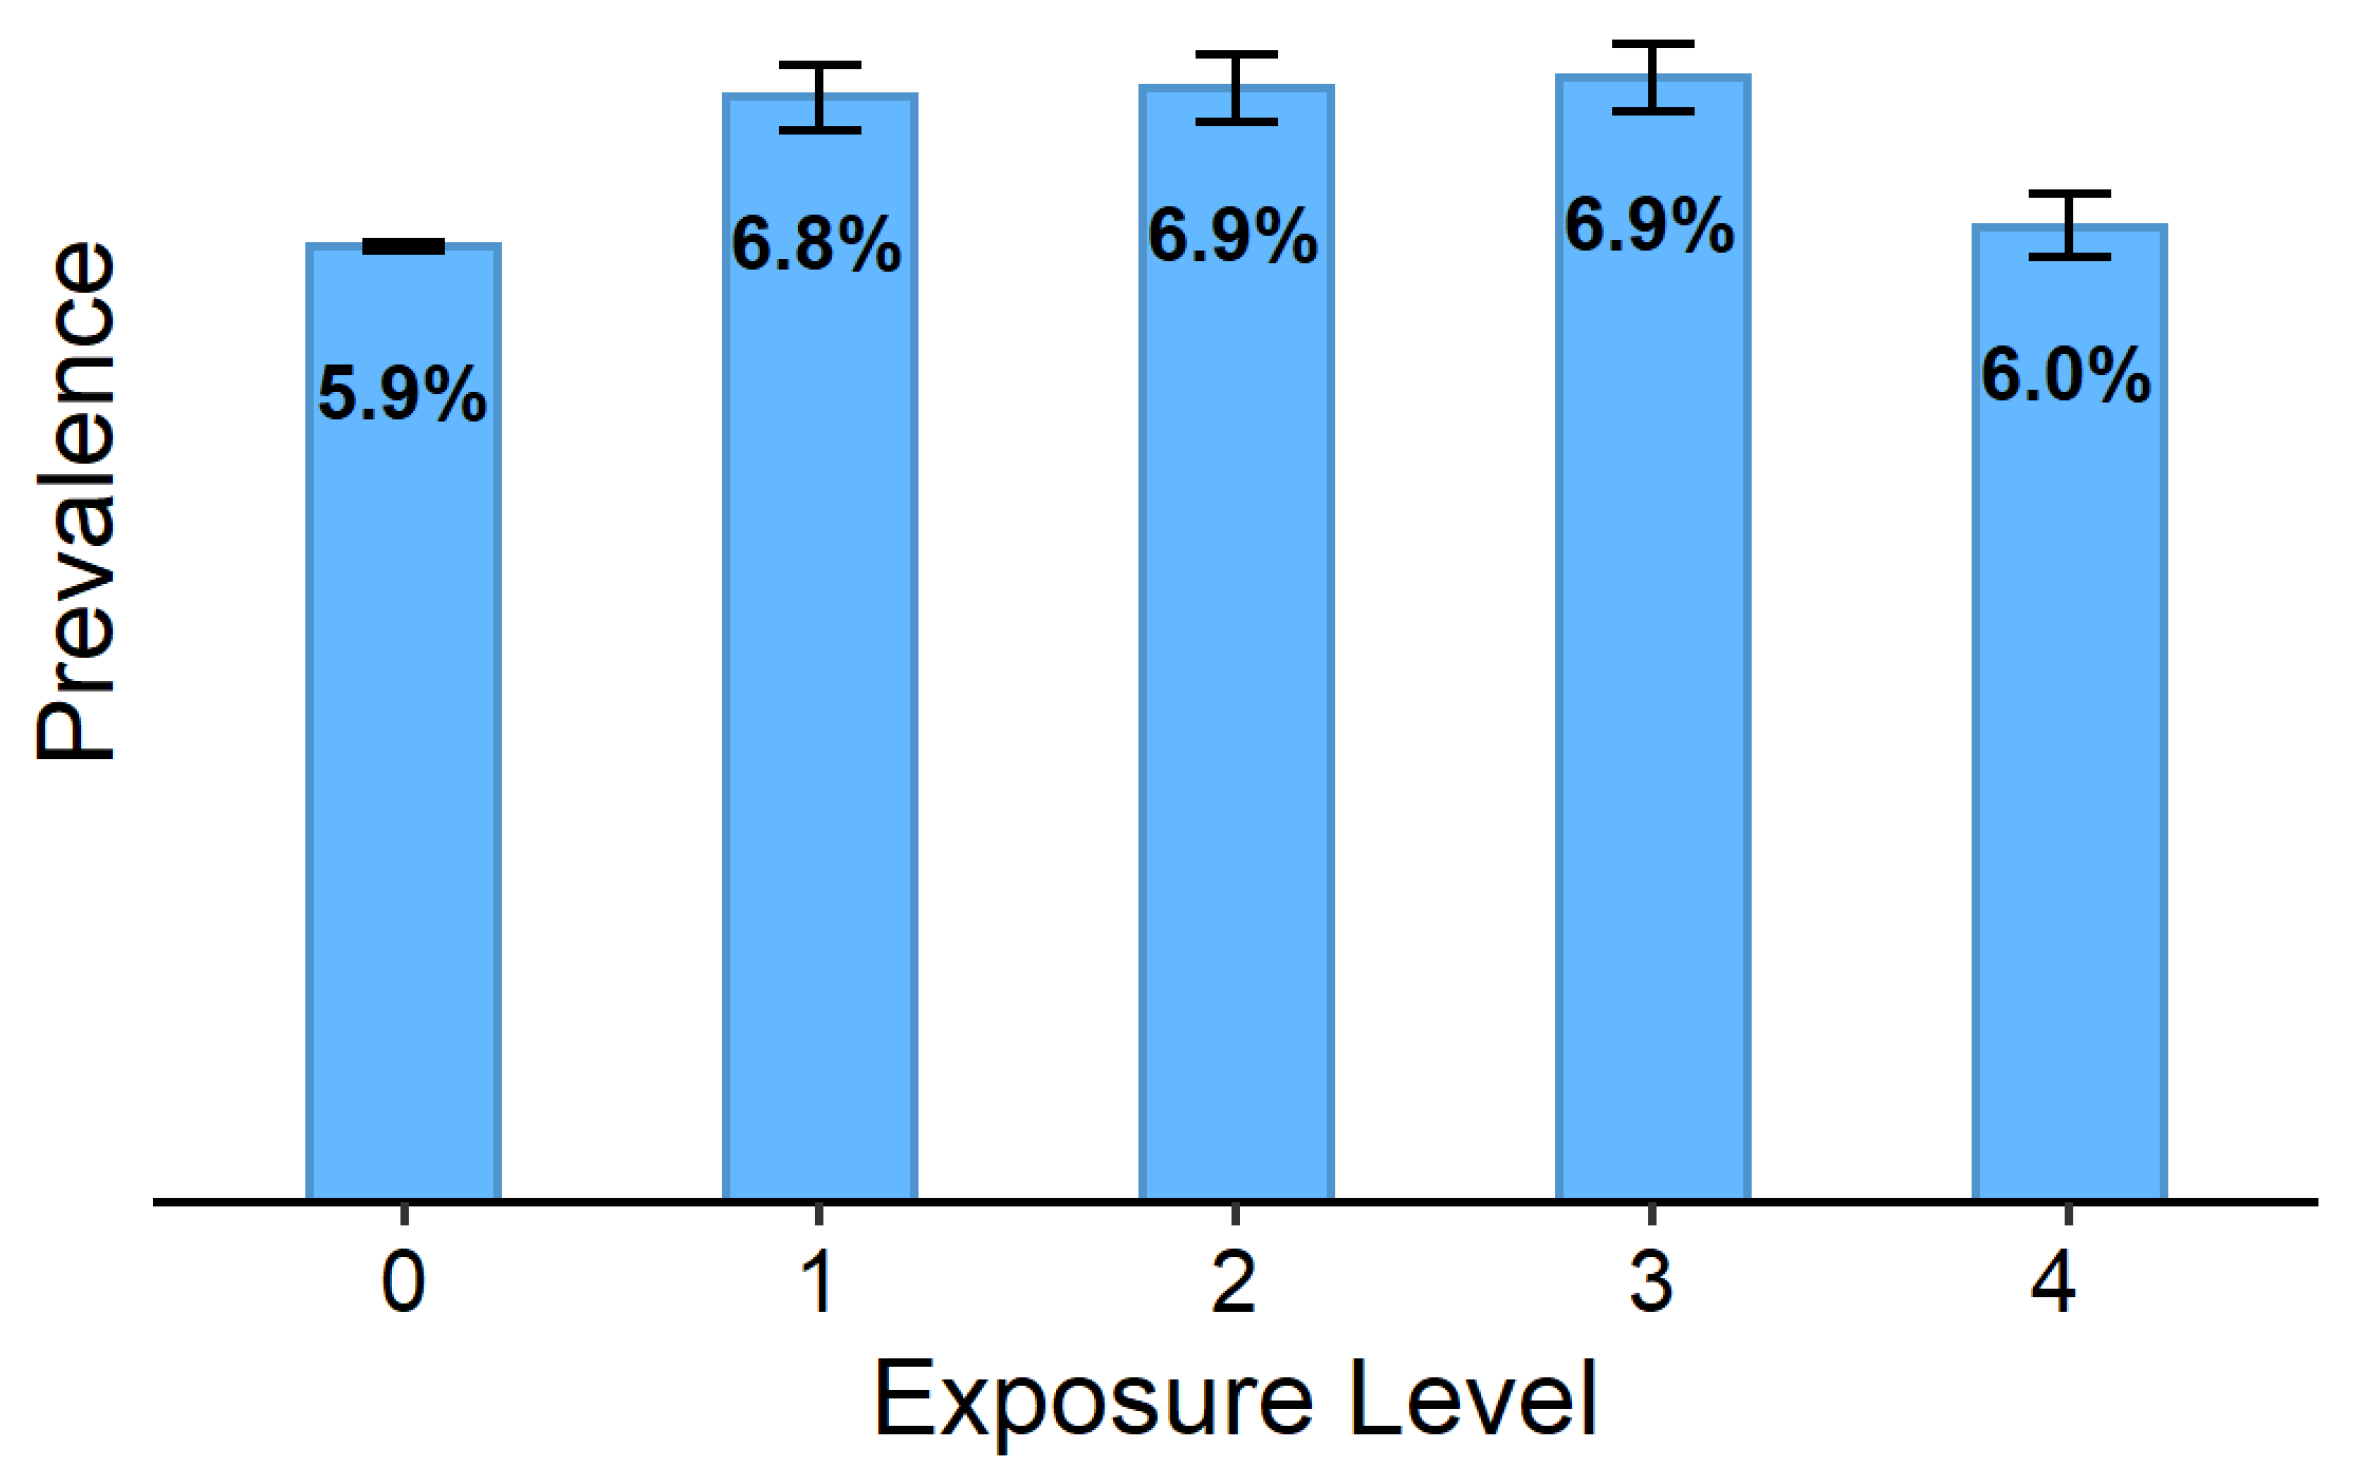
We have categorized the exposure into four time-invariant equal-participant number HBA groups and one reference group of participants who lived outside HBA, according to each subject’s residential address. Additional categorizations that we used in sensitivity analyses were of three and four equal-interval exposure groups. We calculated crude prevalence and its 95% confidence interval (CI) by exposure categories for each health outcome and presented these measures using simple bar plots and tables.
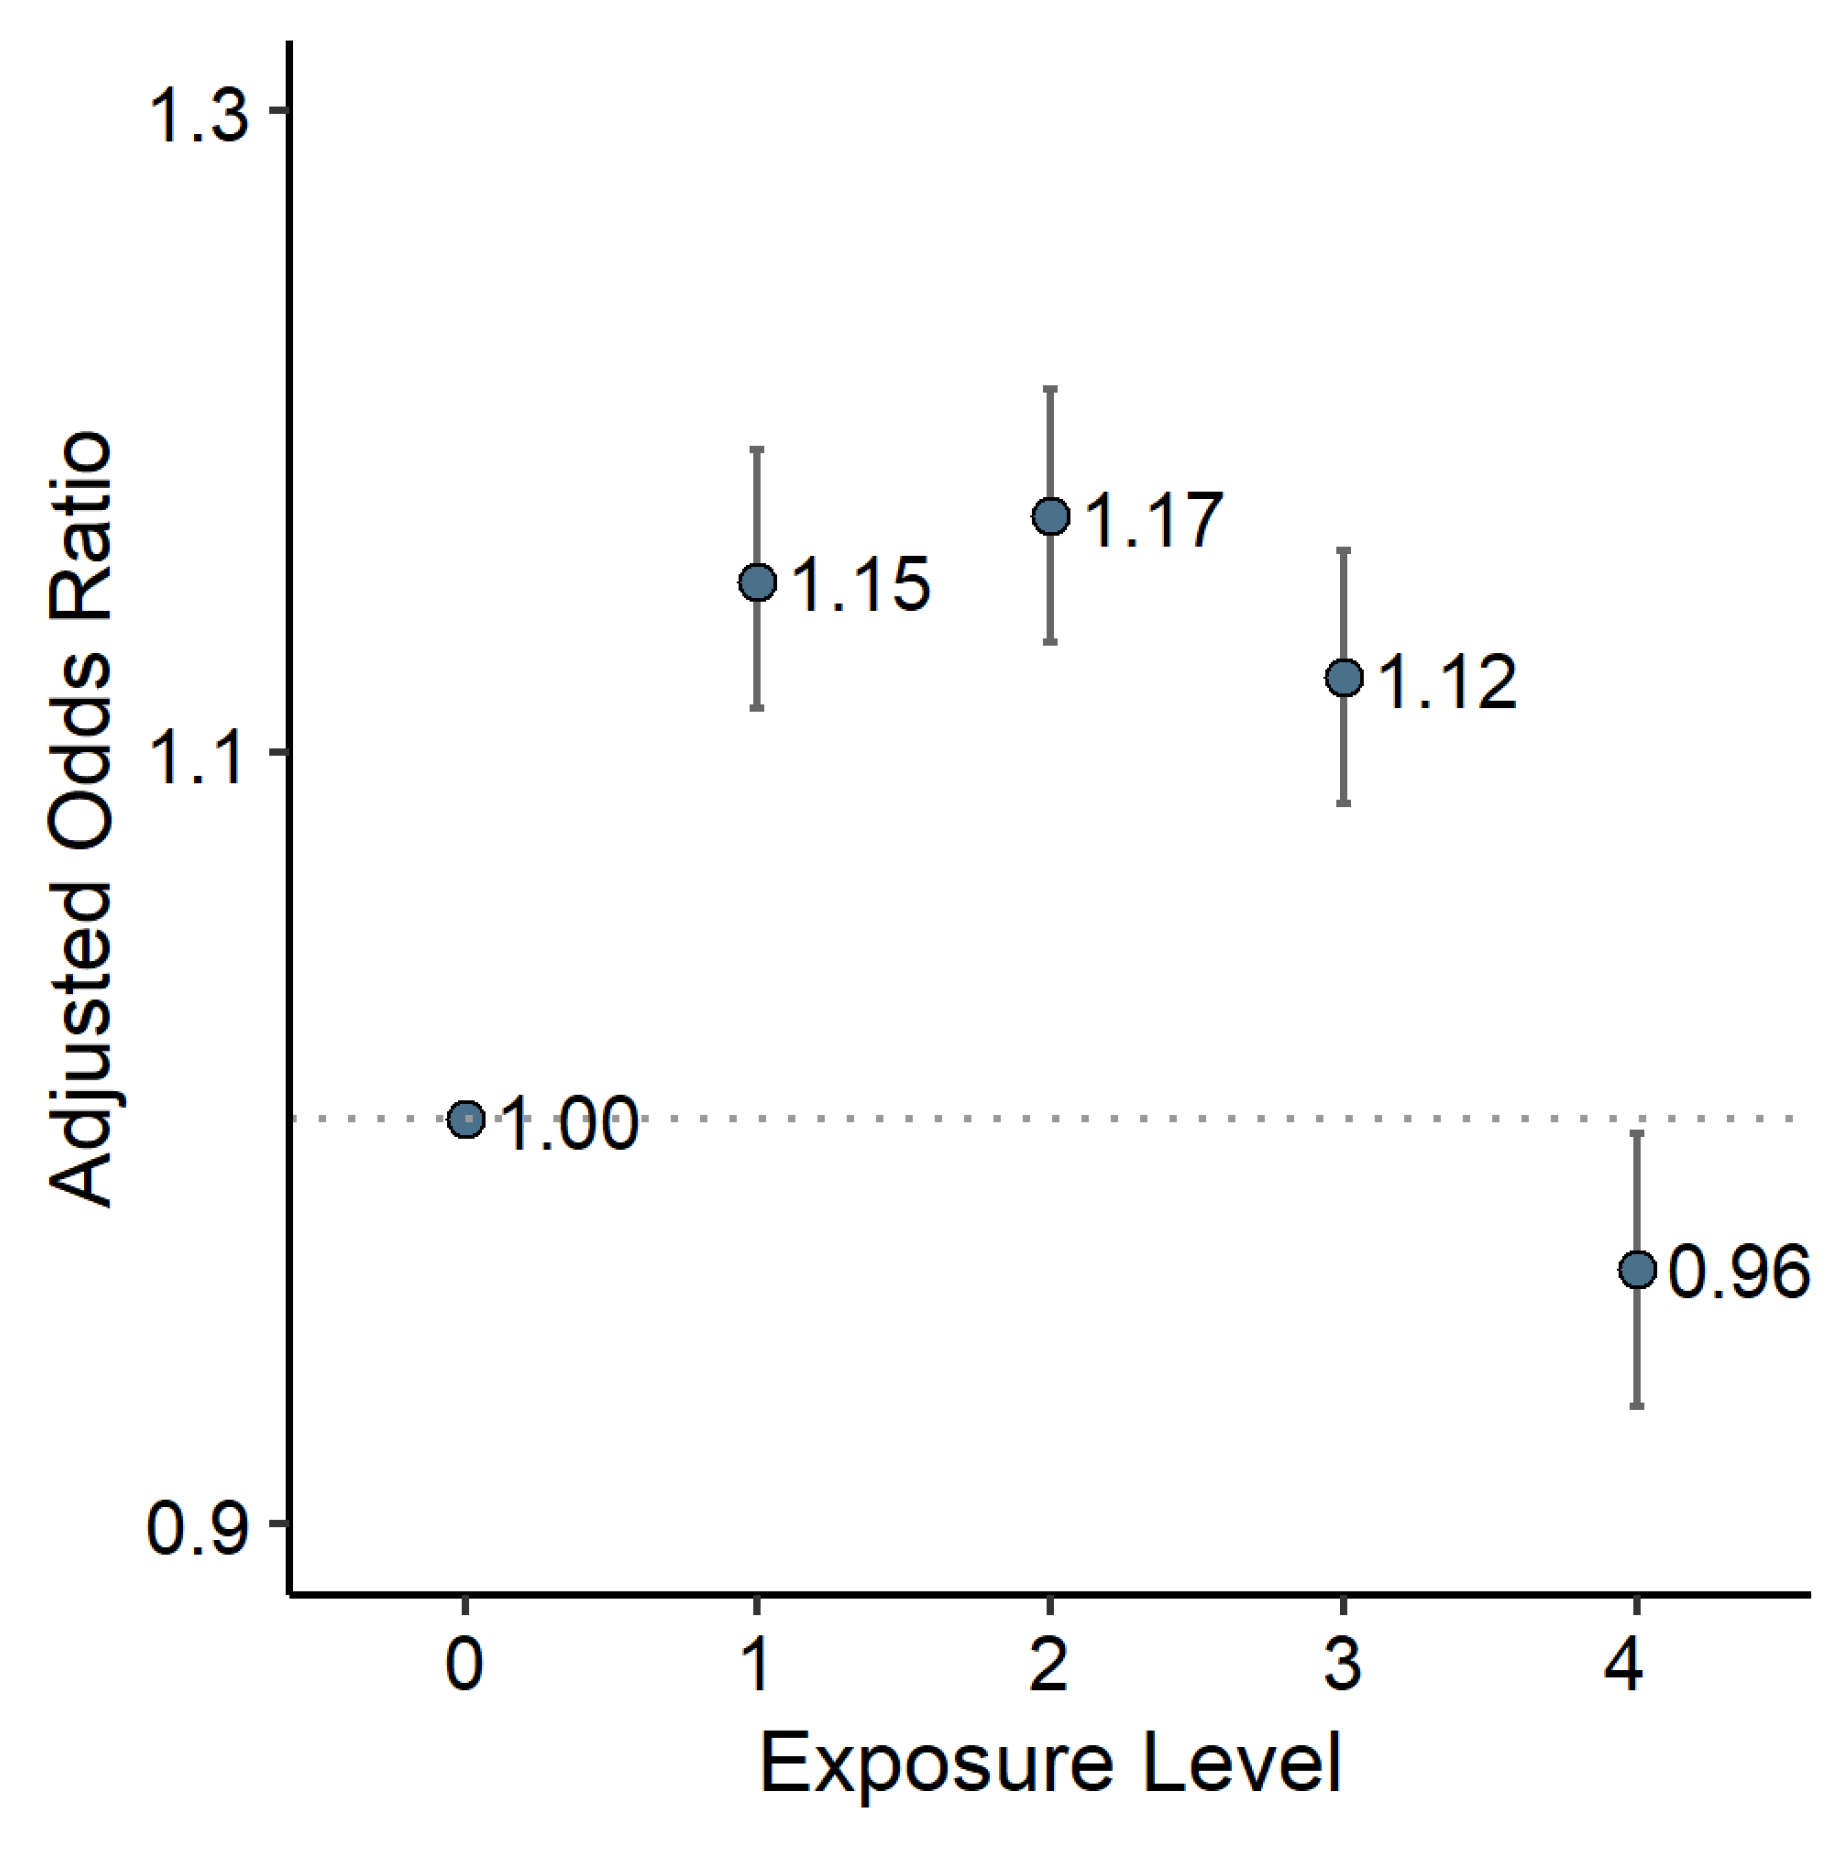
We used generalized linear models applying multivariable logistic regression analyses to examine adjusted associations between HBA industrial air pollution (HBA-IAP) and asthma or other atopic diseases. Associations were expressed as odds ratios ± 95% CI for each HBA-IAP exposure category compared with the non-HBA population that served as a reference category.
We adjusted all models for the following set of potential confounders: Year of birth, socio-economic status (SES, taken from the Central Bureau of Statistics of Israel at the level of small statistical areas), school orientation (secular, religious, or ultra-orthodox), and NOx (as a measure of traffic-related air pollution).
NO
x was assessed by a land-use regression model [
32,
33]. This country-wide model estimates annual average NO
x concentrations over Israel since 1961, with a spatial resolution of 200 m over the entire domain and 50 m in urban regions. Exposure to NO
x was calculated for each adolescent from birth to age 17, based on official residential addresses around age 16. We geocoded the addresses using ArcGIS version 10.5 (ESRI, Redlands, CA, USA) and street reference data from ©HERE [
34]. Furthermore, 79.8% of the addresses were geocoded with very good accuracy (full address or street level), and an additional 10.0% were geocoded at a reasonable accuracy (at the neighborhood or the locality level). Most of the remaining addresses were incomplete or contained errors that could not be corrected, and data for these adolescents were not analyzed. In HBA, where exposure assessment is critical for the current study, we were able to geocode 89.1% of the addresses with very good accuracy (full address or street level).
We further adjusted some of the models for PM
2.5 concentrations, assessed by a hybrid satellite-based model [
35,
36]. This model estimates daily average PM
2.5 concentrations over Israel since 2003 at a spatial resolution of 1 km. Since the PM
2.5 model only starts from 2003, models adjusted for PM
2.5 included only adolescents who were medically assessed from that year and on (approximately 35% of our study population). Exposure to PM
2.5 was calculated similarly to exposure to NO
x but included for each participant just the age period between birth and age 17, for which PM
2.5 concentrations were available.
Stratification by decades provides an additional method to handle potential confounding by time trend except for adjustment. It is also essential since the exposure model lacks any temporal variability (i.e., HBA-IAP exposures assessed by the exposure model are constant with time per specific address). HBA-IAP has changed substantially over the total exposure period of 50 years relevant to our study population. Therefore, HBA-IAP may have been associated with a higher risk of prevalent asthma at age 17 only in some of the historical decades we examined but not in others. To investigate concerns of confounding or effect modification by period, we performed stratified models by the decade of birth.
We performed additional stratification by parental origin to partly exclude potential cultural and genetic confounders. We have defined a shortlist of countries that are commonly known as Jewish “Ashkenazi” origin (Russia and other former USSR countries, Poland, Hungary, Romania, Germany) and another list of countries that are commonly known as Jewish “Mizrahi” origin (Morocco, Iraq, Egypt, Turkey, Yemen, and Iran). In addition, we tested the effect of further adjustment for BMI and locality type (rural, urban with <50,000 residents, and urban with >50,000 residents).
4. Discussion
This study is focused on the prevalence of asthma and other atopic diseases in adolescents at age 17 and its associations with HBA-IAP. Our results confirm that asthma prevalence is higher in Israeli-born HBA adolescents in comparison to their non-HBA counterparts. However, based on our exposure model, the association between exposure to HBA-IAP and either crude prevalence of asthma or adjusted association with the disorder is not compliant with what we expect from causal relationships. Specifically, the fact that the highest exposure group does not present higher prevalence and that this picture does not change even after adjustment for potential confounders and with various categorizations of exposure groups does not support a causal relationship between childhood exposure to HBA-IAP and prevalent asthma during adolescence. Moreover, in most models, the highest asthma prevalence was evident in the two lowest HBA-IAP categories. These results suggest that factors other than HBA-IAP may drive the higher asthma prevalence proportions in the HBA. Examinations of crude and adjusted associations of HBA-IAP with other atopic diseases show a similar picture.
Our findings have several possible explanations. Firstly, it could be that childhood exposure to HBA-IAP does not increase the risk of incident asthma during childhood or adolescence. Due to a lack of measurements, we do not have a fair characterization of the chemical and physical composition of historical emissions from the HBA industry. It is reasonable to assume that the HBA industry emitted various VOCs and particulate heavy metals. The most robust evidence in the literature about air pollution and asthma is about criteria pollutants and asthma exacerbations. The evidence about the new onset of asthma is weaker and is also limited to criteria pollutants. A lack of causal relationship between HBA-IAP and the risk of prevalent asthma in adolescence does not contradict previous epidemiological reports on the topic. It also does not imply a lack of causal relationship between HBA-IAP and asthma exacerbations.
Alternatively, we acknowledge the possibility of residual confounding that prevented us from observing the real exposure-response curve. According to this possibility, the highest HBA-IAP exposure group has a high proportion of factors that protect it from asthma than all other exposure groups. These unmeasured protective factors cannot include elements that we have adjusted for or stratified by. Therefore, it cannot result from differences among the groups, which are strongly related to time trends, SES, population group (as depicted by the school orientation variable), parents’ origin, traffic-related air pollution, or PM2.5. In addition, these protective factors must be very common in the highest exposure group and substantially impact the risk of the relevant diseases (mainly asthma).
One potential confounder for which data were unavailable to us is smoking, including environmental tobacco smoking, a strong risk factor for asthma. Smoking is also associated with factors such as SES that affect the spatial distribution of the study participants. Therefore, smoking is a potential unmeasured confounder that we could not control in our analyses, and substantially lower levels of smoking in the highly exposed population, if they exist, may account for the findings. Unfortunately, we did not have individual-level or area-level data with relevant spatial resolution on smoking. However, one should note that our study included adolescents who were examined over a range of 50 years (1967–2017). While we expect confounding by smoking to change over such an extended period, stratification by decades did not show any exposure-response curve that seems to support a causal effect in any of the periods. Besides, we did adjust our analyses for SES (at the small statistical area level) and school orientation—two variables associated with smoking prevalence in Israeli soldiers [
37], thereby mitigating possible confounding by smoking. Hence, while we cannot completely rule out confounding by smoking, several arguments do not support this possibility.
Residual confounding from other factors, including genetic differences, is also possible. We partly controlled genetic factors in stratified analyses by parental origin, but we cannot completely rule them out as potential confounders. Ozone and humidity are two additional factors that we could not control for. However, these variables vary slowly in space and are not expected to have an extensive range in the study area. Therefore, they are not likely to generate confounding in this study.
Another explanation for these exposure-response curves compliant with HBA-IAP’s causal effect on prevalent asthma at age 17 is a possible interaction of this exposure with other (unmeasured) risk factors. HBA-IAP’s impact on the onset and persistence of asthma may depend on coexposure to a third factor. If this factor is not prevalent in the high exposure areas, this may explain the low prevalence of asthma and other disorders in the highly exposed population. Allergens interact with air pollutants in the causal mechanism of asthma onset. Our study does not contain individual or area-level data on exposure to allergens. Therefore, exposure to some allergens may cause the high prevalence of asthma and other atopic diseases that we have observed in the low HBA-IAP exposure groups, with or without interaction with HBA-IAP exposure. This possible mechanism may also be compliant with HBA-IAP’s causal effect on asthma’s onset and persistence if the relevant allergens are highly absent in the lowest HBA-IAP groups.
Another possible explanation of our results that may be compatible with a causal relationship is information bias due to inaccurate residential address data. We have based our exposure assessment on addresses known at the time of medical evaluation, i.e., approximately at age 16–17 and used these addresses to calculate the mean exposure from birth to age 17. Some of the adolescents, possibly many of them, changed address between birth and age 17, and none of them spent their entire life by age 17 standing outside their home. They have spent time indoors, in many other places, and probably for some of them even their home addresses were different throughout most of the period. However, one should note that as long as these exposure error components do not distribute differently among adolescents with and without the relevant health condition in the study population, we can regard this error as nondifferential (with respect to the outcome—for example, asthma). Such a nondifferential exposure error is expected, on average, to bias our associations towards the null, i.e., it is generally expected to yield associations in the same direction as the real associations but weaker. Since we did obtain strong and statistically significant associations in our study that are not compatible with a causal exposure-response curve, a nondifferential error of the exposure is unlikely to have entirely caused these results.
Nevertheless, we cannot completely disregard the possibility of differential error in our exposure assessment due to a pattern of address changes that varies by the outcome. For example, suppose families with asthmatic children who lived in the highly exposed HBA area during their child’s diagnosis are much more likely to change the address before age 16 than families of asthmatic children from other regions. In that case, this would bias our crude and adjusted associations, which are based solely on prevalent asthma at age 17 and addresses around that age. Naturally, most of the addresses in the highest HBA-IAP exposure category are surrounding the industrial area or are downwind of it. Parents of children diagnosed with asthma in this region may have thought it would be better for their child to live in another area and consequently moved to a different location before age 17. In our analyses, such children cases would have been counted in their new addresses and would have reduced the observed prevalence of asthma at age 17 in the areas from which they moved, e.g., the high HBA-IAP exposure group. Moreover, if these families moved to less exposed HBA areas, they increased asthma prevalence at age 17 in these areas. If such bias exists, it may explain our results and be compatible with HBA-IAP’s causal effect on asthma onset. Unfortunately, we did not have data on addresses other than around age 17, so we could not assess likelihood of this bias.
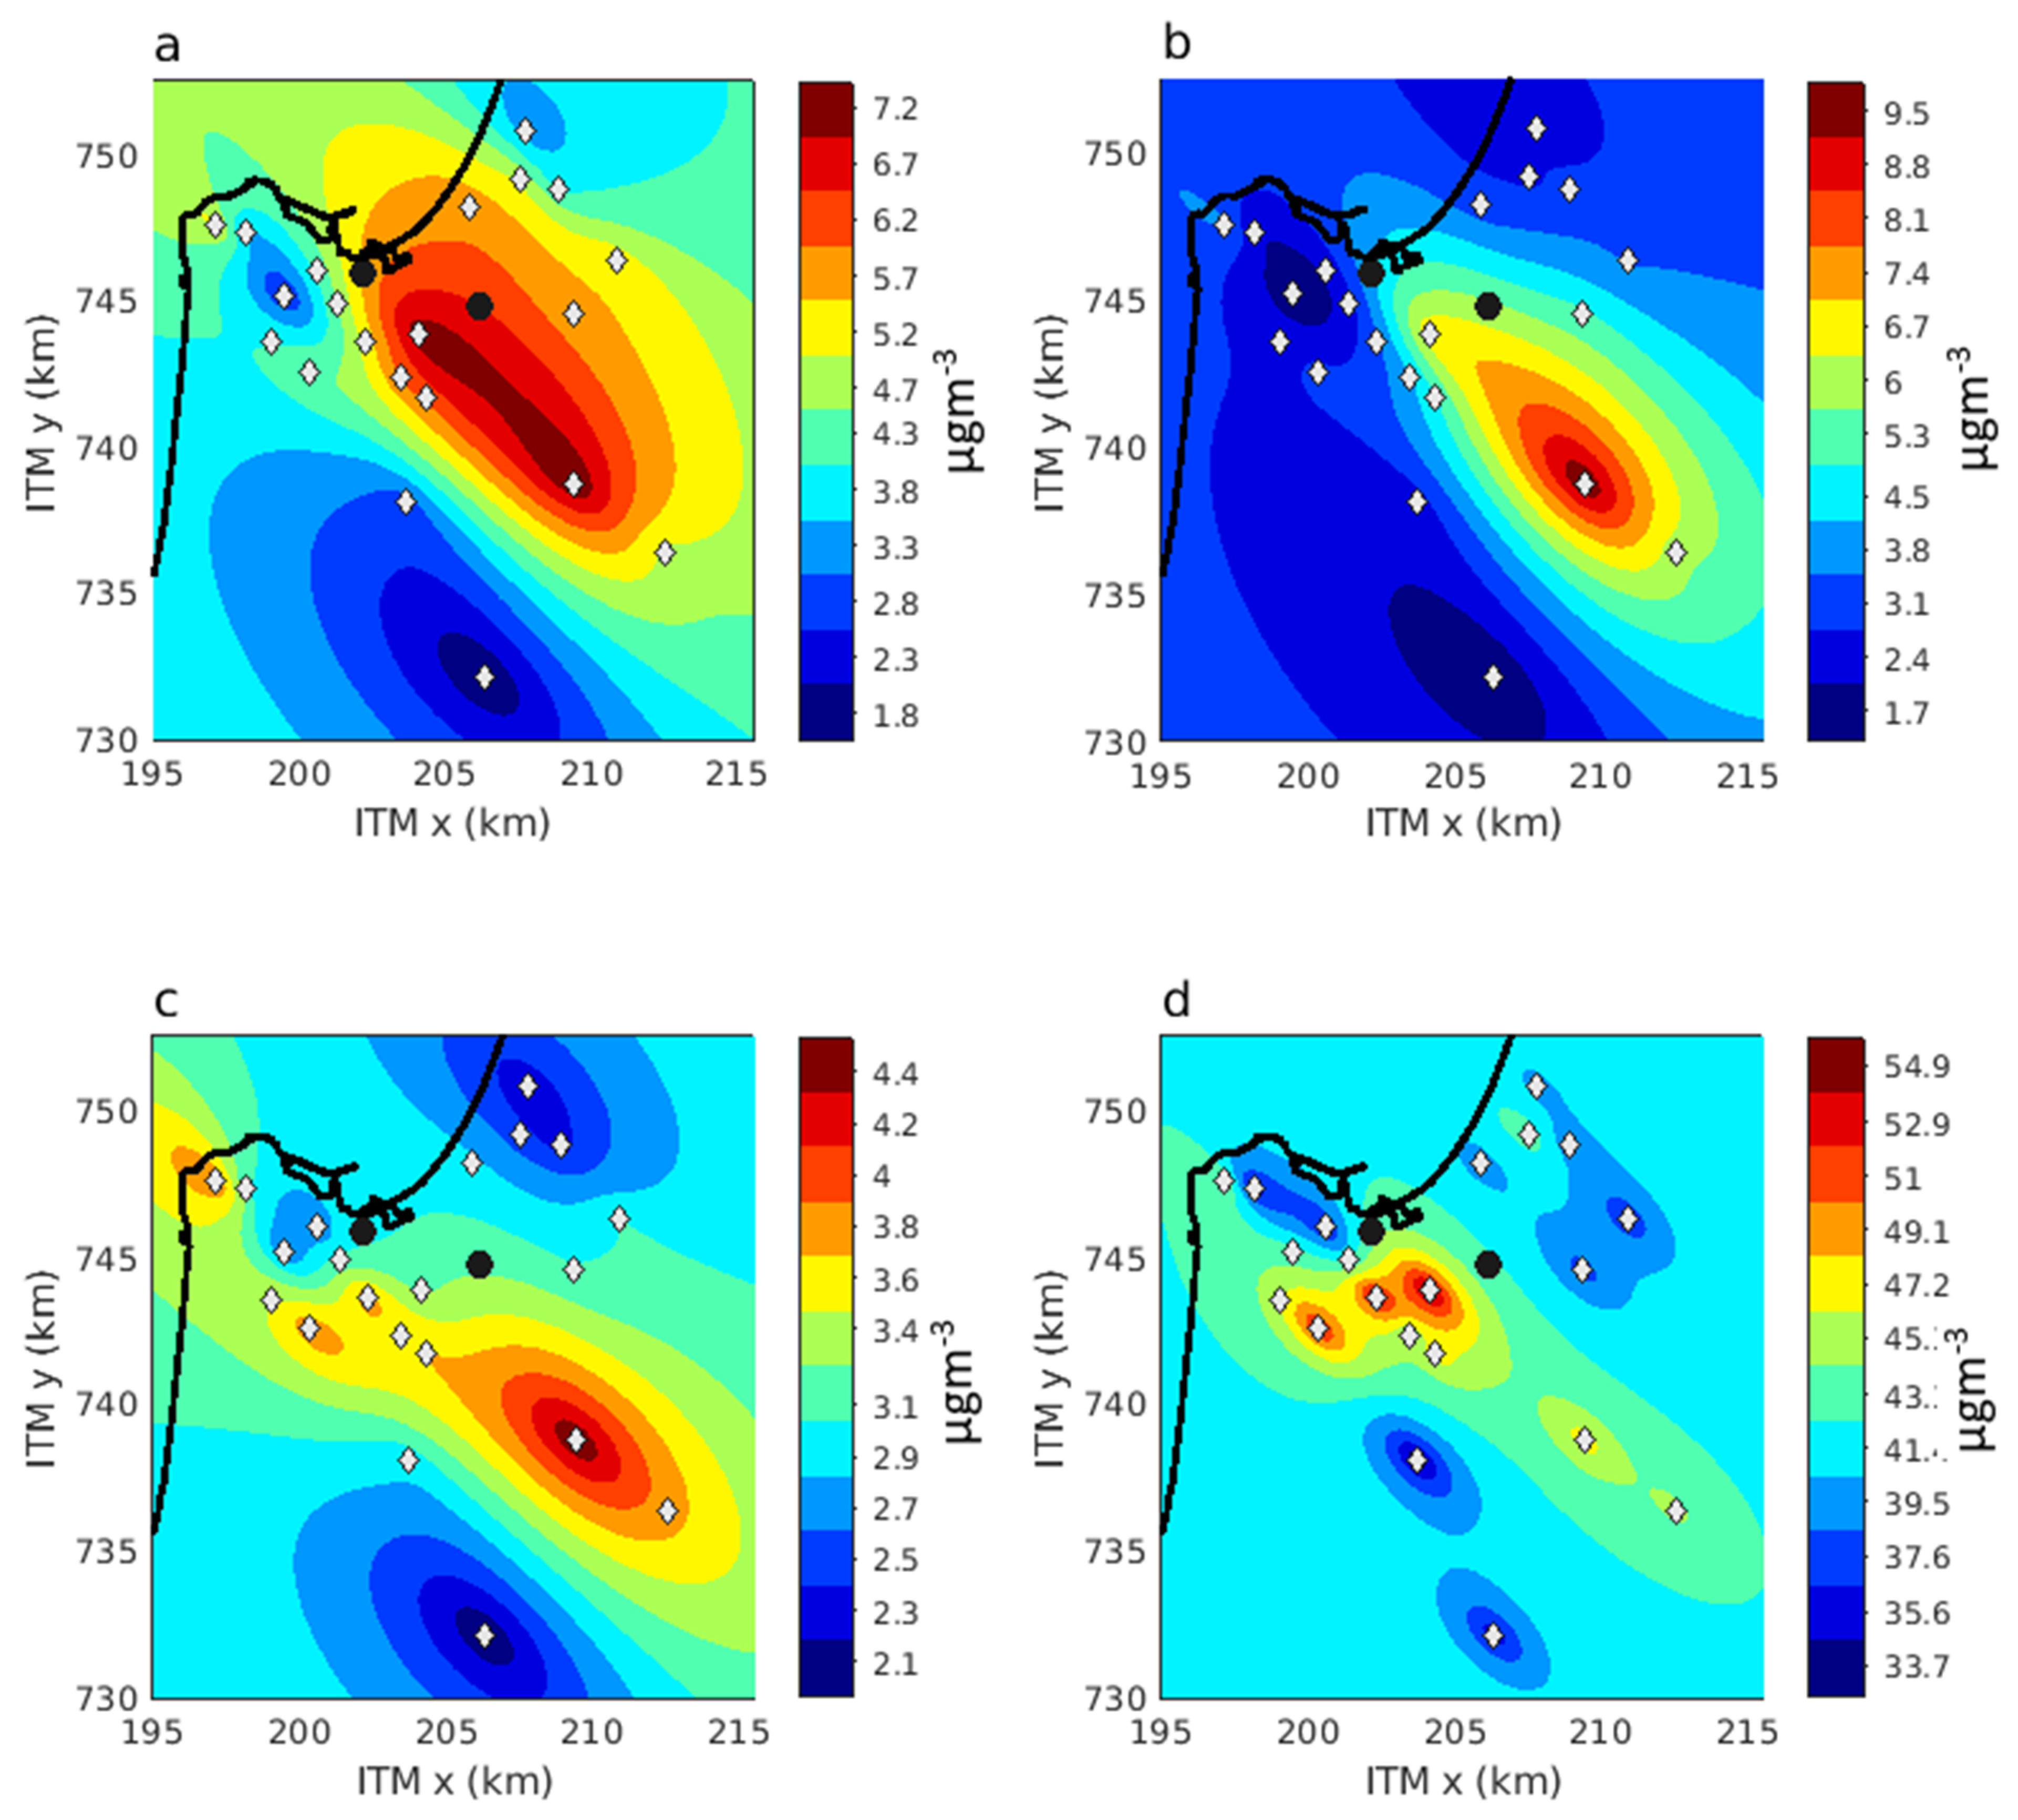
Another possible explanation of our results which may have some compliance with a causal relationship is that the exposure that matters for a causal effect is not the average exposure. For example, exposure to HBA-IAP varies by the time of the day. It is determined mostly by meteorological factors such as the wind field (speed and wind direction) and atmospheric stability. Specifically, the spatial distribution of HBA-IAP during the night is different from that during the day (
Figure A1). The concentrations of inhaled pollutants and the presence of children and adolescents indoors also vary by the hour of the day. We did not consider these factors in our epidemiological models, but some combination of these factors may be biasing our results. These issues require careful characterization and may be explored in future studies.
The main limitation of this study is its cross-sectional design, which limits causal inference. This design resulted from the nature of the dataset we used, in which only one address and only one medical evaluation were available per participant, both around age 17. Ideally, one would need data on addresses from birth to diagnosis or end of follow-up and relevant diagnosis date to make a much more robust inference on the causal relationship between exposure to pollution and risk of the onset of new asthma. However, such data were not available to us. On the other hand, the current dataset is unique because it is based on mandatory medical screening. It also includes a comprehensive country-wide population-based sample that spans over 50 years of exposure and outcome data.
Another limitation is our exposure data, which is not ideal for an epidemiological study. We have made a substantial effort to classify our study population by exposure to HBA-IAP. However, this exposure assessment lacks temporal variability, characterization of the relevant pollutants, and direct measures of these pollutants—components that would have improved it had they been available. Prior studies characterized HBA exposure on either distance from the industrial area, measurement of criteria pollutants, or merely comparing HBA to non-HBA residents [
15,
16,
17,
18,
20]. We have used a new approach to categorize the HBA population by levels of exposure to HBA-IAP, and think that this approach is better than the other available assessment method of historical HBA-IAP unmeasured pollutants.
Our lack of data on addresses before age 17, and lack of data about school addresses, which may account for a substantial portion of the exposure [
38], are additional limitations of this study. We have limited our sample to Israeli-born adolescents to mitigate this problem, but we acknowledge that this is one of our main limitations. However, epidemiological theory can predict the bias created by such inaccuracy of exposure data and the rare circumstances under which a real causal relationship is hidden in our results, as discussed above for differential error of address change. Our study is also limited by the outcomes we have examined. The most important limitation in this context is that we used prevalent health conditions without considering disease onset, clinical disease course, exacerbation, and other clinical characteristics. In addition, our findings cannot be generalized to asthma in adults.
Finally, we need to acknowledge our inability to better adjust for potential confounders, especially for smoking. We have made efforts to examine possible residual confounding by various stratification methods, different categorization methods of the exposure, and adjustment for proxies in this context. The fact that these additional analyses did not materially change the exposure-response curve renders the possibility that our main findings are solely a result of residual confounding less likely.


 ,
, 


