Article

High Resolution Mapping of PM2.5 Concentrations in Paris (France) Using Mobile Pollutrack Sensors Network in 2020

by
Jean-Baptiste Renard
1,* and
Christophe Marchand
2
1
LPC2E-CNRS, 45000 Orléans, France
2
Pollutrack SAS, 91220 Brétigny, France
*
Author to whom correspondence should be addressed.
Atmosphere 2021, 12(5), 529; https://doi.org/10.3390/atmos12050529
Submission received: 5 March 2021 / Revised: 9 April 2021 / Accepted: 14 April 2021 / Published: 21 April 2021
(This article belongs to the Special Issue The Future of Air Quality Monitoring)

Abstract

:
There is a need for accurate monitoring of PM2.5 that adversely affects human health. Consequently, in addition to the monitoring performed by fixed microbalance instruments installed under legal obligation, we are proposing to deploy the Pollutrack network of mobile sensors within the city of Paris (France). The measurements are performed by mobile aerosol counters mounted on the roof of cars, providing a constant series of readings in the 0.3–10 µm size range that are then aggregated to identify areas of mass concentrations of pollution. The performance of the Pollutrack sensors has been established in ambient air in comparison with the microbalance measurement devices and with the Light Optical Aerosols Counter (LOAC) aerosol counter. A measurement uncertainty of about 5 µg. m−3 is obtained with absolute values from the Pollutrack measurements made at a given location. Instead of the current modelizations based on very few PM2.5 values, maps built from real measurements with a spatial resolution down to 100 m can now be produced each day for Paris, and potentially for specific times of the day, thanks to the high number of measurements achievable with the Pollutrack system (over 70,000 on weekdays). Interestingly, the global trend of PM2.5 content shows several significant pollution events in 2020 despite the COVID-19 crisis and the lockdown. The Pollutrack pollution maps recorded during different PM2.5 pollution conditions in the city frequently identified a strong spatial heterogeneity where the North and the East of Paris were more polluted than the west. These “hot spots” could be due to the city topology and its sensitivity to wind direction and intensity. These high-resolution maps will be crucial in creating evidence for the relevant authorities to respond appropriately to local sources of pollution and to improve the understanding of transportation of urban PM.

1. Introduction

Atmospheric pollution by particulate matter (PM) in urban conditions is of crucial importance for human health [1,2,3]. The smallest particles can penetrate deeper in the body [4], can be found in various organs [5,6,7] and can be carcinogenic [8]. The recommendations from the WHO (World Health Organization) for PM2.5 mass concentrations are a mean annual value below 10 µg. m−3 and daily value below 25 µg. m−3 no more than 3 days per year. Such pollution adversely affects the health of more than 11 million inhabitants of the Paris region of France [9]. Following the report of the ICCT (International Council on Clean Transport) Paris had the ninth-highest percentage of deaths among major cities of the world from air pollution attributable to transportation emissions in 2015 [10].
In the following, PM2.5 refers to particles with aerodynamical diameter smaller than 2.5 µm, which could differ from the equivalent or optical diameter in case of irregular shaped particles. In urban conditions [11], these particles can be primary in nature and directly produced by various sources, but also secondary in nature, produced from chemical reactions involving sun light, ammonium, nitrous oxide and sulfur oxide, mainly attributed to anthropogenic sources (transport, heating, industries, building activities, agriculture).
The Paris region is characterized by having relatively few industries, but intense traffic circulation and also agricultural activities commence just a few tens of kms from the Paris boundaries. The Paris region urban background conditions are driven by long-distance transportation of pollutants on a regional scale, accounting for up to 70% of PM2.5 mass-concentration [12,13,14,15,16]. On the other hand, local sources of primary particles are dominated by traffic emissions and by residential heating in winter, as in many other urban environments [17,18]. In fact, the spatial distribution of particle concentrations can vary significantly depending on the dispersion of air mass driven by the urban topography and the local sources. Thus, this needs to be studied in greater detail to accurately evaluate the exposure of the population to pollution at a more local level.
The PM concentration is continuously monitored by legally obligated air quality networks which provide the mass concentrations of PM10 using microbalances or equivalent instruments at different locations. In the region known as “Ile de France” having a surface of 12.012 km2 and including the city of Paris, these measurements are conducted by Airparif [19]. It uses 13 measuring stations for PM2.5 (with only 3 entire Paris) and 24 stations for PM10. This technique provides good estimates of the presence of the largest particles but cannot provide insight on the concentrations of submicron particles that only marginally contribute to the mass. Consequently, complementary measurements providing particle number concentrations in addition to mass concentrations may be necessary to properly understand the distribution and dynamics of urban PM.
A first step towards monitoring the number concentrations using aerosol style counters has been achieved with the Light Optical Aerosols Counter (LOAC) instrument at a Paris tourist attraction known as “Ballon de Paris Generali” located in the south-west of Paris. Commencing in 2013, this instrument has provided number concentrations for 19 size classes in the 0.2–50 μm range at ground level and also during flights up to an altitude of about 300 m [20,21,22]. It also provides an indication of the typology of the particles based on their light adsorption properties. Another LOAC instrument has been used at ground level since 2017 at the SIRTA observatory, Palaiseau, south of the Paris region. Such instruments have allowed us to study some pollution events and the variation of the size distributions and concentrations depending on the origins of the pollution, but these fixed stations cannot provide information on the spatial variability of the PM number concentrations within the urban topology. Thus, there is a need for mobile measurement stations utilizing counting instruments to map the local content of PM and to study its temporal and local variability at street level. The primary aim of the Pollutrack project is to conduct such a strategy but, because of its cost, the instruments must be economically viable whilst being accurate.
In the following, we will present the instrument used for the project, evidence of its accuracy obtained during various sessions of inter-comparison with different instruments providing PM mass and number concentrations, and the main results obtained with this mobile network for 2020.

2. Concept of PM Measurements with the Mobile Pollutrack Sensors

The Pollutrack sensors are based on the principle of a small optical particle counter. The particles are injected inside an optical chamber where they cross a laser beam. The intensity of the light scattered is related to the size of the particles. The instrument provides, second by second, the number concentration of particles in the 0.3–0.5 µm, 0.5–1 µm, 1–2.5 µm, 2.5–5 µm and 5–10 µm; and then the counts are converted into mass-concentrations for the PM2.5 and PM10 using internal calibrations.
Instead of performing ambient air pollution at fixed stations as with the air quality networks, the sensors are mounted on the roof of professional vehicles (Figure 1) from 3 major partners that have fleets circulating in almost all streets of Paris and its inner suburbs (these partners are: Enedis, the national public electricity distributor; DPD group, the largest European parcel delivery service; and Marcel Cab, contributing a fleet of compact electric taxis owned by Renault). To evaluate the possible loss of sensitivity of sensors or technical failures, fixed stations with the same sensors are installed at different locations such as vehicles depots or often passed by the vehicles during the day allowing frequent quality controls.
Tests have been conducted to find the better positioning of the instrument on the roof of the car. The sensors are oriented in the opposite direction of the car motion unless of course the vehicle is reversing. The isokinetic conditions necessary for the best efficiency of the inlet system depend on the relative speed between the inlet and the wind, and on the aerodynamical size of the particles. The inlet for the Pollutrack sensors was designed to provide its best efficiency for particles of a few µm and for a relative speed of about 40 km/h. Tests have been conducted in a wind tunnel to validate the system. Consequently, the mobile Pollutrack system is mainly designed for the estimation of PM2.5 mass concentration.
In general, individual small PM sensors can be less accurate than more expensive and heavier OPC and microbalances instruments, although they can provide good indications of the PM mass concentrations [23]. A statistical approach is used by the Pollutrack sensors to increase the accuracy of the measurements. Instead of considering the results from a given instrument and following its measurements during its travel, Paris is divided in small square parcels where all the measurements produced in each parcel are averaged to provide a mean mass concentration value. The size of the parcel and the duration of integration can be chosen depending on the number of measurements and the expected accuracy; for example, 100 measurements in steady-state temporal and spatial conditions will increase the counting statistic by a factor 10 (the root mean square of 100) and therefore the accuracy of the retrieved number and mass concentrations. At present, nearly 500 cars are circulating in Paris with the Pollutrack sensors, producing over 70,000 validated measurements per weekday. This is a major step forward when compared to the 24 hourly PM2.5 data historically produced by the official PM2.5 fixed stations located in the Paris region. Obviously, such an approach assumes that no permanent bias is present in the counting, which needs to be evaluated and considered as appropriate.

3. Evaluation of Performance from Different Sessions of Inter-Comparison with Other Instruments

3.1. Reproducibility of the Sensors in Static Conditions

Laboratory tests have been conducted in a closed chamber with 10 Pollutrack sensors using Arizona sand grains in dry conditions and KCl particles in wet conditions, to produce PM2.5 mass concentrations in the 20–700 µg. m−3 and 50–150 µg. m−3 respectively. The wind speed inside the chamber was 2 m. s−1.
For the two different natures of the samples, the variability of the results from all instruments is similar and remains below 25%, which is similar to the reproducibility on the LOAC instruments [20]. This value indicates the reproducibility of the instruments and provides a starting value of uncertainty before averaging measurements coming from different sensors in same ambient air conditions.

3.2. Inter-Comparison of Fixed Pollutrack Sensors with the Fixed Counting Instrument LOAC

Sessions of inter-comparison of one Pollutrack sensor and one transportable copy of the LOAC instrument [20] have been conducted in some streets in the east of Paris. The objective was to compare the PM2.5 and PM10 mass-concentrations calculated by the software of each instrument and to evaluate the ability of Pollutrack sensors to provide useable results during snapshot measurements.
Four sessions of 40 min of measurement were conducted in 4 different locations on 23 October 2019 and 6 November 2019. Figure 2 presents the inter-comparison of the measurements from the two instruments for PM2.5 and PM10 mass-concentrations integrated each day. When combining the PM2.5 and PM10 measurements, the correlation is of 0.98, the slope of the fit is of 1.0 and the value at origin is −3.3 µg. m−3. The standard deviation between Pollutrack and LOAC measurements is about 4 µg. m−3, which potentially demonstrates a first indicator of the Pollutrack Sensor’s accuracy in static conditions.
A longer session of inter-comparison between one Pollutrack sensors and LOAC was conducted in the Park “Andre Citroën” in the south-west of Paris (48.84° N, 2.27° E), from 20 May 2020 to 31 December 2020. A LOAC device was fixed on the gondola of the tourist attraction “Ballon de Paris Generali” [22] at 1 m above ground. The measurements when the balloon was in flight were not considered here, as well as sudden concentration increases due to human activities close to the balloon such as presence of people looking at the sensor or perhaps smoking. The Pollutrack sensor was fixed in front of a building 50 m away from the balloon and at an elevation of 4 m. The measurements, available for 218 days with the Pollutrack sensor and 184 days with LOAC sensor, are averaged daily.
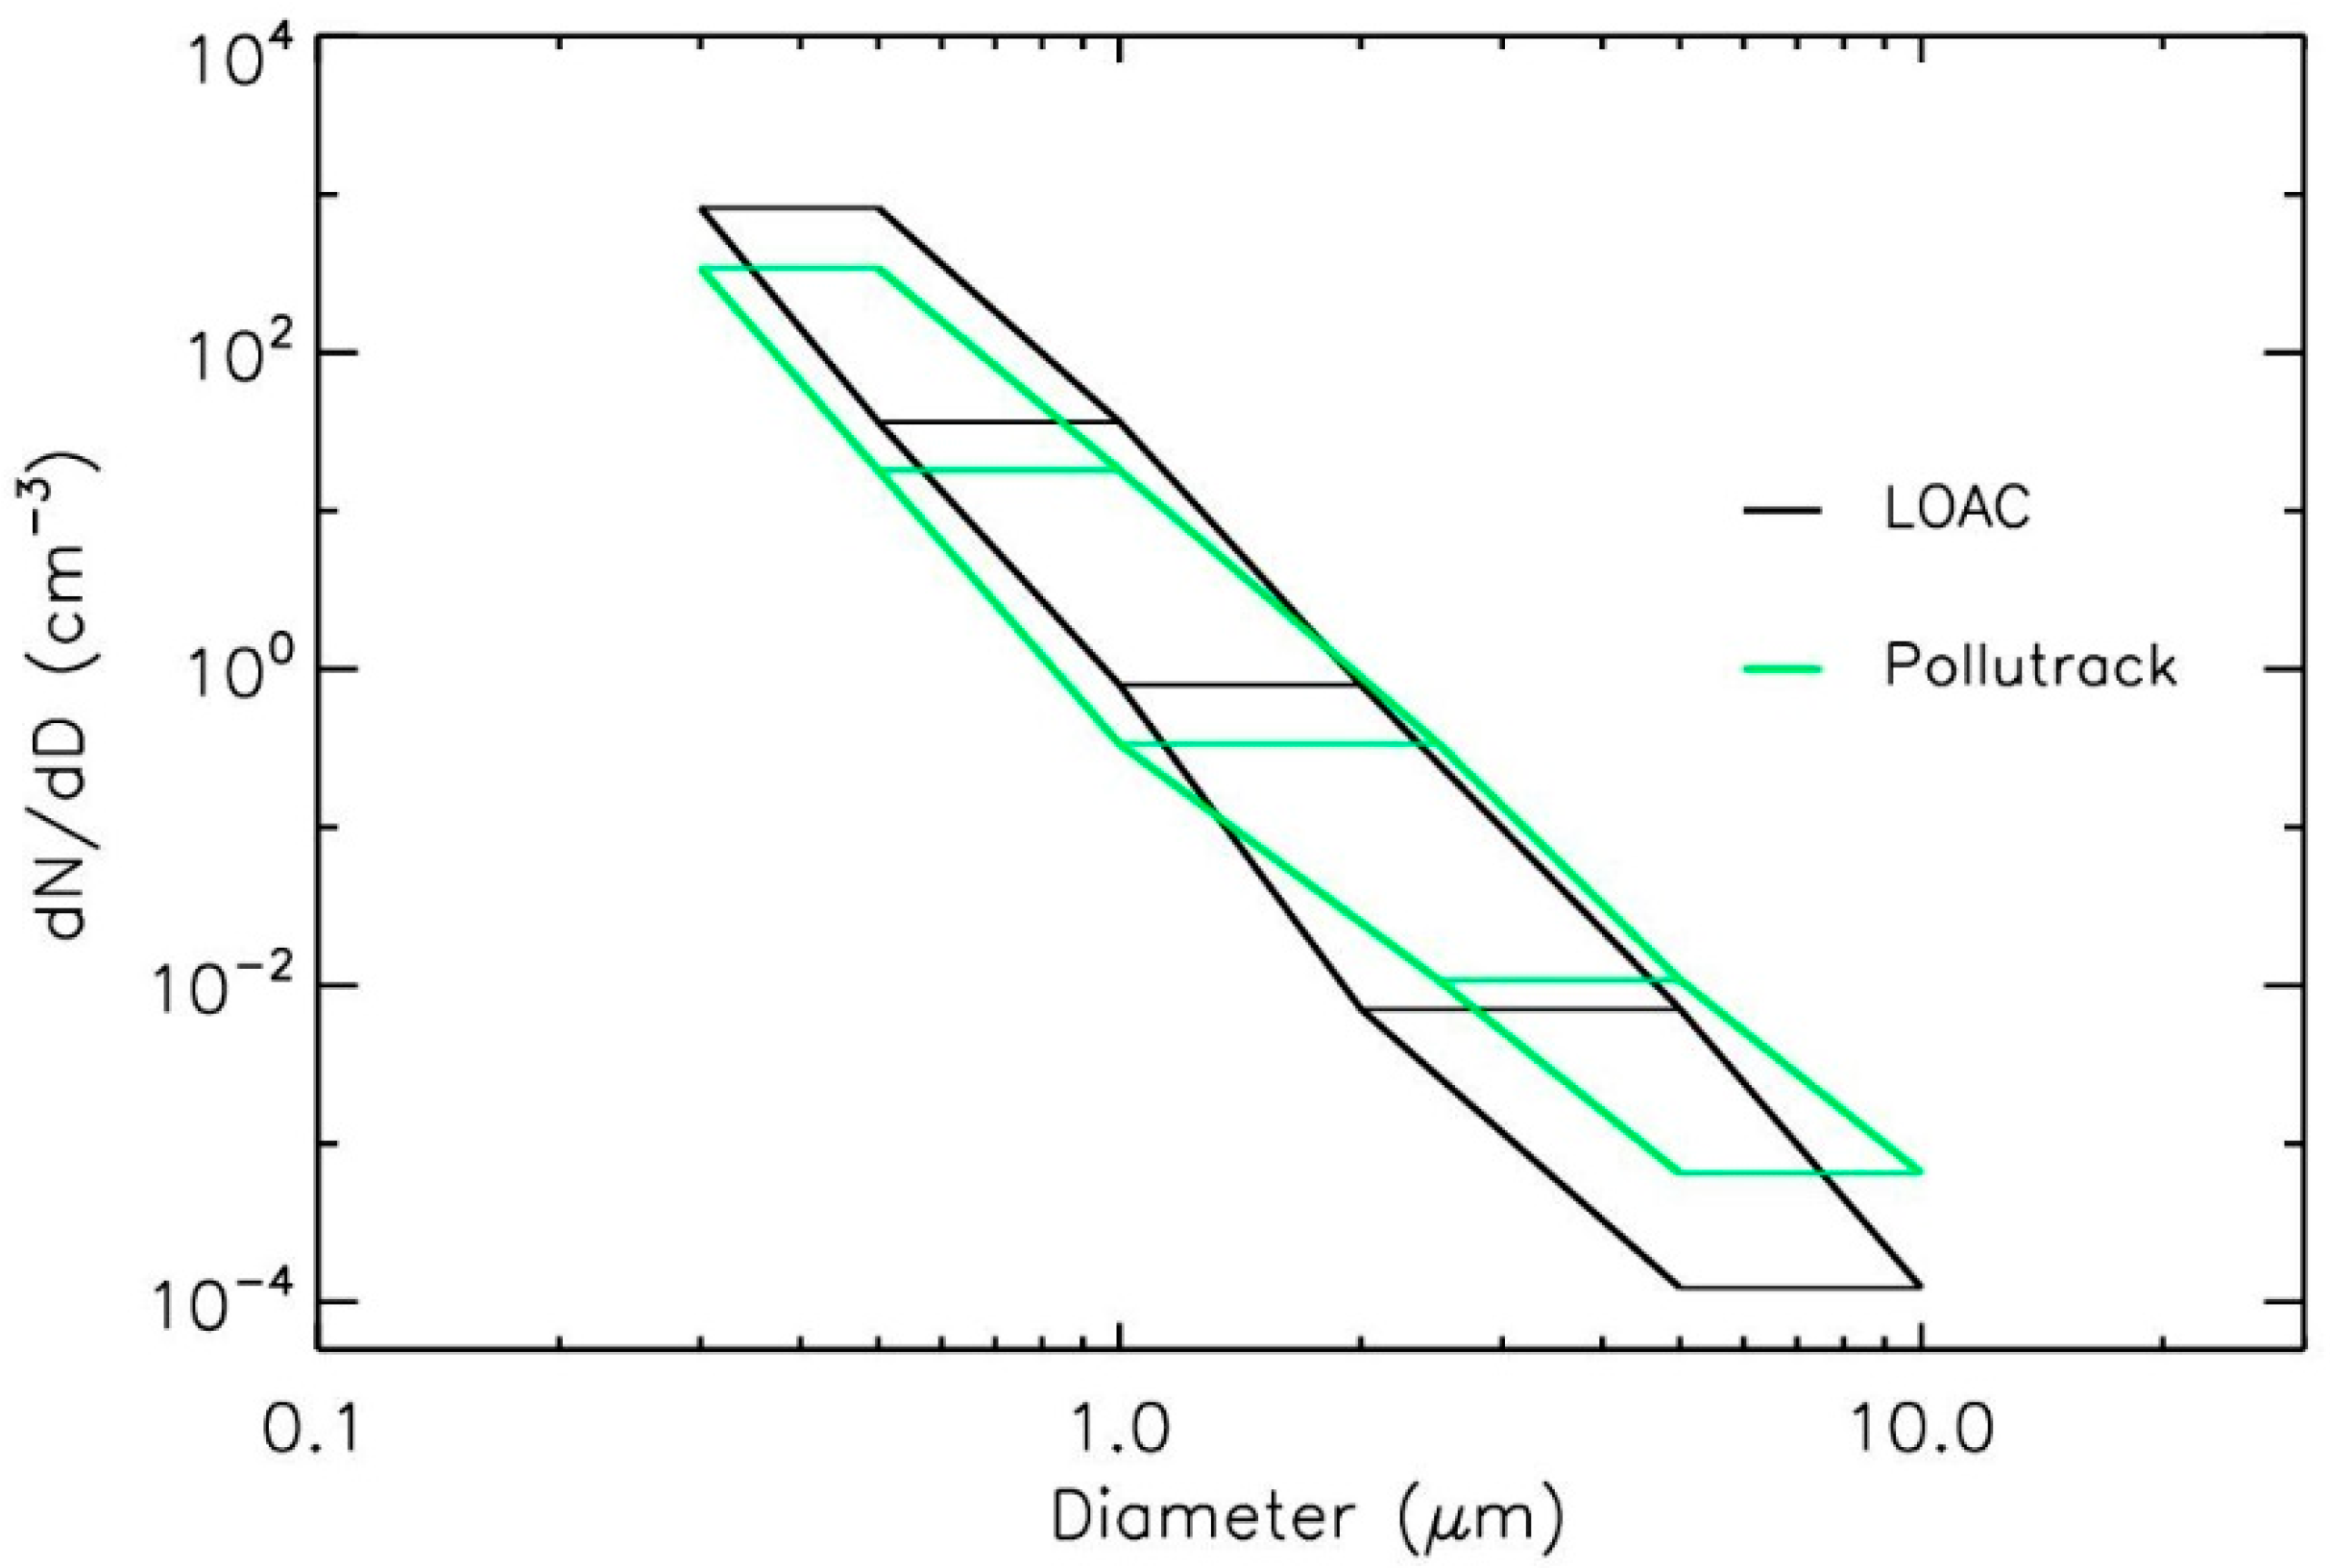
The comparison of the size distribution averaged over the days where both LOAC and Pollutrack data was available are presented in Figure 3. The LOAC size classes have been pinned to be as close as possible to the Pollutrack size classes. Nevertheless, due to their own particle size calibrations when the particles are irregular-shaped, some difference can occur in the concentrations retrieved for each size class. Thus, the concentrations are plotted considering the whole size range (horizontal bars in the Figure 3). Both instruments provide the same trend for the size distribution, although the Pollutrack sensor seems to underestimate the concentrations or the sizes below about 1 µm.
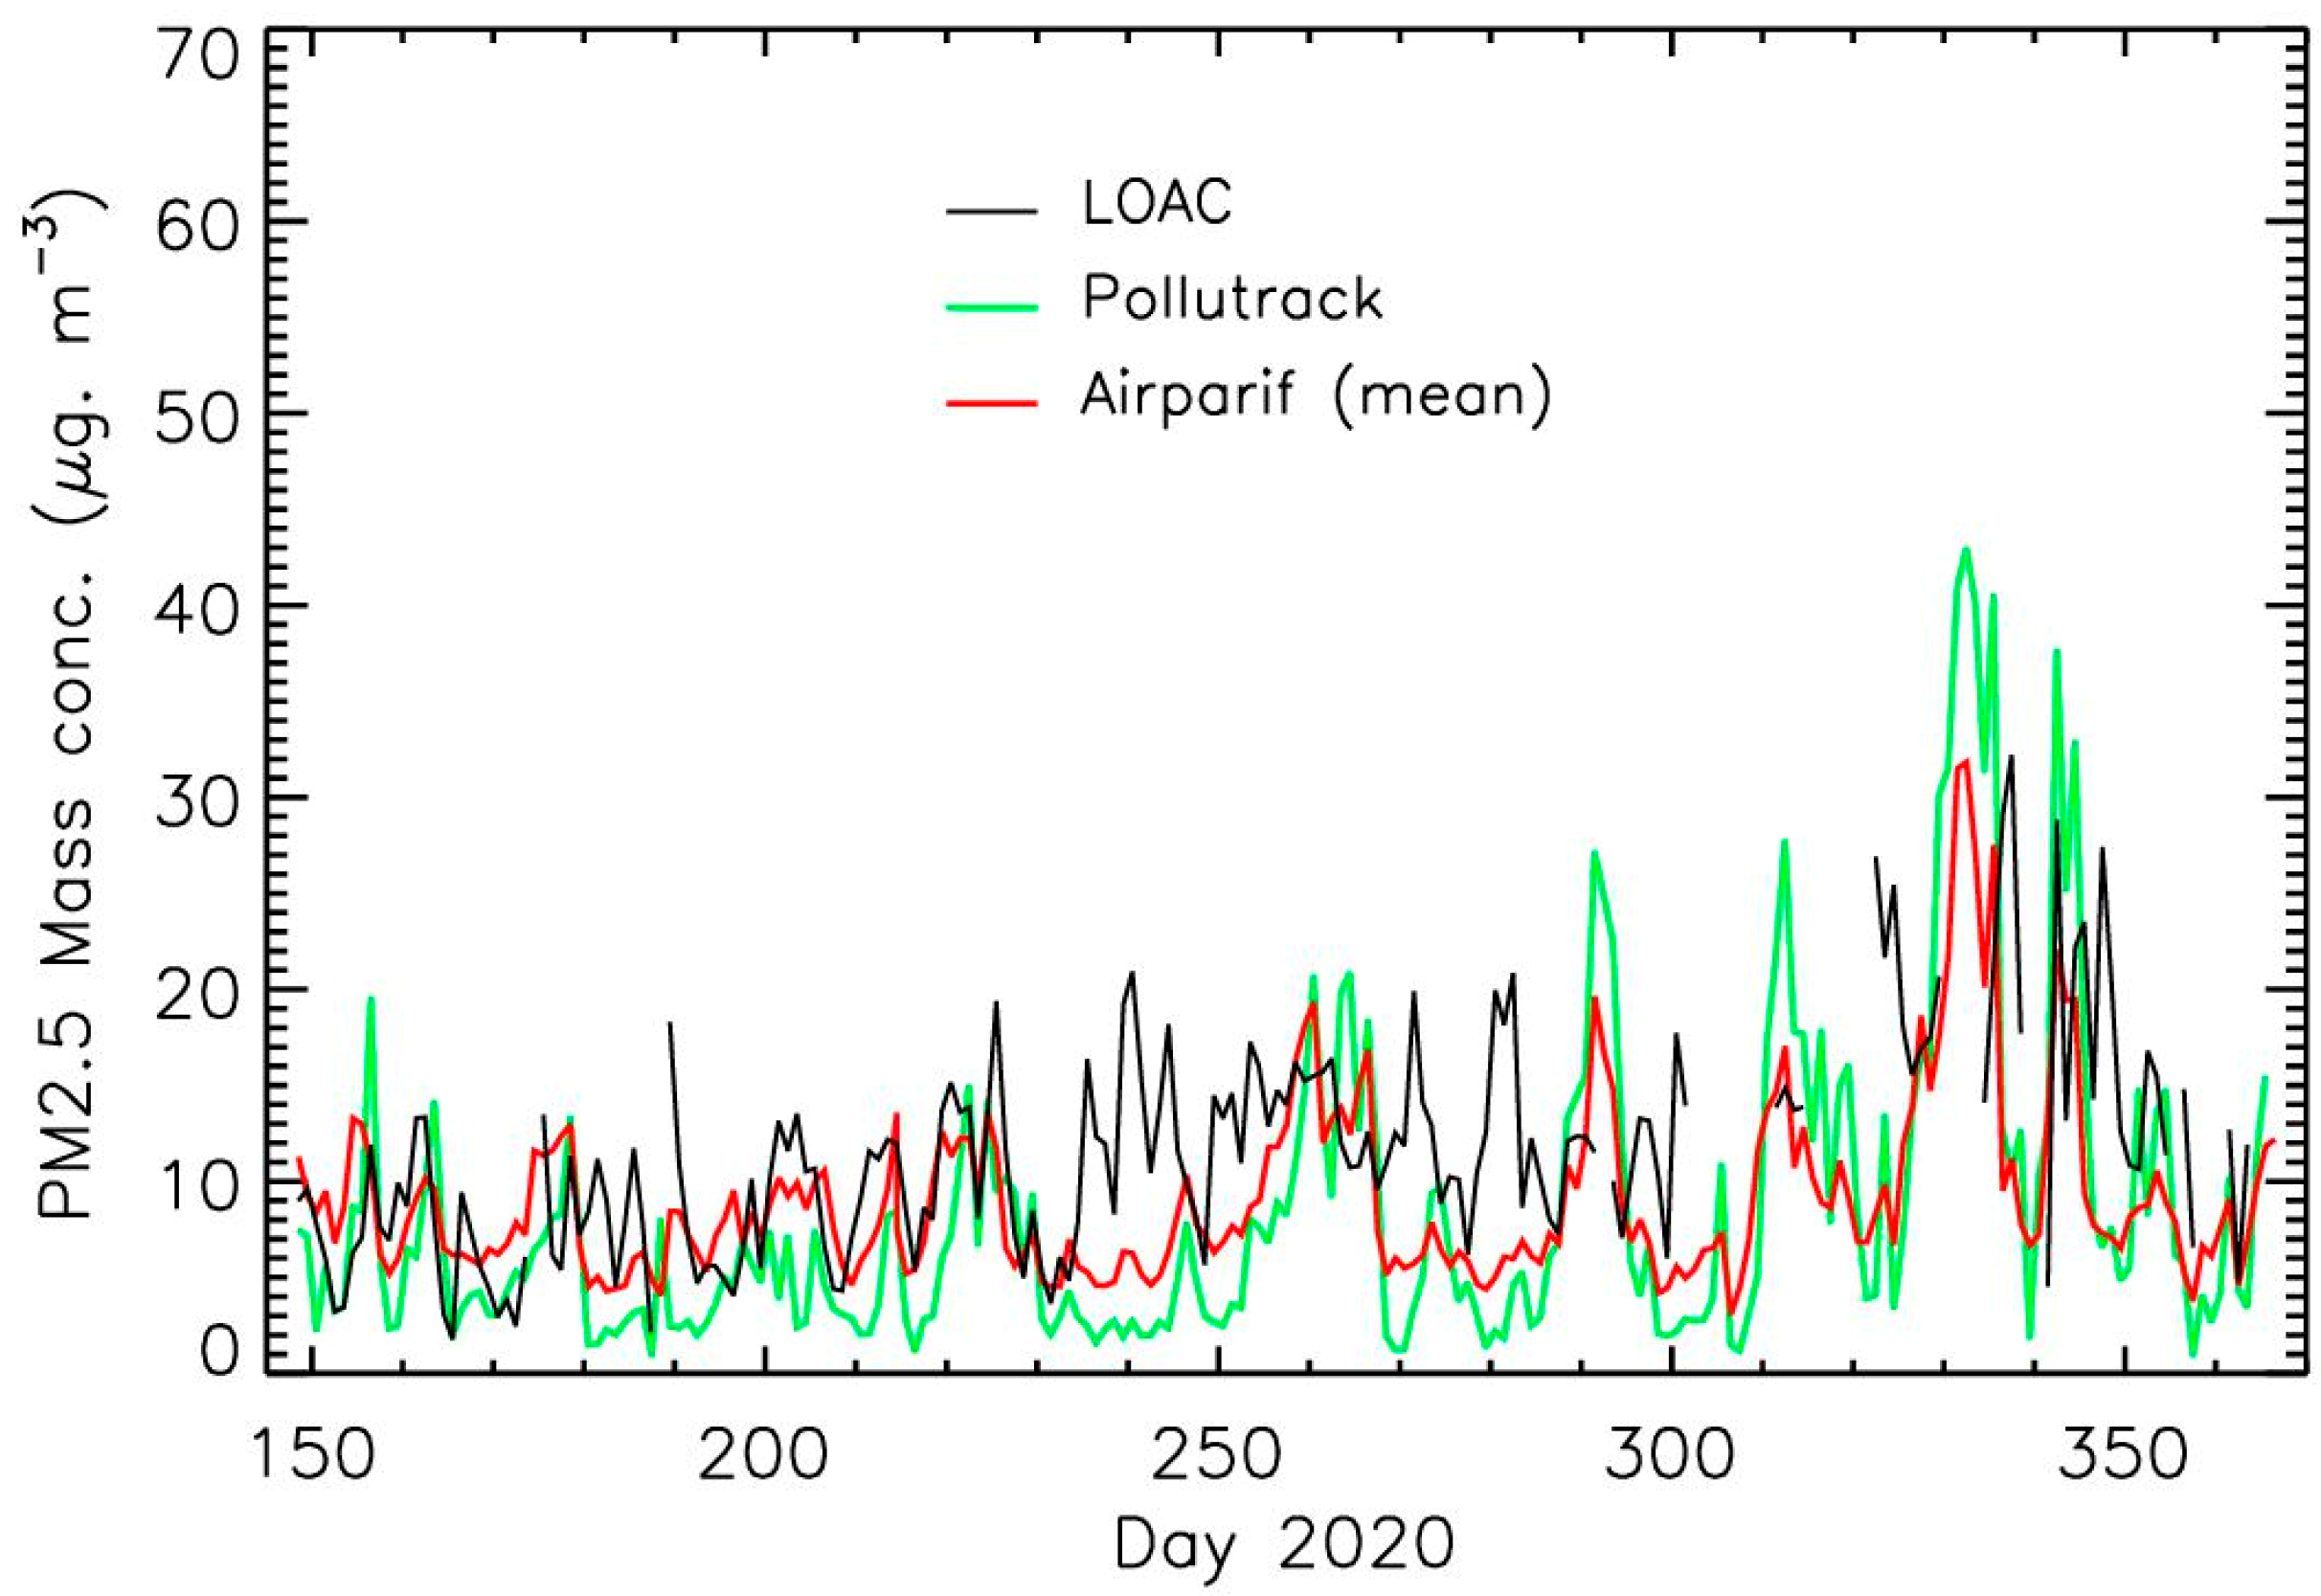
As stated previously, the main goal of Pollutrack is to provide the PM2.5 mass-concentrations. Accordingly, Pollutrack’s daily averaged measurements are compared to the daily averaged PM2.5 LOAC mass-concentrations and to the low-oriented PM2.5 measurements of the Airparif air quality network (Figure 4). From the 13 Airparif PM2.5 measuring stations operated in the Paris Region [19], we have chosen 4 of them that are in the south of Paris and its surrounding region, which are representative of the pollution conditions that can be encountered at the “Ballon de Paris Generali”.
During this period, the pollution level was relatively low mainly due to the COVID-19 induced reduction of overall activity and to some unstable weather conditions, except for several days at the end of November and the beginning of December 2020. All the instruments have captured the same features in terms of pollutions peaks, although some difference in absolute values sometimes occurred due to the difference of location and conditions of air sampling.
Figure 4 and Table 1 present the difference between the 3 different sets of values (the amplitude of the values is not large enough to plot a correlation that can provide significant results). The standard deviation of the difference of Pollutrack sensors with the two other sensors remains in the 4–6 µg. m−3 range (Figure 5), with no significant permanent bias (mean of the differences below 2 µg. m−3). Considering the LOAC uncertainties that are of ±20% and the TEOM microbalances like those used by the Airparif network that can suffer of uncertainties of several µg. m−3 [24], we can consider that the agreement between all these instruments is satisfactory.
The same work has been conducted for the PM10 mass concentrations (Table 2). This time we used the data from an Airparif station located at about 1 km south of the “Ballon de Paris Generali”, and closer to the local traffic. Whilst the LOAC and Airparif sensors appear to be in agreement, the Pollutrack sensor significantly underestimates the concentrations although the main peak pollution peaks are well detected. This difference could be due to the Pollutrack air sampling device purposely conceived for PM2.5 tracking, the collecting conditions not being particularly efficient for the largest particles, these particles being less relevant from a health impact perspective.

3.3. Inter-Comparison of the Mobile Sensors with a Fixed PM Monitoring Station

We consider in this part and in the following part the intercomparison between instruments at fixed stations and Pollutrack instruments that pass near the stations. Tens of different Pollutrack sensors were involved in the process. That way, the measurements uncertainty retrieved for these intercomparison processes encompasses both the reproducibility of the instruments and the measurement errors.
Among the three monitoring stations operated by Airparif that provide the PM2.5 mass concentrations inside Paris (one station) and alongside to its beltway that circles central Paris (two stations), we chose the beltway station at the east of Paris (48°50′22″ N, 2°24′46″ E) which is highly representative of traffic pollution. The inlet for this particular device is at a height of 2.9 m and the station is a few metres away from the border of the ring road.
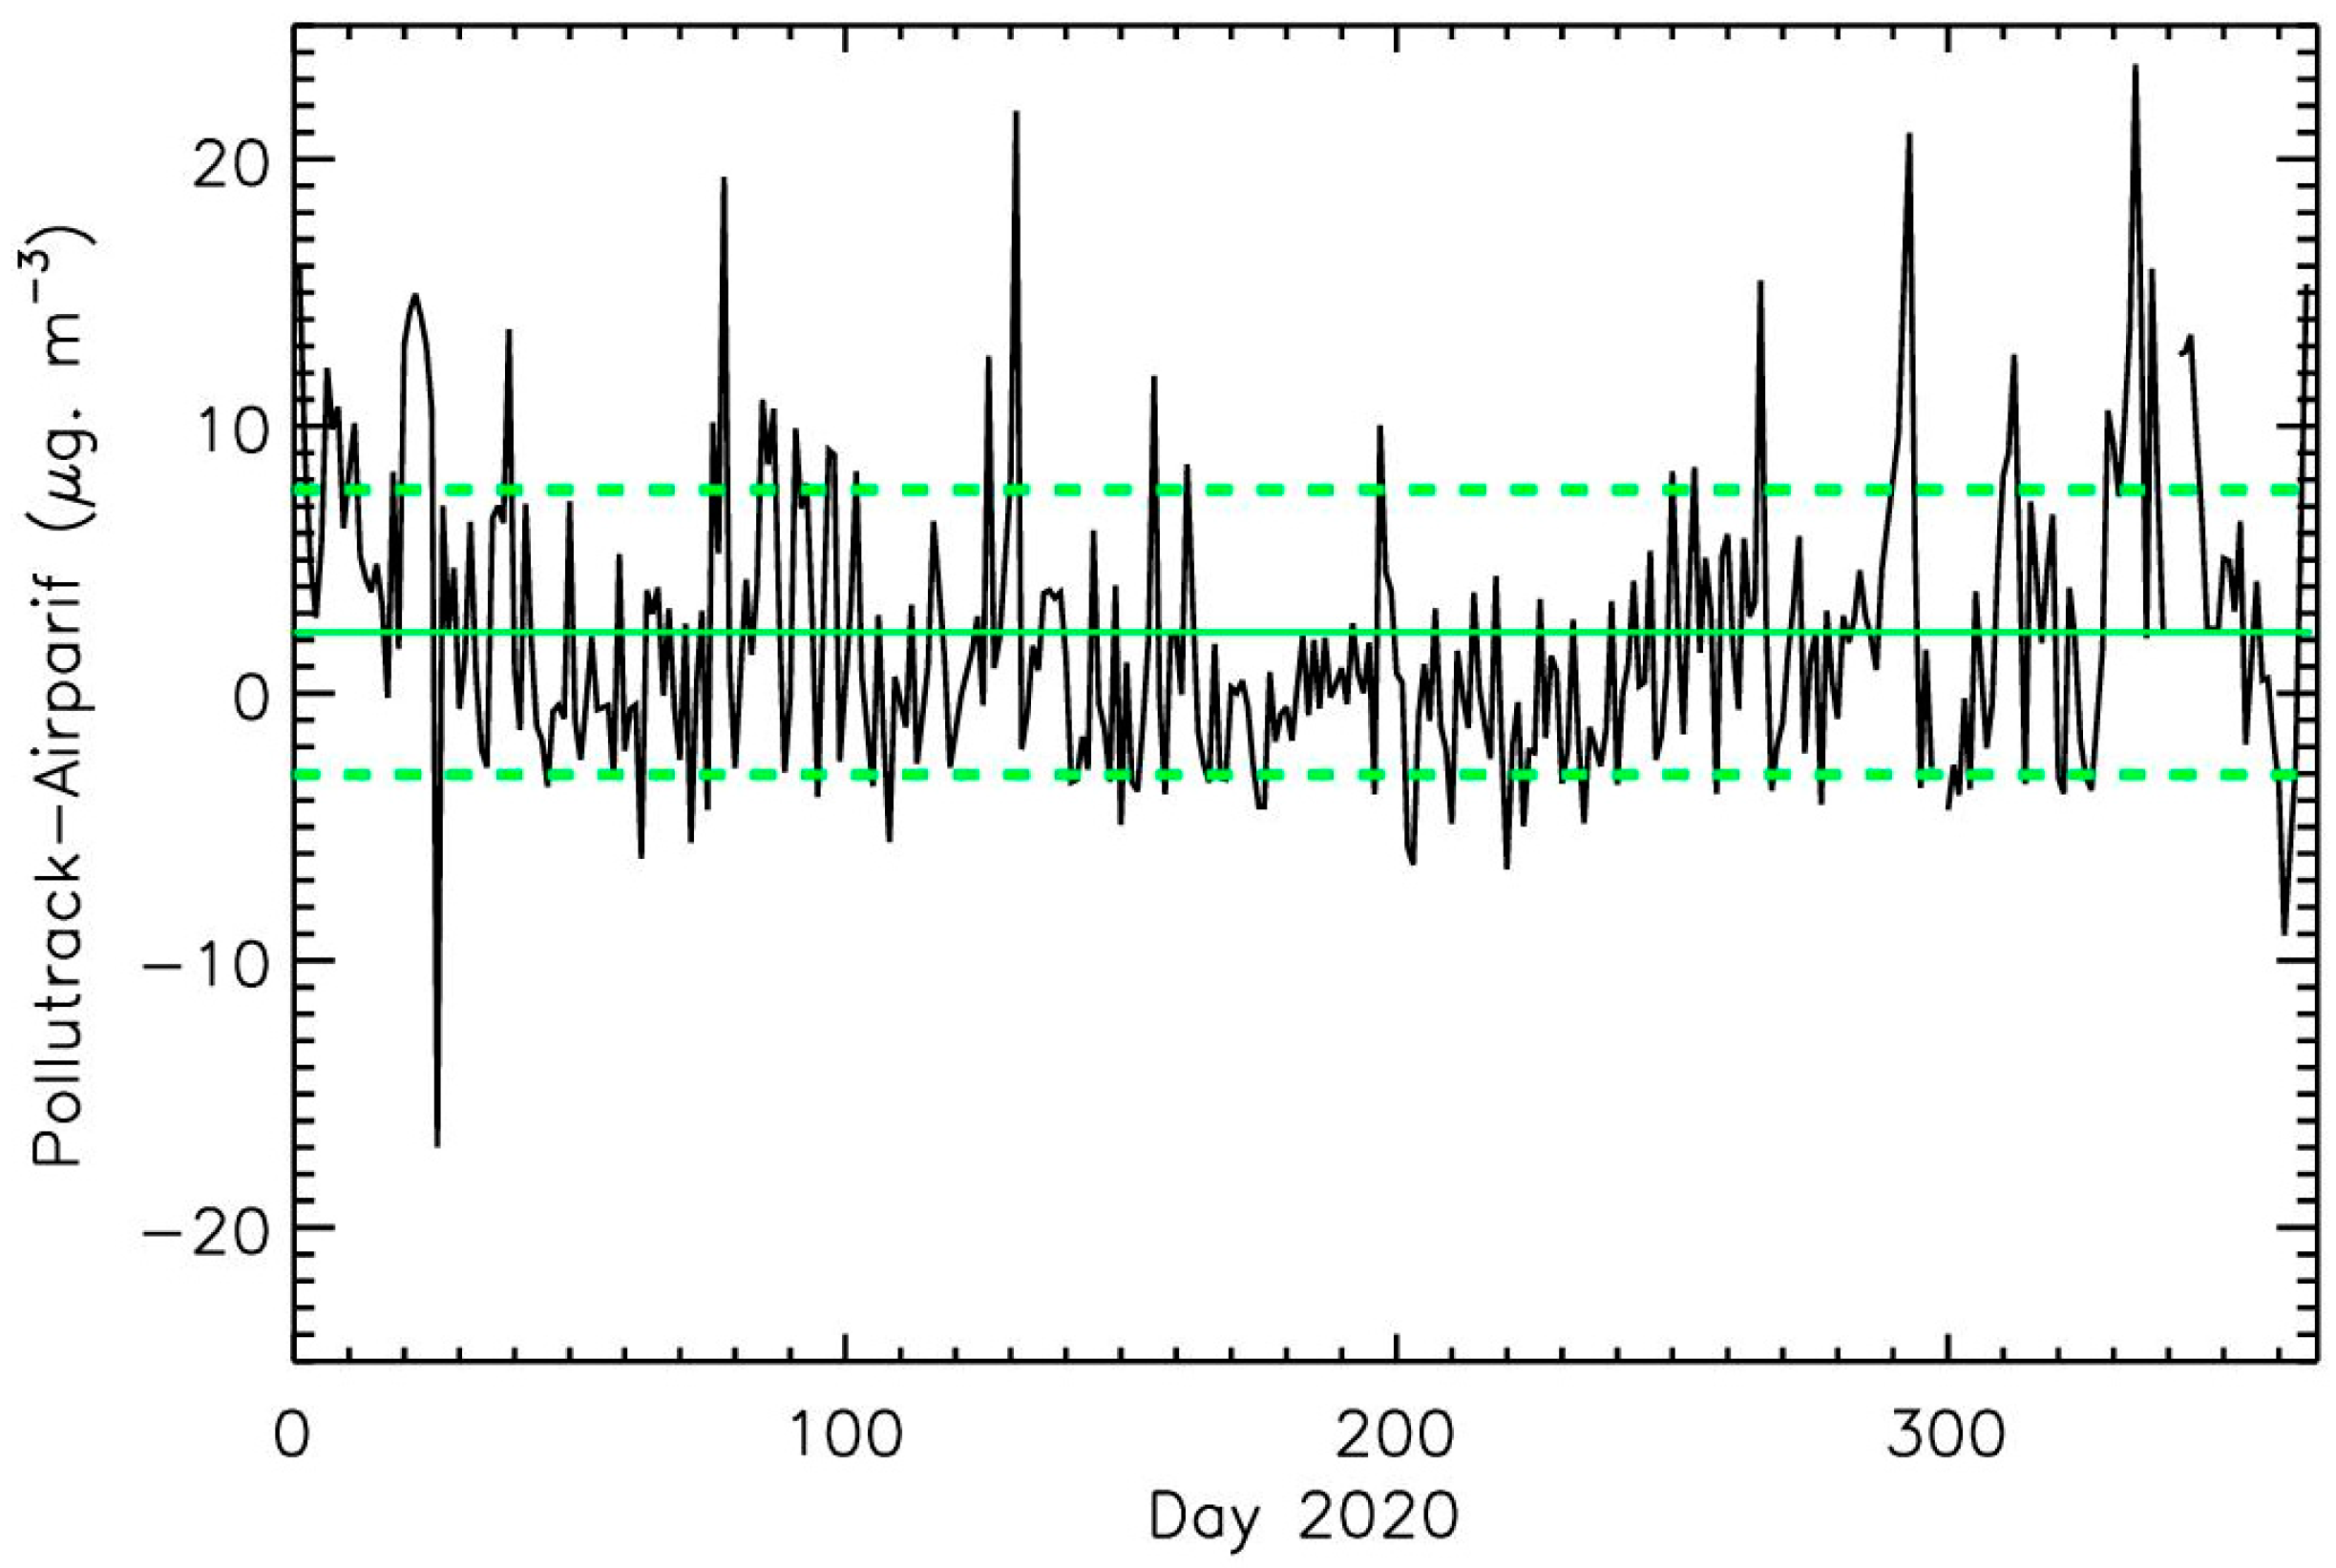
This time, we have considered all of the Pollutrack measurements performed at less than 100 m distance from the Airparif station over the entire year of 2020. More than five sessions of measurements per day are available for 343 days (over the 366 days of 2020, or 94%) with an average of 20 sessions per day. The daily averaged Pollutrack and Airparif data demonstrate very good agreement (Figure 6); the Pollutrack sensors have detected all the main pollution events. The mean difference between the two set of data is of 2.3 µg. m−3 with a standard deviation of 5.3 µg. m−3 (Figure 7). The Pollutrack measurements are on average a little higher than the Airparif ones. In the correlation plot (Figure 8) the slope of the fit is of 0.75, and the value at origin is of 0.2 µg. m−3, with a correlation of 0.88. Reducing the Pollutrack value by 25% will reduce the mean difference to 1.7 µg. m−3 with a standard deviation of 3.7 µg. m−3, and the slope in the correlation plot will be of 1.0. This 25% difference could be partly due to the difference in the collecting conditions since the Pollutrack inlets are at a lower height (about 2 m) than for the Airparif sensors and are well inside the traffic area and thus much closer to the pollution sources.

3.4. Inter-Comparison of the Mobile Sensors with the Fixed Counting Instrument LOAC

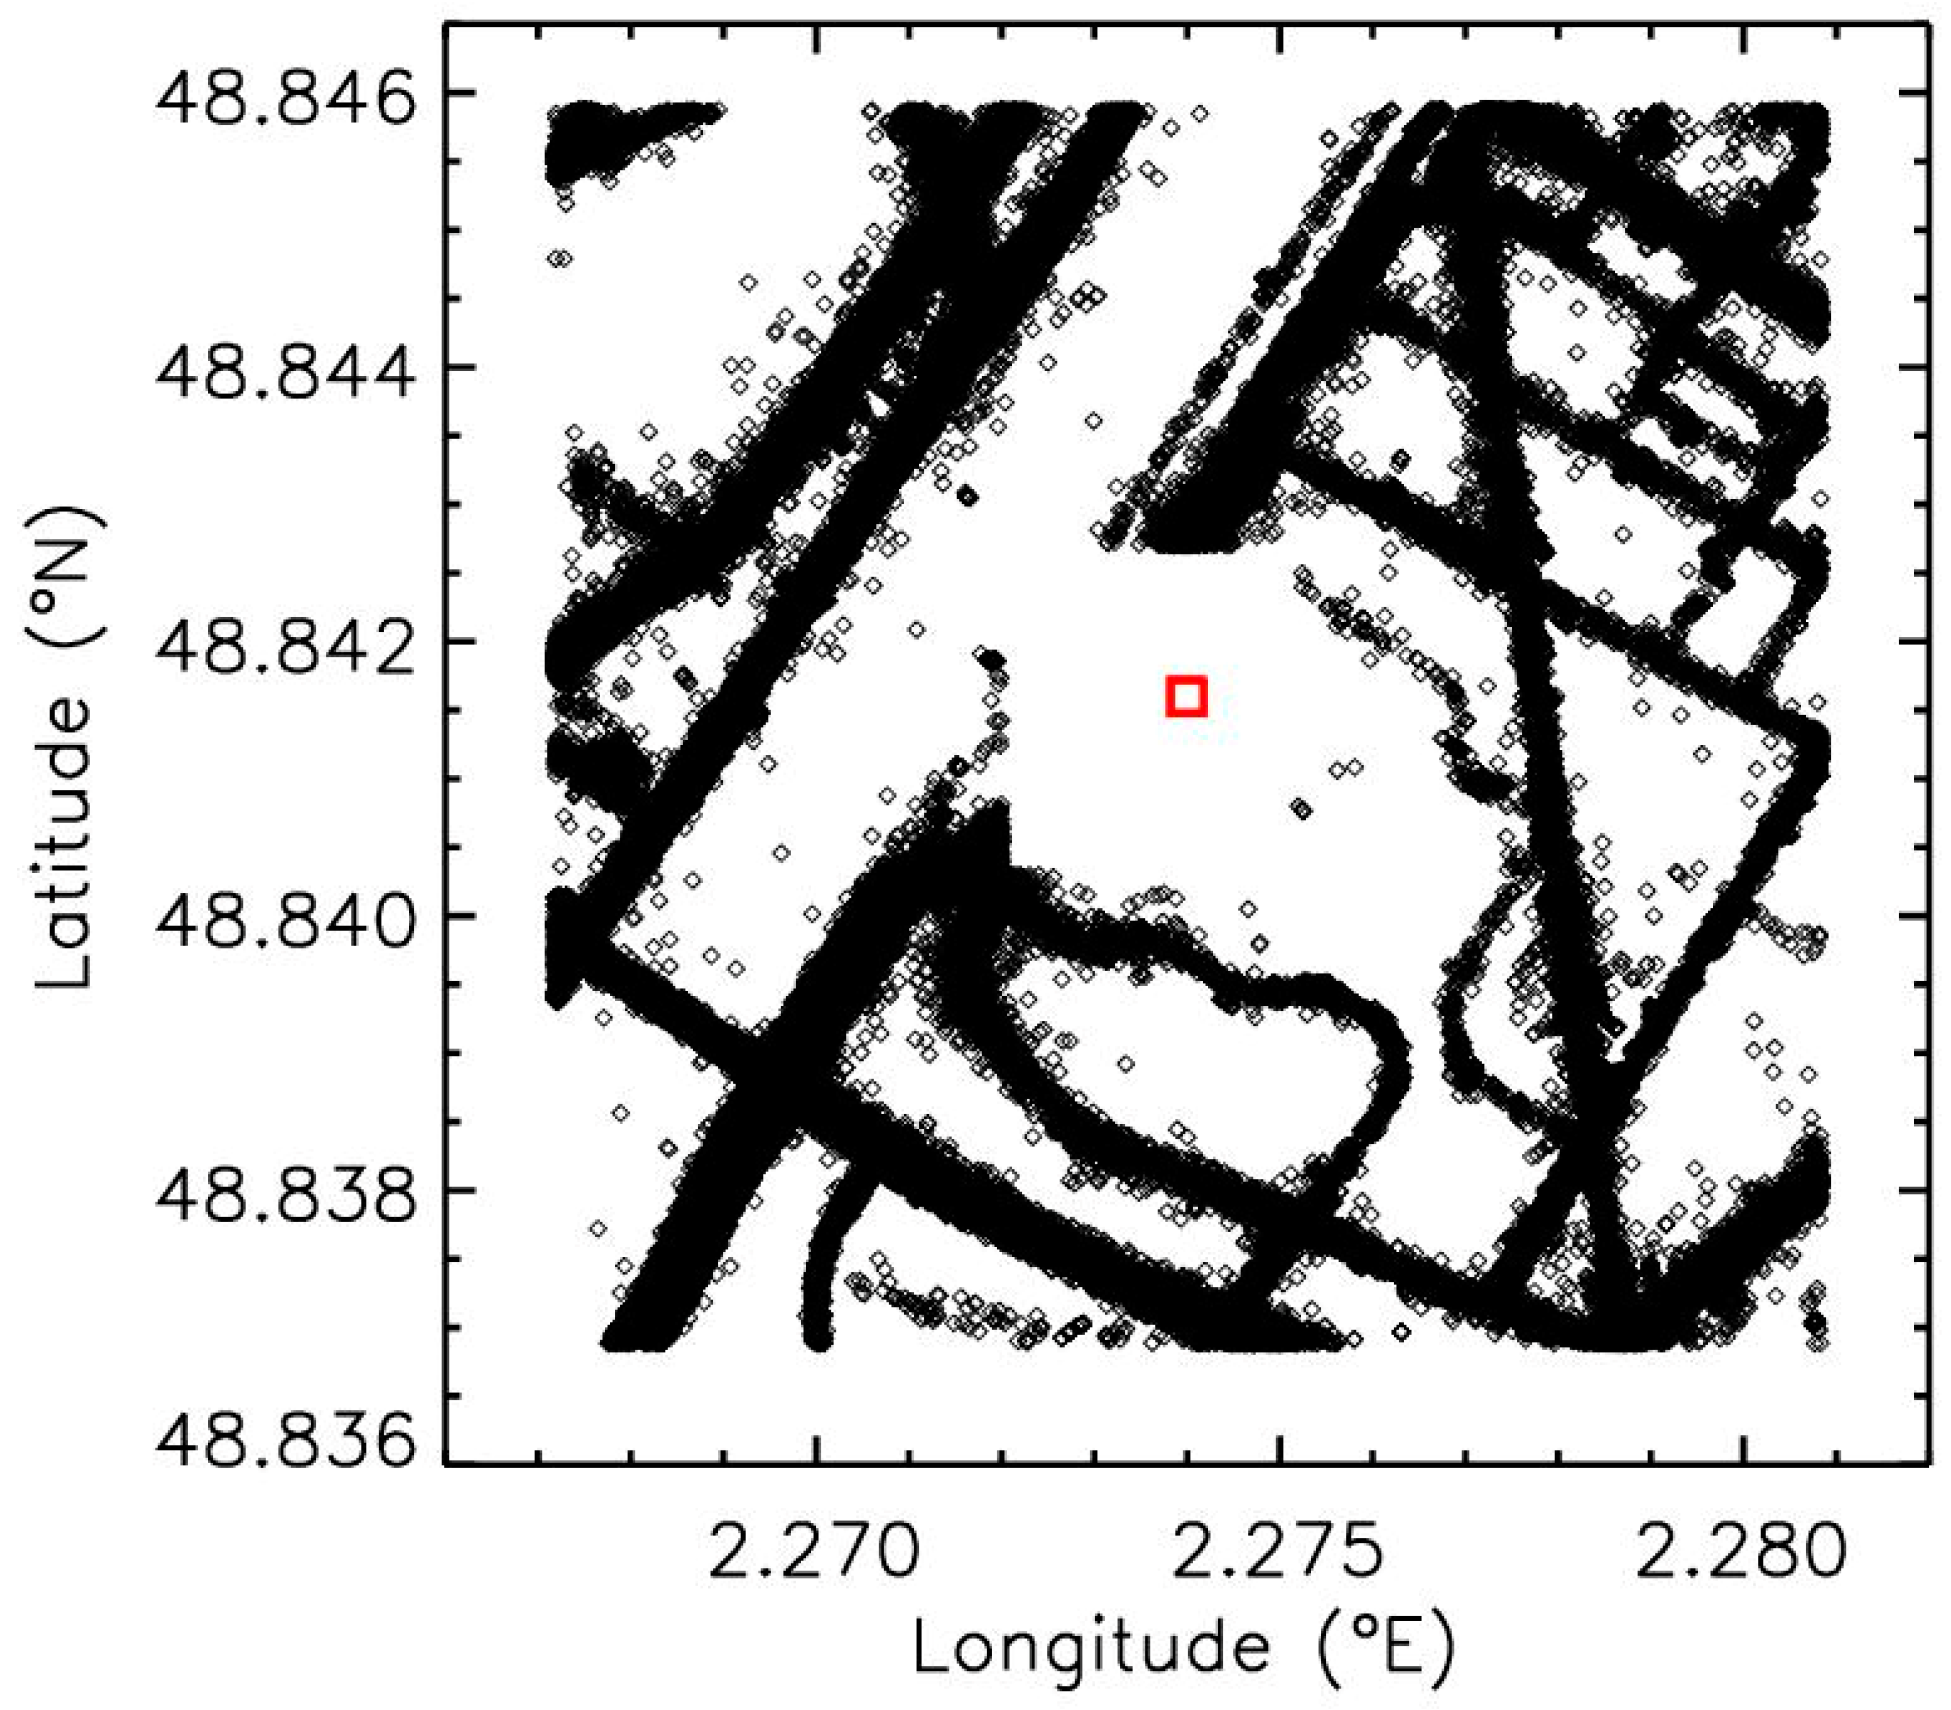
The last inter-comparison concerns the size distributions of LOAC sensor and the mobile Pollutrack sensors obtained in a square of 1 km in diameter centered on the LOAC position at the “Ballon de Paris Generali” (Figure 9), for the 27 March 2019–26 March 2020 period. At this location, the traffic is less intense around the park “André Citroën” than for the previous study in the East part of the Paris beltway). Only the LOAC measurements available at the same time as the Pollutrack measurements are considered for comparison.
The data are averaged over this period to produce a mean size distribution profile for both Pollutrack and the LOAC sensor. Considering the size range calibration previously mentioned, the agreement between the two sets of measurements is very good (Figure 10), and better than in Figure 3. This previous intercomparison was conducted using only one Pollutrack sensor, whilst the present one uses many sensors, which statistically reduce the uncertainties. A small discrepancy remains for the larger particles, once again probably due to the inlet. In the 0.5–3 µm size range, the agreement in the measurements is very good, which is mandatory for the calculation of the PM2.5 mass-concentrations. On the other hand, the number concentration of particles below 0.5 µm are underestimated by the Pollutrack sensors.

3.5. Conclusions of the Inter-Comparisons

From the various inter-comparison exercises presented above, we can conclude that the Pollutrack sensors measure appropriately for the determination of PM2.5 mass concentrations with an uncertainty (standard deviation) of about 5 µg. m−3 or less. The inter-comparisons were conducted during different wind conditions and with vehicles that have different speeds below 70 km/h. No effect of the variability of these parameters on measurement accuracy was detected. Consequently, the relative spatial and temporal variability will be readily detected when greater than several µg. m−3. Obviously, increasing the number of measurements at a given location and in constant pollution level content will increase the accuracy of the results.
The counting inter-comparison with LOAC suggests that the Pollutrack sensors could also be used for the study of PM1 mass-concentrations and for the number concentrations of particles down to about 0.3 µm. On the other hand, the PM10 measurements can still be considered, albeit cautiously, as this is a not a real problem since the legally obligated measurements of PM10 are well performed by the microbalance stations. The smallest particles, which are the most dangerous for human health, can also be studied by other kinds of instruments including the mobile Pollutrack sensors.

4. High-Resolution Maps of Urban PM Pollution

Being able to accumulate such large number of measurements allows us to study the spatial and temporal evolution of urban PM2.5 pollution instead of using calculations based on models constrained by measurements coming from fixed and sparsely located instruments. The number of Pollutrack measurements benefits from the huge number of locations visited, with the main streets offering most of the measurements. Thus, a statistical approach must be used to find the best compromise between the spatial resolution and temporal resolution to produce pollution maps.

4.1. Trends of PM2.5 Content in 2020

As a first step to analyze the spatial variability of the PM2.5 pollution during 2020, Paris was divided in square zones of 1 km side length where the data were averaged annually. Zones of lowest and highest pollution are searched for, excluding the zones adjacent the Paris beltway where the pollution is high due to the traffic level. The lower values are found in the south-west of Paris, which encompass the Park “Andre Citroën” where the “Ballon de Paris Generali” with the LOAC instrument is installed. This could be due to the absence of major roads and to the river Seine that could act as a corridor to carry the winds. The higher values are often encountered in the north-east of Paris but remarkably there are none of the legally obligated measuring stations nor PM2.5 instruments installed at such locations.
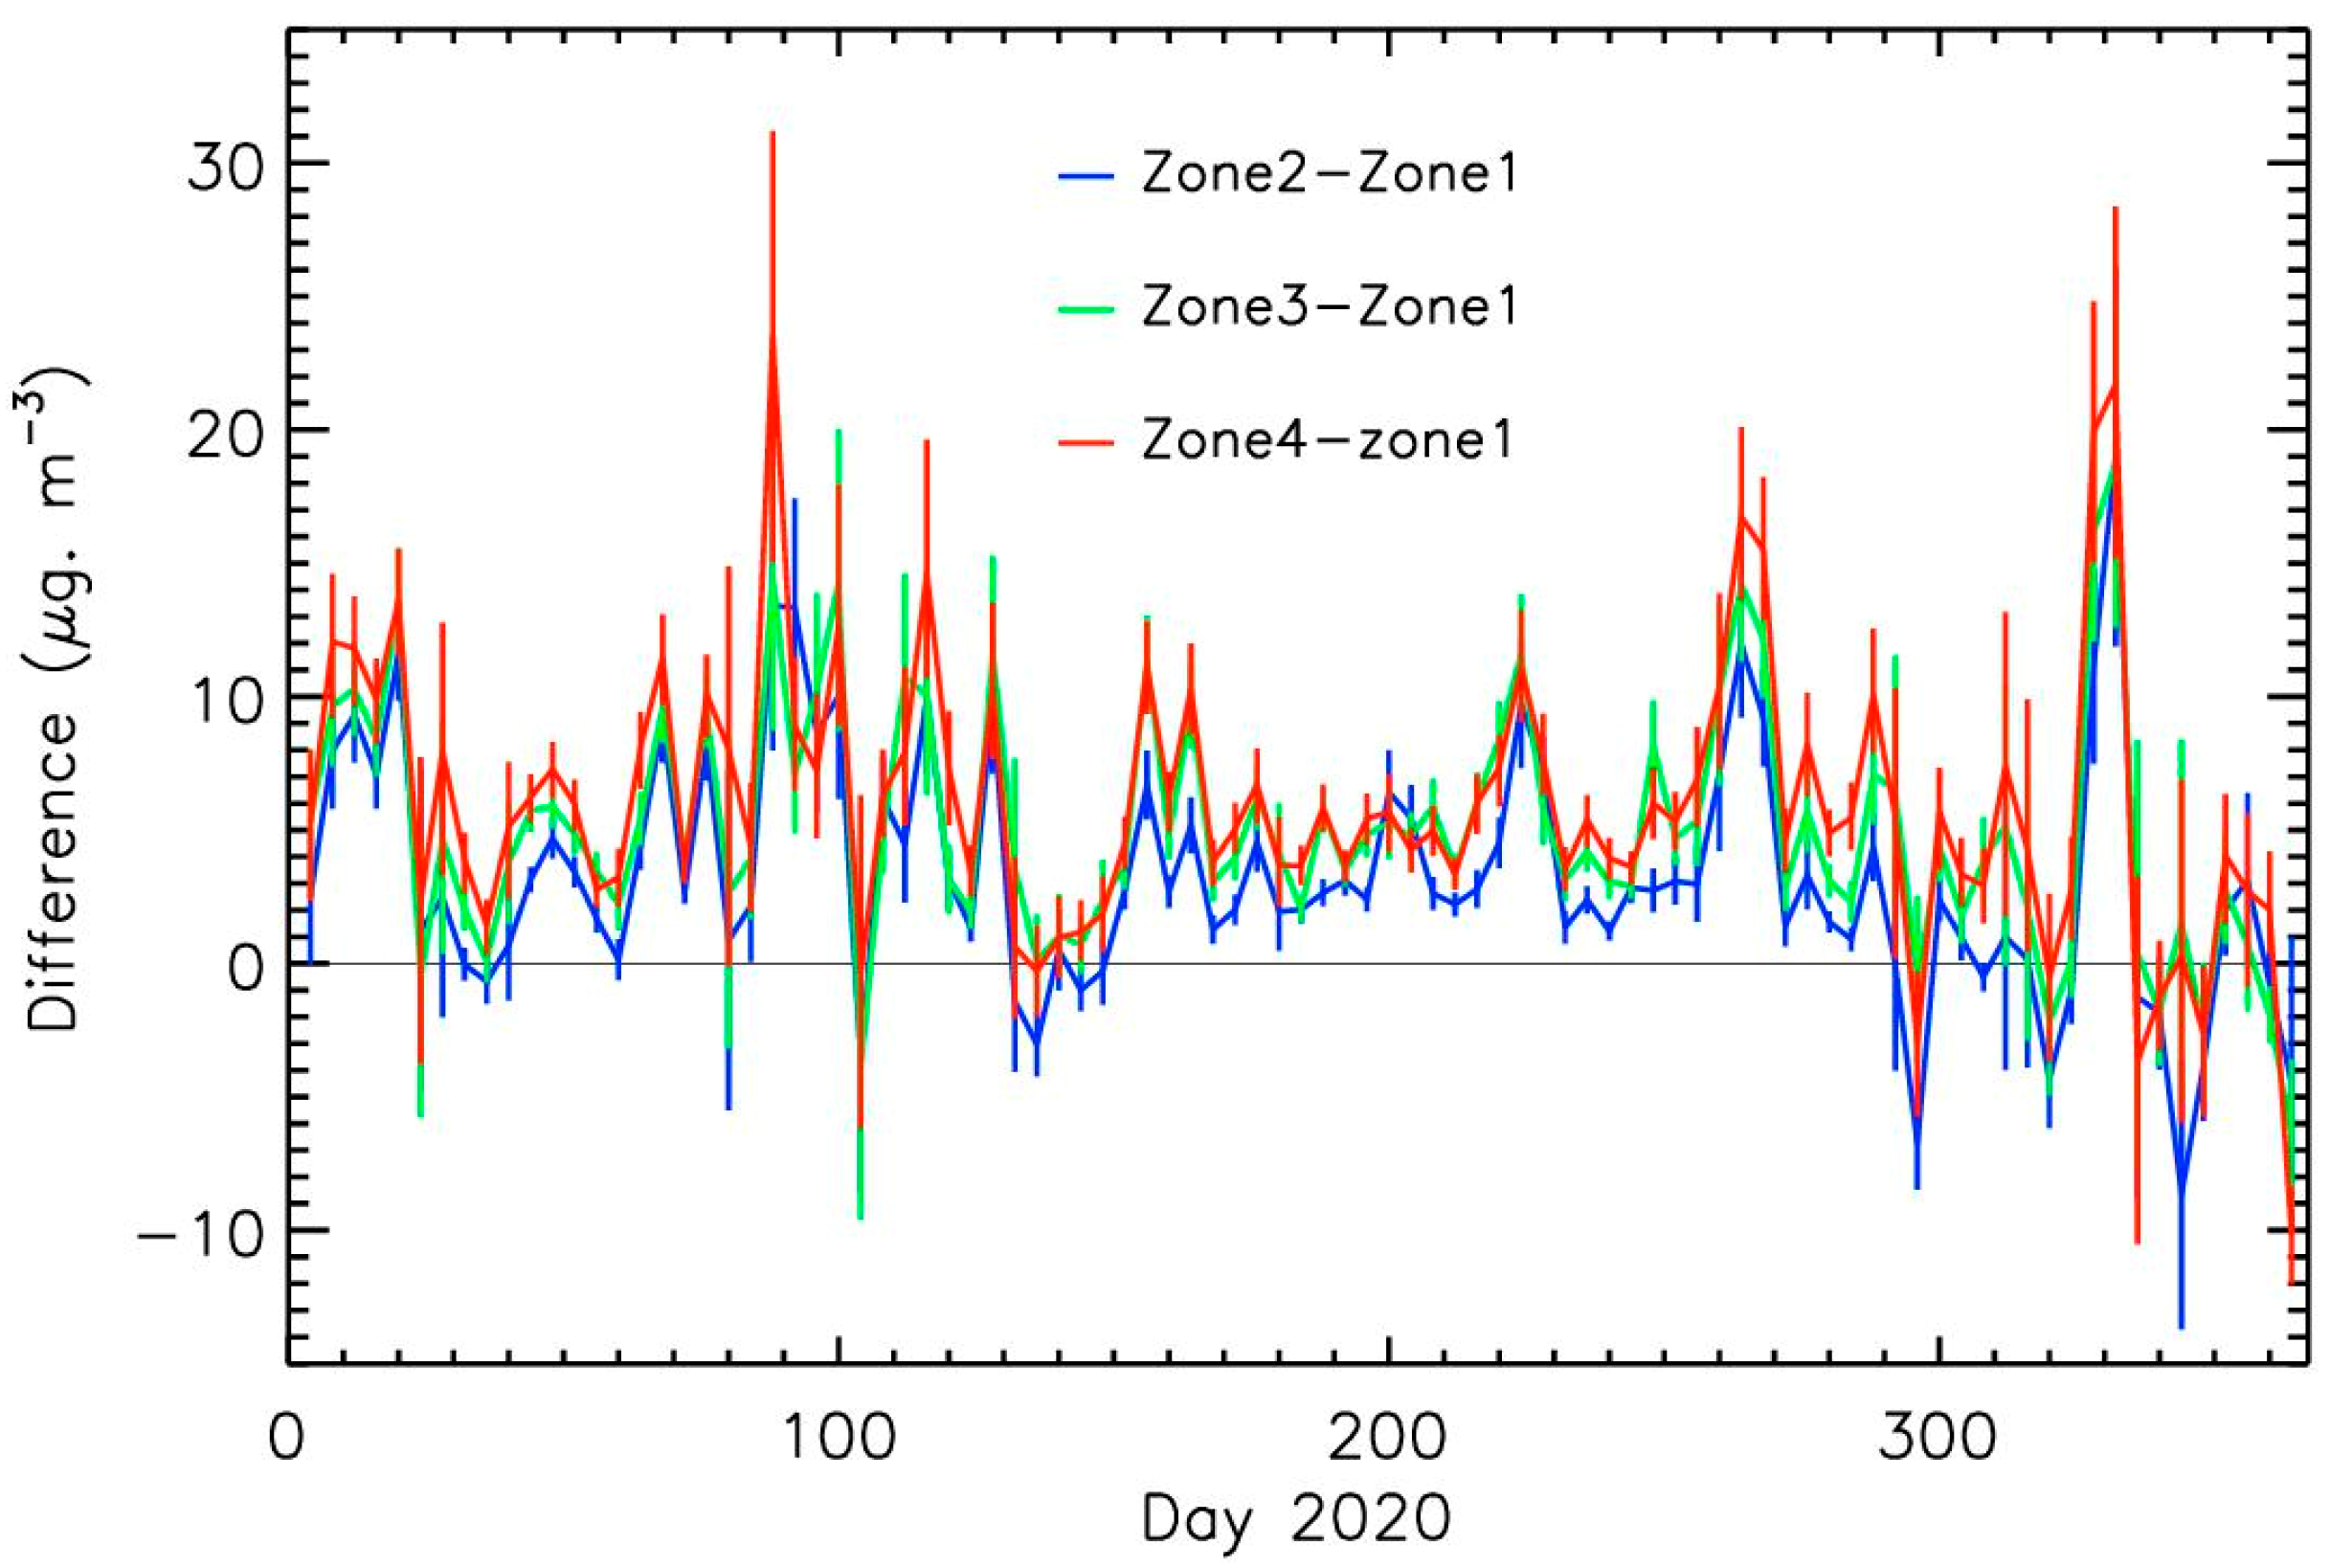
Four locations were chosen to illustrate this spatial variability (Figure 11). Zone 1 corresponds to the lower PM2.5 levels, zone 4 corresponds to the higher PM2.5 levels, and zones 2 and 3 are representative of medium levels. The data are averaged every 4 days to point out the main trends. (Figure 12). During background conditions and during some moderate pollution events <20 µg. m−3 at around days 115 and days 260–270, the zone 1 measurements are always below the other zone measurements with a difference of up to 15 µg. m−3 (thus well above the sensor uncertainty), as shown in Figure 13. This could be explained by a lower level of primary PM sources in this zone compared to the other zones. On the other hand, during some pollution events, around days 25, 80, 105, 290, 315 and 335–345, the four zones exhibit similar values. This could indicate the presence of imported pollution and the production of secondary aerosols at a regional scale. Additionally, the local sources that occupy the boundary area during anticyclonic conditions, as for the days 330–345, can slowly extend to cover all the city. This last case can explain why the PM2.5 content is lower for zone 1 than for the other zones at the beginning of the pollution event in day 330, and then progressively increases to reach the same level as for the other zones few days later.
These first results show the heterogeneity of the PM2.5 level at the urban scale linked to the different sources of PM, to the weather conditions, and to the local topology of the city. Accordingly, high resolution mapping of the PM2.5 pollution is necessary to positively evaluate local variabilities and to identify “hot spots” of PM pollution.

4.2. High Resolution Maps

Daily maps where the measurements are averaged in squares of 100 m side length are used to analyze the different PM2.5 pollution conditions encountered in 2020. As shown in Figure 12, the pollution levels were low from June to September 2020, well below 10 µg. m−3, mainly because of the reduction of industrial and tourist activities during the COVID-19 crisis and the summer holidays. Figure 14 presents the pollution map for the 1 of July 2020 (the grey zones correspond to the absence of measurements). The higher values were obtained for some parts the Paris beltway, some main highways leaving Paris, and locally in some streets and crossroads. Nevertheless, inside Paris, the values remain low and relatively homogenous.
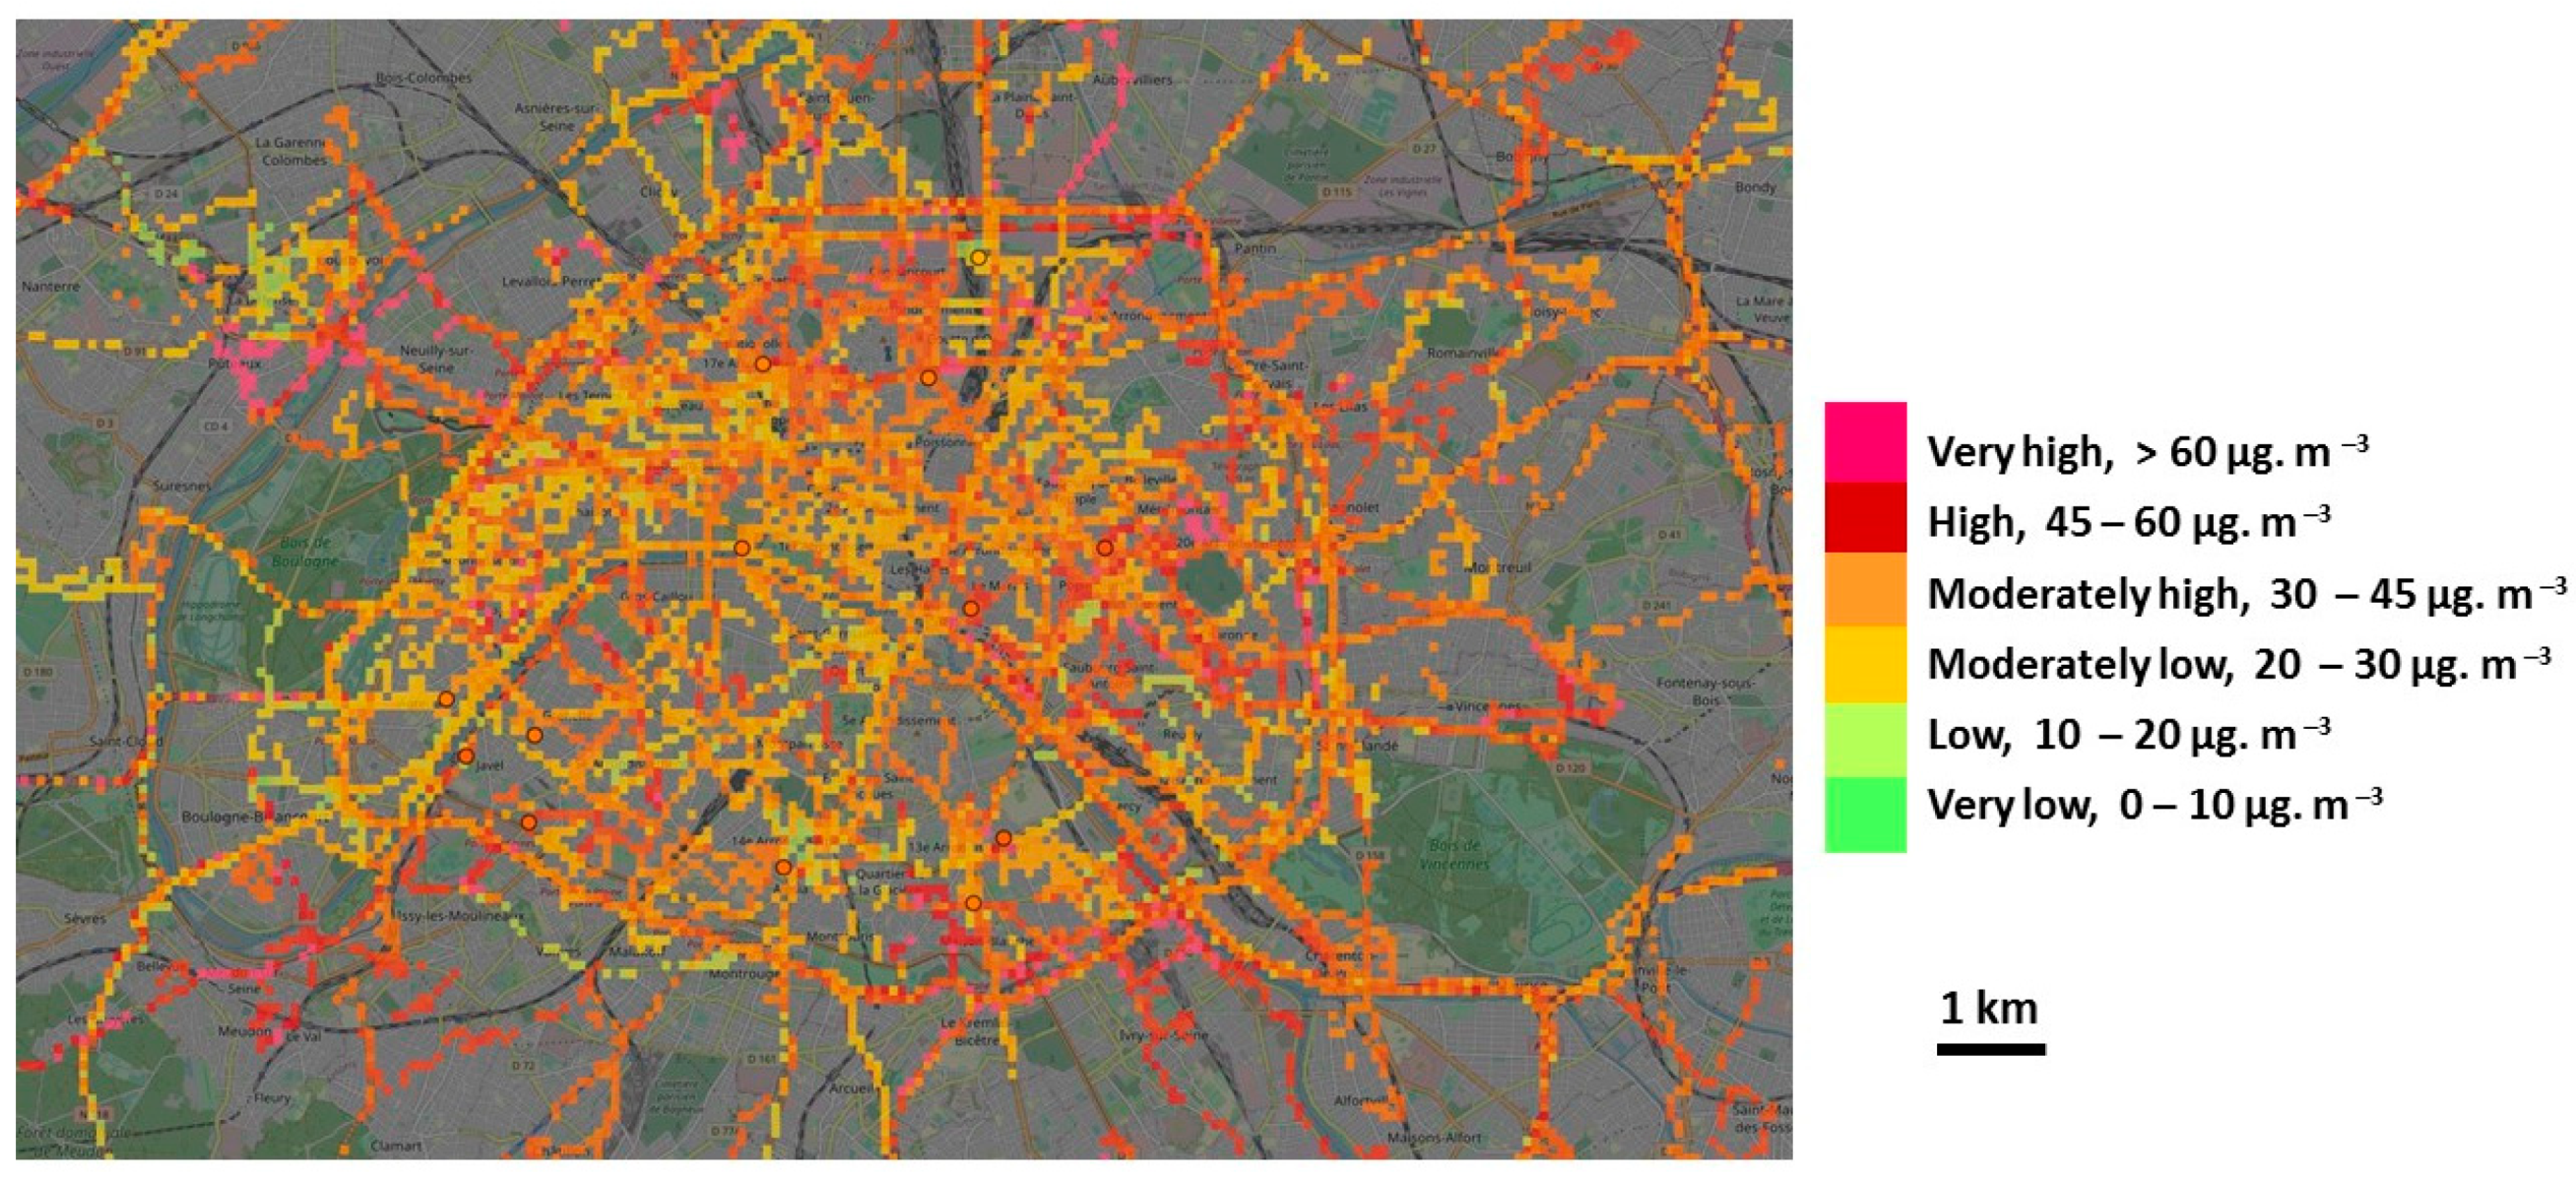
The situation was different for the two moderate pollution peaks in the 20–30th March 2020 periods (days 80–90). These events occurred during the French COVID-19 lockdown (17 March–11 May 2020), where almost all activities were stopped apart from the heating which continued. Obviously, the traffic strongly decreased and thus the number of Pollutrack measurements. The data were averaged over 3 days (26–28 March) to reach a sufficient spatial coverage. This time, the pollution content was not homogeneous, from 20 to 60 µg. m−3 depending on the location inside Paris (Figure 15), with some “hot spots” mostly in the North and East of Paris and lowest values in the West.
Because of the lockdown, the traffic cannot be involved, as confirmed by the typology measurement of LOAC at the “Balloon de Paris Generali” showing that concentration of carbonaceous particles greater than 0.2 µm was reduced by at least 50%. Of some significance is that March is the period of the abundant use of fertilizers by agricultural activities around the Paris region. Accordingly, moderate continental winds of about 5 m. s−1 had transported the nitrate and ammonium gas emitted by the agricultural fields; these gases then combined with nitrogen and sulphate gases to produce secondary aerosols, favoured by sunny and hot conditions. Similar conditions occurred in March 2015 in Paris [25]. However, this time the Pollutrack measurements had shown that the spatial repartition of pollution is more complex than expected even if the contribution of local primary PM sources is low.
Another moderate pollution event occurred between 23 November and 9 December 2020 (days 328–344). More data are available at these dates than in March because of the partial restart of the economy after the lockdown. In the Figure 16, similar spatial variability was detected as during the March pollution event with mass concentrations in the 20–60 µg. m−3 range. The lowest values were encountered in the center-west of Paris. The highest values were encountered in some parts of the Paris beltway but also in some main streets and crossroads inside Paris.
Finally, the highest pollution levels were detected between 21 and 26 January 2020, during strong winter anticyclonic conditions. This time, the pollution seemed relatively spatially homogenous, with values often above 60 µg. m−3 (Figure 17). Vertical profile of the particle number concentrations performed by the LOAC instrument on the 22 January 2020 at the “Ballon de Paris Generali” during the beginning of the pollution episode indicates that the concentrations of particles greater than 0.2 µm remained stable for altitude below 150 m and then decrease above this height. (Figure 18). This situation is similar to the mid-December 2013 pollution event in Paris [22] where the pollution, coming from traffic, heating and industrial activities, was confined close to the ground due to the presence of a temperature inversion layer.

4.3. Pollution “Hot Spots” Inside Paris

The existence of regular “hot spots” can be searched for during the main pollution events. The mean PM mass concentration value is calculated using all the measurements; then only the measurements above this mean value are kept. For the three months with significant pollution events (January, March and November 2020), excesses of PM concentrations are located at the Paris beltway and the motorways leaving Paris (Figure 19). Inside Paris, pollution “hot spots” are mainly present in the North and East during the January and March events, but also during a less important pollution event in September. On the other hand, hot spots are more dispersed for the November event although the West of Paris is again spared. During the period of low pollution, no tendency for the repartition of the hot spots can be pointed out.
The presence of hot spots mainly in the North and East of Paris and their temporal variability, is probably linked not only to the source of the particles and the weather conditions, but also to the local topology of the city. The wind direction and intensity, and the orientation of the streets could affect the way that pollution that is close to the ground is transported and dispersed, where the straight and large streets could benefit from better ventilation than the narrow and winding streets (“the canyon effect”). Further analysis on the transport of primary and secondary aerosols will be needed to confirm or discredit this hypothesis.

5. Conclusions

The high-resolution maps obtained in Paris with the mobile Pollutrack sensors have shown heterogeneities in the spatial distribution of the PM2.5 pollution, which could be due to the topology of the city and its sensitivity to the wind intensities and directions. The North and Eastern parts of Paris are often more polluted than the West, as well as the Paris beltway. Being able to provide such maps in real time could help citizens to adapt (if possible) their travel routes in order to limit their exposure to the more polluted parts of Paris. Additionally, these maps can help the political authorities to limit the traffic in the polluted “hot spots” to reduce the local pollution that affects the citizens (for example close to the schools), and to contribute to the appropriate delineation and monitoring of Low Emission Zones (LEZ) and Ultra Low Emission Zones (ULEZ). Furthermore, the maps can be used to tentatively redefine the best places to install the legally obligated air quality monitoring stations.
In 2021, this strategy of measurement has begun to be implemented in twenty other major European cities in partnership with DPD, which has become the largest European parcel delivery service in the wake of COVID-19’s steady impact on e-commerce activities. Such measurements could be used in the future to improve the European PM2.5 pollution maps routinely produced at present by official air quality agencies from a combination of sparsely located fixed measurement stations, remote sensing satellite measurements and from calculated models.

Author Contributions

Methodology, data analysis, writing, J.-B.R.; data curation, data providing and map conception, C.M. Both authors have read and agreed to the published version of the manuscript.

Funding

This research received no external funding.

Data Availability Statement

The Pollutrack data are not publicly available because they are the property of the Pollutrack Company. The interpretated data can be available on request.

Acknowledgments

The authors acknowledge J. Giacomoni and the Aerophile SAS team for providing the “Balloon de Paris Generali” facilities, Eric Poincelet (Pollutrack) for fruitful discussions and Neil Mearns for the proofreading.

Conflicts of Interest

The authors declare no conflict of interest.

References

  1. Pope, C.A.; Burnett, R.T.; Thun, M.J.; Calle, E.E.; Krewski, D.; Ito, K.; Thurston, G.D. Lung cancer, cardiopulmonary mortality, and long-term exposure to fine particulate air pollution. J. Am. Med. Assoc. 2002, 287, 1132–1141. [Google Scholar] [CrossRef] [Green Version]
  2. Pope, C.A.; Ezzati, M.; Dockery, D.W. Fine-particulate air pollution and life expectancy in the United States. N. Engl. J. Med. 2009, 360, 376–386. [Google Scholar] [CrossRef] [Green Version]
  3. Maesano, C.N.; Morel, G.; Matynia, A.; Ratsombath, N.; Bonnety, J.; Legros, G.; Da Costa, P.; Prud’homme, J.; Annesi-Maesano, I. Impacts on human mortality due to reductions in PM10 concentrations through different traffic scenarios in Paris, France. Sci. Total Environn. 2020, 698, 134257. [Google Scholar] [CrossRef]
  4. Monteiller, C.; Tran, L.; MacNee, W.; Faux, S.; Jones, A.; Miller, B.; Donaldson, K. The pro-inflammatory effects of low-toxicity low-solubility particles, nanoparticles and fine particles, on epithelial cells in vitro: The role of surface area. Occup. Environ. Med. 2007, 64, 609–615. [Google Scholar] [CrossRef] [PubMed] [Green Version]
  5. Bové, H.; Bongaerts, E.; Slenders, E.; Bijnens, E.M.; Saenen, N.D.; Gyselaers, W.; Van Eyken, P.; Plusquin, M.; Roeffaers, M.B.J.; Ameloot, M.; et al. Ambient black carbon particles reach the fetal side of human placenta. Nat. Commun. 2019, 10, 3866. [Google Scholar] [CrossRef] [PubMed]
  6. De Prado Bert, P.; Mae Henderson Mercader, E.; Pujol, J.; Sunyer, J.; Mortamais, M. The effects of air pollution on the brain: A review of studies interfacing environmental epidemiology and neuroimaging. Curr. Environ. Health Rep. 2018, 5, 351–364. [Google Scholar] [CrossRef] [PubMed] [Green Version]
  7. Shehab, M.A.; Pope, F.D. Effects of short-term exposure to particulate matter air pollution on cognitive performance. Sci. Rep. 2019, 9, 8237. [Google Scholar] [CrossRef]
  8. World Health Organization. IARC: Outdoor Air Pollution a Leading Environmental Cause of Cancer Deaths; WHO: Geneva, Switzerland, 2013. [Google Scholar]
  9. Likhvar, V.N.; Pascal, M.; Markakis, K.; Colette, A.; Hauglustaine, D.; Valari, M.; Klimont, Z.; Medina, S.; Kinney, P. A multi-scale health impact assessment of air pollution over the 21st century. Sci. Total Environ. 2015, 514, 439–449. [Google Scholar] [CrossRef] [Green Version]
  10. Health Impacts of Air Pollution from Transportation Sources in Paris. Available online: https://theicct.org/sites/default/files/Paris_pollution_heath_issues_transport_factsheet_20190226.pdf (accessed on 15 April 2021).
  11. Kerschbaumer, A.; Stern, R.; Lutz, M. Origin and influence of PM10 concentrations in urban and in rural environments. In Air Pollution Modeling and Its Application XIX; NATO Science for Peace and Security Series, Serie C: Environmental Security; Borrego, C., Miranda, A.I., Eds.; Springer: Dordrecht, The Netherlands, 2008; pp. 72–80. [Google Scholar]
  12. Ghersi, V.; Rosso, A.; Moukhtar, S.; Lameloise, P.; Sciare, J.; Bressi, M.; Nicolas, J.; Féron, A.; Bonnaire, N. A comprehensive source apportionment study of fine aerosol (PM2.5) in the region of Paris, France. Pollut. Atmos. 2010, 13, 63–72. [Google Scholar]
  13. Freutel, F.; Schneider, J.; Drewnick, F.; von der Weiden-Reinmüller, S.-L.; Crippa, M.; Prévôt, A.S.H.; Baltensperger, U.; Poulain, L.; Wiedensohler, A.; Sciare, J.; et al. Aerosol particle measurements at three stationary sites in the megacity of Paris during summer 2009: Meteorology and air mass origin dominate aerosol particle composition and size distribution. Atmos. Chem. Phys. 2013, 13, 933–959. [Google Scholar] [CrossRef] [Green Version]
  14. Couvidat, F.; Kim, Y.; Sartelet, K.; Seigneur, C.; Marchand, N.; Sciare, J. Modeling secondary organic aerosol in an urban area: Application to Paris, France. Atmos. Chem. Phys. 2013, 13, 983–996. [Google Scholar] [CrossRef] [Green Version]
  15. Petetin, H.; Sciare, J.; Bressi, M.; Gros, V.; Rosso, A.; Sanchez, O.; Sarda-Estève, R.; Petit, J.-E.; Beekmann, M. Assessing the ammonium nitrate formation regime in the Paris megacity and its representation in the CHIMERE model. Atmos. Chem. Phys. 2016, 16, 10419–10440. [Google Scholar] [CrossRef] [Green Version]
  16. Beekmann, M.; Prévôt, A.S.H.; Drewnick, F.; Sciare, J.; Pandis, S.N.; Denier van der Gon, H.A.C.; Crippa, M.; Freutel, F.; Poulain, L.; Ghersi, V.; et al. In situ, satellite measurement and model evidence on the dominant regional contribution to fine particulate matter levels in the Paris megacity. Atmos. Chem. Phys. 2015, 15, 9577–9591. [Google Scholar] [CrossRef] [Green Version]
  17. Fenger, J. Urban air quality. Atmos. Environ. 1999, 33, 4877–4900. [Google Scholar] [CrossRef]
  18. Colvile, R.N.; Hutchinson, E.J.; Mindell, J.S.; Warren, R.F. The transport sector as a source of air pollution. Atmos. Environ. 2001, 35, 1537–1565. [Google Scholar] [CrossRef] [Green Version]
  19. L’Observatoire de la Qualité de l’Air en Île-de-France. Available online: https://www.airparif.asso.fr/ (accessed on 15 April 2021).
  20. Renard, J.-B.; Dulac, F.; Berthet, G.; Lurton, T.; Vignelles, D.; Jégou, F.; Tonnelier, T.; Jeannot, M.; Couté, B.; Akiki, R.; et al. LOAC, a light aerosols counter for ground-based and balloon measurements of the size distribution and of the main nature of atmospheric particles, 1. Principle of measurements and instrument evaluation. Atmos. Meas. Tech. 2016, 9, 1721–1742. [Google Scholar] [CrossRef] [Green Version]
  21. Renard, J.-B.; Dulac, F.; Berthet, G.; Lurton, T.; Vignelles, D.; Jégou, F.; Tonnelier, T.; Jeannot, M.; Couté, B.; Akiki, R.; et al. LOAC, a light aerosols counter for ground-based and balloon measurements of the size distribution and of the main nature of atmospheric particles, 2. First results from balloon and unmanned aerial vehicle flights. Atmos. Meas. Tech. 2016, 9, 3673–3686. [Google Scholar] [CrossRef] [Green Version]
  22. Renard, J.-B.; Michoud, V.; Giacomoni, J. Vertical profiles of pollution particle concentrations in the boundary layer above Paris (France) from the Optical Aerosol Counter LOAC onboard a touristic balloon. Sensors 2020, 20, 1111. [Google Scholar] [CrossRef] [PubMed] [Green Version]
  23. Brattich, E.; Bracci, A.; Zappi, A.; Morozzi, P.; Di Sabatino, S.; Porcù, F.; Di Nicola, F.; Tositti, L. How to get the best from low-cost particulate matter sensors: Guidelines and practical recommendations. Sensors 2020, 20, 3073. [Google Scholar] [CrossRef] [PubMed]
  24. Allen, G.; Sioutas, C.; Koutrakis, P.; Reiss, R.; Lurmann, F.W.; Roberts, P.T. Evaluation of the TEOM method for measurements of ambient particukate mass in urban areas. J. Air Waste Manag. Assoc. 1997, 47, 682–689. [Google Scholar] [CrossRef]
  25. Petit, J.E.; Amodeo, T.; Meleux, F.; Bessagnet, B.; Menut, L.; Grenier, D.; Favez, O. Characterising an intense PM pollution episode in March 2015 in France from multi-site approach and near real time data: Climatology, variabilities, geographical origins and model evaluation. Atmos. Environ. 2017, 155, 68–84. [Google Scholar] [CrossRef]
Figure 1. The Pollutrack sensor on the roof of vans.
Atmosphere 12 00529 g001
Figure 2. Correlation plot between Pollutrack and LOAC during 4 sessions measurements of 40 min in different streets of Paris.
Atmosphere 12 00529 g002
Figure 3. Mean size distribution for the Pollutrack and LOAC sensors at the “Ballon de Paris Generali” for the 20 May 2020 to 31 December 2020 period.
Atmosphere 12 00529 g003
Figure 4. Temporal evolution of the PM2.5 mass concentration at the “Ballon de Paris Generali (LOAC and Pollutrack) with mean value of the microbalances of the Airparif network in the south of Paris and its region.
Atmosphere 12 00529 g004
Figure 5. Temporal evolution of the difference of the PM2.5 mass concentration for the 3 sets of measurements; the dashed line represents the mean and the dotted lines represent the standard deviation.
Atmosphere 12 00529 g005
Figure 6. Comparison between the Pollutrack and Airparif daily averaged PM2.5 measurements.
Atmosphere 12 00529 g006
Figure 7. Black line: difference between Pollutrack and Airparif daily averaged PM2.5 measurements Full green line: mean; green dashed line: standard deviation.
Atmosphere 12 00529 g007
Figure 8. Correlation plot between Pollutrack and Airparif daily averaged PM2.5 measurements. The correlation is of 0.88.
Atmosphere 12 00529 g008
Figure 9. Location of the Pollutrack measurements (small diamonds) and position of the LOAC instrument red Scheme 27 March 2019–26 March 2020 period.
Atmosphere 12 00529 g009
Figure 10. Mean size distribution for the mobile Pollutrack sensors around the “Park André Citroën” and LOAC at the “Ballon de Paris Generali” for the 27 March 2019–26 March 2020 period.
Atmosphere 12 00529 g010
Figure 11. Squares of 1 km width for the averaged Pollutrack PM2.5 measurements. North is up.
Atmosphere 12 00529 g011
Figure 12. Temporal evolution of the PM2.5 measurements for the 4 zones; the data are averaged over 4 days for clarity reasons.
Atmosphere 12 00529 g012
Figure 13. Temporal evolution of the differences between zones 2 to 4 and zone 1.
Atmosphere 12 00529 g013
Figure 14. Pollution map in Paris for the 1 July 2020. North is up.
Atmosphere 12 00529 g014
Figure 15. Pollution map in Paris averaged for the 26–28 March 2020. North is up.
Atmosphere 12 00529 g015
Figure 16. Pollution map in Paris averaged for the 25–27 November 2020. North is up.
Atmosphere 12 00529 g016
Figure 17. Pollution map in Paris for the 25 January 2020. North is up.
Atmosphere 12 00529 g017
Figure 18. Vertical evolution of the number concentrations of particles greater than 0.2 µg obtained on 22 January 2020 with the LOAC aerosol counter at the “Ballon de Paris Generali”.
Atmosphere 12 00529 g018
Figure 19. Hot spots » for January 2020 (a), March 2020 (b), September (c) and November 2020 (d). Linear scale where yellow color represents 50% of measurements above the mean and red color represents 100% of measurements above the mean. North is up.
Atmosphere 12 00529 g019
Table 1. Statistics of the differences between the 3 sets of measurements for the PM2.5.
InstrumentsMean of the Difference (µg. m−3)Standard Deviation of the Difference (µg. m−3)
Pollutrack-LOAC−1.86.4
Pollutrack-Airparif−0.74.4
Airparif-LOAC−0.84.7
Table 2. Statistics of the differences between the 3 sets of measurements for the PM10.
InstrumentsMean of the Difference (µg. m−3)Standard Deviation of the Difference (µg. m−3)
Pollutrack-LOAC−6.98.2
Pollutrack-Airparif6.513.2
Airparif-LOAC−0.46.8
Publisher’s Note: MDPI stays neutral with regard to jurisdictional claims in published maps and institutional affiliations.