Abstract
Vehicle emissions have become one of the most prevailing air contamination sources, including nitrogen oxides, volatile organic compounds, carbon monoxide and particulate matter (PM). Among other air pollutants, PM limits visible sight distance and poses health risks upon inhalation into the human body. This study focused on assessing PM2.5 concentrations in air at different periods of the day at the highly trafficked grade-separated intersection of Sango-Ota, Ogun State, Nigeria. PM2.5 readings were taken at three at-grade points around the intersection’s roundabout between 10:00 a.m. and 5:00 p.m. for four (4) days using the BR-SMART-126 Portable 4-in-1 air quality monitor. The highest level of PM2.5 obtained on Day 1 (Monday) and Day 4 (Thursday) was about 45.1% and 38.6%, respectively, lower than that of Day 3 (Wednesday). The highest concentrations of PM2.5 were recorded between 11:00 and 13:00 and between 16:00 and 18:00 (up to 217 µg/m3) whereas the lowest levels were recorded between 14:00 and 15:00 (as low as 86 µg/m3). The concentration of PM2.5 at the Sango-Ota intersection is adjudged “very poor” with average hourly concentrations between 97 and 370 µg/m3. Outcomes obtained indicate the need for improved measures to control air quality along major road corridors and at intersections in Ogun State and Nigeria at large.
1. Introduction
Urban and peri-urban settlements account for over half of the earth’s current population [1], yet the United Nations project that by 2050, over 70% of the global population will reside in urbanized areas [2]. The need for transport and public infrastructures, amenities, and improved living standards constantly attract masses of people to these areas. This has led to population upsurges within spatial confines and, consequently, increased building density, natural vegetation losses, and increased congestion on roadways [3,4]. Spatially uneven population growth results in environmentally degrading externalities via increased greenhouse gas emissions and accompanying risks on public health both locally and internationally [5,6,7]. Particularly, air pollution is reported to have substantial impacts on humans, not only with regards to atmospheric visibility but health-wise such as respiratory tract infections, increased cases of lung cancer and heart-related illnesses, and untimely death [1,8,9,10,11,12].
Vehicle emissions have become one of the most prevailing sources of air contaminants, including Nitrogen oxide, volatile natural compounds, carbon monoxide and particulate matter (PM) [13]. In 2010, the Health Effects Institute established a relationship between traffic-related air pollution and adverse cardiovascular effects, including increased asthma, heart attack and decreased lung function [14]. Road transportation in Nigeria today can be typically characterized by traffic congestion. Arguably, all state capitals and urban communities in Nigeria endure this issue of gridlock [15]. As such, transportation in Ogun state, and the city of Ota in particular, being one of Nigeria’s major industrial hubs, is characterized by a similar scenario of elongated traffic jams on terribly conditioned roadways, thereby plummeting the quality of air accessible to commuters and near-road residents.
Among other air pollutants, PM limits visibility and poses health risks upon inhalation into the human body. PM not more than 2.5 microns (PM2.5), with a similar characteristic length to a bacterium, are capable of triggering several health risks associated with respiratory and cardiovascular infections, chronic ailments, and birth disorders, while also limiting visibility and sight distances [16]. PM2.5 can be composed of a complex blend of hundreds of chemicals, making it especially harmful. As of 2016, the World Health Organization (WHO) estimated that about 4.2 million premature deaths in both urban and rural areas worldwide were caused by exposure to PM2.5 [17]. These deaths were disproportionately experienced across residents of low-, mid-, and high-income nations with 91% occurring in low- and mid-income nations [17]. As illustrated in Figure 1, major sources of PM2.5 include combustion particles expelled from vehicular traffic systems, industries and power plants, as well as household fuels. Poor roadway and traffic flow conditions may affect PM2.5 concentration levels, thereby inducing air pollution in highly trafficked intersections. Such conditions in urban settings pose gravely on air quality, and consequently, the environment and public health. Hence, assuaging PM2.5 levels is essential in attaining environmental sustainability in line with the United Nation’s Sustainable Development Goals (SDG 3 and 11) [18].
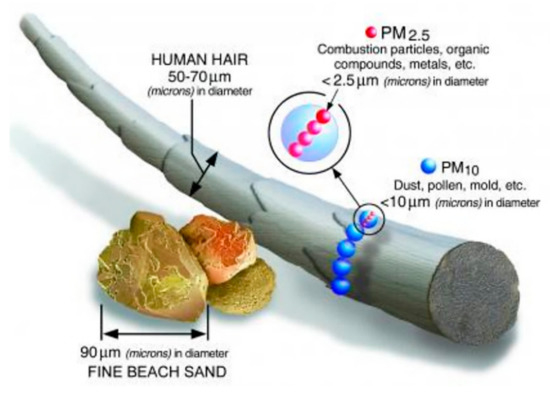
Figure 1.
PM size illustration (Source: USEPA [16]).
Dynamic methods of monitoring air quality on roadways have been established incorporating geographic information system (GIS) and real-time road network monitoring tools [19,20,21]. However, these methods can be cost-intensive especially in developing countries [21]. Likewise, diverse mitigation strategies have been proposed in the past to control the impacts on human health and the environment [22,23,24,25]. These strategies take into account the final stakeholders (public/private agencies and citizens), emission sources (industries, transportation, agriculture, household energy, and shipping areas), and the target of implementation (rural and urban areas) [25].
This study focused on assessing PM2.5 concentrations in air at different periods of the day at the highly trafficked grade-separated intersection of Sango-Ota, Ogun State, Nigeria. Outcomes from the study are targeted towards enhancing potential research directions for the practical implementation of policies regarding the alleviation of PM2.5 pollution.
2. Materials and Methods
2.1. The Study Area
This study was conducted at the Sango-Ota roundabout interchange. The junction is located in the heart of the Ado-Odo/Ota local government area of Ogun State, Nigeria, around Longitude 6°42′27″ N and Latitude 3°14′33″ E, as shown in Figure 2. It serves as the conflict resolution point for traffic on the Lagos–Abeokuta (grade-separated) expressway and the Idiroko–Ijoko (at-grade) road. Traffic studies conducted by Abdul-rahman [26] showed that the Sango section of Idiroko road over-capacitated by about 93% of its design capacity [26]. With such high traffic density, congestions on the road segments and at the intersection are virtually constant throughout the day, with peaks at certain periods, consequently resulting in high concentrations of air pollutants. Figure 3 shows the poor road condition and traffic condition commonly experienced at the Sango-Ota intersection.
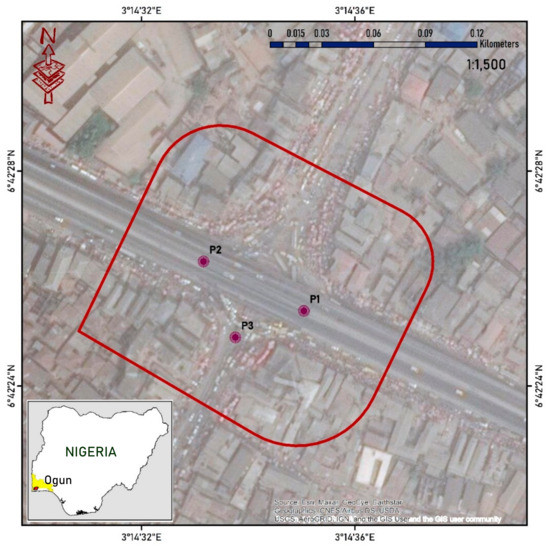
Figure 2.
Satellite imagery of the Sango-Ota intersection within Ota, Ogun State, Nigeria (Developed with ESRI® ArcMap 10.7.1).
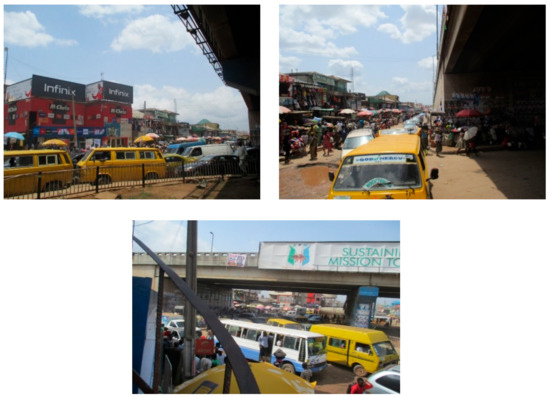
Figure 3.
Traffic congestion and poor pavement condition at the Sango-Ota intersection.
2.2. Test Methods
As indicated in Figure 2, PM2.5 readings were taken at three at-grade points around the intersection’s roundabout. The three points were selected at-grade since the highest levels of congestion are experienced around the roundabout at-grade, hence no grade-separated point was assessed. The average of the three readings obtained over each hourly interval was taken as the intersection’s PM2.5 reading for the hour. Hourly readings were obtained between 10:00 a.m. and 5:00 p.m. for four (4) days from 23 (Monday) to 26 (Thursday) of March 2020. The highest traffic volume/congestion at the intersection are generally experienced between Mondays and Thursdays, compared to other days of the week. The BR-SMART-126 Portable 4-in-1 air quality monitor device with a measuring range of 0–999 µg/m3, resolution of 1.0 µg/m3, and accuracy of ±10% [27], was used to obtain PM2.5 readings while the GARMIN eTrex 10 GPS device was used to obtain the geographic coordinates of the points of measurement. Equipment pre-calibration was performed on the device’s interface before use on each day assessed. Figure 4 shows the equipment used for this study. The device was positioned on a one (1) meter high wooden platform through the period of assessment. Hourly averages were recorded at the end of each hour, and the device reset for the next. The air quality was adjudged based on the Environment Protection Authority (EPA) Victoria [28] hourly criteria for PM2.5 concentration in air.
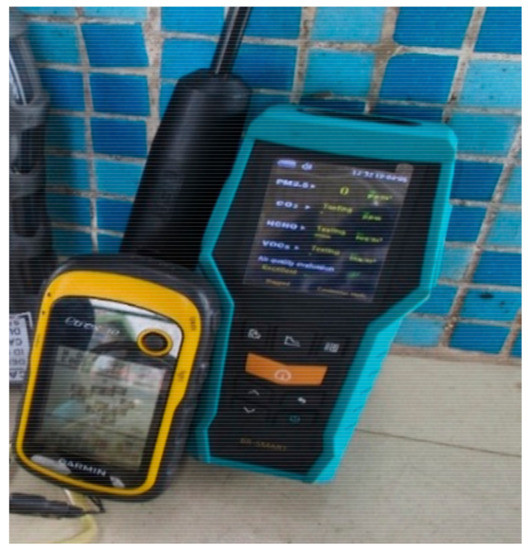
Figure 4.
GARMIN eTrex 10 GPS (left) and BR-SMART-126 Portable 4-in-1 air quality monitor (right) used.
3. Results and Discussion
PM2.5 levels were assessed for 8-h periods (10:00–18:00) over four highly-trafficked weekdays (Monday–Thursday). Concentration levels recorded from the three control points were further evaluated via the Pearson r correlation analysis presented in Table 1. The correlation analysis indicated statistically significant positive correlations between the data obtained from the three control points with r values of 0.838, 0.760, and 0.885.

Table 1.
Pearson r correlation of PM2.5 data across test points.
Furthermore, Figure 5 presents the hourly-averaged PM2.5 levels obtained from the three control points. The results indicate that the highest levels of PM2.5 are experienced on Day 3 (Wednesday) and Day 2 (Tuesday). The highest level of PM2.5 obtained on Day 1 (Monday) and Day 4 (Thursday) were about 45.1% and 38.6%, respectively, lower than that of Day 3. The high concentration observed on Monday may be attributed to the high volume of commuters’ resident in Ota but working within Lagos or Abeokuta. Whereas, with Thursdays being the last full working day of the week, many workers especially in the non-essential public sector begin the weekend holidays from Friday; as such, a high influx of commuters towards Ota is experienced [29]. In terms of hourly variations, the highest concentrations of PM2.5 were recorded between 11:00 and 13:00 and between 16:00 and 18:00. The lowest levels, on the other hand, were recorded between 14:00 and 15:00. The hourly variations observed can be attributed to the variation in traffic volume over the 8-h study period. As reported by Abdul-rahman [26], the highest volumes of traffic experienced at the Sango-Ota segment of the Idiroko-Sango corridor occur twice daily, between 8:00 and 12:00 and between 16:00 and 20:00. As such, it is clear that a relationship exists between traffic volumes and PM2.5 air pollution levels.
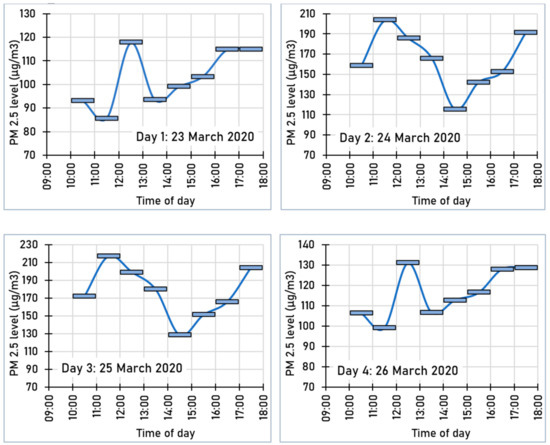
Figure 5.
PM2.5 concentration results averaged hourly (from P1, P2, and P3) over the 4-day observation period.
The PM2.5 level results were further compared to the permissible thresholds set by the WHO [17] and the EPA Victoria [28]. The WHO’s 24 h threshold for PM2.5 is ≤25 µg/m3, while the EPA Victoria threshold for moderate PM2.5 concentration in air is set at 27–62 µg/m3 maximum averaged over 1 h or 25 µg/m3 maximum averaged over 24 h. PM2.5 in this study was assessed over an 8 h period, as such, based on the EPA Victoria criteria, the concentration of PM2.5 at the Sango-Ota intersection is “very poor” since the recorded hourly averaged concentrations fall between 97 and 370 µg/m3, as shown in Figure 6.
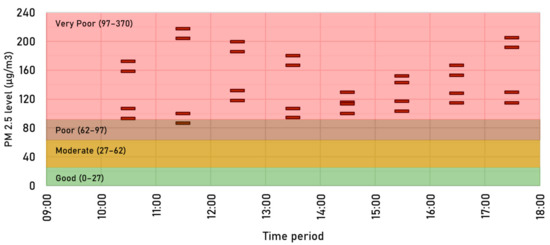
Figure 6.
PM2.5 concentration results evaluated based on EPA Victoria threshold.
4. Conclusions
This study focused on assessing PM2.5 concentrations in air at different periods of the day at the highly trafficked grade-separated intersection of Sango-Ota, Ogun State, Nigeria. The following conclusions were deduced after analysis of data obtained:
- Statistically significant positive correlations were observed between the data obtained from the three control points with r values of 0.838, 0.760, and 0.885.
- The highest level of PM2.5 obtained on Day 1 (Monday) and Day 4 (Thursday) were about 45.1% and 38.6%, respectively, lower than that of Day 3 (Wednesday).
- The highest concentrations of PM2.5 were recorded between 11:00 and 13:00 and between 16:00 and 18:00. The lowest levels, on the other hand, were recorded between 14:00 and 15:00.
- The concentration of PM2.5 at the Sango-Ota intersection is adjudged ‘very poor’ since the recorded hourly averaged concentrations fall between 97–370 µg/m3.
Author Contributions
Conceptualization, D.O.; methodology, D.O. and D.E.; software, D.B.; validation, D.O. and G.B.; formal analysis, D.B.; investigation, D.E.; data curation, D.E..; writing—original draft preparation, D.B.; writing—review and editing, D.O. and G.B.; supervision, D.O. All authors have read and agreed to the published version of the manuscript.
Funding
This research received no external funding.
Data Availability Statement
All data generated are presented within the article.
Acknowledgments
The authors hereby acknowledge the Management of Covenant University for the enabling environment provided for this study and for the publication support.
Conflicts of Interest
The authors declare no conflict of interest.
References
- Chun, B.; Choi, K.; Pan, Q. The nexus between PM 2.5 and urban characteristics in the Texas triangle region. Transp. Res. Part D Transp. Environ. 2020, 78, 102187. [Google Scholar] [CrossRef]
- United Nations Department of Economic and Social Affairs [UNDESA]. 2018 Revision of World Urbanization Prospects; United Nations: New York, NY, USA, 2018. [Google Scholar]
- Broitman, D.; Koomen, E. Residential density change: Densification and urban expansion. Comput. Environ. Urban Syst. 2015, 54, 32–46. [Google Scholar] [CrossRef]
- Chang, Y.S.; Lee, Y.J.; Choi, S.S.B. Is there more traffic congestion in larger cities? Scaling analysis of the 101 largest U.S. urban centers. Transp. Policy 2017, 59, 54–63. [Google Scholar] [CrossRef]
- Martins, A.J.; Isherwood, C.M.; Vasconcelos, S.P.; Lowden, A.; Skene, D.J.; Moreno, C.R.C. The effect of urbanization on sleep, sleep/wake routine, and metabolic health of residents in the Amazon region of Brazil. Chronobiol. Int. 2020, 37, 1335–1343. [Google Scholar] [CrossRef]
- Yim, S.H.L.; Wang, M.; Gu, Y.; Yang, Y.; Dong, G.; Li, Q. Effect of Urbanization on Ozone and Resultant Health Effects in the Pearl River Delta Region of China. J. Geophys. Res. Atmos. 2019, 124, 11568–11579. [Google Scholar] [CrossRef]
- Wang, R.; Feng, Z.; Liu, Y.; Qiu, Y. Is lifestyle a bridge between urbanization and overweight in China? Cities 2020, 99, 102616. [Google Scholar] [CrossRef]
- Yang, T.; Liu, W. Does air pollution affect public health and health inequality? Empirical evidence from China. J. Clean. Prod. 2018, 203, 43–52. [Google Scholar] [CrossRef]
- Wang, H.; Zhang, Y.; Zhao, H.; Lu, X.; Zhang, Y.; Zhu, W.; Nielsen, C.P.; Li, X.; Zhang, Q.; Bi, J.; et al. Trade-driven relocation of air pollution and health impacts in China. Nat. Commun. 2017, 8, 1–7. [Google Scholar] [CrossRef]
- Liu, H.; Zhang, X.; Zhang, H.; Yao, X.; Zhou, M.; Wang, J.; He, Z.; Zhang, H.; Lou, L.; Mao, W.; et al. Effect of air pollution on the total bacteria and pathogenic bacteria in different sizes of particulate matter. Environ. Pollut. 2018, 233, 483–493. [Google Scholar] [CrossRef]
- Turner, M.C.; Andersen, Z.J.; Baccarelli, A.; Diver, W.R.; Gapstur, S.M.; Pope, C.A.; Prada, D.; Samet, J.; Thurston, G.; Cohen, A. Outdoor air pollution and cancer: An overview of the current evidence and public health recommendations. Cancer J. Clin. 2020, 70, 460–479. [Google Scholar] [CrossRef]
- Olukanni, D.O.; Esu, C.O. Estimating greenhouse gas emissions from port vessel operations at the Lagos and Tin Can ports of Nigeria. Cogent Eng. 2018, 5, 1507267. [Google Scholar] [CrossRef]
- Zhang, K.; Batterman, S. Air pollution and health risks due to vehicle traffic. Sci. Total Environ. 2013, 450–451, 307–316. [Google Scholar] [CrossRef]
- Matz, C.J.; Egyed, M.; Hocking, R.; Seenundun, S.; Charman, N.; Edmonds, N. Human health effects of traffic-related air pollution (TRAP): A scoping review protocol. Syst. Rev. 2019, 8, 1–5. [Google Scholar] [CrossRef]
- Obadina, E.O.; Akinyemi, Y.C. Analysis of Traffic Congestion on Lagos/Abeokuta Expressway-Agege Motorway in Lagos Metropolis. J. Environ. Earth Sci. 2018, 8, 7–17. [Google Scholar]
- United States Environmental Protection Agency [USEPA]. Particulate Matter (PM) Basics. Available online: https://www.epa.gov/pm-pollution/particulate-matter-pm-basics (accessed on 19 February 2021).
- World Health Organization [WHO]. Ambient (Outdoor) Air Pollution. Available online: https://www.who.int/news-room/fact-sheets/detail/ambient-(outdoor)-air-quality-and-health (accessed on 22 February 2021).
- United Nations Department of Economic and Social Affairs [UNDESA]. #Envision2030: 17 Goals to Transform the World for Persons with Disabilities. Available online: https://www.un.org/development/desa/disabilities/envision2030.html (accessed on 20 February 2021).
- Lotrecchiano, N.; Sofia, D.; Giuliano, A.; Barletta, D.; Poletto, M. Real-time on-road monitoring network of air quality. Chem. Eng. Trans. 2019, 74, 241–246. [Google Scholar] [CrossRef]
- Lin, M.D.; Lin, Y.C. The application of GIS to air quality analysis in Taichung City, Taiwan, ROC. Environ. Model. Softw. 2002, 17, 11–19. [Google Scholar] [CrossRef]
- Elbir, T.; Mangir, N.; Kara, M.; Simsir, S.; Eren, T.; Ozdemir, S. Development of a GIS-based decision support system for urban air quality management in the city of Istanbul. Atmos. Environ. 2010, 44, 441–454. [Google Scholar] [CrossRef]
- Sierra-Vargas, M.P.; Teran, L.M. Air pollution: Impact and prevention. Respirology 2012, 17, 1031–1038. [Google Scholar] [CrossRef]
- Liang, P.; Zhu, T.; Fang, Y.; Li, Y.; Han, Y.; Wu, Y.; Hu, M.; Wang, J. The role of meteorological conditions and pollution control strategies in reducing air pollution in Beijing during APEC 2014 and Victory Parade 2015. Atmos. Chem. Phys. 2017, 17, 13921–13940. [Google Scholar] [CrossRef]
- Zou, B.; Li, S.; Lin, Y.; Wang, B.; Cao, S.; Zhao, X.; Peng, F.; Qin, N.; Guo, Q.; Feng, H.; et al. Efforts in reducing air pollution exposure risk in China: State versus individuals. Environ. Int. 2020, 137, 105504. [Google Scholar] [CrossRef]
- Sofia, D.; Gioiella, F.; Lotrecchiano, N.; Giuliano, A. Mitigation strategies for reducing air pollution. Environ. Sci. Pollut. Res. 2020, 27, 19226–19235. [Google Scholar] [CrossRef] [PubMed]
- Abdul-rahman, T.A. Analysis of Traffic Congestion on Major Urban Roads in Nigeria. Digit. Innov. Contemp. Res. Sci. Eng. Technol. 2019, 7, 1–10. [Google Scholar] [CrossRef]
- GMM Technoworld BRAMC BR-SMART-126SE 4-in-1 Air Quality Monitor PM2.5 PM10 Formaldehyde (HCHO) VOCs—Air Particle/PM2.5 Counter—Air Quality Monitor. Available online: https://testmeter.sg/webshaper/store/viewprod.asp?pkproductitem=537&pkproduct= (accessed on 21 March 2021).
- Environment Protection Authority Victoria. PM2.5 Particles in the Air. Available online: https://www.epa.vic.gov.au/for-community/environmental-information/air-quality/pm25-particles-in-the-air (accessed on 10 January 2021).
- Ogunbayo, B.F.; Ajao, A.M.; Alagbe, O.T.; Ogundipe, K.E.; Tunji-Olayeni, P.F.; Ogunde, A.O. Residents’ Facilities satisfaction in housing project delivered by Public Private Partnership (PPP) in Ogun state, Nigeria. Int. J. Civ. Eng. Technol. 2018, 9, 562–577. [Google Scholar]


Publisher’s Note: MDPI stays neutral with regard to jurisdictional claims in published maps and institutional affiliations. |
© 2021 by the authors. Licensee MDPI, Basel, Switzerland. This article is an open access article distributed under the terms and conditions of the Creative Commons Attribution (CC BY) license (http://creativecommons.org/licenses/by/4.0/).