Article

Permafrost Biases Climate Signals in δ18Otree-ring Series from a Sub-Alpine Tree Stand in Val Bever/Switzerland

by
Jussi Grießinger
1,*,
Wolfgang Jens-Henrik Meier
1,*,
Alexander Bast
2,
Annette Debel
1,
Isabelle Gärtner-Roer
3 and
Holger Gärtner
4
1
Institute of Geography, Friedrich-Alexander-University Erlangen-Nürnberg, 91058 Erlangen, Germany
2
WSL Institute for Snow and Avalanche Research SLF, 7260 Davos Dorf, Switzerland
3
Department of Geography, University of Zürich, 8057 Zürich, Switzerland
4
Swiss Federal Research Institut WSL, Forest Dynamics, Dendrosciences, 8903 Birmensdorf, Switzerland
*
Authors to whom correspondence should be addressed.
Atmosphere 2021, 12(7), 836; https://doi.org/10.3390/atmos12070836
Submission received: 19 May 2021 / Revised: 23 June 2021 / Accepted: 28 June 2021 / Published: 28 June 2021
(This article belongs to the Special Issue Climate and the Oxygen Isotope Patterns from Trees)

Abstract

:
During recent decades, stable oxygen isotopes derived from tree-ring cellulose (δ18OTRC) have been frequently utilised as the baseline for palaeoclimatic reconstructions. In this context, numerous studies take advantage of the high sensitivity of trees close to their ecological distribution limit (high elevation or high latitudes). However, this increases the chance that indirect climatic forces such as cold ground induced by permafrost can distort the climate-proxy relationship. In this study, a tree stand of sub-alpine larch trees (Larix decidua Mill.) located in an inner alpine dry valley (Val Bever), Switzerland, was analysed for its δ18OTRC variations during the last 180 years. A total of eight L. decidua trees were analysed on an individual base, half of which are located on verified sporadic permafrost lenses approximately 500 m below the expected lower limit of discontinuous permafrost. The derived isotope time series are strongly dependent on variations in summer temperature, precipitation and large-scale circulation patterns (geopotential height fields). The results demonstrate that trees growing outside of the permafrost distribution provide a significantly stronger and more consistent climate-proxy relationship over time than permafrost-affected tree stands. The climate sensitivity of permafrost-affected trees is analogical to the permafrost-free tree stands (positive and negative correlations with temperature and precipitation, respectively) but attenuated partly leading to a complete loss of significance. In particular, decadal summer temperature variations are well reflected in δ18OTRC from permafrost-free sites (r = 0.62, p < 0.01), while permafrost-affected sites demonstrate a full lack of this dependency (r = 0.30, p > 0.05). Since both tree stands are located just a few meters away from one another and are subject to the same climatic influences, discrepancies in the isotope time series can only be attributed to variations in the trees’ source water that constraints the climatic fingerprints on δ18OTRC. If the two individual time series are merged to one local mean chronology, the climatic sensitivity reflects an intermediate between the permafrost-free and –affected δ18OTRC time series. It can be deduced, that a significant loss of information on past climate variations arises by simply averaging both tree stands without prior knowledge of differing subsurface conditions.

1. Introduction

Mountains are recognised as important indicators displaying the fortified impact of climate and environmental change. They exhibit dynamics in physical and biological systems that are more directly identifiable than in other geographical regions or ecosystems [1,2,3]. For high elevation sites, Pepin and Seidel [4] reported for the second half of the 20th century a median surface warming of +0.13 °C/decade. This warming is even more pronounced during the most recent decades, clearly indicating a more enhanced and further accelerating increase in temperature [5]. In a study focusing on elevation-dependent warming, Pepin et al. [6] stated that the warming in mountains is verifiably amplified with elevation. As a result, high-mountain environments experience more rapid temperature changes compared to ecosystems at lower elevations. In addition to the most apparent responses of glacier systems towards these changes, permafrost as one key component of the terrestrial system in continental high mountain environments shows an extremely high sensitivity to climate change. For example, the large-scale thawing of alpine permafrost already is—and will be in future—one key component in adjusting regional hydrological cycles in high mountain ecosystems [7].
Profound knowledge about pre-industrial baselines of (hydro)climate is an essential precondition for decision-makers and climatologists (i) to set observed recent climate trends from instrumental datasets or climate models into a long-term context, (ii) to validate findings on climate change derived by forward modeling with (past) natural climate variability and (iii) to de-couple anthropogenic effects from natural (climate) variability. Since the sparsity of available instrumental records from remote high-mountain areas limits the robustness of statements and model outputs on climate change, climate proxy datasets are a key component in evaluating information on past climate variability. During recent decades, the use of stable oxygen isotope ratios (18O/16O) stored in tree-ring cellulose (δ18OTRC) underlined its capability for serving as a highly valuable paleoclimatic proxy. Numerous studies across the globe revealed that δ18OTRC is a reliable recorder of temperature [8,9,10,11] and various hydroclimate variables such as precipitation, relative humidity, cloud cover or drought indices [12,13,14,15]. Moreover, extreme events impacting the regional hydrology as cyclone activity, flooding or river discharge can be reconstructed by δ18OTRC [16,17,18,19]. Short-term (weekly/seasonal) to long-term (interannual/decadal) variations in large-scale circulation patterns are also stored in δ18OTRC-series, e.g., due to varying moisture sources [20,21,22,23,24,25], which in turn strongly bias/overprint local climate conditions. Several parameters mentioned above may contribute in a similar proportion to the annual δ18OTRC signal at a specific sampling site, further exacerbated by feasible changing stabilities of the climate-proxy relationships [12,26]. Ultimately, the complex sensitivity of δ18OTRC hampers the identification and disentanglement of a single causative climate parameter [27]. Yet, the advantage of investigating δ18O from organic tree tissues is its ability to interlink different natural archives via the water cycle [21].
In trees, the isotopic composition of atmospheric (source) water is strongly modified by various fractionation processes occurring at leaf level [27,28,29,30,31,32,33]. This includes processes during the isotopic exchanges between leaf, xylem and the atmosphere [31,34,35] and subsequent biochemical isotopic exchanges and fractionations occurring during cellulose synthesis [36,37,38,39]. However, an examination on the isotopic composition of the trees’ source water is still challenging, as it represents a mixed signal of precipitation and soil water. General circulation models can estimate the cascading isotopic fractionation processes encountering between the source (e.g., ocean) and the sink (precipitation at sampling site) [40]. Yet, their spatial resolution is limited and lacks in sufficient representatively of the complex topography in high-mountain systems. During the percolation of precipitation into the soil, further site-specific fractionation processes occur alternating soil properties [41,42,43]. Additionally, different (seasonal) water sources such as meltwater can further mask the initial isotopic composition of precipitation. Still, the quantification of these phenomena is rarely considered in paleoclimatic studies. Especially the influence of permafrost on δ18OTRC is often neglected. In particular, the interpretation of climate-proxy relationships inferred from δ18OTRC time series from high-latitude boreal ecosystems being prone to permafrost influences feature many difficulties due to the complexity in disentangling regional hydrology [24,44,45,46].
Despite of the large extent of continuous permafrost occurrence in the high latitudes of the Northern Hemisphere [47,48], only few studies address the interaction of continuous permafrost and the dynamics of the active layer on boreal δ18OTRC [45,46,49,50,51,52,53,54,55]. In the mid-latitudes, the distribution of permafrost is usually limited to high-elevated mountain sites, commonly above the tree line [7,56,57]. Cold temperatures and a comparatively small amount of annual precipitation favor the regional existence of sporadic permafrost below timberline. However, such sporadic permafrost occurrences are rarely discovered since permafrost is not visible per se, making such locations very scarce.
Interestingly, the potential influence of permafrost on δ18OTRC variations and hereof-derived climate reconstructions is still a desideratum of paleoclimatic studies based in high mountain areas. From the conceptual background of the signal transfer of δ18O from the atmosphere (source) to the tree ring cellulose (sink) it is evident, that the occurrence and seasonal dynamics of permafrost and its coupled effects on soil moisture must impact the strength of the source water signal in δ18OTRC. Apparently, sub-alpine sampling sites within the mid-latitudes are highly represented in existing δ18OTRC studies [58] but to date the interaction of mid-latitudinal (mountain) permafrost with tree-ring δ18OTRC has not been investigated in detail. Therefore, the investigation on verified small-scale permafrost occurrences coupled to subalpine tree stands offers a novel and unique possibility to disentangle possible effects of mountain permafrost on δ18OTRC.
Within this study, we compared δ18OTRC variations from a tree stand of sub-alpine European larch trees (Larix decidua Mill.) in the Val Bever/Switzerland (Figure 1) where trees are verifiably growing on and outside shallow sporadic low-elevated permafrost lenses [59,60]. We thoroughly analysed the climate-proxy relationship for both settings to investigate the potential effects of permafrost on the signal strength in the respective time series. Most likely, the trees’ source water is significantly altered by seasonal effects of freezing and thawing of the active layer or even melting processes of the permafrost lenses, leading to an attenuated or distorted climate-proxy signal.

2. Materials and Methods
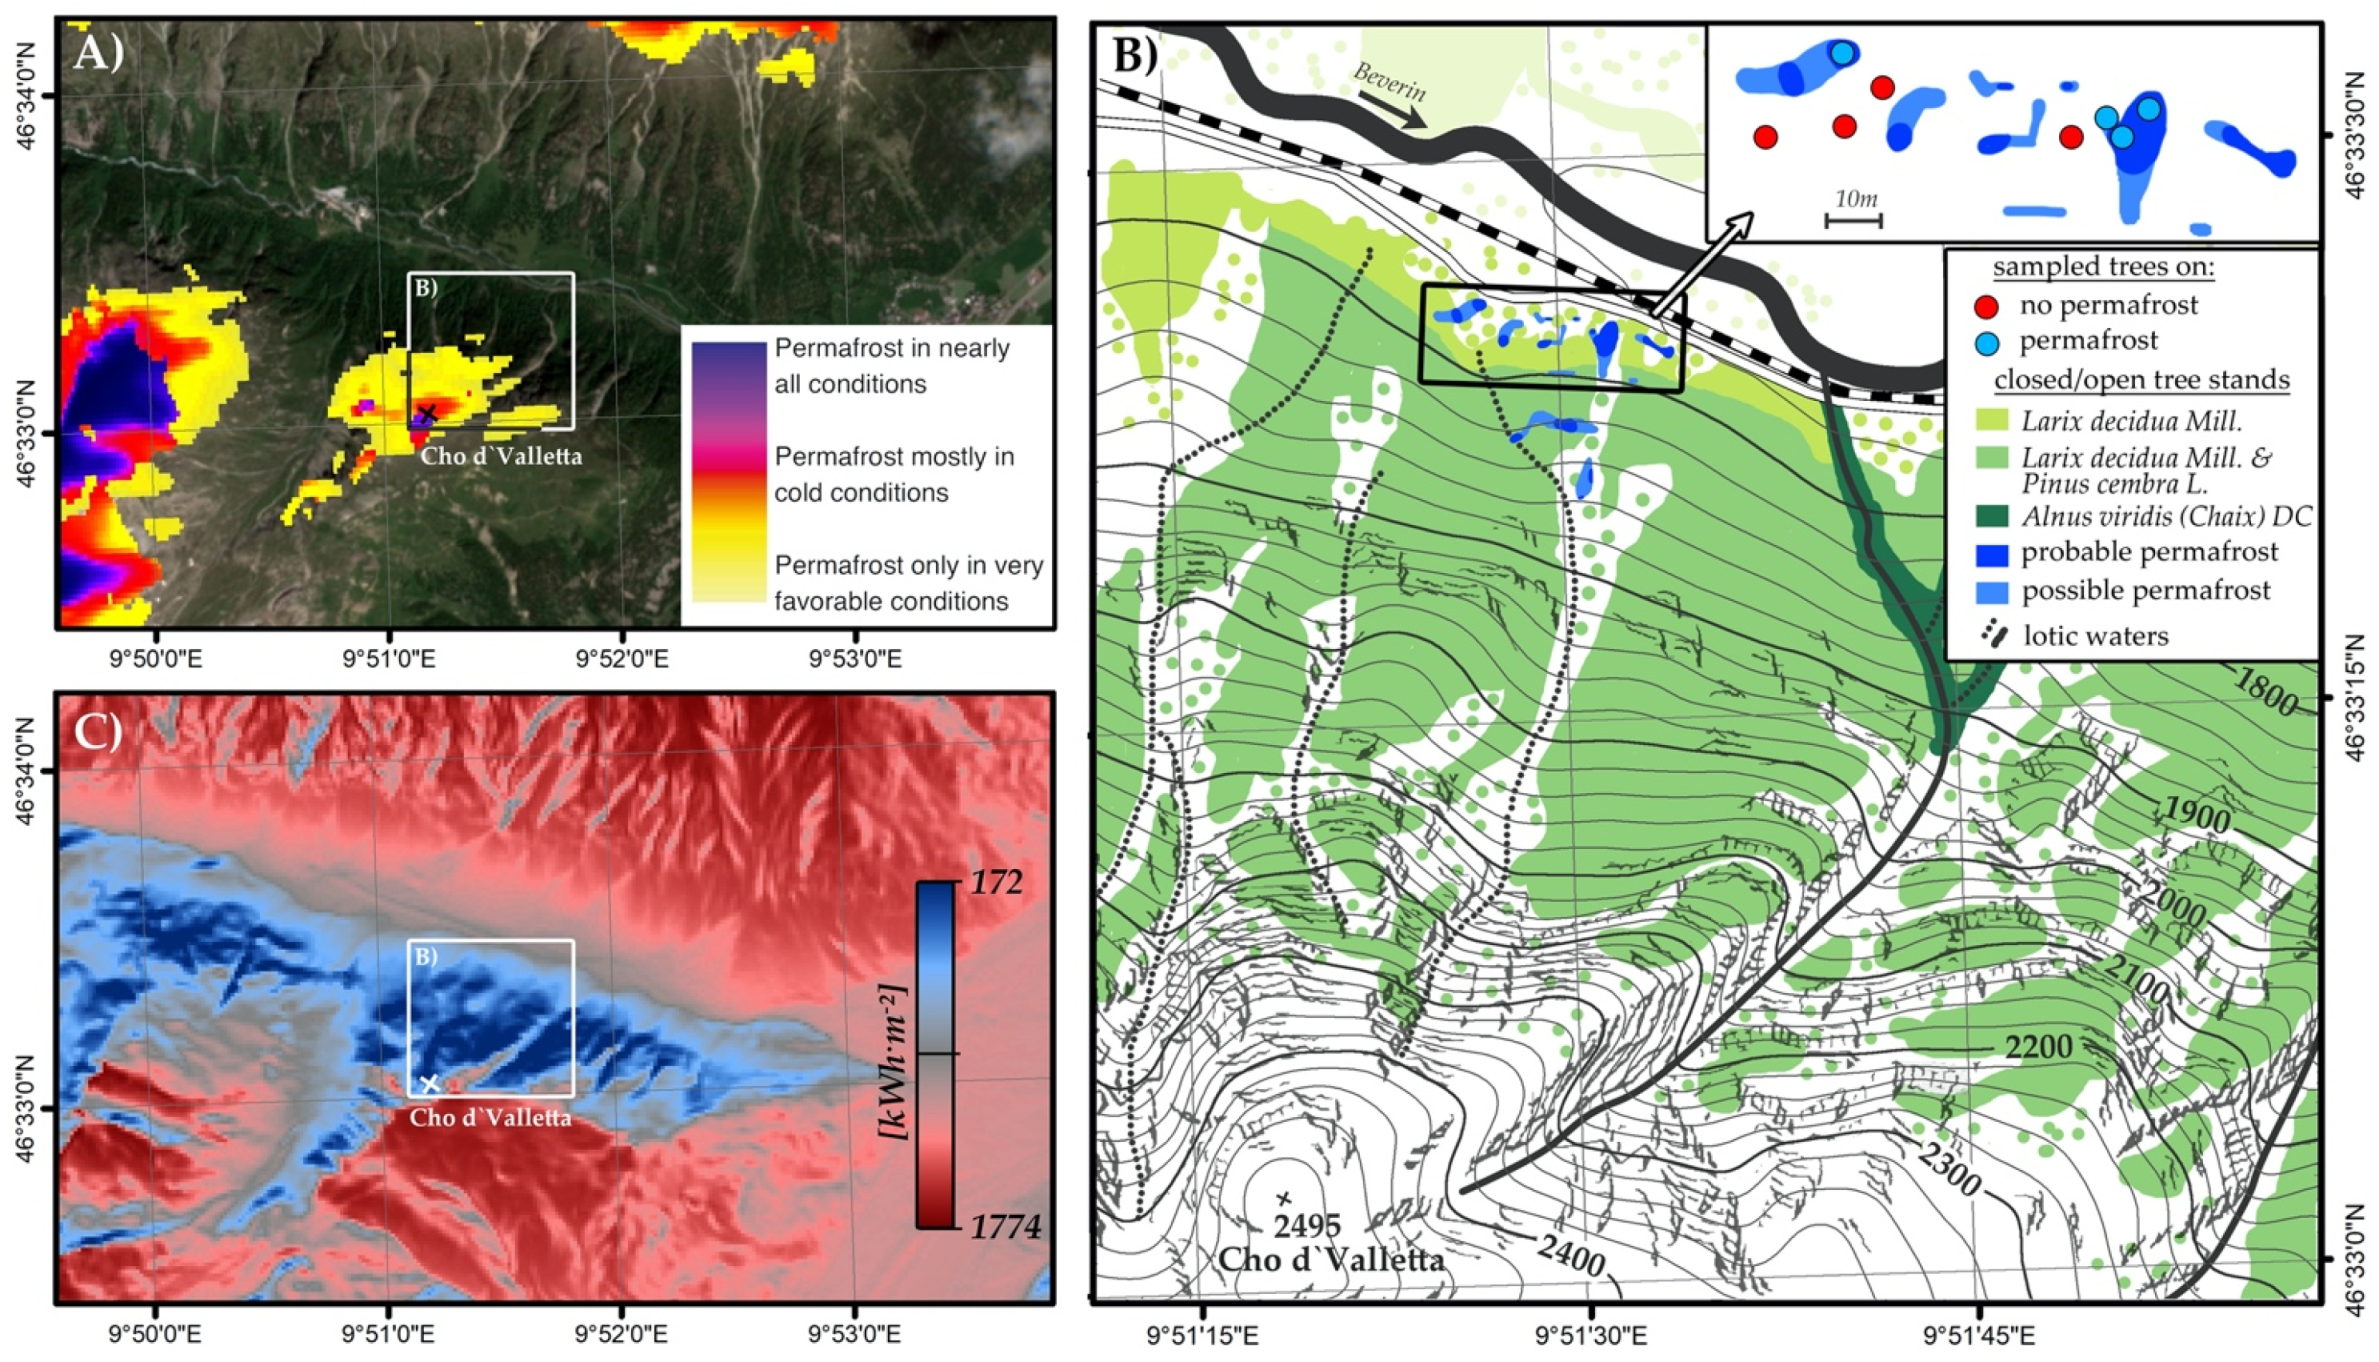
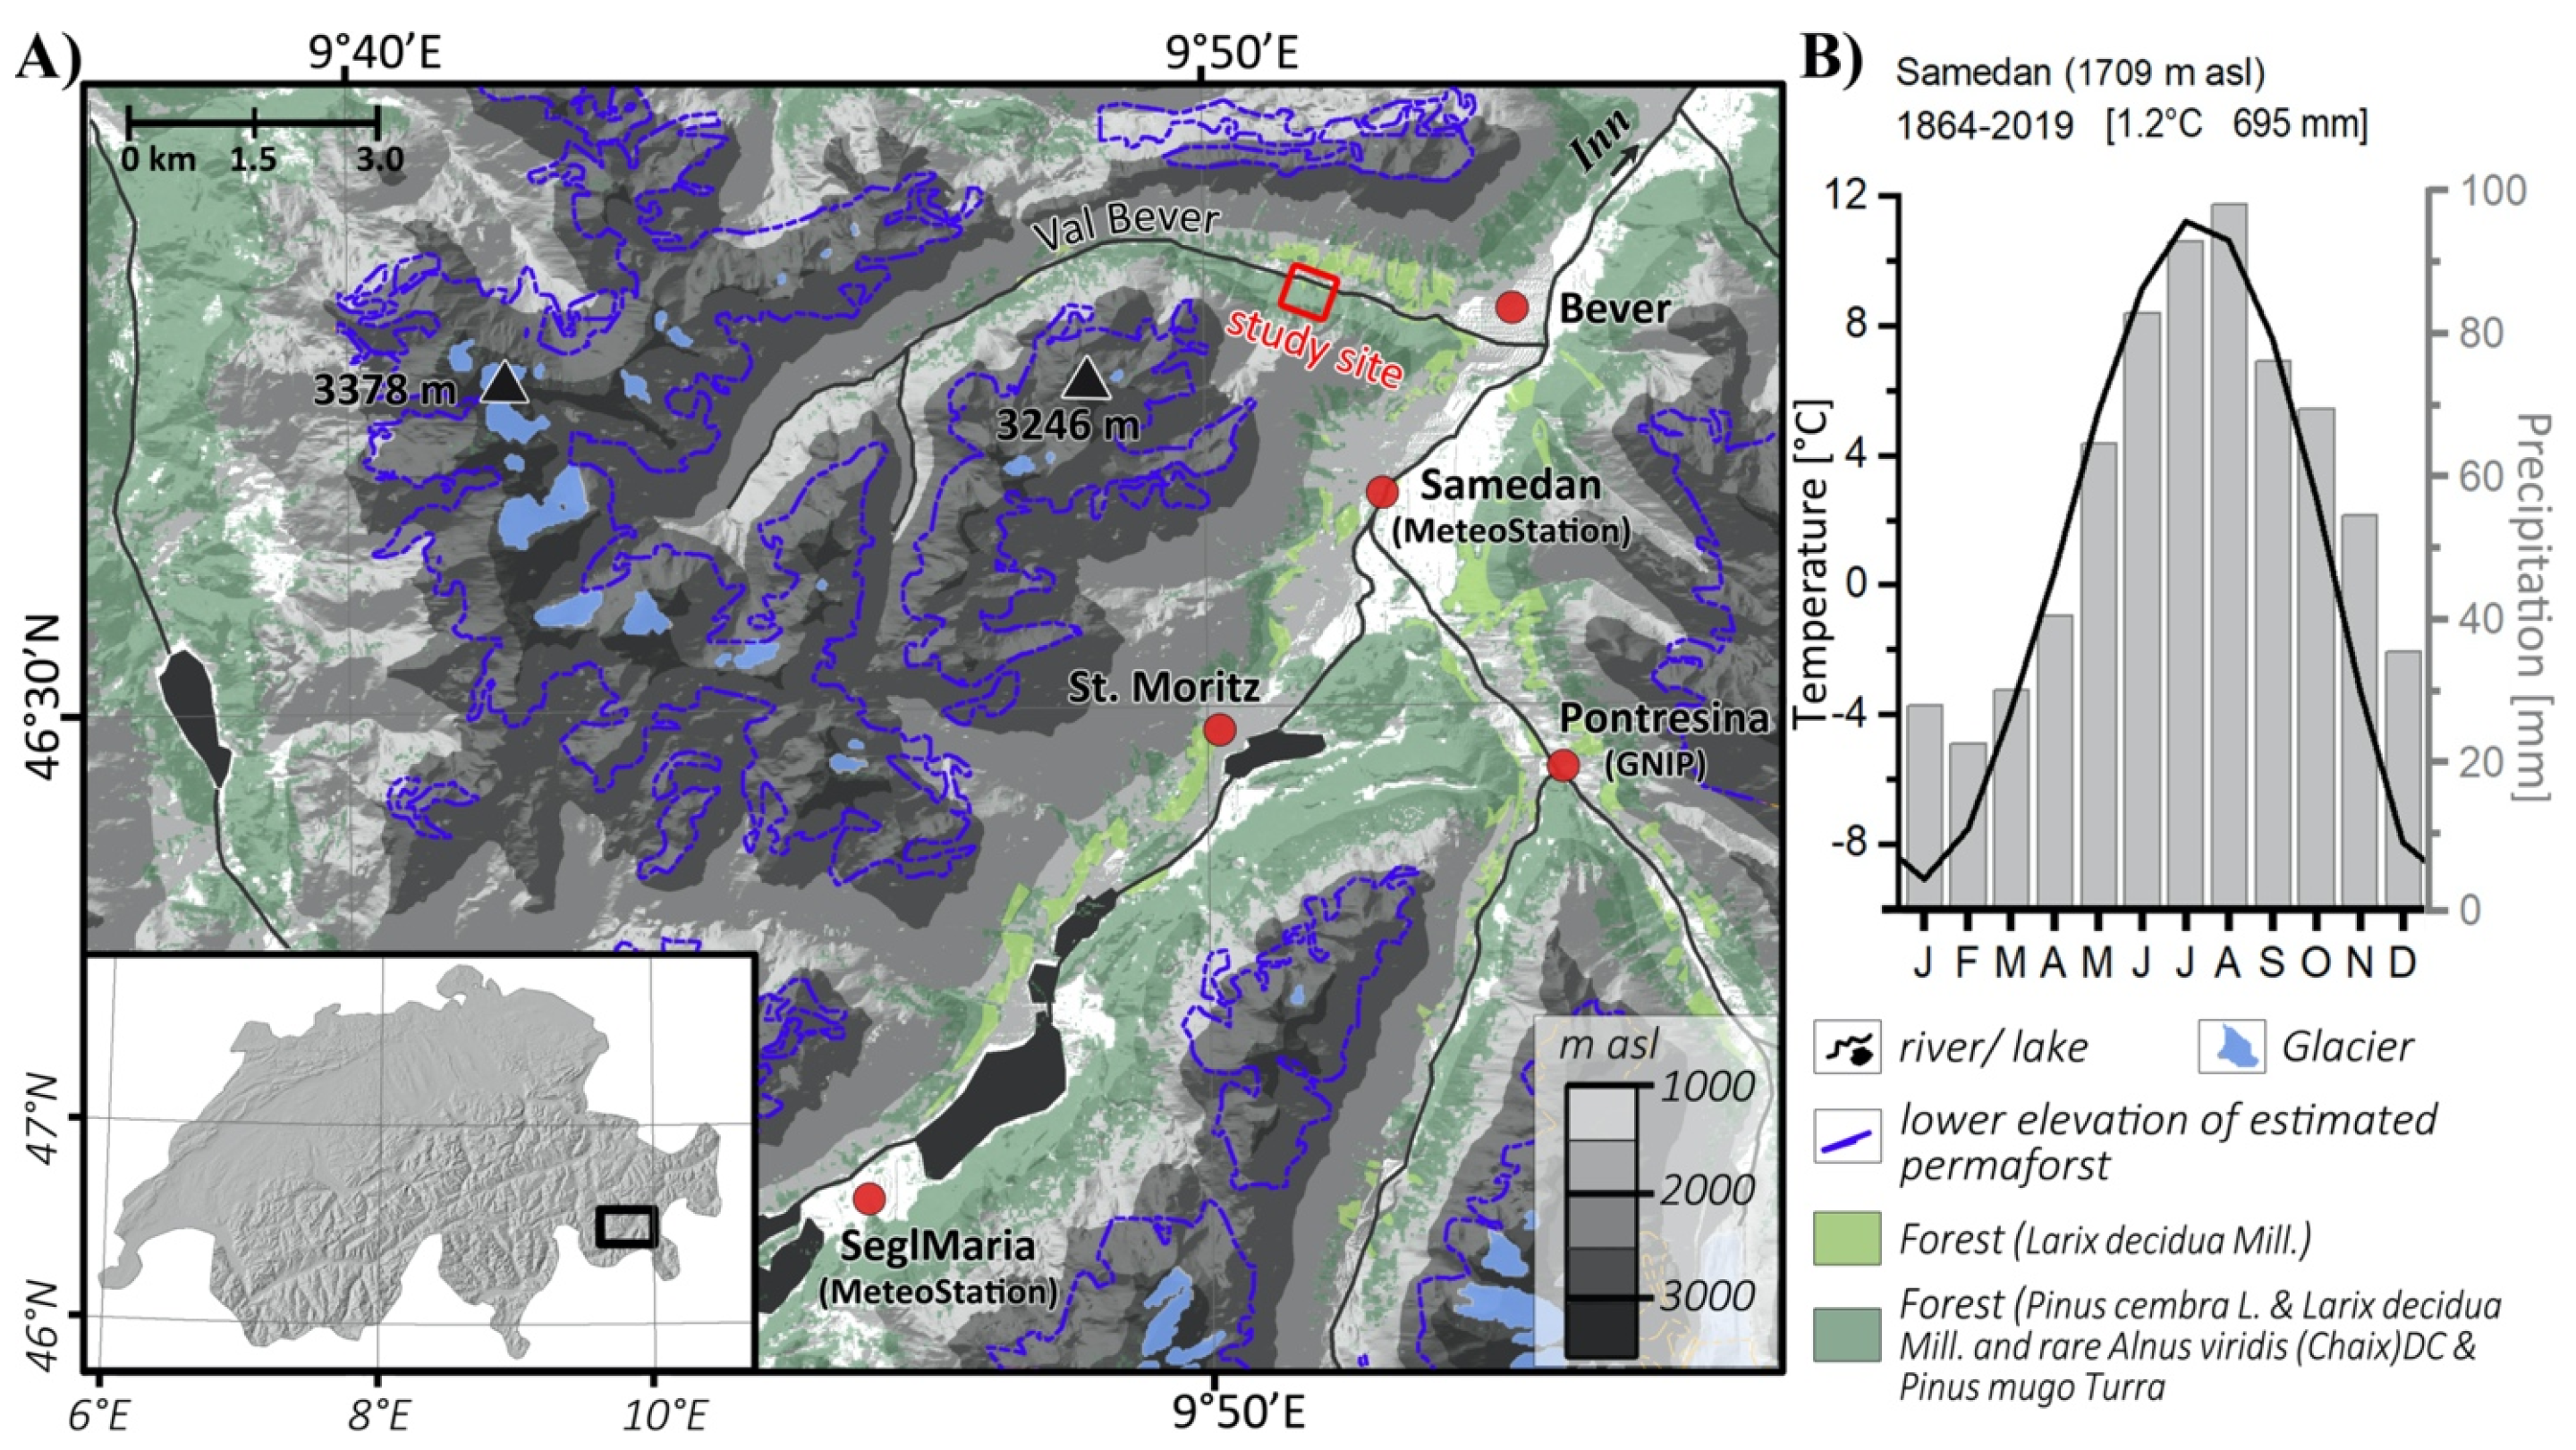
2.1. Study Site

The west-east oriented, trough-shaped valley of the river Beverin (Val Bever) is located in the Upper Engadin, Switzerland. Within the Swiss Alps, it serves as a tributary for the Inn River system (Figure 1 and Figure 2). Due to the high elevations of the Bever and Inn valleys in our study area (1700–1800 m asl), the mean annual temperature recorded by the Samedan meteorological climate station is comparably low (1.2 °C, Figure 1B). A pronounced annual temperature amplitude of approximately 20 °C characterises a typical continental climate with cold winters and warm summers. Adjacent mountain ranges exceeding 3000 m asl mainly block the influx of moist air masses and typically promote highly radiative weather conditions. Accordingly, the mean annual total precipitation accounts for less than 700 mm characterising local climate conditions as a typical inner alpine dry valley climate [65,66]. Due to the low amount of precipitation, a relatively thin closed snow cover is formed in winter. Combined with the feature that the region is prone to pronounced cold inversions during winter, this results in a low isolating effect of the surface against cold winter temperatures [67,68].
The dominant local tree species are the drought-tolerant European larch (Larix decidua Mill.) and Swiss stone pine (Pinus cembra L.) [62]. Mixed forests of larch and stone pine cover the valley slopes up to 2300 m asl, with a steady decrease of larch from the valley bottom upwards (Figure 2B). As a result of intense former pastoralism and human disturbances, southern exposed slopes are mainly forested with larch forests [62,69]. Blocky granitic deposits in the zones of highest morphodynamic activity (rock falls, debris flows or avalanche tracks; Figure 2A,B) are completely treeless or sparsely vegetated with pioneer tree species (Alnus viridis (Chaix) DC., Pinus mugo Turra).
Figure 2. (A) RGB composite image of the Val Bever (Sentinel-2, 5 July 2020) and Alpine Permafrost Index Map [70]. (B) Location of sampled trees of this study and location of permafrost in the sample plot. (C) Minimal annual solar radiation for the investigation area derived from the Solar Analyst tool for ArcView GIS [71,72].
Atmosphere 12 00836 g002
At lower altitudes (~1800 m asl) on the north-facing slope, geophysical soundings and ground surface measurements confirmed the occurrence of thin isolated, sporadic permafrost lenses at shallow depth down to ~20 m [59,60,73,74,75,76,77] (Figure 2B). Compared to permafrost sites in the periglacial zone (e.g., [78,79,80]), the active layer thickness is relatively shallow (1–3 m) and ground temperatures are just below zero degrees (−0.2 °C at 8 m depth). This subalpine permafrost occurrence is approximately 500 m below the expected lower limit of discontinuous permafrost, frequently represented by rock glaciers at 2300 m asl in the Upper Engadin [57,77,81,82]. Permafrost formation outside the expected distribution limits of mountain permafrost is attributed to mutually reinforcing effects caused by micro-climatology, specific topography as well as local surface- and subsurface conditions. The blocky and well-drained talus material enables seasonal micro-circulation systems (chimney effects) and reduces thermal conductance leading to supercooled subsurface conditions [77,81,83]. At our study site, solar radiation potentially reaching the soil surface is hampered by a mainly northern exposition (Figure 2C) and forest cover. Additionally, the poorly developed mineral soils are covered by an isolating organic layer up to 30 cm [59].

2.2. Data Generation and Statistical Evaluation of δ18OTRC Time Series

Within this study, a total of 88 L. decidua individuals were sampled at breast height using a five-diameter increment corer (two cores from each tree individual) during various field campaigns between 2006 and 2012, ahead of a complete forest clearance in 2014 [84,85]. Since the tree-ring is not yet fully developed in summer 2012, the last completely formed tree-ring analysed for its δ18OTRC is dated to 2011. All sampled cores were cross-dated statistically using the “dplR” package [86] implemented within the open-source statistical language R [87]. Afterwards the individual tree-ring width series were merged into a site chronology. The quality of our site chronology was verified against a reference chronology from the southerly exposed slope in the Val Bever which is located outside the permafrost distribution. In addition, we validated it against available regional tree-ring chronologies from the International Tree-Ring Data Bank (ITRDB). Out of the overall sample pool at our site, in total eight trees were selected for isotope analysis, whereof four cores each represent trees growing on permafrost (PF) and non-permafrost (nPF) locations, respectively (Figure 2B). The cores for isotope analysis were selected based on the following criteria: (i) only old/mature trees were chosen for the isotope analyses and only the last 180 years were regarded to minimise possible tree-ring δ18O juvenile effects [88,89]. The mean tree age of the eight chosen samples is 223 years (1788–2011), (ii) chosen individuals reveal high inter-series correlation coefficients and Gleichläufigkeit (GLK; sign test), (iii) only trees without missing rings were considered and (iv) trees showing growth depressions or narrow tree-rings were disregarded to obtain sufficient material for α-cellulose extraction and subsequent isotopic analysis. For the establishment of the final δ18OTRC series, trees were analysed individually (no data pooling) to minimise potential loss of information on inter-tree variability [90]. Consequently, the individual years were cut off with a razor blade in compliance with the tree-ring width chronology. Subsequently, α-cellulose was extracted following standard laboratory methods [20,91]. During isotope measurements, internal and international laboratory standards were periodically interposed, resulting in an overall analytical precision for the δ18OTRC measurements of <0.2‰. The notation for the δ18OTRC is specified based on the international standard Vienna Standard Mean Ocean Water (VSMOW). In addition to the individual examination of the permafrost-affected time series (PF-δ18OTRC) and non-permafrost affected tree stands (nPF-δ18OTRC), a merged site isotope chronology (MEAN-δ18OTRC) was developed, which includes all trees irrespective of the subsoil conditions. The statistical reliability of the three resulting δ18OTRC series (PF-δ18OTRC, nPF-δ18OTRC, MEAN-δ18OTRC) were tested using standard dendrochronological methods implemented within the “dplR” package [92] for the open-source statistical language R [87]. The mean inter-tree correlation coefficient (RBar [93] and inter-series correlation coefficient (IC) express the averaged correlation value out of each tree pair and the correlation of each tree with the resulting chronology, respectively. As statistical test to express parallel variation of the individual trees’ time series, the Gleichläufigkeit (GLK) was calculated. Since L. decidua is a deciduous tree species prone to possible carry-over effects of the previous growing season [94,95], we additionally tested the respective chronologies for significant first order autocorrelations (AC1). Subsequently, the final chronology uncertainties were estimated by applying a bootstrapped 95% confidence interval [96,97], based on 1000 replications. As Larix decidua Mill. is prone to cyclic defoliation caused by insect outbreaks (larch budmoth) we cross-validated our δ18OTRC time series against a dataset of known insect outbreaks in the Engadin [98]. However, no influence could be detected which is in accordance to findings by Kress et al. [99] who successfully demonstrated that insect-defoliation is not affecting δ18OTRC variations in European larch.

2.3. Evaluation of Climate-Proxy Relationships

For evaluating climate-proxy relationships, monthly climate data from the two neighboring meteorological stations in Samedan and Segl-Maria were used (Federal Office of Meteorology and Climatology MeteoSwiss, Figure 1). The long-term climate station data was quality checked and homogenised by a proven method developed by MeteoSwiss [100,101]. To explore the climate-proxy relationships between the δ18OTRC chronologies and standard climate parameters (precipitation, temperature), Pearson’s correlation coefficients were calculated for the common period from 1864 to 2011. In addition, data on cloud cover fraction available for Segl-Maria (since 1864) and for Samedan (since 1980) meteorological stations were used. To investigate the temporal stability of the obtained climate-proxy relationships, we performed moving window correlation analyses applying a 30-year moving window with an offset of one year. To study possible impacts of drought on our isotope series, the Standardized Precipitation-Evaporation Index (SPEI; [102]) was calculated with the R-package “SPEI” [103] using data from the Samedan climate station.
Possible influences of large-scale circulation patterns on our isotope time series were tested by calculating spatial correlations with gridded climate datasets derived from the Climate Research Unit (CRU v 4.04, [104]). Since the CRU data is lacking more complex parameters such as geopotential height fields or incoming solar radiation, we additionally used respective datasets from the Twentieth Century Reanalysis project (20CRv3 [105]). To ensure statistical comparability between the CRU and 20CRv3 data, we truncated both datasets to a common investigation period ranging from 1901 to 2011.
For the investigation and validation of a possible signal transfer of source water/atmospheric precipitation δ18O into the trees’ tissue, monthly precipitation data from the nearest GNIP (Global Network of Isotopes in Precipitation) station in Pontresina (Figure 1) were used (https://www.iaea.org/services/networks/gnip, accessed on 28 June 2021). Since the common observational period between the Pontresina GNIP station and our δ18OTRC time series is with only 17 years relatively short, the nearest available long-term recording GNIP station in Locarno (46.17 N, 8.79 E, recording since 1973) was additionally considered.

3. Results

3.1. Time Series Characteristics of the Val Bever δ18OTRC Site Chronology

The resulting eight individual L. decidua δ18OTRC time series at the sample site demonstrate a high level of coherence as indicated by the parameters sign test (Gleichläufigkeit: GLK = 70%) and inter-series correlation coefficient (IC = 0.54; Table 1). This is further underlined by the calculated bootstrapped range of uncertainty for the resulting site δ18OTRC chronology for the Val Bever (hereafter referred to as MEAN-δ18OTRC; Figure 3A). Year-to-year variations are highly pronounced for both the individual isotope series (standard deviation SD = 1.39‰) and for the MEAN-δ18OTRC chronology (SD = 0.9). The MEAN-δ18OTRC time series indicates a significant long-term trend with 0.18‰ per half century towards more positive δ18O values (r = 0.27, p < 0.01; Figure 3A). In order to emphasise short-term variations of the chronology, we calculated the inter-tree correlation coefficient (RBar) and the expressed population signal (EPS) within a representative window length of 20 years (Figure 3A).
Before 1860, a low sample replication expectably causes low RBar and EPS values. Since 1890, the EPS exceeds—with the exception of a relatively short period between 1880 and 1890—the accepted threshold of 0.85 [106]. Hence, our site chronology confirms a reliable quality for the common period to perform sound climate-proxy analyses with nearby local meteorological stations (Figure 3B).

3.2. Evaluation of Climate-Proxy Relationships with the δ18OTRC Site Chronology

The evaluation on the influence of temperature and precipitation on the MEAN- δ18OTRC site chronology during the common period 1864–2011 shows for both climate stations quite similar results (Figure 3B). For the current growing season, mainly summer temperatures reveal significant positive influences, with the highest correlations in August at Segl-Maria (rAug = 0.22, p < 0.01). Correlations between the MEAN-δ18OTRC and precipitation are almost opposite, featuring the most significant negative correlation during summer (July) for Samedan station (rJul = −0.25, p < 0.01). Closely associated are results between MEAN-δ18OTRC and cloud cover data from the Segl-Maria climate station. Highly significant negative correlations occur for the peak summer season from June to August (rJJA = −0.38, p < 0.01). Even though the first order autocorrelation of the MEAN-δ18OTRC series is rather low (AC1 = 0.26), significant correlations are recognisable with climate conditions during the previous year. For temperature, significant correlations at both stations are apparent during previous years’ October and December (e.g., Samedan: rpOct = 0.22, p < 0.01; Segl-Maria: rpDec = 0.22, p < 0.01). For precipitation, the analyses with previous years’ data reveal a significant impact of previous September rainfall (rpSep = −0.17, p < 0.05).

3.3. General Characteristics of the Individual δ18OTRC Chronologies

Figure 4 illustrates the δ18OTRC time series differentiated into L. decidua trees growing on permafrost (hereafter: PF-δ18OTRC, Figure 4B in blue) and outside permafrost lenses (hereafter: nPF-δ18OTRC, Figure 4B in red). To ensure a better comparability of possible differences between the two series, ordinate axes are shifted against each other with an offset of 2.5‰. For both settings, the respective tree individuals show high internal synchronicity as indicated by the parameters bootstrapped chronology uncertainties, sign test (GLK) and inter-series correlation (IC) (Figure 4B; Table 1). However, GLK, RBar and IC consistently reveal a stronger common signal for those trees growing outside the permafrost lenses (nPF-δ18OTRC). This finding is further corroborated by a weaker signal-to-noise ratio (SNR, Table 1) of the PF-δ18OTRC time series, indicating an attenuated common signal between the trees. Year-to-year variations of both series are highly pronounced with an average variation of 1‰. In selected years, even maximum values of more than 5‰ can occur. Consequently, the nPF-δ18OTRC time series exhibits a relatively high standard deviation (SD~1‰, Table 1).
Overall, the two δ18OTRC -series are significantly correlated (r = 0.76, p < 0.01). However, their absolute annual deviations display pronounced discrepancies of up to several per mille for distinct years (e.g., 1849 or 1999) (Figure 4C). Both chronologies indicate comparably low first order autocorrelations (AC1 = 0.22 and 0.24). The non-permafrost tree individuals reveal a significant positive long-term trend of 0.22‰ (r = 0.23, p < 0.01) per half a century. In contrast, such a trend cannot be detected for trees growing on permafrost. The respective PF-δ18OTRC time series only exhibits a slightly positive trend of 0.13‰ per half a century (p > 0.05).

3.4. Climatic Imprints Within δ18OTRC Time Series in Permafrost and Non-Permafrost Terrains

Imprints of precipitation, temperature and cloud cover derived from the Segl-Maria meteorological station on our δ18OTRC time series are illustrated in Figure 5. An equivalent figure displaying the results with the meteorological station of Samedan is provided as Supplementary Figure S1. It is recognisable that trees located on ice lenses (PF-δ18OTRC) tend to show weaker correlation patterns than the permafrost-free tree stands (nPF-δ18OTRC) or than the MEAN-δ18OTRC time series. In particular, temperature and precipitation conditions during the summer months, which demonstrably revealed having a strong influence on the MEAN δ18OTRC series (Figure 3B), are in comparison verifiably dampened (Figure 5A,B). Results of 30-year moving correlations with the PF-δ18OTRC further corroborate this with notably weak correlations for temperature and precipitation (p > 0.05, Figure 5).
Contrasting results are obtained applying moving correlation analysis with the permafrost-free time series (nPF-δ18OTRC). In general, highly significant correlation patterns are apparent (Figure 5A,B). Results on the climate sensitivity of the MEAN-δ18OTRC illustrate its intermediate position between permafrost-free and permafrost-affected tree stands. Except for the overall robust and homogeneous correlation patterns observed with cloud cover, for which the MEAN-δ18OTRC is slightly enhanced, the climate imprint of temperature and precipitation on the MEAN-δ18OTRC is consistently less prominent as for the permafrost-free terrain (nPF-δ18OTRC). In particular, the summer precipitation signals (July and JJAS) are significantly attenuated within the MEAN-δ18OTRC. Most reasonably, the less significant correlation values of the permafrost-affected trees highly bias the stronger climate signal reflected by the permafrost-free tree stand. This implies that a loss in climate signal strength can arise from simply averaging both tree stands without prior knowledge of differing subsurface conditions.
Furthermore, the 30-year moving correlation patterns with climate station data (1864–2011) indicate an instable climate-proxy relationship for all three δ18OTRC time series. For summer temperatures (Figure 5B), significant correlations (p < 0.05) are absent within the first decades of the time series until approximately 1880 (note that the abscissas axis in Figure 5 and Figure S1 represents the mid-year of the 30 years moving window). Roughly centered at 1930 and 1945 correlation values with temperatures also did not reach the level of significance. However, the most striking feature is the almost total loss of the climate-proxy relationships since 1975. Simultaneously, precipitation no longer reveals any significant influence on variations in δ18OTRC during the recent four decades. An identical pattern for all three series of this study can also be found for the analyses with the Samedan climate station (Figure S1).
Additional calculations with Standardized Precipitation-Evaporation Index data (SPEI) show neither an increase in the level of significance nor in the correlation coefficients (Figure S2) compared to standard climate station data (Figure 5 and Figure S1). For SPEI-indices, highest correlations were obtained for the permafrost-free individuals during the summer season from July to August (nPF-SPEIJA; r = −0.3, p < 0.01) showing a comparably low sensitivity to droughts which is rather expectable for the northern exposition of our study site. Nevertheless, the results with SPEI further corroborate the stated results that permafrost-unaffected trees consistently provide better imprints of climate signals compared to permafrost-affected individuals.
Large-scale climate representatively analyses of the permafrost and non-permafrost δ18OTRC series with gridded CRU 4.04 climate parameters (precipitation, temperature, cloud cover) are illustrated in Figure 6. An identical figure for the MEAN-δ18OTRC series is given in Supplementary Figure S3. The obtained results in Figure 6 further confirm the previously detected finding of an attenuated climate signal in permafrost-affected trees (PF-δ18OTRC). Spatial analyses with the PF-δ18OTRC series demonstrably reveal significantly weaker spatial correlation patterns for the entire observation period (1901–2011) as well as for three evenly distributed subperiods. The observed signal decrease within the climate-proxy relationships during recent decades (Figure 5 and Figure S1) is also continuously evident for spatial correlations with CRU 4.04 data (period 1973–2011; Figure 6 and Figure S3). Furthermore, the PF-δ18OTRC time series reveals a generally weaker signal compared to the nPF-δ18OTRC series. The spatial correlation patterns for the MEAN-δ18OTRC chronology again represents an intermediate position between the well and weakly correlated time series of nPF-δ18OTRC and PF-δ18OTRC, respectively (Figure S3).

4. Discussion

The evaluation of climate-proxy relationships between our three individual isotope time series from Val Bever resembles related correlation patterns being observed in studies on tree-ring δ18OTRC from other Alpine regions and in different tree species [26,107,108]. In these studies, the strongest climate-proxy correlations were found for the summer season (July to August). The authors postulate that high summer temperatures result in corresponding plant physiological responses to reduce evaporative water loss leading to an increase in δ18OTRC. In good accordance with our findings, their sampling locations demonstrate a general higher sensitivity towards variations in temperature than precipitation (Figure 5 and Figure 6, Supplementary Materials Figures S1 and S2; [107]). Results for monthly and seasonal correlation values are also in a comparable range to the observations of these studies. However, annual climate averages/sums (January to December/J-D, Figure 3) do not reveal a significant influence on all δ18OTRC series from the Val Bever.
Alpine oxygen chronologies represent well long-term climate variations [107]. Therefore, we assessed the inter-year variability (high-frequency variations) and decadal temperature variability (low-frequency variations) by calculating moving averages of 10 years. Mean annual (Jan–Dec; J-D) and summer temperatures (Jul–Aug; JA), recorded at the Segl-Maria and Samedan meteorological stations, were merged into a regional composite and correlated in a 10-years moving average with the three individual Val Bever isotope series (Table 2). The most striking results are the missing correlation patterns observed for the permafrost-affected tree stand (PF-δ18OTRC). Significant imprints of low-frequency temperature variations are missing when accounting for mean annual temperatures (rJ-D = 0.16, p > 0.05) or summer temperatures (rJA = 0.30; p > 0.05). Consistent with previous findings (Section 3.4), the permafrost-free tree stand (nPF-δ18OTRC) reveals, in contrast, the most robust sensitivity towards decadal temperature variations (rJ-D = 0.63/rJA = 0.62; p < 0.01). Again, the MEAN-δ18OTRC resembles a climate sensitivity intermediate between the permafrost-free and permafrost-affected δ18OTRC (Table 2).
Recent studies demonstrated that low-frequency temperature variations stored within δ18OTRC series are a valuable indicator of large-scale circulation variabilities [20,21]. Therefore, the significant spatial correlations which extend far beyond the Alpine region (Figure 6 and Supplementary Materials Figure S2) can be regarded as highly reasonable. This is in line with the study by Saurer et al. [107], who observed imprints of decadal large-scale temperature variations on δ18OTRC across the Alps for various tree species. Within a subsequent analysis [108], extreme positive (negative) anomalies in the δ18OTRC time series from the Alps (>1‰) were successfully linked to positive (negative) anomalies of geopotential height fields (500 mbar) and anticyclonic synoptic weather types during summer (July–August). For δ18OTRC, variations in different tree species from several sites across Switzerland Saurer et al. [108] determined highly significant, common supra-regional signals identified as strong influences of large-scale climate dynamics. Our series also reveal significant correlations with their results suggesting a common forcing. For example, our MEAN-δ18OTRC is significantly correlated with their Central Alpine and North Alpine δ18OTRC chronologies (r = 0.65, p < 0.01 and r = 0.57, p < 0.01, respectively). Therefore, we likewise tested the impact of large-scale atmospheric influences on our oxygen isotope series. Correspondingly, our Val Bever permafrost-free time series (nPF-δ18OTRC) exhibit strong and significant (p < 0.01) positive spatial correlations with geopotential height fields (GpH) over broad areas across the temperate and Mediterranean parts of Europe. An additional correlation pattern of opposing sign is located in northeastern Europe (Figure 7A). This dipole-like pattern between the mid- and northern latitudes strongly influences the isotopic composition of precipitation in Central Europe [108]. In contrast, the PF-δ18OTRC series reveals no regional representatively direct at the Val Bever sampling location (Figure 7A). The MEAN-δ18OTRC correlation pattern with the 850 GpH in turn represents an intermediate between the permafrost-free and permafrost-affected tree-stand (not shown). Anticyclonic pressure patterns during July to August lead to increased cloud dispersal accompanied by increased downward solar radiation reaching the surface (rJA > 0.5, p < 0.01) for large parts of Central Europe, including the Alpine region (not shown). As expected from the negative relationships between all three Val Bever δ18OTRC chronologies and cloud cover or precipitation (Figure 5 and Figure 6), the correlation patterns concerning downward solar radiation are reverse (Figure 7B). Averaging the four nearby grid cells of the 20CRv3 downward solar radiation reveal a mean correlation coefficient of rJA = 0.43 (p < 0.01) and rJA = 0.27 (p < 0.01) with the permafrost-free (nPF-δ18OTRC) and permafrost-affected (PF-δ18OTRC) tree stand, respectively.
An increase in downward solar radiation intensifies the warming of the near-surface air temperature (rJA = 0.72, p < 0.01 for the four adjacent 20 CRv3 grid cells to the sampling location) and leads to higher leaf temperatures. Both effects will result in an increase in leaf water enrichment and therefore higher δ18OTRC values [26,29,108]. Additionally, δ18O in precipitation is positively correlated with temperatures [109,110]. Due to the small distance between permafrost-free and -affected tree stands, featuring identical exposition and inclination, no differences within the individual climate elements or isotopic composition of perceptible water can be expected. The consistent attenuation or even lack of climate signals observed for the permafrost-affected tree stand (PF-δ18OTRC) assumes that for these individuals mainly source water variations constraint the climatic signals in δ18OTRC.
A comparison between the individual Val Bever δ18OTRC series and δ18O in precipitation derived from Pontresina GNIP station (1994–2011; Figure S4) further underline this assumption. Trees growing on permafrost-free terrain are highly dependent on the mean isotopic composition of precipitation during June to August (rJJA = 0.76, p < 0.01) and July to August (rJA = 0.58, p < 0.05). In contrast, trees growing on permafrost lenses reveal a weak coherence with varying isotopic composition in precipitation at Pontresina (rJJA = 0.42, rJA= 0.36, p > 0.05).
A similar, albeit slightly weakened correlation pattern, is evident for the comparison with the more distant but longer recording series of the Locarno GNIP station (1973–2011, Figure S4). Here, the nPF-δ18OTRC series reveals a stronger dependency of δ18O on precipitation (rJJA = 0.48, p < 0.01) while the influence on PF-δ18OTRC series is less significant (rJJA = 0.40, p < 0.05). As the trees’ source water represents a composite isotopic signal of precipitation and soil water, the latter exerts a significant mitigating impact on the climate-proxy relationships. This can be attributed to the more complex soil hydrology of permafrost-affected sites, e.g., differing seasonal water pools accompanied by temperature-dependent lag times and active layer dynamics. Such impacts have already been observed in the zone of continuous permafrost of the high latitudes, whereby the soil water isotope composition during dry and warm summers was significantly below the predicted level due to the thawing of more depleted soil ice within the permafrost bodies [45,46,49,111]. In contradiction to an overall warming climate and the expected increase in δ18OTRC, such impact of a thawing active layer or melting processes of the permafrost lenses can introduce even decreasing trends within δ18OTRC time series [45,111] and highly overprint climate signals. This can explain the lack of a significant long-term trend towards more positive δ18O values in the PF-δ18OTRC time series compared to the increasing trend of the nPF-δ18OTRC (Figure 4).
Such an increasing trend in δ18OTRC might be attributed to an enhanced temperature-driven leaf water enrichment and to less depleted δ18O in precipitation. The latter is evident at the Locarno and Pontresina GNIP stations, featuring positive δ18O summer trends (June-August) according to 0.28‰ (p < 0.05) and 0.35‰ (p > 0.05) per decade during the recording periods (1973–2019 and 1994–2019, respectively). In addition to changing circulation systems and, therefore, alternating sites of evaporation and/or moisture sources, the temperature dependency of δ18O in precipitation is decisive [112,113,114]. The two climate stations Segl-Maria and Samedan and their regional mean reveal marked warming trends in both the annual and the seasonal averages (Figure 8). Relative to the climate normal period (1961–1990), spring and summer temperatures increased by more than 2 °C since the mid-1970s. In conjunction with the strong warming trend during the recent decades, an enhanced signal loss in the climate-proxy relationships is observed for precipitation and temperature at Val Bever (Figure 5; Figure S1 and spatial correlations Figure 6 and Figure S3). This temporal instability in the climate-proxy relationship (loss of significance or changing sign in the correlation coefficient) also has been frequently observed for tree-ring series [115,116,117] as well as for tree-ring isotope series [12,108,118]) and is commonly referred to as proxy divergence. For different sites and species across the Alps, a temporal instability in δ18OTRC series can be observed (e.g., [107]) and attributed to changing circulation patterns [12,119]. In addition, varying water accessibility to deeper and more depleted soil water pools during warmer and dryer years is postulated [118]. However, determining the influence of the latter on our isotope series is impossible since the trees are growing on a blocky debris cone that prevents any deep soil profiling.
In summary, this study shows that caution is advised when investigating tree-ring δ18OTRC from sub-alpine sites in high mountain areas where the influence of permafrost cannot be completely excluded. This refers especially to less radiation-exposed slopes and exposures, where permafrost is expected to occur. Demonstrably, this also includes areas and settings that are located below known permafrost distribution patterns. As shown, the influence of permafrost lenses can be particularly significant for microscale subsoil conditions that it highly biases the climate signal incorporated in δ18OTRC at a sample site. Therefore, it is advisable for such areas to consistently analyse trees individually to enable a careful evaluation of related δ18OTRC time-series. Such detected offsets in δ18OTRC can consequently contribute to the recent discussion on divergence in δ18OTRC time series across the globe, since permafrost dynamics can even influence small-scale variations of hydrological conditions.

5. Conclusions

This study represents the first quantitative evaluation in isotope-based dendroclimatology, focusing on the impact of permafrost on δ18OTRC series at sub-alpine sites. Especially in high-mountain areas, the occurrence of permafrost and its related influence on soil water status is still a widely neglected factor that can highly influence the δ18OTRC in trees. We therefore analysed a total of eight Larix decidua Mill. trees from a subalpine tree stand in the Val Bever/Switzerland. The investigated tree stand is located several hundred meters below the tree line and therefore below the proposed lower limit of recent alpine permafrost occurrence in a northern exposition on a scree cone. Small-scale alpine permafrost lenses have been proven to be present at our sample site based on geophysical soundings. Our sampling approach is based on an evenly distributed sampling of permafrost-free and permafrost-affected tree individuals. For the final δ18OTRC analyses, all sampled trees were analysed individually on an annual basis for a period of the last 181 years.
The displayed results indicate a substantial influence of permafrost on δ18OTRC variations at our site. A thorough investigation of climate-proxy relationship between permafrost-affected (PF-δ18OTRC) and permafrost free (nPF-δ18OTRC) tree stands reveal striking differences in their individual responses. The nPF-δ18OTRC reveal high positive correlations with summer temperatures, geopotential height fields and associated downward solar radiation. High precipitation and cloud cover during the summer season are vice versa detrimental for increased δ18OTRC values. For the permafrost-affected trees (PF-δ18OTRC), climate fingerprints of all investigated climate parameters are also present but highly biased. However, in an extremely attenuated pattern, the displayed climate-proxy relationship often does not pass the 95% level of significance. This frequently equates to the (statistical) loss of the common signal between our proxy and the climate parameter targeted for climate reconstruction. Since both investigated tree stands are generally subject to the same climate influences, this observed divergence in the climatic sensitivity can be attributed to varying trees’ source water that constraints a coherent response.
As the occurrence of permafrost was apparently neither expectable nor directly visible, this suggests that the sampled trees in this study are by first sight mainly exposed to the same external climate forcing. However, this may initially lead to the use of common pre-analytical approaches such as averaging of individual δ18OTRC series or sample pooling prior cellulose extraction. Especially sample pooling is inevitably applied as an established scientific approach in many δ18OTRC studies. In particular, this is often necessary due to various constraints, e.g., during the establishment of multi-centennial/millennial δ18OTRC time series from subalpine tree species featuring very narrow tree-rings, which frequently results in insufficient wood material for a subsequent a-cellulose extraction process [14,120,121]. However, this study highlights the importance of pre-screening possible permafrost occurrences at sub-alpine sample sites prior to data averaging or sample pooling. In neglecting such background information in high-mountain ecosystems, a significant loss of climate signal can be imminent if the obtained mean time series includes permafrost- and non-permafrost affected δ18OTRC series prone to individually differing trends or offsets. As a result, the verifiably high suitability of δ18OTRC as a parameter recording past (hydro-)climate variability may be unnecessarily hampered.
In summary, our studies show that indirect climatically induced changes in hydrology can also peek through into the δ18OTRC values when analysing trees from high altitude sites. Therefore, it is advisable for such settings to monitor the individual δ18OTRC series for temporary as well as general offsets and to relate these to possible permafrost dynamics. This is particularly important due to the recently observed global permafrost thawing processes across the globe, which demonstrably highly alters regional hydrology and soil water dynamics. However, as our study shows, the climate signal incorporated in the δ18OTRC can be significantly overprinted.

Supplementary Materials

The following are available online at https://www.mdpi.com/article/10.3390/atmos12070836/s1. Figure S1: Climate sensitivities derived for the MEAN-δ18OTRC chronology and from tree stands growing on permafrost (PF) and non-permafrost (nPF) sites for monthly precipitation (A) and temperature (B). For the monthly correlation analysis, one or two asterisks mark the level of significance of p < 0.05 and p < 0.01, respectively. For the moving correlations, significant periods (p < 0.05) are marked by a black frame. The abscissas axis represents the mid-year of the 30 years moving window. Samedan meteorological station data (1864–2020) are provided by the Federal Office of Meteorology and Climatology/MeteoSwiss. Figure S2: Climate sensitivities derived for the MEAN-δ18OTRC chronology and from tree stands growing on permafrost (PF) and non-permafrost (nPF) sites for Standardised Precipitation-Evaporation Index (SPEI) calculated for (A) two successive months and (B) for three successive months. For the seasonal correlation analysis, one or two asterisks mark the level of significance of p < 0.05 and p < 0.01, respectively. For the moving correlations, significant periods (p < 0.05) are marked by a black frame. The abscissas axis represents the mid-year of the 30 years moving window. Figure S3: Spatial correlations between CRU TS v 4.04 and the MEAN-δ18OTRC for (A) precipitation (July), (B) maximum temperature (July–August) and (C) cloud cover (July) for the whole observation period (1901–2011) and intervals of 37 years. Dashed black polygons and black points indicate 95% and 99% level of significance, respectively. The yellow dot marks the Val Bever study site. Figure S4: Correlation patterns between the three isotope time series and the adjacent Global Network of Isotopes in Precipitation (GNIP) stations Locarno (1973–2011) and Pontresina (1994–2011). Solid and dashed horizontal lines represent the 99% and 95% level of significance, respectively.

Author Contributions

Conceptualisation, J.G., W.J.-H.M., H.G. and A.B.; methodology, J.G. and W.J.-H.M.; formal analysis, J.G., W.J.-H.M. and A.D.; investigation, J.G., W.J.-H.M., H.G. and A.B.; writing—original draft preparation, J.G. and W.J.-H.M.; writing—review and editing, H.G., I.G.-R., A.B. and A.D.; visualisation, W.J.-H.M. and J.G. All authors have read and agreed to the published version of the manuscript.

Funding

This research received no external funding.

Institutional Review Board Statement

Not applicable.

Informed Consent Statement

Not applicable.

Data Availability Statement

The data used in this paper will be provided on request by J. Grießinger ([email protected]) or W. Meier ([email protected]).

Acknowledgments

20th Century Reanalysis V3 data provided by the NOAA/OAR/ESRL PSL, Boulder, Colorado, USA, from their Web site at https://psl.noaa.gov/data/gridded/data.20thC_ReanV3.html, accessed on 28 June 2021. Climate data for the stations Samedan and Segl-Maria and related services were provided by MeteoSwiss, the Swiss Federal Office of Meteorology and Climatology.

Conflicts of Interest

The authors declare no conflict of interest.

References

  1. Beniston, M.; Stoffel, M. Assessing the impacts of climatic change on mountain water resources. Sci. Total Environ. 2014, 493, 1129–1137. [Google Scholar] [CrossRef]
  2. Loarie, S.R.; Duffy, P.B.; Hamilton, H.; Asner, G.P.; Field, C.B.; Ackerly, D.D. The velocity of climate change. Nature 2009, 462, 1052–1055. [Google Scholar] [CrossRef] [PubMed]
  3. Nogués-Bravo, D.; Araújo, M.B.; Errea, M.P.; Martínez-Rica, J.P. Exposure of global mountain systems to climate warming during the 21st Century. Glob. Environ. Chang. 2007, 17, 420–428. [Google Scholar] [CrossRef]
  4. Pepin, N.C.; Seidel, D.J. A global comparison of surface and free-air temperatures at high elevations. J. Geophys. Res. 2005, 110, 161. [Google Scholar] [CrossRef]
  5. Hoegh-Guldberg, O.; Jacob, D.; Bindi, M.; Brown, S.; Camilloni, I.; Diedhiou, A.; Djalante, R.; Ebi, K.; Engelbrecht, F.; Guiot, J.; et al. Impacts of 1.5 °C Global Warming on Natural and Human Systems. In Global Warming of 1.5 °C. An IPCC Special Report; Masson-Delmotte, V., Zhai, P., Pörtner, H.-O., Roberts, D., Skea, J., Shukla, P.R., Pirani, A., Moufouma-Okai, W., Péan, C., Pidcock, R., et al., Eds.; IPCC Secretariat: Geneva, Switzerland, 2018. [Google Scholar]
  6. Pepin, N.; Bradley, R.S.; Diaz, H.F.; Baraer, M.; Caceres, E.B.; Forsythe, N.; Fowler, H.; Greenwood, G.; Hashmi, M.Z.; Liu, X.D.; et al. Elevation-dependent warming in mountain regions of the world. Nat. Clim Chang. 2015, 5, 424–430. [Google Scholar] [CrossRef] [Green Version]
  7. Haeberli, W. Mountain permafrost—Research frontiers and a special long-term challenge. Cold Reg. Sci. Technol. 2013, 96, 71–76. [Google Scholar] [CrossRef]
  8. Lavergne, A.; Daux, V.; Villalba, R.; Pierre, M.; Stievenard, M.; Srur, A.M. Improvement of isotope-based climate reconstructions in Patagonia through a better understanding of climate influences on isotopic fractionation in tree rings. Earth Planet. Sci. Lett. 2017, 459, 372–380. [Google Scholar] [CrossRef]
  9. Huang, R.; Zhu, H.; Liang, E.; Grießinger, J.; Dawadi, B.; Bräuning, A. High-elevation shrub-ring δ18O on the northern slope of the central Himalayas records summer (May–July) temperatures. Palaeogeogr. Palaeoclimatol. Palaeoecol. 2019, 524, 230–239. [Google Scholar] [CrossRef]
  10. Huang, R.; Zhu, H.; Liang, E.; Grießinger, J.; Wernicke, J.; Yu, W.; Hochreuther, P.; Risi, C.; Zeng, Y.; Fremme, A.; et al. Temperature signals in tree-ring oxygen isotope series from the northern slope of the Himalaya. Earth Planet. Sci. Lett. 2019, 506, 455–465. [Google Scholar] [CrossRef]
  11. Edwards, T.W.; Birks, S.J.; Luckman, B.H.; MacDonald, G.M. Climatic and hydrologic variability during the past millennium in the eastern Rocky Mountains and northern Great Plains of western Canada. Quat. Res. 2008, 70, 188–197. [Google Scholar] [CrossRef]
  12. Reynolds-Henne, C.E.; Siegwolf, R.T.W.; Treydte, K.S.; Esper, J.; Henne, S.; Saurer, M. Temporal stability of climate-isotope relationships in tree rings of oak and pine (Ticino, Switzerland). Glob. Biogeochem. Cycles 2007, 21. [Google Scholar] [CrossRef]
  13. Xu, C.; Sano, M.; Nakatsuka, T. A 400-year record of hydroclimate variability and local ENSO history in northern Southeast Asia inferred from tree-ring δ18O. Palaeogeogr. Palaeoclimatol. Palaeoecol. 2013, 386, 588–598. [Google Scholar] [CrossRef]
  14. Grießinger, J.; Bräuning, A.; Helle, G.; Hochreuther, P.; Schleser, G. Late Holocene relative humidity history on the southeastern Tibetan plateau inferred from a tree-ring δ18O record: Recent decrease and conditions during the last 1500 years. Quat. Int. 2017, 430, 52–59. [Google Scholar] [CrossRef]
  15. Liu, X.; Xu, G.; Grießinger, J.; An, W.; Wang, W.; Zeng, X.; Wu, G.; Qin, D. A shift in cloud cover over the southeastern Tibetan Plateau since 1600: Evidence from regional tree-ring δ18O and its linkages to tropical oceans. Quat. Sci. Rev. 2014, 88, 55–68. [Google Scholar] [CrossRef]
  16. Berkelhammer, M.B.; Stott, L.D. Recent and dramatic changes in Pacific storm trajectories recorded in δ18O from Bristlecone Pine tree ring cellulose. Geochem. Geophys. Geosyst. 2008, 9. [Google Scholar] [CrossRef] [Green Version]
  17. Ferrio, J.P.; Díez-Herrero, A.; Tarrés, D.; Ballesteros-Cánovas, J.A.; Aguilera, M.; Bodoque, J.M. Using stable isotopes of oxygen from tree-rings to study the origin of past flood events: First results from the iberian peninsula. Quaternaire 2015, 26, 67–80. [Google Scholar] [CrossRef] [Green Version]
  18. Miller, D.L.; Mora, C.I.; Grissino-Mayer, H.D.; Mock, C.J.; Uhle, M.E.; Sharp, Z. Tree-ring isotope records of tropical cyclone activity. Proc. Natl. Acad. Sci. USA 2006, 103, 14294–14297. [Google Scholar] [CrossRef] [Green Version]
  19. Dinis, L.; Bégin, C.; Savard, M.M.; Marion, J.; Brigode, P.; Alvarez, C. Tree-ring stable isotopes for regional discharge reconstruction in eastern Labrador and teleconnection with the Arctic Oscillation. Clim. Dyn. 2019, 53, 3625–3640. [Google Scholar] [CrossRef]
  20. Meier, W.J.-H.; Aravena, J.-C.; Jaña, R.; Braun, M.H.; Hochreuther, P.; Soto-Rogel, P.; Grießinger, J. A tree-ring δ18O series from southernmost Fuego-Patagonia is recording flavors of the Antarctic Oscillation. Glob. Planet. Chang. 2020, 195, 103302. [Google Scholar] [CrossRef]
  21. Grießinger, J.; Langhamer, L.; Schneider, C.; Saß, B.-L.; Steger, D.; Skvarca, P.; Braun, M.H.; Meier, W.J.-H.; Srur, A.M.; Hochreuther, P. Imprints of Climate Signals in a 204 Year δ18O Tree-Ring Record of Nothofagus pumilio From Perito Moreno Glacier, Southern Patagonia (50° S). Front. Earth Sci. 2018, 6, 27. [Google Scholar] [CrossRef]
  22. Hochreuther, P.; Wernicke, J.; Grießinger, J.; Mölg, T.; Zhu, H.; Wang, L.; Bräuning, A. Influence of the Indian Ocean Dipole on tree-ring δ18O of monsoonal Southeast Tibet. Clim. Chang. 2016, 137, 217–230. [Google Scholar] [CrossRef]
  23. Xu, C.; Buckley, B.M.; Wang, S.-Y.S.; An, W.; Li, Z.; Nakatsuka, T.; Guo, Z. Oxygen Isotopes in Tree Rings from Greenland: A New Proxy of NAO. Atmosphere 2021, 12, 39. [Google Scholar] [CrossRef]
  24. Saurer, M.; Schweingruber, F.; Vaganov, E.A.; Shiyatov, S.G.; Siegwolf, R. Spatial and temporal oxygen isotope trends at the northern tree-line in Eurasia. Geophys. Res. Lett. 2002, 29, 7-1–7-4. [Google Scholar] [CrossRef] [Green Version]
  25. Wernicke, J.; Hochreuther, P.; Grießinger, J.; Zhu, H.; Wang, L.; Bräuning, A. Air mass origin signals in δ18O of tree-ring cellulose revealed by back-trajectory modeling at the monsoonal Tibetan plateau. Int. J. Biometeorol. 2017, 61, 1109–1124. [Google Scholar] [CrossRef] [PubMed]
  26. Kress, A.; Saurer, M.; Siegwolf, R.T.W.; Frank, D.C.; Esper, J.; Bugmann, H. A 350 year drought reconstruction from Alpine tree ring stable isotopes. Glob. Biogeochem. Cycles 2010, 24. [Google Scholar] [CrossRef] [Green Version]
  27. McCarroll, D.; Loader, N.J. Stable isotopes in tree rings. Quat. Sci. Rev. 2004, 23, 771–801. [Google Scholar] [CrossRef]
  28. Dongmann, G.; Nürnberg, H.W.; Förstel, H.; Wagener, K. On the enrichment of H2 18O in the leaves of transpiring plants. Radiat. Environ. Biophys. 1974, 11, 41–52. [Google Scholar] [CrossRef] [PubMed]
  29. Barbour, M.M. Stable oxygen isotope composition of plant tissue: A review. Funct. Plant Biol. 2007, 34, 83–94. [Google Scholar] [CrossRef] [PubMed]
  30. Barbour, M.M.; Schurr, U.; Henry, B.K.; Wong, S.C.; Farquhar, G.D. Variation in the oxygen isotope ratio of phloem sap sucrose from castor bean. Evidence in support of the Péclet effect. Plant Physiol. 2000, 123, 671–680. [Google Scholar] [CrossRef] [Green Version]
  31. Roden, J.S.; Ehleringer, J.R. Hydrogen and oxygen isotope ratios of tree ring cellulose for field-grown riparian trees. Oecologia 2000, 123, 481–489. [Google Scholar] [CrossRef] [PubMed]
  32. Craig, H.; Gordon, L.I. Deuterium and oxygen 18 variations in the ocean and the marine atmosphere. In Stable Isotopes in Oceanographic Studies and Paleotemperatures; Tongiorgi, E., Ed.; Consiglio Nazionale delle Richerche, Laboratorio de Geologia Nucleare: Pisa, Italy, 1965. [Google Scholar]
  33. Gessler, A.; Ferrio, J.P.; Hommel, R.; Treydte, K.; Werner, R.A.; Monson, R.K. Stable isotopes in tree rings: Towards a mechanistic understanding of isotope fractionation and mixing processes from the leaves to the wood. Tree Physiol. 2014, 34, 796–818. [Google Scholar] [CrossRef] [Green Version]
  34. Farquhar, G.D.; Lloyd, J. Carbon and Oxygen Isotope Effects in the Exchange of Carbon Dioxide between Terrestrial Plants and the Atmosphere. In Stable Isotopes and Plant Carbon-Water Relations; Saugier, B., Ehleringer, J.R., Hall, A.E., Farquhar, G.D., Eds.; Elsevier: Burlington, VT, USA, 1993; pp. 47–70. ISBN 9780122333804. [Google Scholar]
  35. Flanagan, L.B.; Ehleringer, J.R. Effects of Mild Water Stress and Diurnal Changes in Temperature and Humidity on the Stable Oxygen and Hydrogen Isotopic Composition of Leaf Water in Cornus stolonifera L. Plant Physiol. 1991, 97, 298–305. [Google Scholar] [CrossRef] [PubMed] [Green Version]
  36. DeNiro, M.J.; Epstein, S. Isotopic composition of cellulose from aquatic organisms. Geochim. Cosmochim. Acta 1981, 45, 1885–1894. [Google Scholar] [CrossRef]
  37. Deniro, M.J.; Epstein, S. Relationship between the oxygen isotope ratios of terrestrial plant cellulose, carbon dioxide, and water. Science 1979, 204, 51–53. [Google Scholar] [CrossRef]
  38. Sternberg, L.d.S.L. Oxygen stable isotope ratios of tree-ring cellulose: The next phase of understanding. New Phytol. 2009, 181, 553–562. [Google Scholar] [CrossRef] [PubMed]
  39. Gessler, A.; Brandes, E.; Buchmann, N.; Helle, G.; Rennenberg, H.; Barnard, R.L. Tracing carbon and oxygen isotope signals from newly assimilated sugars in the leaves to the tree-ring archive. Plant Cell Environ. 2009, 32, 780–795. [Google Scholar] [CrossRef]
  40. Risi, C.; Noone, D.; Worden, J.; Frankenberg, C.; Stiller, G.; Kiefer, M.; Funke, B.; Walker, K.; Bernath, P.; Schneider, M.; et al. Process-evaluation of tropospheric humidity simulated by general circulation models using water vapor isotopologues: 1. Comparison between models and observations. J. Geophys. Res. 2012, 117. [Google Scholar] [CrossRef] [Green Version]
  41. Mueller, M.H.; Alaoui, A.; Kuells, C.; Leistert, H.; Meusburger, K.; Stumpp, C.; Weiler, M.; Alewell, C. Tracking water pathways in steep hillslopes by δ18O depth profiles of soil water. J. Hydrol. 2014, 519, 340–352. [Google Scholar] [CrossRef]
  42. Meißner, M.; Köhler, M.; Schwendemann, L.; Hölscher, D.; Dyckmans, J. Soil water uptake by trees using water stable isotopes (δ2H and δ18O)-a method test regarding soil moisture, texture and carbonate. Plant Soil 2014, 376, 327–335. [Google Scholar] [CrossRef]
  43. Gazis, C.; Feng, X. A stable isotope study of soil water: Evidence for mixing and preferential flow paths. Geoderma 2004, 119, 97–111. [Google Scholar] [CrossRef]
  44. Saurer, M.; Spahni, R.; Frank, D.C.; Joos, F.; Leuenberger, M.; Loader, N.J.; McCarroll, D.; Gagen, M.; Poulter, B.; Siegwolf, R.T.W.; et al. Spatial variability and temporal trends in water-use efficiency of European forests. Glob. Chang. Biol. 2014, 20, 3700–3712. [Google Scholar] [CrossRef]
  45. Churakova-Sidorova, O.V.; Lienert, S.; Timofeeva, G.; Siegwolf, R.; Roden, J.; Joos, F.; Saurer, M. Measured and modelled source water δ18O based on tree-ring cellulose of larch and pine trees from the permafrost zone. iForest 2020, 13, 224–229. [Google Scholar] [CrossRef]
  46. Churakova, O.V.; Shashkin, A.V.; Siegwolf, R.T.; Spahni, R.; Launois, T.; Saurer, M.; Bryukhanova, M.V.; Benkova, A.V.; Kuptsova, A.V.; Peylin, P.; et al. Application of eco-physiological models to the climatic interpretation of δ13C and δ18O measured in Siberian larch tree-rings. Dendrochronologia 2016, 39, 51–59. [Google Scholar] [CrossRef]
  47. Wang, C.; Wang, Z.; Kong, Y.; Zhang, F.; Yang, K.; Zhang, T. Most of the Northern Hemisphere Permafrost Remains under Climate Change. Sci. Rep. 2019, 9, 3295. [Google Scholar] [CrossRef] [Green Version]
  48. Koven, C.D.; Riley, W.J.; Stern, A. Analysis of Permafrost Thermal Dynamics and Response to Climate Change in the CMIP5 Earth System Models. J. Clim. 2013, 26, 1877–1900. [Google Scholar] [CrossRef] [Green Version]
  49. Sugimoto, A.; Yanagisawa, N.; Naito, D.; Fujita, N.; Maximov, T.C. Importance of permafrost as a source of water for plants in east Siberian taiga. Ecol. Res. 2002, 17, 493–503. [Google Scholar] [CrossRef]
  50. Sugimoto, A.; Naito, D.; Yanagisawa, N.; Ichiyanagi, K.; Kurita, N.; Kubota, J.; Kotake, T.; Ohata, T.; Maximov, T.C.; Fedorov, A.N. Characteristics of soil moisture in permafrost observed in East Siberian taiga with stable isotopes of water. Hydrol. Process. 2003, 17, 1073–1092. [Google Scholar] [CrossRef]
  51. Bryukhanova, M.V.; Fonti, P.; Kirdyanov, A.V.; Siegwolf, R.T.; Saurer, M.; Pochebyt, N.P.; Churakova, O.V.; Prokushkin, A.S. The response of δ13C, δ18O and cell anatomy of Larix gmelinii tree rings to differing soil active layer depths. Dendrochronologia 2015, 34, 51–59. [Google Scholar] [CrossRef]
  52. Sidorova, O.V.; Siegwolf, R.T.W.; Saurer, M.; NAURZBAEV, M.M.; Vaganov, E.A. Isotopic composition (δ13C, δ18O) in wood and cellulose of Siberian larch trees for early Medieval and recent periods. J. Geophys. Res. 2008, 113, 1–13. [Google Scholar] [CrossRef] [Green Version]
  53. Sidorova, O.V.; Siegwolf, R.T.W.; Saurer, M.; Naurzbaev, M.M.; Shashkin, A.V.; Vaganov, E.A. Spatial patterns of climatic changes in the Eurasian north reflected in Siberian larch tree-ring parameters and stable isotopes. Glob. Chang. Biol. 2010, 16, 1003–1018. [Google Scholar] [CrossRef] [Green Version]
  54. Holzkämper, S.; Tillman, P.K.; Kuhry, P.; Esper, J. Comparison of stable carbon and oxygen isotopes in Picea glauca tree rings and Sphagnum fuscum moss remains from subarctic Canada. Quat. Res. 2012, 78, 295–302. [Google Scholar] [CrossRef]
  55. Kirdyanov, A.V.; Saurer, M.; Siegwolf, R.; Knorre, A.A.; Prokushkin, A.S.; Churakova, O.V.; Fonti, M.V.; Büntgen, U. Long-term ecological consequences of forest fires in the continuous permafrost zone of Siberia. Environ. Res. Lett. 2020, 15, 34061. [Google Scholar] [CrossRef]
  56. Haeberli, W.; Noetzli, J.; Arenson, L.; Delaloye, R.; Gärtner-Roer, I.; Gruber, S.; Isaksen, K.; Kneisel, C.; Krautblatter, M.; Phillips, M. Mountain permafrost: Development and challenges of a young research field. J. Glaciol. 2010, 56, 1043–1058. [Google Scholar] [CrossRef] [Green Version]
  57. Haeberli, W.; Hallet, B.; Arenson, L.; Elconin, R.; Humlum, O.; Kääb, A.; Kaufmann, V.; Ladanyi, B.; Matsuoka, N.; Springman, S.; et al. Permafrost creep and rock glacier dynamics. Permafr. Periglac. Processes 2006, 17, 189–214. [Google Scholar] [CrossRef]
  58. Konecky, B.L.; McKay, N.P.; Churakova, O.V.; Comas-Bru, L.; Dassié, E.P.; DeLong, K.L.; Falster, G.M.; Fischer, M.J.; Jones, M.D.; Jonkers, L.; et al. The Iso2k database: A global compilation of paleo-δ18O and δ2H records to aid understanding of Common Era climate. Earth Syst. Sci. Data 2020, 12, 2261–2288. [Google Scholar] [CrossRef]
  59. Kneisel, C. The nature and dynamics of frozen ground in alpine and subarctic periglacial environments. Holocene 2010, 20, 423–445. [Google Scholar] [CrossRef]
  60. Kneisel, C.; Hauck, C.; Mhll, D.V. Permafrost below the Timberline Confirmed and Characterized by Geoelectrical Resistivity Measurements, Bever Valley, Eastern Swiss Alps. Permafr. Periglac. Processes 2000, 11, 295–304. [Google Scholar] [CrossRef]
  61. Farr, T.G.; Rosen, P.A.; Caro, E.; Crippen, R.; Duren, R.; Hensley, S.; Kobrick, M.; Paller, M.; Rodriguez, E.; Roth, L.; et al. The Shuttle Radar Topography Mission. Rev. Geophys. 2007, 45. [Google Scholar] [CrossRef] [Green Version]
  62. Holtmeier, K.F. Die Verbreitung der Holzarten im Oberengadin unter dem Einfluss des Menschen und des Lokalklimas. Erdkunde 1967, 21, 249–258. [Google Scholar] [CrossRef] [Green Version]
  63. Kenner, R. Permafrost and Ground Ice Map of Switzerland. Available online: https://zenodo.org/record/1470165#.YNnmnUwRVPY (accessed on 28 June 2021).
  64. RGI Consortium. Randolph Glacier Inventory—A Dataset of Global Glacier Outlines: Version 6.0; Technical Report; Global Land Ice Measurements from Space: Boulder, CO, USA, 2017. [Google Scholar]
  65. Rist, A.; Roth, L.; Veit, H. Elevational ground/air thermal gradients in the Swiss inner Alpine Valais. Arct. Antarct. Alp. Res. 2020, 52, 341–360. [Google Scholar] [CrossRef]
  66. Magnes, M.; Kirschner, P.; Janišová, M.; Mayrhofer, H.; Berg, C.; Mora, A.; Willner, W.; Belonovskaya, E.; Berastegi, A.; Cancellieri, L.; et al. On the trails of Josias Braun-Blanquet—Changes in the grasslands of the inneralpine dry valleys during the last 70 years. First results from the 11th EDGG Field Workshop in Austria. Palaearct. Grassl. 2020, 45, 34–58. [Google Scholar] [CrossRef]
  67. Schüepp, M. Klimatologie der Schweiz. Teil C. Lufttemperatur. In Beiheft zu den Analen der Schweizerischen Meteorologischen Zentralanstalt Zürich; City-Druck AG: Zürich, Switzerland, 1986; pp. 1–46. [Google Scholar]
  68. Gensler, G.A. Das Klima von Graubünden. Ein Beitrag zur Regionalklimatologie in der Schweiz. Working Reports of the Swiss Meteorological Institute 1978, 77. Available online: https://www.meteoschweiz.admin.ch/content/dam/meteoswiss/de/Ungebundene-Seiten/Publikationen/Fachberichte/doc/arbeitsbericht77.pdf (accessed on 28 June 2021).
  69. Reisigl, H.; Keller, R. Lebensraum Bergwald: Alpenpflanzen in Bergwald, Baumgrenze und Zwergstrauchheide; Vegetationsökologische Informationen für Studien, Exkursionen und Wanderungen; Fischer: Stuttgart, Germany, 1989; ISBN 3437204513. [Google Scholar]
  70. Boeckli, L.; Brenning, A.; Gruber, S.; Noetzli, J. Permafrost distribution in the European Alps: Calculation and evaluation of an index map and summary statistics. Cryosphere 2012, 6, 807–820. [Google Scholar] [CrossRef] [Green Version]
  71. Fu, P.; Rich, P.M. Design and Implementation of the Solar Analyst: An ArcView Extension for Modeling Solar Radiation at Landscape Scales. In Proceedings of the Nineteenth Annual ESRI User Conference, San Diego, CA, USA, 26–30 July 1999. [Google Scholar]
  72. Fu, P.; Rich, P.M. A geometric solar radiation model with applications in agriculture and forestry. Comput. Electron. Agric. 2002, 37, 25–35. [Google Scholar] [CrossRef]
  73. Kneisel, C.; Hauck, C. Multi-method geophysical investigation of a sporadic permafrost occurence. Z. Geomorph. Suppl. 2003, 132, 145–159. [Google Scholar]
  74. Kneisel, C. Sporadic and discontinous mountain permafrost occurrence in the Upper Engadine, eastern Swiss Alps. In Permafrost, Proceedings of the 8th International Conference on Permafrost, Zurich, Switzerland, 21–25 July 2003; Phillips, M., Springman, S.M., Arenson, L.U., Eds.; Balkema: Lisse, The Netherlands, 2003; pp. 561–566. ISBN 90 5809 582 7. [Google Scholar]
  75. Kneisel, C.; Schwindt, D. Geophysical Mapping of Isolated Permafrost Lenses at a Sporadic Permafrost Site at Low Altitude in the Swiss Alps. In Permafrost on a Warming Planet: Impacts on Ecosystems, Infrastructure and Climate, Proceedings of the Ninth International Conference on Permafrost, Fairbanks, AK, USA, 23 June–3 July 2008; Kane, D.L., Hinkel, K.M., Eds.; Institute of Northern Engineering, University of Alaska Fairbanks: Fairbanks, AK, USA, 2008; Volume 1, pp. 959–964. ISBN 978-0-9800179-2-2. [Google Scholar]
  76. Hauck, C.; Kneisel, C. Quantifying the ice content in low-altitude scree slopes using geophysical methods. In Applied Geophysics in Periglacial Environments; Hauck, C., Kneisel, C., Eds.; Cambridge University Press: Cambridge, UK, 2008; pp. 153–164. ISBN 9780511535628. [Google Scholar]
  77. Schwindt, D. Permafrost in Ventilated Talus Slopes below the Timberline: A Multi-Methodological Study on the Ground Thermal Regime and Its Impact on the Temporal Variability and Spatial Heterogeneity of Permafrost at Three Sites in the Swiss Alps. Ph.D. Thesis, Juluis Maximilians University, Würzburg, Germany, 2013. [Google Scholar]
  78. Gärtner-Roer, I.; Bast, A. (Ground) Ice in the Proglacial Zone. In Geomorphology of Proglacial Systems; Heckmann, T., Morche, D., Eds.; Springer International Publishing: Cham, Switzerland, 2019; pp. 85–98. [Google Scholar]
  79. Noetzli, J.; Arenson, L.U.; Bast, A.; Beutel, J.; Delaloye, R.; Farinotti, D.; Gruber, S.; Gubler, H.; Haeberli, W.; Hasler, A.; et al. Best Practice for Measuring Permafrost Temperature in Boreholes Based on the Experience in the Swiss Alps. Front. Earth Sci. 2021, 9, 607875. [Google Scholar] [CrossRef]
  80. Boaga, J.; Phillips, M.; Noetzli, J.; Haberkorn, A.; Kenner, R.; Bast, A. A Comparison of Frequency Domain Electro-Magnetometry, Electrical Resistivity Tomography and Borehole Temperatures to Assess the Presence of Ice in a Rock Glacier. Front. Earth Sci. 2020, 8, 593. [Google Scholar] [CrossRef]
  81. Gude, M.; Dietrich, S.; Mäusbacher, R.; Hauck, C.; Molenda, R.; Ruzicka, V.; Zacharda, M. Probable occurrence of sporadic permafrost in non-alpine scree slopes in central Europe. In Permafrost, Proceedings of the 8th International Conference on Permafrost, Zurich, Switzerland, 21–25 July 2003; Phillips, M., Springman, S.M., Arenson, L.U., Eds.; Balkema: Lisse, The Netherlands, 2003; pp. 331–336. ISBN 90 5809 582 7. [Google Scholar]
  82. Gärtner-Roer, I.; Hoelzle, M. Rockglaciers of the Engadine. In Landscapes and Landforms of Switzerland; Reynard, E., Ed.; Springer: Cham, Switzerland, 2021; pp. 235–248. ISBN 978-3-030-43203-4. [Google Scholar]
  83. Luetschg, M.; Stoeckli, V.; Lehning, M.; Haeberli, W.; Ammann, W. Temperatures in two boreholes at Flüela Pass, Eastern Swiss Alps: The effect of snow redistribution on permafrost distribution patterns in high mountain areas. Permafr. Periglac. Processes 2004, 15, 283–297. [Google Scholar] [CrossRef]
  84. Bast, A.; Gärtner, H.; Gärtner-Roer, I. If trees have cold feet: Tree-ring analyses of Larix decidua Mil. at a sporadic permafrost site in the Swiss Alps. In Proceedings of the Abstract Volume 8th Swiss Geoscience Meeting, Fribourg, Switzerland, 19–20 November 2010; Swiss Academy of Sciences: Bern, Switzerland, 2010; pp. 150–151. [Google Scholar]
  85. Bast, A.; Gärtner, H.; Gärtner-Roer, I.; Kneisel, C. Tree-ring analyses at a sporadic permafrost site below timberline, Bever Valley, Switzerland. In Proceedings of the Annual meeting of the Association for Tree-Ring Research, Riga, Latvia, 3–6 May 2007. [Google Scholar]
  86. Bunn, A.G. Statistical and visual crossdating in R using the dplR library. Dendrochronologia 2010, 28, 251–258. [Google Scholar] [CrossRef]
  87. R Core Team. R: A Language and Environment for Statistical Computing; R Foundation for Statistical Computing: Vienna, Austria; Available online: https://www.R-project.org/ (accessed on 17 May 2019).
  88. Labuhn, I.; Daux, V.; Pierre, M.; Stievenard, M.; Girardclos, O.; Féron, A.; Genty, D.; Masson-Delmotte, V.; Mestre, O. Tree age, site and climate controls on tree ring cellulose δ18O: A case study on oak trees from south-western France. Dendrochronologia 2014, 32, 78–89. [Google Scholar] [CrossRef]
  89. Duffy, J.E.; McCarroll, D.; Barnes, A.; Bronk Ramsey, C.; Davies, D.; Loader, N.J.; Miles, D.; Young, G.H. Short-lived juvenile effects observed in stable carbon and oxygen isotopes of UK oak trees and historic building timbers. Chem. Geol. 2017, 472, 1–7. [Google Scholar] [CrossRef]
  90. Dorado Liñán, I.; Gutiérrez, E.; Helle, G.; Heinrich, I.; Andreu-Hayles, L.; Planells, O.; Leuenberger, M.; Bürger, C.; Schleser, G. Pooled versus separate measurements of tree-ring stable isotopes. Sci. Total Environ. 2011, 409, 2244–2251. [Google Scholar] [CrossRef] [PubMed]
  91. Grießinger, J.; Bräuning, A.; Helle, G.; Schleser, G.; Hochreuther, P.; Meier, W.; Zhu, H. A Dual Stable Isotope Approach Unravels Common Climate Signals and Species-Specific Responses to Environmental Change Stored in Multi-Century Tree-Ring Series from the Tibetan Plateau. Geosciences 2019, 9, 151. [Google Scholar] [CrossRef] [Green Version]
  92. Bunn, A.G. A dendrochronology program library in R (dplR). Dendrochronologia 2008, 26, 115–124. [Google Scholar] [CrossRef]
  93. Cook, E.R.; Briffa, K.R. A comparison of Some Tree-Ring Standardization Methods. In Methods of Dendrochronology: Applications in the Environmental Sciences; Cook, E.R., Kairiukstis, L.A., Eds.; Springer: Dordrecht, The Netherlands, 1990; pp. 153–162. ISBN 978-94-015-7879-0. [Google Scholar]
  94. Obojes, N.; Meurer, A.; Newesely, C.; Tasser, E.; Oberhuber, W.; Mayr, S.; Tappeiner, U. Water stress limits transpiration and growth of European larch up to the lower subalpine belt in an inner-alpine dry valley. New Phytol. 2018, 220, 460–475. [Google Scholar] [CrossRef] [Green Version]
  95. Lévesque, M.; Rigling, A.; Bugmann, H.; Weber, P.; Brang, P. Growth response of five co-occurring conifers to drought across a wide climatic gradient in Central Europe. Agric. For. Meteorol. 2014, 197, 1–12. [Google Scholar] [CrossRef]
  96. Cook, E.R.; Pederson, N. Uncertainty, Emergence, and Statistics in Dendrochronology. In Dendroclimatology; Hughes, M.K., Swetnam, T.W., Diaz, H.F., Eds.; Springer: Dordrecht, The Netherlands, 2011; pp. 77–112. ISBN 978-1-4020-4010-8. [Google Scholar]
  97. Esper, J.; Frank, D.; Büntgen, U.; Verstege, A.; Luterbacher, J.; Xoplaki, E. Long-term drought severity variations in Morocco. Geophys. Res. Lett. 2007, 34. [Google Scholar] [CrossRef] [Green Version]
  98. Baltensweiler, W.; Weber, U.M.; Cherubini, P. Tracing the influence of larch-bud-moth insect outbreaks and weather conditions on larch tree-ring growth in Engadine (Switzerland). Oikos 2008, 117, 161–172. [Google Scholar] [CrossRef]
  99. Kress, A.; Saurer, M.; Büntgen, U.; Treydte, K.S.; Bugmann, H.; Siegwolf, R.T.W. Summer temperature dependency of larch budmoth outbreaks revealed by Alpine tree-ring isotope chronologies. Oecologia 2009, 160, 353–365. [Google Scholar] [CrossRef] [Green Version]
  100. Bader, S.; Bantle, H. Das Schweizer Klima im Trend Temperatur- und Niederschlagsentwicklung 1864–2001; Bundesamt für Meteorologie und Klimatologie, MeteoSchweiz: Zürich, Switzerland, 2004; ISBN 1422-1381. [Google Scholar]
  101. Füllemann, C.; Begert, M.; Croci-Maspoli, M.; Brönnimann, S. Digitalisieren und Homogenisieren von Historischen Klimadaten des Swiss NBCN—Resultate aus DigiHom; Bundesamt für Meteorologie und Klimatologie, MeteoSchweiz: Zürich, Switzerland, 2011. [Google Scholar]
  102. Vicente-Serrano, S.M.; Beguería, S.; López-Moreno, J.I. A Multiscalar Drought Index Sensitive to Global Warming: The Standardized Precipitation Evapotranspiration Index. J. Clim. 2010, 23, 1696–1718. [Google Scholar] [CrossRef] [Green Version]
  103. Beguería, S.; Vicente-Serrano, S.M. Package ‘SPEI’. Available online: https://cran.r-project.org/web/packages/SPEI/index.html (accessed on 28 June 2021).
  104. Harris, I.; Osborn, T.J.; Jones, P.; Lister, D. Version 4 of the CRU TS monthly high-resolution gridded multivariate climate dataset. Sci. Data 2020, 7, 109. [Google Scholar] [CrossRef] [PubMed] [Green Version]
  105. Slivinski, L.C.; Compo, G.P.; Whitaker, J.S.; Sardeshmukh, P.D.; Giese, B.S.; McColl, C.; Allan, R.; Yin, X.; Vose, R.; Titchner, H.; et al. Towards a more reliable historical reanalysis: Improvements for version 3 of the Twentieth Century Reanalysis system. Q. J. R. Meteorol. Soc. 2019, 145, 2876–2908. [Google Scholar] [CrossRef] [Green Version]
  106. Wigley, T.M.L.; Briffa, K.R.; Jones, P.D. On the Average Value of Correlated Time Series, with Applications in Dendroclimatology and Hydrometeorology. J. Clim. Appl. Meteorol. 1984, 23, 201–213. [Google Scholar] [CrossRef]
  107. Saurer, M.; Cherubini, P.; Reynolds-Henne, C.E.; Treydte, K.S.; Anderson, W.T.; Siegwolf, R.T.W. An investigation of the common signal in tree ring stable isotope chronologies at temperate sites. J. Geophys. Res. 2008, 113. [Google Scholar] [CrossRef]
  108. Saurer, M.; Kress, A.; Leuenberger, M.; Rinne, K.T.; Treydte, K.S.; Siegwolf, R.T.W. Influence of atmospheric circulation patterns on the oxygen isotope ratio of tree rings in the Alpine region. J. Geophys. Res. 2012, 117. [Google Scholar] [CrossRef] [Green Version]
  109. Dansgaard, W. Stable isotopes in precipitation. Tellus 1964, 16, 436–468. [Google Scholar] [CrossRef]
  110. Różański, K.; Araguás-Araguás, L.; Gonfiantini, R. Isotopic Patterns in Modern Global Precipitation. In Climate Change in Continental Isotopic Records; Swart, P.K., Ed.; American Geophysical Union: Washington, DC, USA, 1993; pp. 1–36. ISBN 1118664027. [Google Scholar]
  111. Saurer, M.; Kirdyanov, A.V.; Prokushkin, A.S.; Rinne, K.T.; Siegwolf, R.T.W. The impact of an inverse climate-isotope relationship in soil water on the oxygen-isotope composition of Larix gmelinii in Siberia. New Phytol. 2016, 209, 955–964. [Google Scholar] [CrossRef]
  112. Rank, D.; Wyhlidal, S.; Schott, K.; Jung, M.; Heiss, G.; Tudor, M. A 50 Years’ Isotope Record of the Danube River Water and Its Relevance for Hydrological, Climatological and Environmental Research. Acta Zool. Bulg. 2014, 7, 109–115. [Google Scholar]
  113. Stumpp, C.; Klaus, J.; Stichler, W. Analysis of long-term stable isotopic composition in German precipitation. J. Hydrol. 2014, 517, 351–361. [Google Scholar] [CrossRef]
  114. Araguás-Araguás, L.; Froehlich, K.; Rozanski, K. Deuterium and oxygen-18 isotope composition of precipitation and atmospheric moisture. Hydrol. Process. 2000, 14, 1341–1355. [Google Scholar] [CrossRef]
  115. Büntgen, U.L.; Frank, D.; Wilson, R.O.; Carrer, M.; Urbinati, C.; Esper, J.A. Testing for tree-ring divergence in the European Alps. Glob. Chang. Biol. 2008, 14, 2443–2453. [Google Scholar] [CrossRef]
  116. Briffa, K.R.; Schweingruber, F.H.; Jones, P.D.; Osborn, T.J.; Shiyatov, S.G.; Vaganov, E.A. Reduced sensitivity of recent tree-growth to temperature at high northern latitudes. Nature 1998, 391, 678–682. [Google Scholar] [CrossRef]
  117. Esper, J.; Frank, D. Divergence pitfalls in tree-ring research. Clim. Chang. 2009, 94, 261–266. [Google Scholar] [CrossRef] [Green Version]
  118. Daux, V.; Edouard, J.L.; Masson-Delmotte, V.; Stievenard, M.; Hoffmann, G.; Pierre, M.; Mestre, O.; Danis, P.A.; Guibal, F. Can climate variations be inferred from tree-ring parameters and stable isotopes from Larix decidua? Juvenile effects, budmoth outbreaks, and divergence issue. Earth Planet. Sci. Lett. 2011, 309, 221–233. [Google Scholar] [CrossRef]
  119. Seftigen, K.; Linderholm, H.W.; Loader, N.J.; Liu, Y.; Young, G.H. The influence of climate on 13C/12C and 18O/16O ratios in tree ring cellulose of Pinus sylvestris L. growing in the central Scandinavian Mountains. Chem. Geol. 2011, 286, 84–93. [Google Scholar] [CrossRef]
  120. Loader, N.J.; McCarroll, D.; Miles, D.; Young, G.H.F.; Davies, D.; Ramsey, C.B. Tree ring dating using oxygen isotopes: A master chronology for central England. J. Quat. Sci. 2019, 34, 475–490. [Google Scholar] [CrossRef] [Green Version]
  121. Grießinger, J.; Bräuning, A.; Helle, G.; Thomas, A.; Schleser, G. Late Holocene Asian summer monsoon variability reflected by δ18O in tree-rings from Tibetan junipers. Geophys. Res. Lett. 2011, 38. [Google Scholar] [CrossRef]
Figure 1. (A) Digital elevation model of the study region in the Val Bever/Switzerland, including information on forest and tree species distribution, glaciers and estimated permafrost occurrence. Red dots represent major villages/towns and locations of the meteorological stations used in this study. Data sources: elevation data [61]; forest and tree species distribution [62]; permafrost data [63]; glacier outlines [64]. (B) Climate diagram of the Samedan meteorological climate station (source: Federal Office of Meteorology and Climatology—MeteoSwiss).
Atmosphere 12 00836 g001
Figure 3. (A) Mean annual δ18OTRC series of Larix decidua Mill. trees from Val Bever during the period 1830–2011 (mid panel) including the number of trees (upper panel). Grey shadings indicate 95% bootstrapped confidence intervals as chronology uncertainty, dashed black line represents linear trend of the series. Mean inter-tree correlation coefficient (RBar) and expressed population signal (EPS) are each calculated for a moving window of 20 years with an overlap of 10 years (lower panel). The dashed grey horizontal line indicates the common EPS threshold of 0.85 [106]. (B) Climate-proxy relationships between the MEAN-δ18OTRC and the meteorological stations Segl-Maria and Samedan for the common period 1864–2011. Solid and dashed horizontal lines indicate the 99% and 95% significance levels, respectively. For Samedan station, the available cloud cover data is comparably shorter (1980–2011), leading to different levels of significance. Previous years’ months and seasons are indicated by the prefix “p”.
Atmosphere 12 00836 g003
Figure 4. (A) Number of Larix decidua Mill. indicating the sample depth of measured δ18OTRC for trees growing on permafrost (blue line) and non-permafrost sites (red line). (B) Annual time series of δ18OTRC for trees on permafrost (blue) and non-permafrost sites (red). Shadings indicate 95% bootstrapped confidence intervals as chronology uncertainty, dashed lines represent linear trends of the series. Note: ordinate axes are shifted by 2.5‰ against each other for better visuality. (C) Absolute difference between the two isotope chronologies (annual values indicated in grey, decadal means as black lines).
Atmosphere 12 00836 g004
Figure 5. Climate sensitivities of the MEAN-δ18OTRC and trees growing on permafrost (PF-δ18OTRC) and non-permafrost (nPF-δ18OTRC) sites for monthly precipitation (A), temperature (B) and cloud cover (C). For the monthly correlation analysis, one or two asterisks mark the level of significance of p < 0.05 and p < 0.01, respectively. For the moving correlations, significant periods (p < 0.05) are marked by a black frame. The abscissas axis represents the mid-year of the 30 years moving window. Segl-Maria meteorological station data are provided by the Federal Office of Meteorology and Climatology/MeteoSwiss.
Atmosphere 12 00836 g005
Figure 6. Spatial correlations between CRU TS v 4.04 and PF-δ18OTRC/nPF-δ18OTRC for (A) precipitation (July), (B) maximum temperature (July–August) and (C) cloud cover (July) for the whole observation period (1901–2011) and intervals of 37 years. Black polygons and black points indicate 95% and 99% level of significance, respectively. The yellow dot marks the Val Bever study site.
Atmosphere 12 00836 g006
Figure 7. Correlation patterns between the nPF- and PF-δ18OTRC time series with (A) 850 hPa geopotential height fields and (B) downward solar radiation fluxes from the 20CRv3 reanalysis data (1901–2011) during the summer month (July–August). Black polygons indicate the 99% level of significance. The yellow dot marks the Val Bever study site.
Atmosphere 12 00836 g007
Figure 8. Annual and seasonal temperature departures relative to the mean temperature of the Climate Normal (1961–1990). Black line represents the temperature departures from the temperature composite of Segl-Maria and Samedan meteorological stations. Dark blue and red shades indicate the individual stations departures from the Climate Normal. Linear trend lines and the respective slopes are displayed since 1975.
Atmosphere 12 00836 g008
Table 1. Time series statistics of the individual δ18OTRC chronologies. Abbreviations: GLK (Gleichläufigkeit), RBar (inter-tree correlation coefficient), IC (Inter-series correlation coefficient), AC1 (first order autocorrelation), SNR (signal-to-noise ratio) and SD (standard deviation).
δ18OTRCPeriodGLKRBarICAC1SNRSD
MEAN-δ18OTRC1830–20110.700.410.540.264.900.90
PF-δ18OTRC1830–20110.610.370.360.221.780.93
nPF-δ18OTRC1830–20110.690.470.530.242.551.02
Table 2. Correlation coefficients between 10-years moving averages of Val Bever isotope time series and 10-years moving averages of temperatures (as a composite from Segl-Maria and Samedan climate stations 1864–2011). Bold values indicate significant correlations, whereas the 95 and 99% level of significance are labelled by one or two asterisks, respectively.
TemperatureMEAN-δ18OTRCPF-δ18OTRCnPF-δ18OTRC
Mean annual0.41 *0.160.63 **
July-August0.49 *0.300.62 **
Publisher’s Note: MDPI stays neutral with regard to jurisdictional claims in published maps and institutional affiliations.

