Article

Characterization of Black Carbon and Its Correlations with VOCs in the Northern Region of Hangzhou Bay in Shanghai, China

1
Shanghai Environmental Protection Key Laboratory for Environmental Standard and Risk Management of Chemical Pollutants, School of Resources & Environmental Engineering, East China University of Science and Technology, Shanghai 200237, China
2
State Environmental Protection Key Laboratory of Environmental Risk Assessment and Control on Chemical Processes, School of Resources & Environmental Engineering, East China University of Science and Technology, Shanghai 200237, China
3
Shanghai Institute of Pollution Control and Ecological Security, Shanghai 200092, China
*
Author to whom correspondence should be addressed.
Atmosphere 2021, 12(7), 870; https://doi.org/10.3390/atmos12070870
Submission received: 18 May 2021 / Revised: 21 June 2021 / Accepted: 30 June 2021 / Published: 4 July 2021
(This article belongs to the Section Air Quality)

Abstract

:
Ozone and PM2.5 (all particulate matter with diameter of 2.5 µm or smaller) are currently two disturbing environmental issues in most cities of China. Black carbon (BC), mainly from incomplete combustion, is one of the most important components of PM2.5 because it can absorb light and contribute to haze pollution and global warming. Meanwhile, volatile organic compounds (VOCs) have become a major air pollutant due to their association with haze, ozone (O3), global warming and human health by direct or indirect processes. In this study, one year-long observation campaign of BC, VOCs and other conventional air pollutants was conducted in the Northern Region of the Hangzhou Bay (NRHB) in Shanghai, China. The results indicated that higher concentration of BC mainly occurred in the autumn and winter, especially in December. In December, higher BC concentrations were found when the air mass came from northwest where there is an important local freeway, or southwest where some adjacent southwest chemical industrial parks are located. Different from the characteristics of BC in urban areas reported by previous studies, the diurnal variation of BC exhibited three peaks, two of which coincided with the morning and evening rush hours which are related to the heavy diesel traffic from a nearby freeway, and the third peak was often found late at night, around 2 am, which might be associated with abnormal emissions from an industrial park or marine traffic in the ocean waterway. BC had weakly negative correlation with O3 and NO, and a strongly positive correlation with PM2.5, SO2, NO2 and NOx, which implies that some incomplete combustion sources might occur in the nearby regions. With regard to VOCs, BC had a strong positive correlation with alkane, alkenes, alkynes, aromatic and non-sulfur VOCs, particularly with aromatic organic matter. Unlike the stronger correlation with aromatics in the morning rush hours, a stronger correlation between BC and alkenes and alkynes during the evening rush hour was observed. The relationships between BC and VOCs, particularly with some specific VOCs species related to the neighboring chemical industrial park, demonstrated that the contribution of the surrounding chemical industrial parks to BC should not be neglected.

1. Introduction

Over the past few decades, haze pollution due to aerosols in the atmosphere has become the most serious problem in most cities of China [1,2,3]. PM2.5 (all particulate matter with diameter of 2.5 µm or smaller) is recognized as the core air pollutant for the formation of haze, and more and more polices or regulations have been proposed by national and local governments to reduce the mass concentration of PM2.5 in China. Due to the implementation of strict control of PM2.5 in the past ten years, the ambient air quality has improved greatly, the annual average concentration of PM2.5 in China has reduced to 33 µg/m3 and most cities have complied with air quality standards (class II). Unfortunately, the concentration of ozone has increased gradually. The ozone, formed by complex reactions of VOCs (volatile organic compounds) and NOx, can lead to higher atmospheric oxidation capacity and contribute to climate change.
Black carbon (BC), one of the most important components of PM2.5, has attracted increasing scientific interest in recent decades in various countries [4,5,6], because it can absorb light and have adverse effects on human health. BC has relatively unique physical and chemical properties which determine its environmental behavior. Because BC is generally porous and similar to graphite, it can absorb other pollutants [7]. In addition, BC aerosols are dark and have strong absorption efficiency with regard to solar radiation in the wavelength range from visible light to infrared radiation; as such, it has been listed in the greenhouse gas group together with carbon dioxide (CO2), methane (CH4), and chlorofluorocarbons (CFCs). BC aerosols have a wider absorption band and contribute to about 15–30% of global warming [8,9]. The optical properties of BC aerosols exhibit complex temporal and spatial variations [10,11,12,13,14], and therefore it is difficult to assess and predict their contribution to global climate change and haze pollution. Many studies related to BC have focused mainly on the greenhouse effect, the health-related effects of BC, and the sources of BC worldwide [15,16,17,18,19,20,21]. Obviously, it is scientifically and practically significant for improving ambient air quality to determine the characteristics of BC aerosols [22,23,24].
BC can be generated from both natural and anthropogenic sources. The natural sources mainly include weathering of rock, volcanic eruptions, and forest fires, while the anthropogenic sources include incomplete combustion of biomass and fossil fuels. In the past several decades, the transportation and biomass burning have been research focuses [25,26,27,28,29], though several studies presented contributions by industrial sectors. Recently, more and more reports have been published on BC from gas flaring associated with petroleum gas. Huang and Fu measured the BC from gas flaring associated with petroleum gas and found that it could not be neglected for most global or regional emission inventories and is rarely considered in climate modeling [30]; they estimated the black carbon emission rate dataset from 1994 to 2012 to improve the model performance. It can be speculated that such industrial process emission sources as gas flaring might lead to higher BC concentration in the neighboring regions.
In general, the distribution of BC aerosols varies significantly across the globe: the concentration of BC aerosols in urban areas, continental areas, and in the northern hemisphere is higher than those in rural areas, marine areas, and in the southern hemisphere [31,32]. The concentration of BC in the atmosphere is low, and its contribution to the atmospheric aerosol composition is limited [33]. However, the impacts of BC on the atmospheric environment and on the health of human beings should not be ignored [34,35]. Research on BC aerosols began during the mid-1980s in China and is being actively pursued in cities such as Beijing and Shanghai [36,37]. Based on research conducted after 2000, BC emission in the northern cities is higher than that in the southern cities of China. Moreover, the emission in inland cities is higher than that in coastal cities and the concentration in winter is higher than that in other seasons [38].
Volatile organic compounds (VOCs), the significant precursor pollutants of ozone and PM2.5, can not only impair air quality, but also do harm to human health leading to such diseases as headaches, nausea, vomiting, weakness for short durations, memory loss and dysfunction of the liver, kidney, cerebrum, and nervous system. VOCs can undergo a series of chemical reactions with sulfur dioxide (SO2), nitrogen dioxide (NO2), and particulate matter (PM) in the atmosphere, generating photochemical smog and secondary aerosols. Most publications have demonstrated that the emission of VOCs from industries, particularly petrochemical industries, is the predominate source of VOCs [39,40,41]. To some extent, for chemical industrial parks, VOCs together with SO2 and NOx can be recognized to represent the overall emission level and energy consumption of industries. Therefore, it is possible to observe the correlation of BC and total VOCs or source-oriented VOCs species to trace the potential contribution of local industrial sources to haze pollution.
The Hangzhou Bay area is surrounded by seven cities—Shanghai, Hangzhou, Ningbo, Jiaxing, Huzhou, Shaoxing, and Zhoushan. There are several industrial parks around the Hangzhou Bay, including the Shanghai Hangzhou Bay Industrial Development Park, Shanghai Chemical Industrial Park in Fengxian, Hangzhou Economic and Technological Development Park, and Hangzhou Bay Shangyu Industrial Park. So many concentrated industrial parks have led to high consumption of fossil fuels and solvent in this region, leading to heavy environmental pollution. VOCs, SOx, NOx, and PM including BC are common air pollutants. However, only a few studies have focused on BC pollution around chemical industrial parks [42].
In this study, we conducted observations during autumn and winter to determine the characteristics of BC emissions and the relation between BC and other air pollutants in the Hangzhou Bay region. The sources of BC on hazy and clean days were compared to facilitate the formulation of improved air pollution control measures. The main objective of the study was to analyze the correlation between BC and various pollutants, such as SO2, NO2, PM2.5, O3, CH4, non-methane total hydrocarbons (NMHC), and VOCs-36, as well as the meteorological parameters, to study the characteristics of BC pollution. Through investigating relationships between BC and VOCs (total VOCs and VOCs species), besides the relationships between BC and other air pollutants, the impacts of surrounding chemical industrial parks on the characteristics of BC pollution in the northern region of the Hangzhou Bay were discussed.

2. Methodology

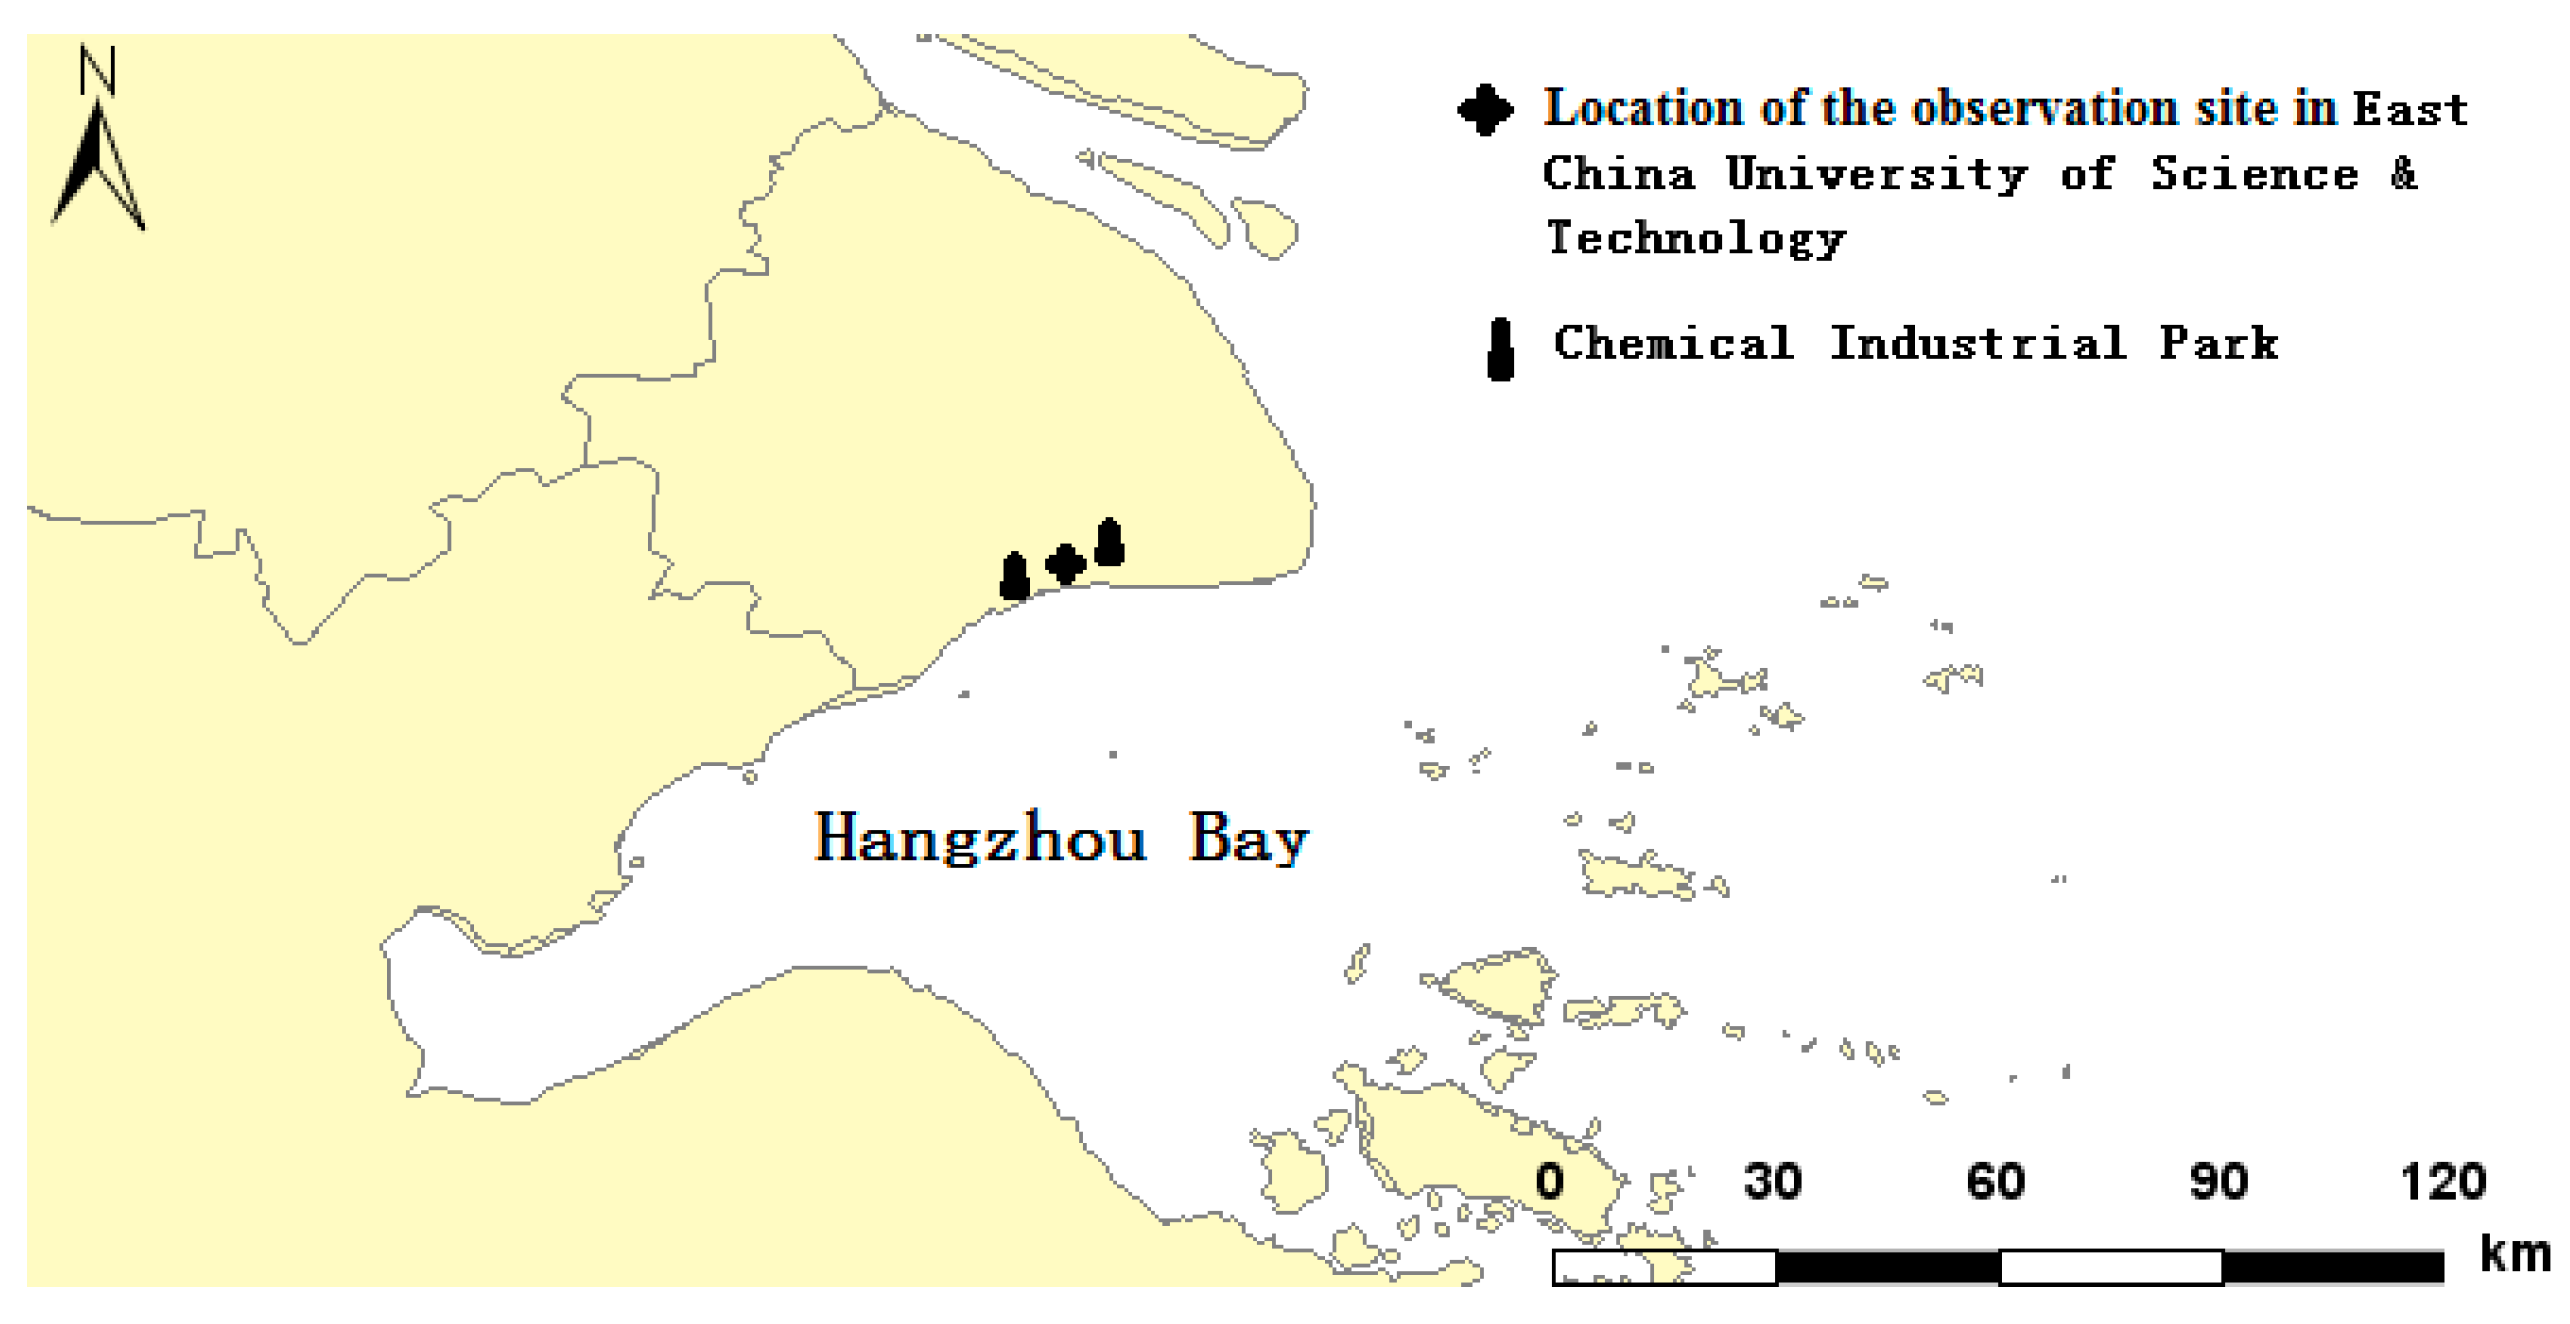
2.1. Observation Sites

The main field measurement site is established at the air quality monitoring station (30.83° N, 121.50° E) in the Fengxian Campus of East China University of Science and Technology (ECUST), Shanghai. As shown in Figure 1, the sampling site is located in the northern region of the Hangzhou Bay in Shanghai. There is a chemical industrial park in the northeast area and another larger chemical industrial park in the southwest of the campus. There are more than 50 companies in the chemical industrial park, including petrochemical industry, synthetic resin industry, inorganic chemical industry, sulfuric acid industry, nitric acid industry, rubber industry, etc. The observation campaign of BC was conducted throughout the whole year of 2018.

2.2. Sampling Methods

In this study, AE31 aethalometer (Magee Scientific Company, California, USA) was used for online monitoring of the mass concentration of BC aerosols. The instrument was maintained regularly for quality control following the user’s guideline [43,44,45]. Some abnormal data such as negative values were eliminated according to previous study [34]. In total, 6877 sets of data were obtained in 2018, and the effective data production was 78.5%. For December 2018, there were 727 sets of data, and the effective data production reached 97.7%. The concentrations of VOCs at the fence-line of industrial parks were measured online via gas chromatography (GC866, Chromatotec, France), and a total of 36 VOCs were identified. The sum of the mass concentrations of the 36 VOCs species is denoted herein as VOCs-36. The concentrations of methane(CH4), non-methane hydrocarbons (NMHC), NH3, NOx, NO2, NO, and other meteorological parameters were measured using a methane and non-methane hydrocarbons analyzer (55i, Thermo), NH3 analyzer (17i, Thermo), NOx analyzer (EC9841, Ecotech), and seven-in-one meteorological instrument (Wxpak, BELFORT), respectively. The concentrations of PM2.5, O3, SO2, and NO2, along with physical properties such as wind direction, wind speed, temperature, humidity, and pressure were simultaneously measured online in December 2018. The 36 VOCs were quantitatively included: Ethane, Propane, n-Butane, Iso-butane, n-Pentane, Isopentane, n-Hexane, n-Heptane, Octane, 2,2,4-Trimethylpentane, 2,3,4-Trimethylpentane, Ethylene, Acetylene, Propylene, cis-2-Butene, trans-2-Butene, 1,3-Butadiene, Isoprene, Benzene, Toluene, Ethylbenzene, o-Xylene, m-Xylene + p-Xylene, Styrene, 1,2,3-Trimethylbenzene, 1,2,4-Trimethylbenzene, 1,3,5-Trimethylbenzene, Cumene, Propylbenzene, Dichloromethane, 1,2-Dichloroethane, Trichloroethylene, Tetrachloroethylene, Chlorobenzene, 1,2,4-Trichlorobenzene and 2-Methylpentane + 2,3-Dimethylbutane.

2.3. Quality Assurance

The AE31 aethalometer can analyze ‘black carbon’ at seven wavelengths ranging from 370 nm to 950 nm. The accuracy of the instrument is 5%, and the sensitivity is <0.1 g/m3. The instrument maintenance and flow calibration were conducted weekly during the period of observation.
VOC concentration was monitored with flame ionization detection system (GC-FID) at a time resolution of 60 min. The sampling rate of the ambient air was 50 mL/min, and the sampling time was 20 min. Herein the concentration of VOC is hourly-average concentration which is the average of the values of all three samples within one hour. The multi-point calibration was carried out before the observation experiment. The instrument maintenance and flow calibration were conducted weekly during the period of observation.
The minimum detection limit of the T100 SO2 analyzer is 0.4 ppb, and its accuracy is 0.5%. The multi-point calibration was carried out before the observation experiment. The instrument maintenance and flow calibration were conducted weekly during the period of observation.
The EC9841 type nitrogen oxide analyzer has a detection limit of 0.4 ppb and an accuracy of 1%. Multi-point calibration was carried out before the observation experiment. The instrument maintenance and flow calibration were conducted weekly during the period of observation.

2.4. Data Analysis

Pearson and Spearman correlation coefficients were used for data analysis [45,46,47]. Correlation analysis is a statistical analysis method used for determining the correlation between two or more random variables. In general, a p-value less than 0.05 is considered statistically significant, and the level of significance is much higher if the p-value is less than 0.01.
Heatmap was created in R platform using Ward’s method, and Euclidean distances were used for data clustering and visualization. Network analysis was performed in R using the vegan, igraph and Hmisc packages. A systematic qualitative analysis of the relationship between BC and other substances was conducted via cluster analysis with heatmap, Spearman analysis with network graphs, and Pearson analysis with graphs. Finally, the data were analyzed using the Pearson correlation coefficient.

3. Results and Discussions

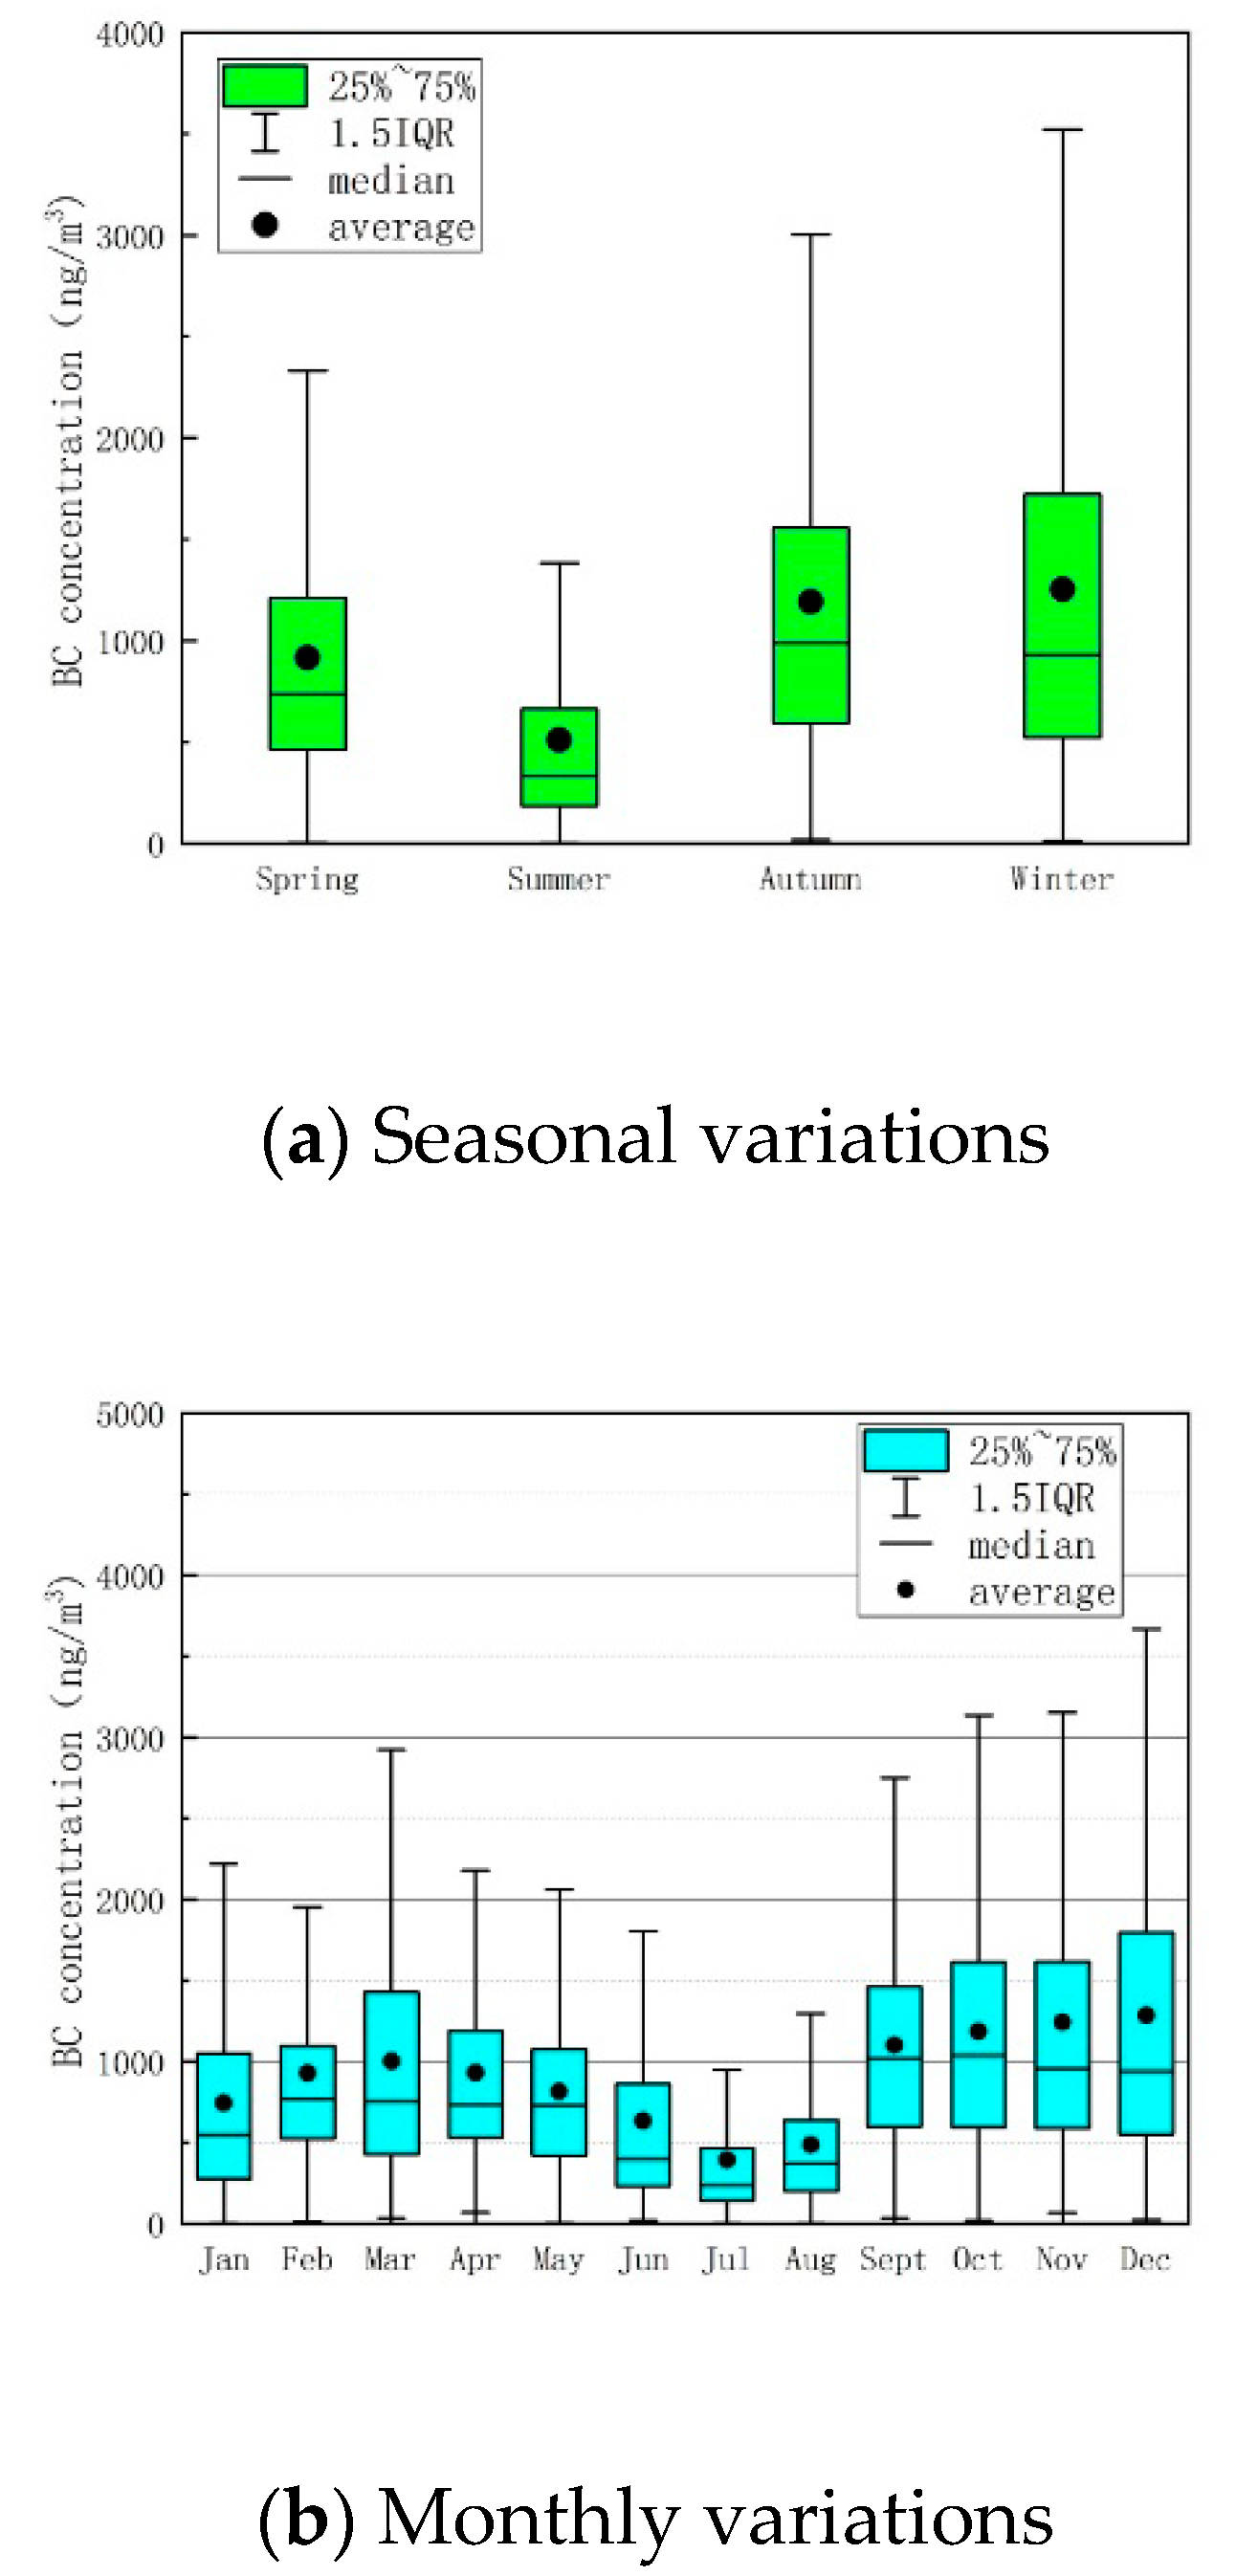
3.1. Seasonal Variation in BC

The four seasons in Shanghai are generally defined as follows: spring is from March to May, summer is from June to August, autumn is from September to November, and winter is from December to February. Figure 2a presents the seasonal variation of BC in 2018. BC has higher concentration in autumn and winter, particularly in December. The average concentration of BC in spring was 916 ng/m3. In summer the average concentration of BC was the lowest in the year, which was 512 ng/m3. The average concentration of BC was 1192 ng/m3 in autumn. The average concentration of BC in winter was 1253 ng/m3, which is 1.37 times as much as that in spring, 2.45 times as much as that in summer, and 1.05 times as much as that in autumn.
The monthly average concentration of BC was around at 1000 ng/m3. In July, the concentration of BC exhibited the lowest value of 393.19 ng/m3, whereas in December, it reached the highest value of 1285.83 ng/m3 (Figure 2b).
In order to study the influence of weather conditions upon BC concentration, rose maps combining the wind direction and wind speed were used, shown in Figure 3. The northern region of Hangzhou Bay is characterized by monsoon climate, with southeast winds prevailing during spring and summer and northwest winds prevailing during autumn and winter.
In the winter, the sources, including local sources and regional sources, from north or northwest dominated the higher BC concentration. However, the source structure might be different in different month. In December, the highest BC concentration was 6168 ng/m3 under the wind direction of NW followed by SW and W. The sources from the NW represent the regional transportation from northwestern China, while the sources from the W or SW represent the local large-volume organic manufacturers combined with petrochemical industries or ship transportation far from the observation site. In January, the most heavily polluted areas recorded more than 3000 ng/m3 of BC when the wind was from the SE with the wind speed of 2 m/s or smaller, rather than NW, so the higher concentration of BC might be from the local emissions, i.e., the heavy diesel traffic in a nearby freeway connecting to an industrial park is a potentially important source of BC. While in February, the concentration of BC was relatively lower because of the Chinese New Year holiday, when most medium or smaller companies temporarily closed for several weeks, which brings about less volume of heavy-duty trucks and light-duty cars. However, the nearby sources from the SW should not be neglected because their continuous production lines might result in the slightly higher BC in that direction.
In spring, March is the typical transition month from winter to spring with the changeable weather conditions. In addition, agricultural activity such as plowing usually begins from March, and as such some biomass burning in the northern area might bring about higher BC concentrations. In the northeast part of the study area, the BC concentration was also influenced by the chemical industrial emission and increase of regional transport emission. Even if BC concentration reduced gradually since April, several higher BC values were still found when the air came from the SW, where there is the large-volume organic industrial park.
In the summer, BC concentration was the lowest in the most time, similar to the PM2.5, SO2 and NO2. It is benefited from the dilution of air mass from the E or SE, while the BC concentration is slightly higher when it is impacted by local sources in the west.
During autumn, the monsoon wind direction changed from southeast to northwest. The BC concentration was higher when the wind came from the northwest followed by the wind from the SW. It is likely that BC was affected by the adjacent southwest chemical industrial park and regional transportation from the NW.

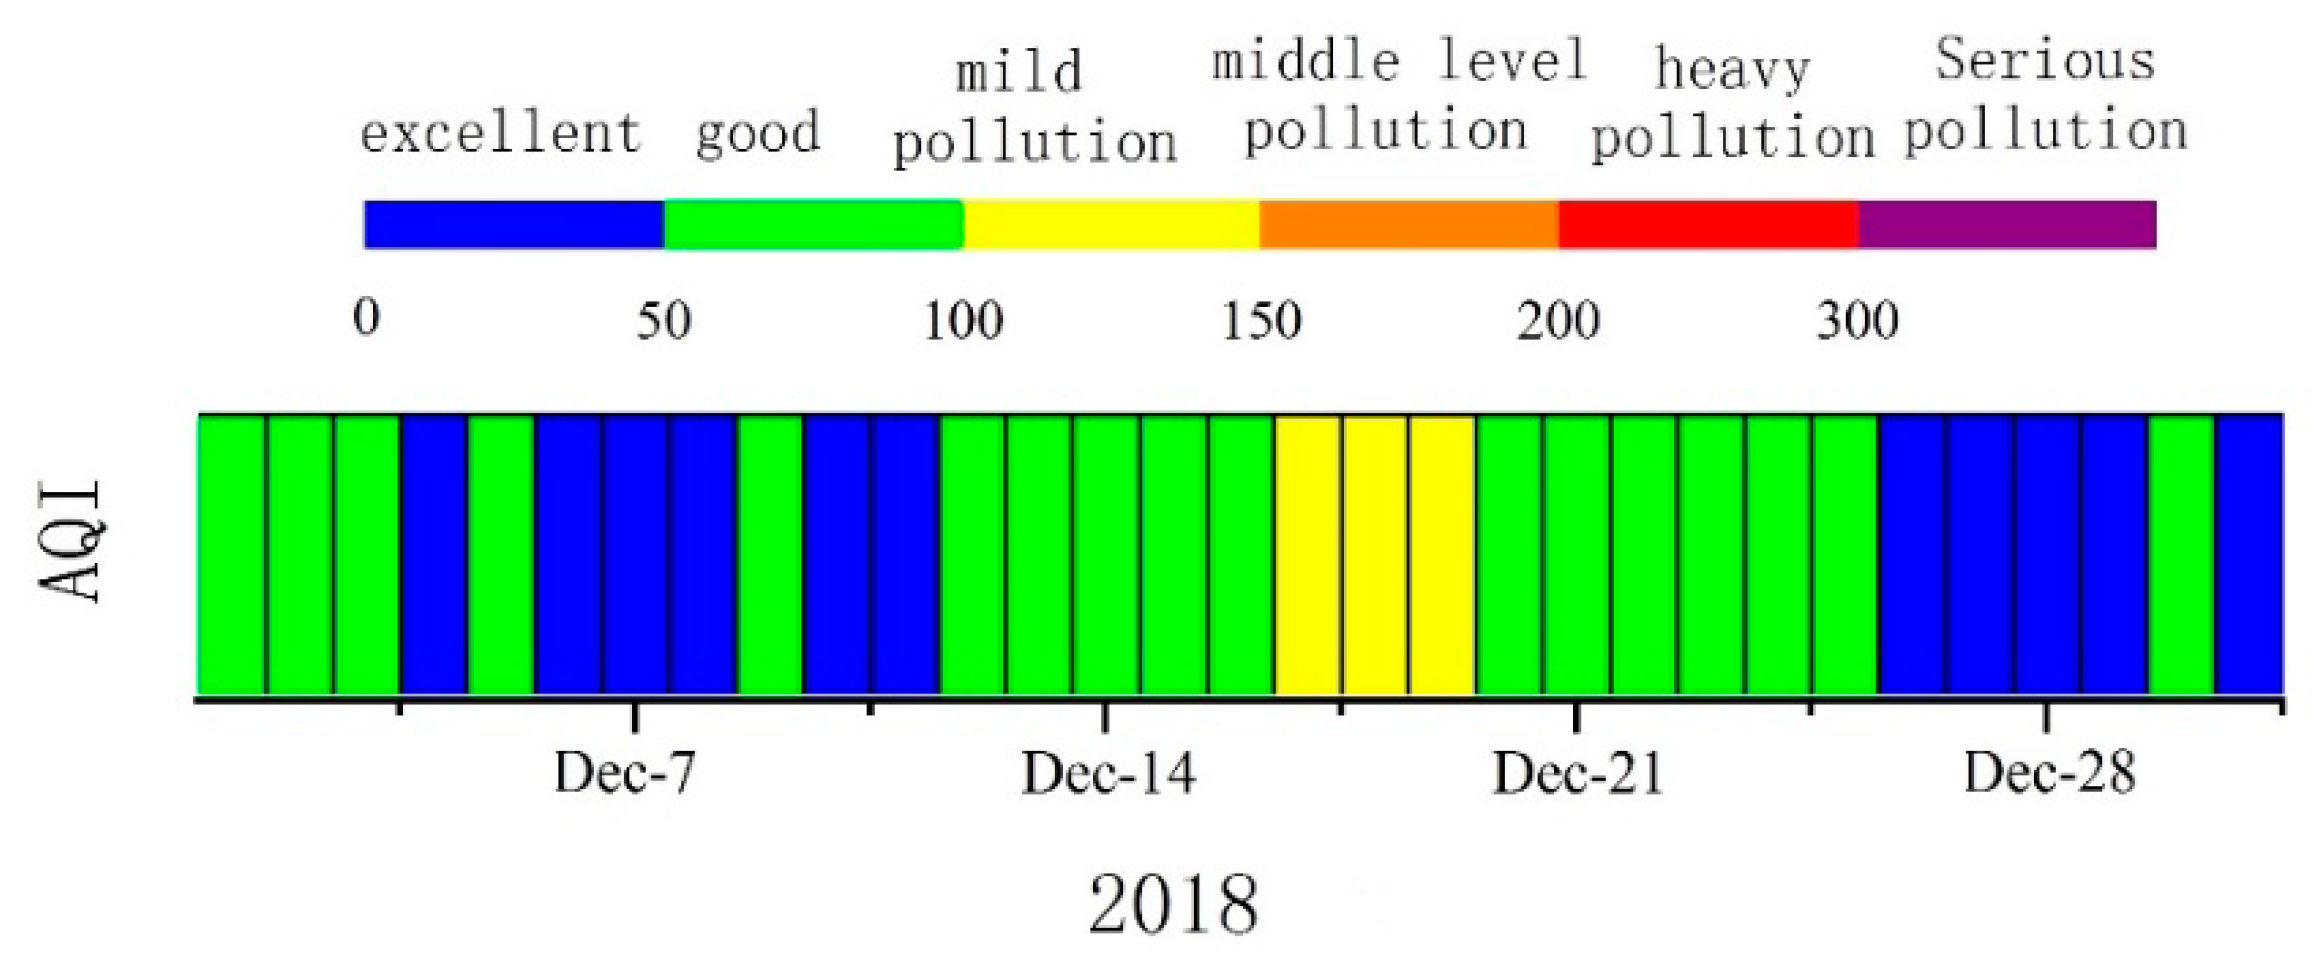
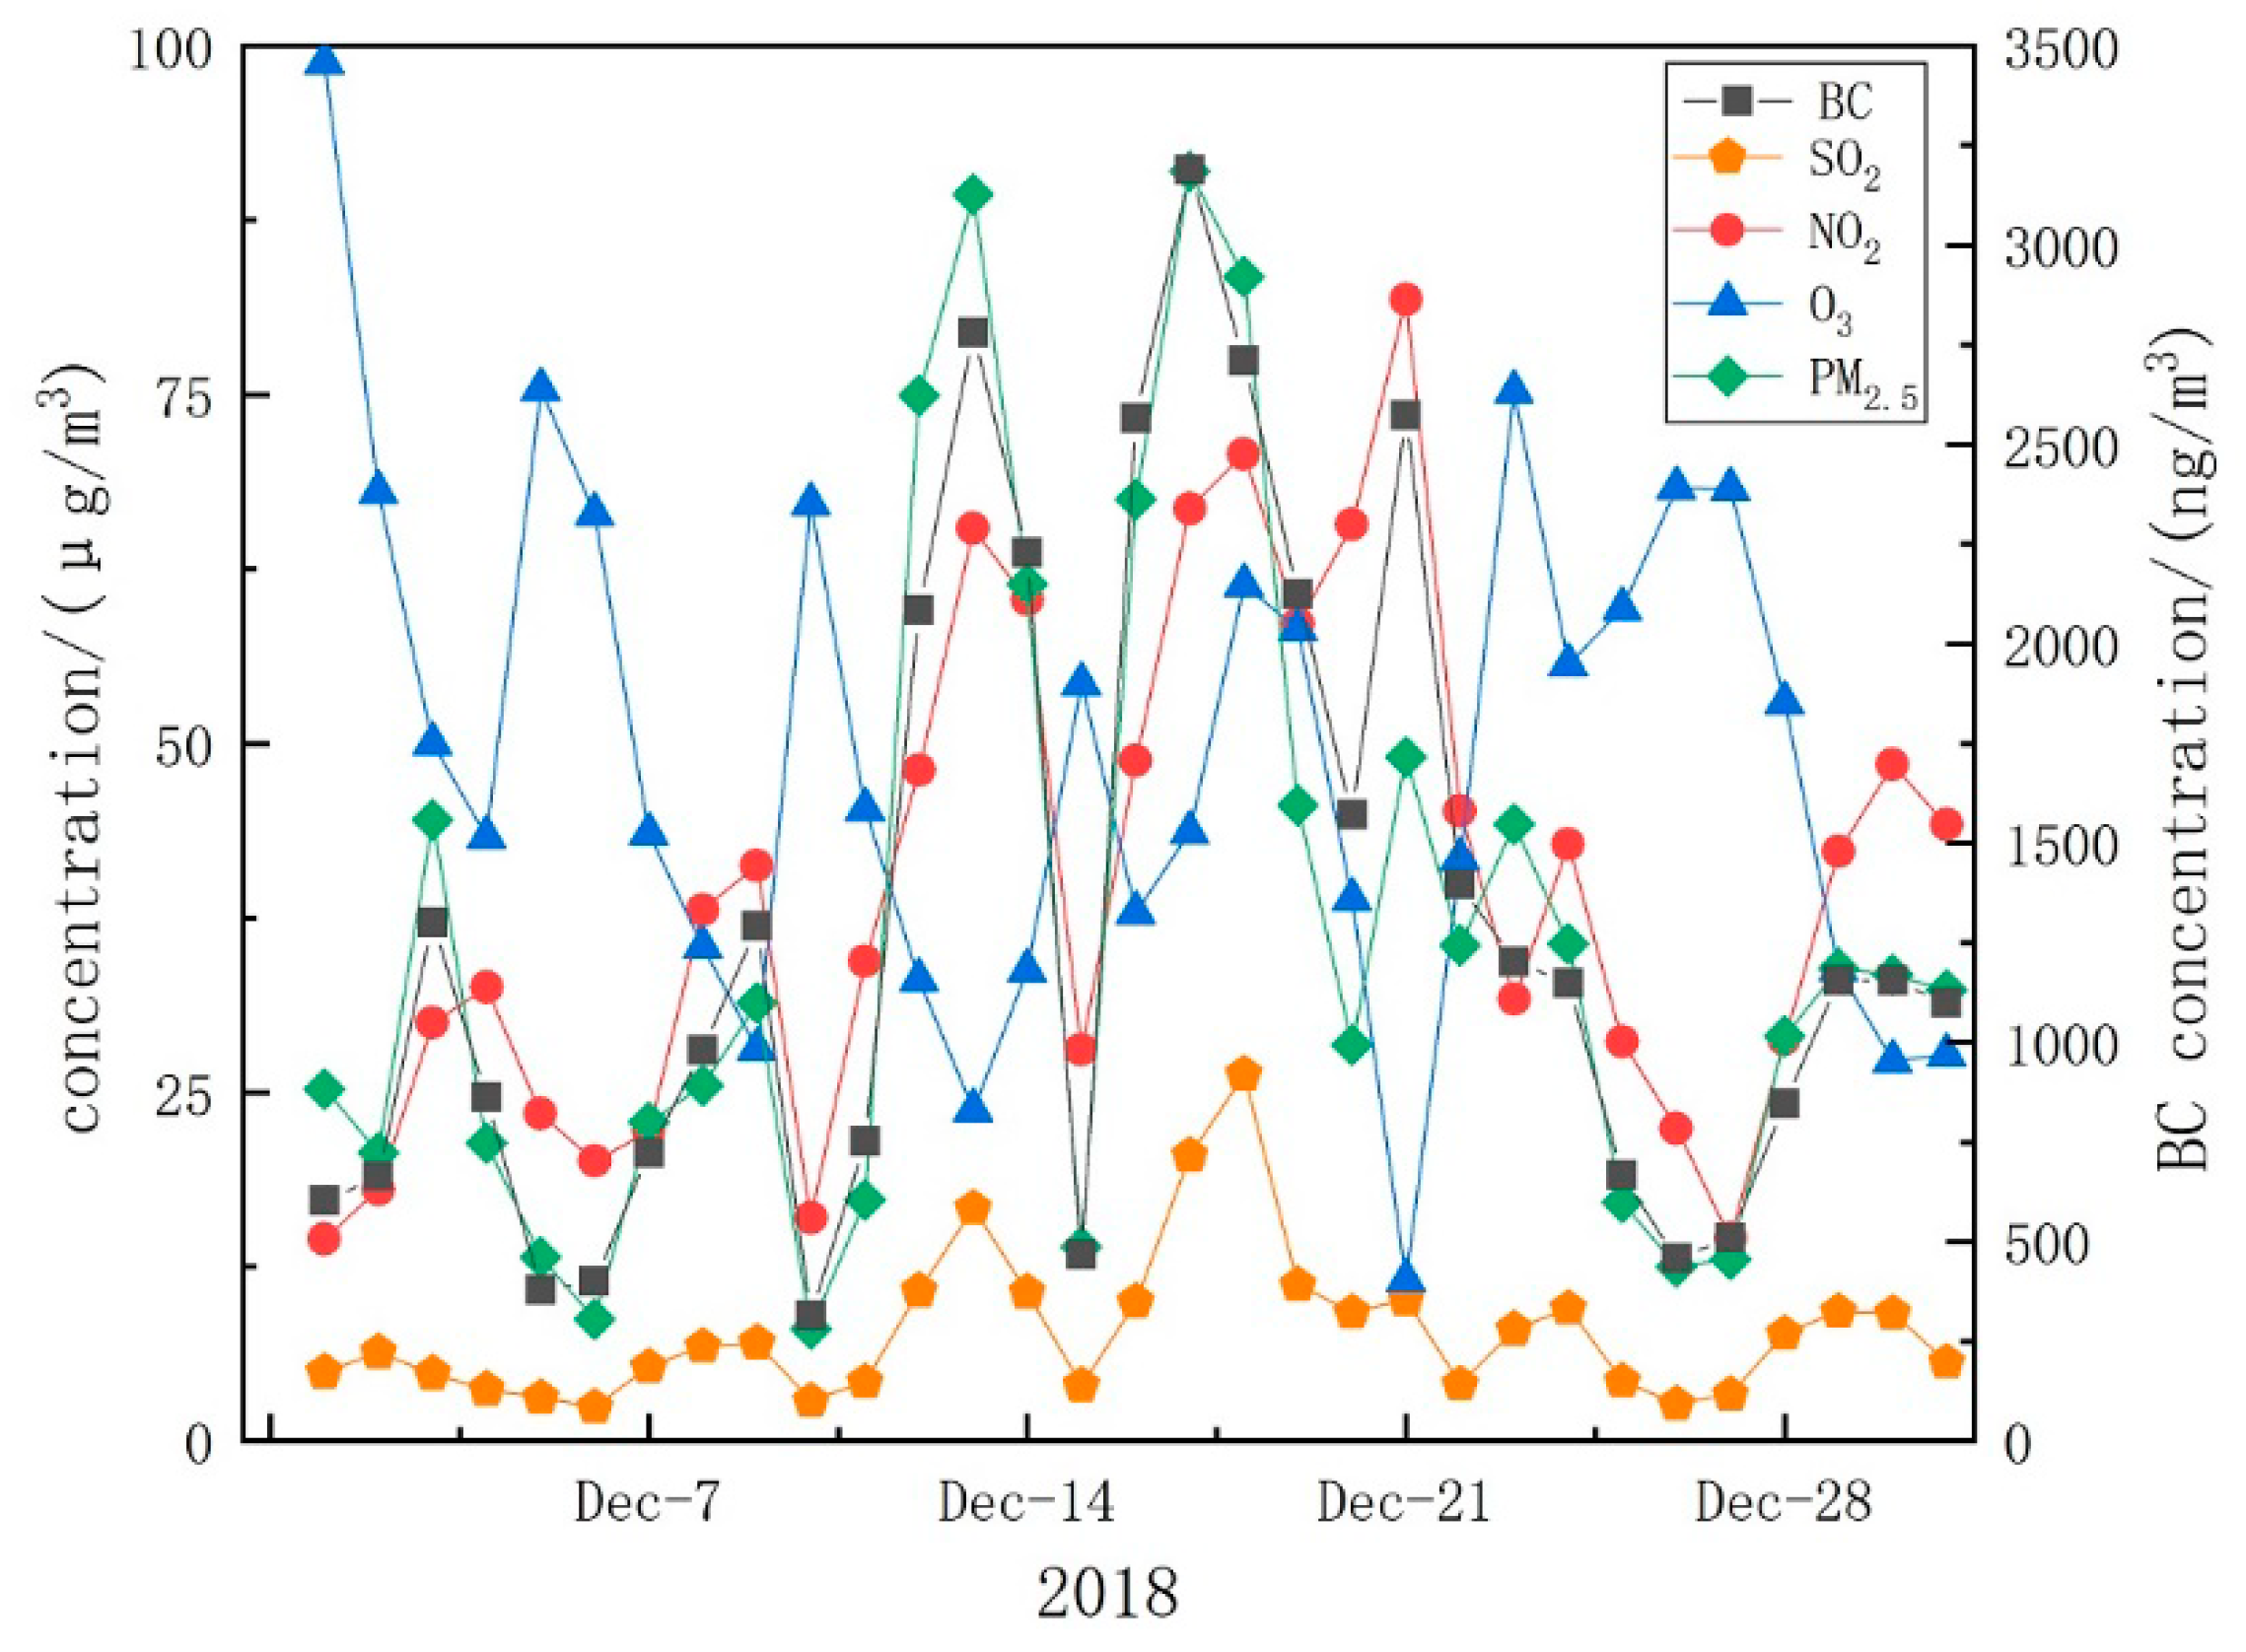
3.2. Correlations with Other Air Pollutants

In order to reveal the source connection of BC with other air pollutants, the cluster analysis of the annual BC concentration, meteorological parameters, conventional pollutants, and VOCs-36 are shown in Figure 4. The clustering heatmap showed that the most severe BC pollution occurred in October, November, and December in 2018. Specifically, for December, the color of the square lattice, which represents the concentration of BC, is the darkest, indicating the worst pollution. In general, BC had no correlation with the concentrations of 1,3-Butadiene, cis-2-Butene, Octane, Isoprene, Alkenes and alkynes, Ethylene, Propylene, Trichloroethylene, trans-2-Butene, or 2,3,4-Ttrimethylpentane. However, the cluster analysis graph showed that the annual BC pollution is highly correlated with the concentration of n-Butane and VOCs-36, sharing the same group as 1,2-Dichloroethane, NOx, NO2, and Benzene.
1,3-Butadiene, alkenes and ethylene are typical characteristics air pollutants associated with neighbor petrochemical industrial park. The weak correlation implies that process vent might not be the potential source. However, the strong correlation with n-Butane and VOCs-36 means that there must be some emission facilities that contribute to both air pollutants and BC. Caseiro et al. quantified the black emissions due to gas flaring and estimated yearly emissions of 0.35 Gg of BC in 2017 [48]. Cho et al. found that gas flaring during oil extraction over the Arctic region is the primary source of warming-inducing aerosols (e.g., black carbon (BC)) with a strong potential to affect regional climate change [49]. It can be suspected that gas flares might be a potential contributor to BC near the observation site. Conrad and Johnson conducted filed measurement of black carbon yield from gas flaring and found the BC emission rates spanned more than four orders of magnitude [50]. Therefore, the relationship between these substances and BC should be analyzed further.
A Spearman analysis was presented in Figure 5. To draw the network diagram, the following parameters were chosen: Spearman’s rank > 0.7 and p-value < 0.01. Note that BC is not displayed in the diagram for Spearman’s rank > 0.75 and p-value < 0.01. A close connection between BC and Benzene, Propane and n-Butane was observed. Benzene has a strong relationship with Propane, and Propane has a much stronger relationship with VOCs-36. Thus, there is a much stronger relationship between BC and VOCs-36. Based on the results, the measured data for December were selected for further analysis. Previous studies of our group measured real emission of gas flares of petrochemical companies and found benzene and some alkanes are common VOC species. This implies that more research should be conducted for source apportionment of BC and other VOCs from gas flaring.

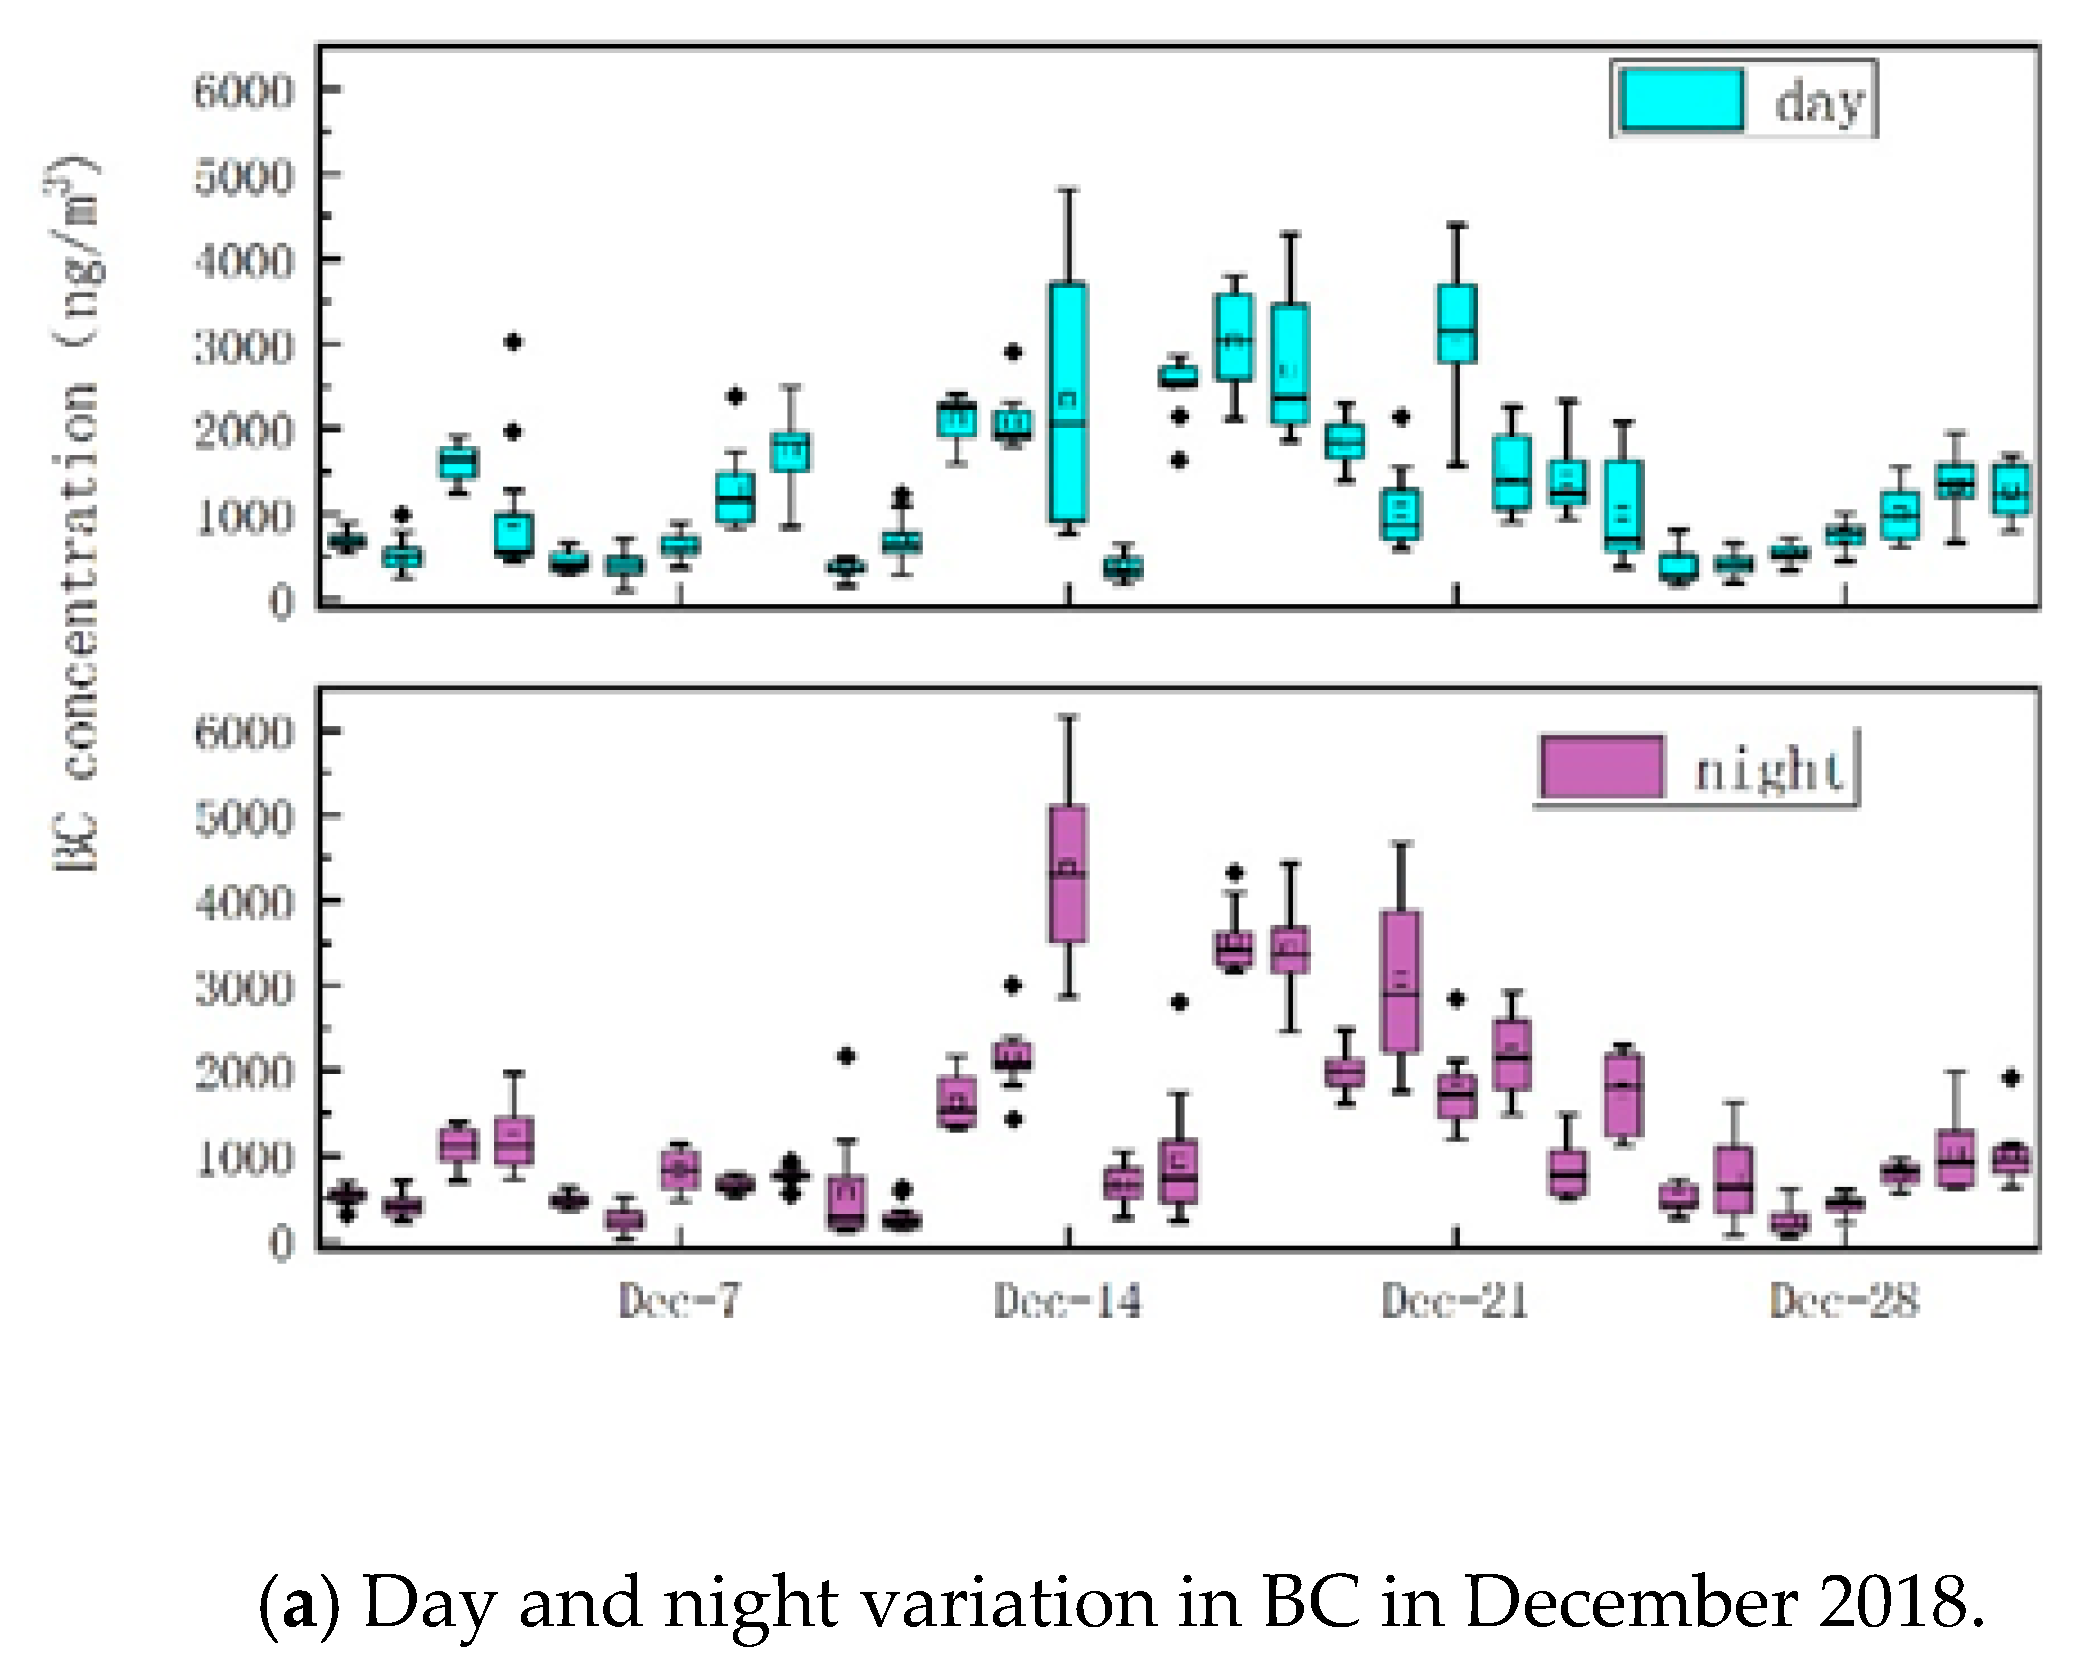
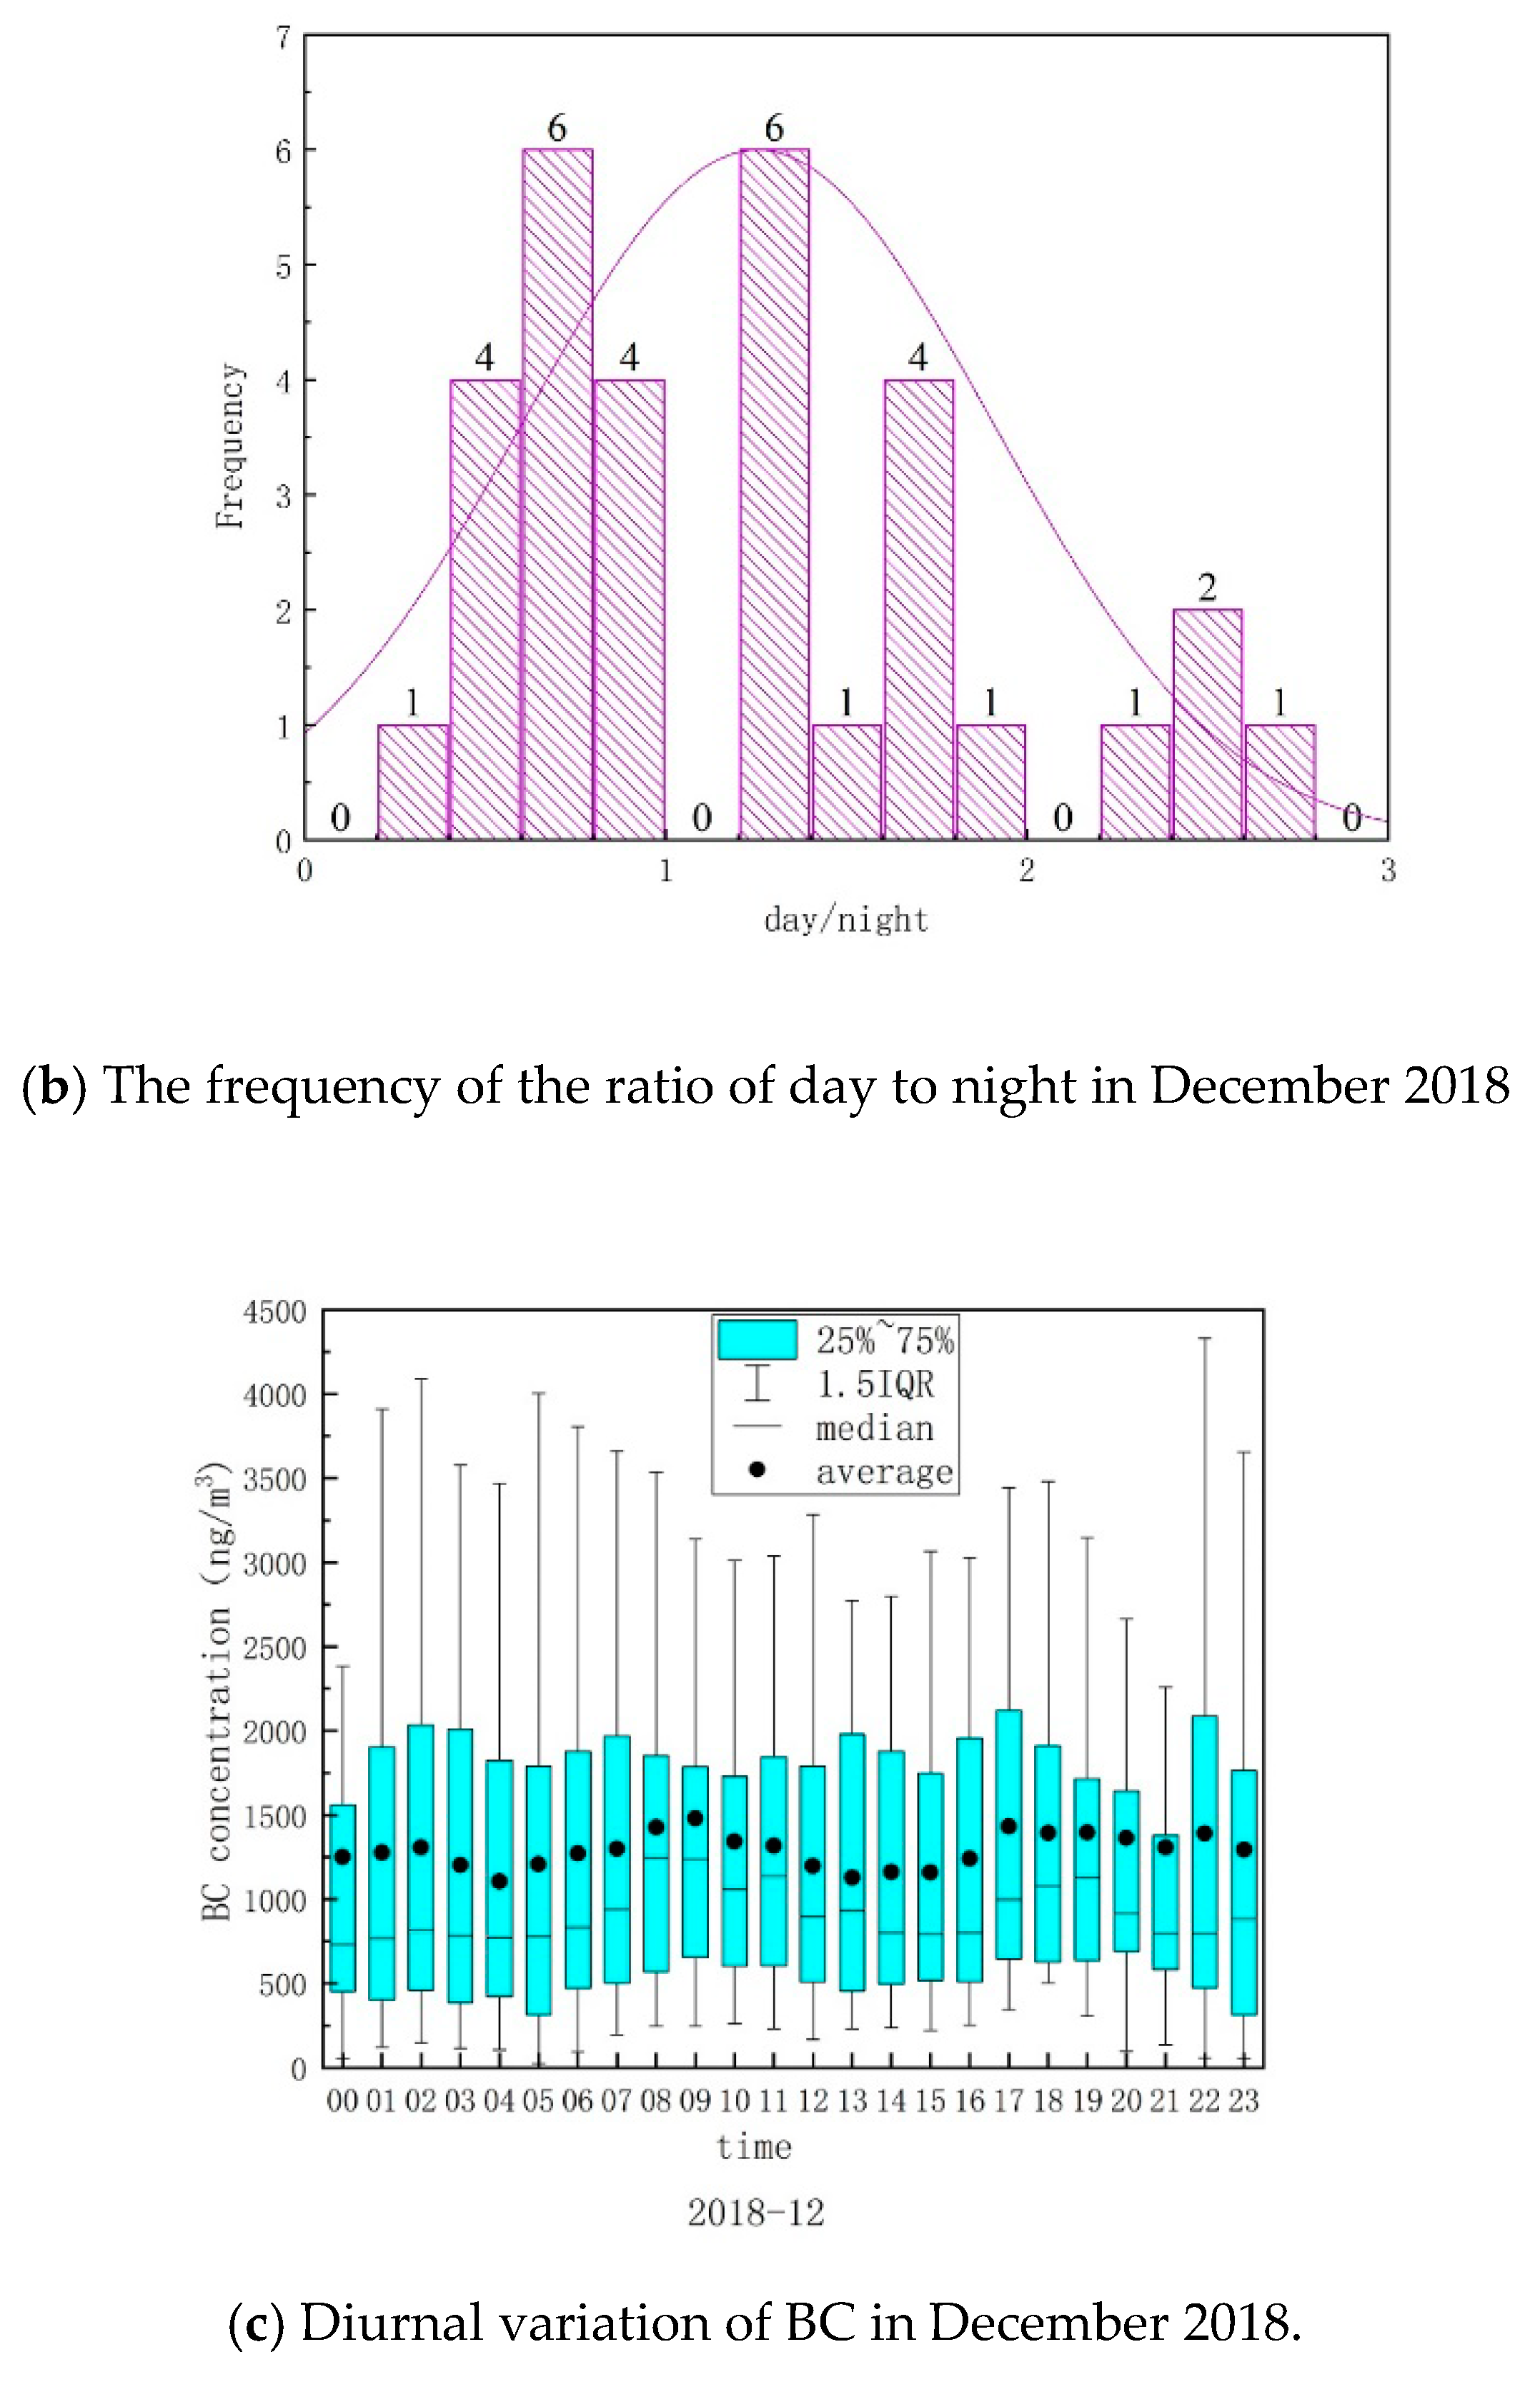
3.3. Diurnal Variation in BC in December

The air quality index (AQI) represents the degree of cleanliness or contamination of ambient air. AQI is a new air quality assessment standard implemented by the Chinese government in March 2012. The measurement of air quality requires monitoring of the following six pollutants: PM2.5, PM10, O3, SO2, NO2, and CO. The daily values of PM2.5, PM10, O3, SO2, NO2, and CO are normally published on the website of Shanghai Municipal Bureau of Ecology and Environment [51]. The AQI in December 2018 is shown in Figure 6. In December, AQI was “good” in most days. However, BC had the highest concentration and reached its peak value of more than 3000 ng/m3 during the 10 days in the middle of December 2018. BC remained between 500 and 1500 ng/m3 during the first and the last 10 days of the month (shown in Figure 7). The same trend was observed for air quality as well. The concentrations of PM2.5 and NO2 also reached their peaks during the 10 days in the middle of December 2018. The concentrations of these two pollutants exhibited trends similar to that of BC in December 2018.
The diurnal variation of BC and the day/night ratio of BC in December of 2018 was shown in Figure 8. The highest concentration of BC was observed in the middle of December, and the concentrations during both day and night were much higher than those in other periods (Figure 8a). Herein, we define 6:00 to 18:00 as daytime and 18:00 to 6:00 as nighttime. It was found that there were 15 days less than 1, and 16 days left had a ratio larger than 1. However, there were only 4 days during which the ratio was between 0.8 and 1.2. There were 11 days which the ratio of day to night was less than 0.8, and the ratio was only 0.34 on 20 December. This means the emission of BC at night is much heavier than that in the daytime. This may be related to the transportation of the surrounding chemical industrial parks in the night-time. There were 16 days which the ratio was greater than 1.2, and the ratio was greater than 2 on 9, 11, 16 and 27 December. That means traffic sources contributed a lot to emission of BC in the daytime (Figure 8b).
The diurnal variation in BC was shown in Figure 8c. The concentration of BC exhibited three peaks every day, at 2:00, 9:00, and 17:00. Two of these peaks were consistent with the morning and evening rush hours of commuting. This may be due to the highway transport and ship emissions associated with adjacent southwest chemical industrial park. There are two big docks around Shanghai chemical industry park. One dock was put into operation in 2004, whose cargo handling capacity was 5.48 million tons in 2017. The other dock was put into operation in 2010, whose designed annual cargo handling capacity is nearly 5 million tons. Those two docks were known as the “blood vessels” of the chemical industrial park. Influenced by the local hydrological conditions, the peak times of ships entering the port are 17:00 and 22:00, while the peak times of ships leaving the port are 0:00, 11:00, and 17:00. There are many ships entering and leaving the ports at night [52,53,54]. Diesel-powered cargo ships contributed to the concentration of black carbon (BC) at the observation site.

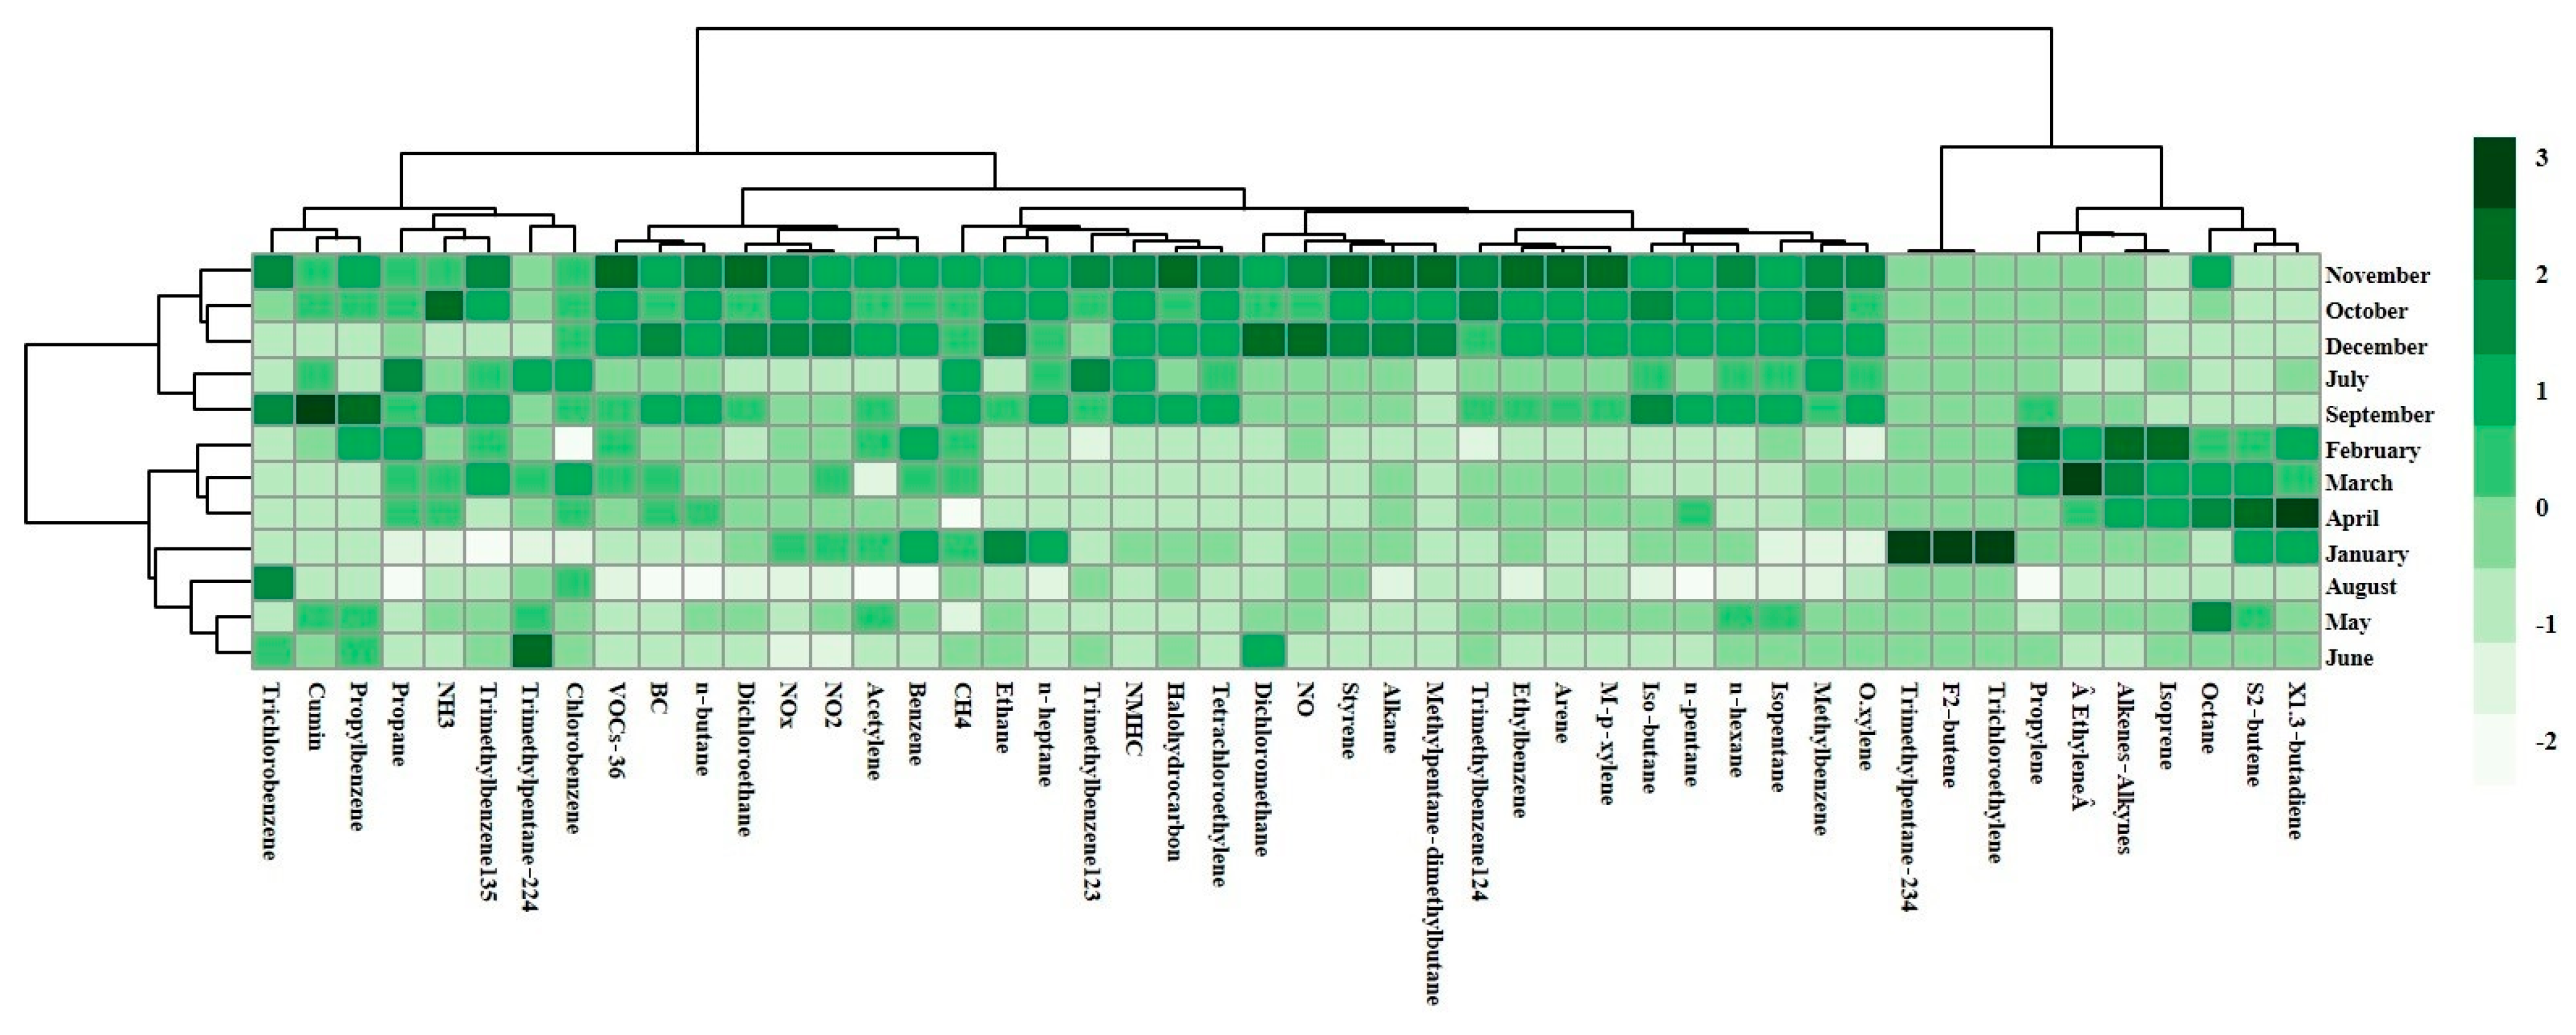
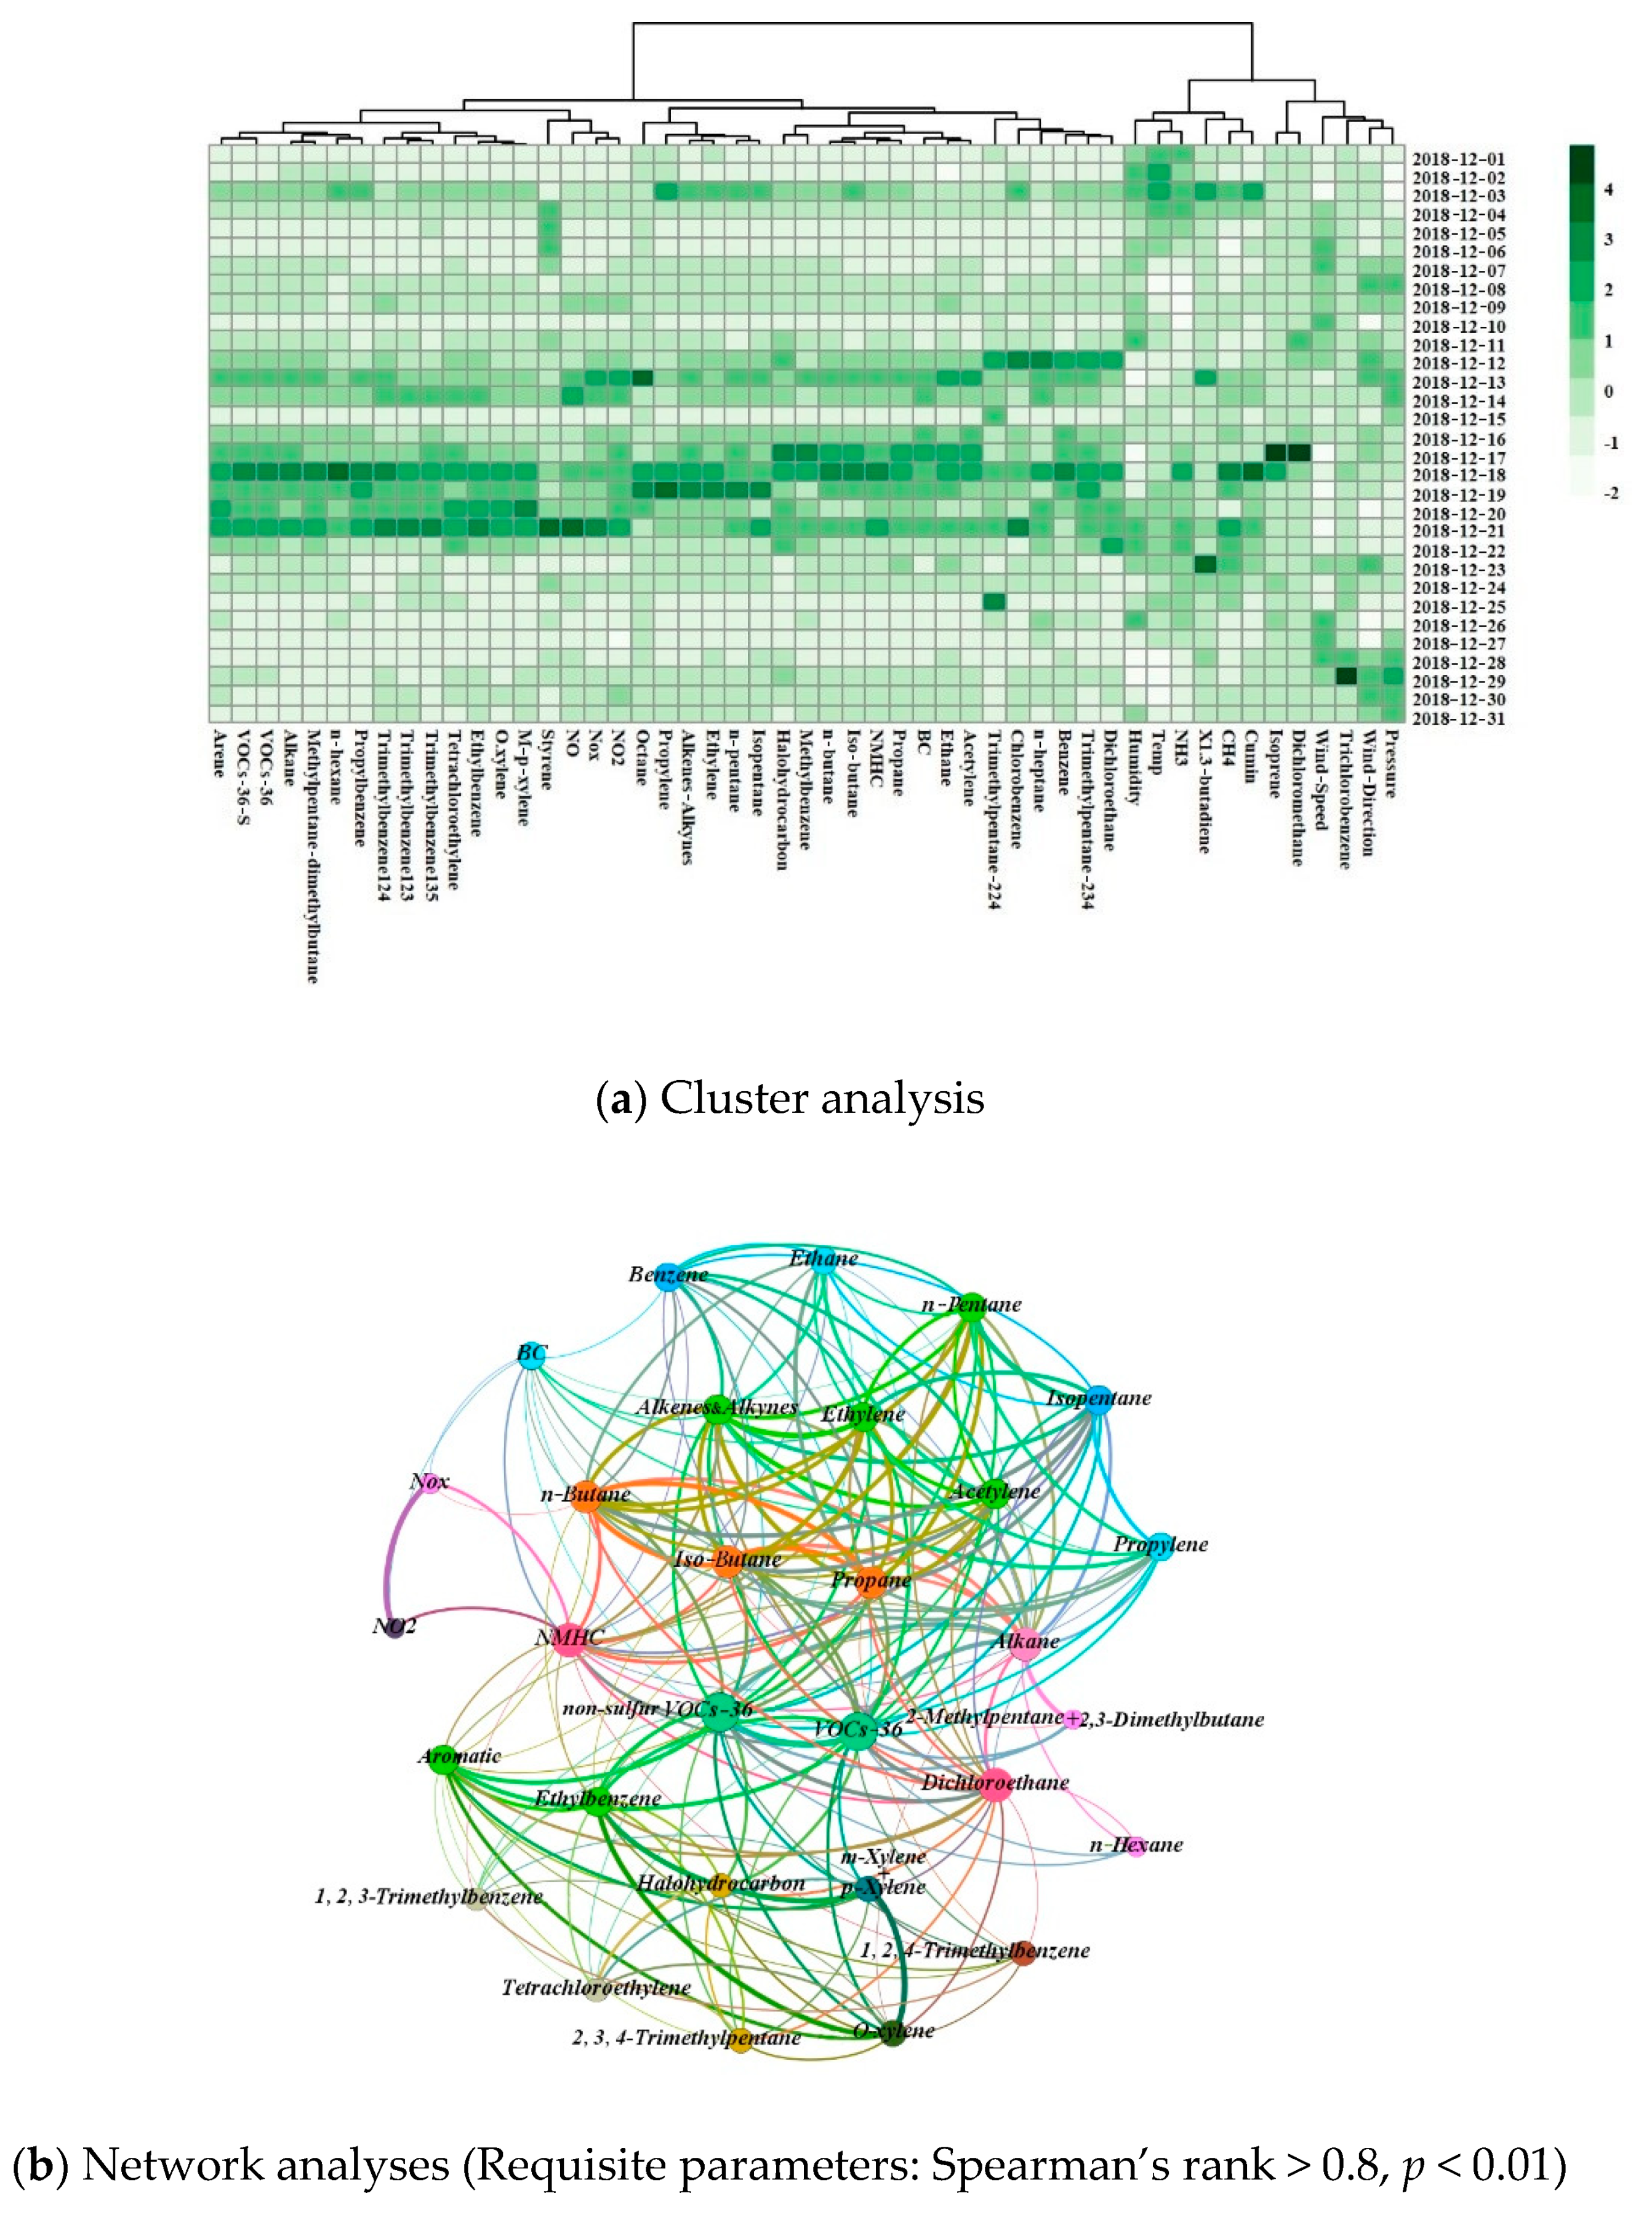
3.4. Correlation Analysis of BC and VOCs in December

As mentioned before, the concentration of BC was found to strongly correlate with VOCs-36. To perform further analyses, a clustering heatmap was conducted based on the data of various pollutants in December 2018 as shown in Figure 9a. The clustering heatmap showed that BC can be grouped with acetylene, ethane, propane, non-methane total hydrocarbons, iso-butane, n-butane, toluene, and halohydrocarbon. Different from the weak correlations based on the annual data, BC exhibited a stronger relationship with acetylene and ethane and had the darkest color on the cluster analysis graph for December 17th. All the pollutants had darker colors for the middle of December.
For a qualitative discussion of the relationship between BC and other pollutants, we conducted Spearman analysis on the data obtained during December 2018. We selected Spearman rank > 0.8 and p < 0.01 as the conditions to plot the network diagram, as shown in Figure 9b. A connection was found between BC and Benzene, non-methane total hydrocarbons (NMHC), Alkanes, Alkenes and alkynes, n-Butane, Toluene, n-Heptane, nitrogen dioxide (NO2), and nitrogen oxides (NOx). The characteristics of BC in the northern region of the Hangzhou Bay in December are highlighted in Figure 9b.
The quantitative analysis of the relationship between BC and other pollutants was performed as follows:
Pearson correlation analysis was used to calculate and analyze the specific impact factors. By calculating the significance level, it was found that the p-value is more than 0.05 for air pressure, cis-2-Butene, trans-2-Butene, Trichloroethylene, and 1,2,4-Trichlorobenzene. 1,3-Butadiene had a p-value of 0.03942, and the remaining 47 factors had p-values < 0.01. Therefore, the variation of BC must have more correlation with other pollutants, including Ethane, Propane, n-Butane, Iso-butane, n-Pentane, Isopentane, n-Hexane, n-Heptane, Octane, 2,2,4-Trimethylpentane, 2,3,4-Trimethylpentane, Ethylene, Acetylene, Propylene, 1,3-Butadiene, Isoprene, Benzene, Toluene, Ethylbenzene, o-Xylene, m-Xylene + p-Xylene, Styrene, 1,2,3-Trimethylbenzene, 1,2,4-Trimethylbenzene, 1,3,5-Trimethylbenzene, Cumene, Propylbenzene, Dichloromethane, 1,2-Dichloroethane, Tetrachloroethylene, Chlorobenzene, 1,2,4-Trichlorobenzene, and 2-Methylpentane + 2,3-Dimethylbutane.
Atmospheric aerosol pollution is a complex phenomenon. For example, there is a weak negative correlation between BC and O3, the correlation coefficient of which is −0.545, and a strong positive correlation between BC and PM2.5, SO2, and NO2, the correlation coefficients of which are 0.813, 0.738 and 0.890 respectively. The strong correlations of BC to PM2.5, SO2, and NO2, implied that combustion is still an important source of BC. It is found that BC pollution has the largest correlation coefficient with wind speed; the weak correlations with other meteorological parameters.
BC has a strong positive correlation with non-methane total hydrocarbons with a correlation coefficient as high as 0.819. The correlation between BC and methane is significantly lower, with a correlation coefficient of 0.266. BC also has a higher correlation with nitrogen oxides, nitrogen dioxide, and nitric oxide. There is a strong positive correlation between nitrogen oxides and nitrogen dioxide, the correlation coefficients of which are 0.790 and 0.808, respectively. Nitrogen oxide is slightly positively correlated with BC, with a correlation coefficient of 0.634. The emission of black carbon from flaring as a part of industrial sources may be a non-negligible source of pollution. There are 13 gas flares near the observation site. According to previous research [55], both ground gas flares and overhead gas flares have insufficient combustion. The emission of black carbon in North Region of Hangzhou Bay is related to the surrounding chemical industry parks.
The correlations between BC and Alkanes, Alkenes and alkynes, Aromatic, and non-sulfur VOCs-36 are moderately positive. Moreover, the correlation between BC and Aromatic during the morning rush hour is 33% greater than that during the evening rush hour. This may be due to the influence of ships entering and leaving ports and diesel vehicle transportation in the southwest industrial park at night. According to the database (speciate) of VOC substance content among different industries published on the website of the United States Environmental Protection Agency (EPA) [56] and the VOC source spectrum analysis of the chemical industry park [55], the diesel vehicle emissions may contribute to some aromatic hydrocarbon compounds. Because of the emissions of ships and other diesel vehicle transportation at night, BC became heavier in the morning rush hours. It may also be affected by the emission of pollutants at night in the western chemical industry park, which makes the correlation between black carbon (BC) and aromatic hydrocarbons more significant in the morning rush hour. On the other hand, black carbon (BC) has a stronger correlation with alkanes and alkenes in the evening rush hour. The correlation coefficient is 0.863, which is 39% higher than that during the morning rush hour.
In December, which is the month with the heaviest pollution, BC pollution is not only strongly related to NMHC, Alkanes, and nitrogen oxides (NOx) but also to VOCs-36 compounds. Table 1 showed the correlation coefficient between BC concentration and various compounds. Within a significance level of p < 0.01, the changes in the concentration of BC throughout the day are similar to those of Ethane, Propane, n-Butane, Iso-butane, n-Pentane, Isopentane, n-Hexane, 2,3,4-Trimethylpentane, Ethylene, Acetylene, Propylene, Benzene, Toluene, Ethylbenzene, o-Xylene, m-Xylene + p-Xylene, 1,2,3-Trimethylbenzene, 1,2,4-Trimethylbenzene, 1,3,5-Trimethylbenzene, Propylbenzene, Tetrachloroethylene, and 2-Methylpentane + 2,3-Dimethylbutane. There is a strong positive correlation between BC and VOCs-36. The correlation coefficients between BC and Ethane, Propane, n-Butane, n-Pentane, Acetylene, 1,2,3-Trimethylbenzene, 1,2,4-Trimethylbenzene, and Propybenzene are all higher than 0.7. In particular, the correlation coefficients between BC and Propane and Acetylene are higher than 0.8. According to the database (speciates) of VOC substance content among different industries [56] the VOC source spectrum analysis of the chemical industry park was finished [55]. These strong correlations indicated that diesel vehicles might be the main source of BC pollution. This means the traffic source contributes significantly to BC.

4. Conclusions

In this study, we focused on the relationship between BC and other major pollutants and meteorological parameters to conduct apportionment of BC. We found that the annual pollution of BC mainly occurs during autumn and winter, particularly in December.
The BC concentration in the northern region of Hangzhou Bay is distinctly different from that in the urban areas, mainly because of the influence of the surrounding chemical industrial parks and relevant transport emissions, including ship emissions and truck emissions. In December, the air mass from northwest and southwest regions might be associated with higher concentrations of BC. BC is affected not only by regional transport but also by the activities of the adjacent southwest chemical industrial park. The daily concentration of BC exhibits three peaks, at 2:00, 9:00, and 17:00. Two of these are consistent with the morning and evening rush hours of commuting. The correlation between BC and nitric oxides increases slightly during the morning rush hour, while the correlation of BC with nitrogen oxides and nitrogen dioxide is significantly increased during the evening rush hour. Those indicated that the emission of black carbon in North Region of Hangzhou Bay is related to the surrounding chemical industry park.
BC has a relatively strong correlation with normal pollutants, a weak negative correlation with O3 and a strong positive correlation with PM2.5, SO2, and NO2. It also exhibits a weak negative correlation with the wind speed. BC has a strong positive correlation with nitrogen oxides and nitrogen dioxide and a weak positive correlation with nitric oxide.
BC has a moderate to strong positive correlation with Alkanes, Alkenes and alkynes, Aromatic, and non-sulfur VOCs-36. The correlations during the morning rush hour and evening rush hour show certain differences. In the morning rush hour, BC exhibits a 33.3% greater correlation with Aromatic than during the evening rush hour, while black carbon (BC) has a stronger correlation with alkanes and alkenes in the evening rush hour, which is 39% more than that during the morning rush hour.

Author Contributions

Conceptualization: G.X.; methodology: F.W.; validation: Y.H.; formal analysis: F.W.; investigation: F.W. and J.X.; writing—original draft: F.W.; writing—review and editing: F.W.; supervision: G.X. All authors have read and agreed to the published version of the manuscript.

Funding

This research was funded by the Shanghai Science and Technology Innovation Plan, grant number 19DZ1205000.

Institutional Review Board Statement

Not applicable.

Informed Consent Statement

Not applicable.

Data Availability Statement

AQI data version Figure 6 were download via https://sthj.sh.gov.cn/ (accessed on 12 August 2020).

Acknowledgments

The research was sponsored by the Shanghai Science and Technology Innovation Plan (No.19DZ1205000) and Shanghai Municipal Bureau of Ecology and Environment (2020-41). The authors thanks the instrument maintenance by Shanghai Environmental Monitoring Center.

Conflicts of Interest

The authors declare no conflict of interest.

References

  1. Liu, Y.; He, K.B.; Li, S.S.; Wang, Z.; Christiani, D.C.; Koutrakis, P. A statistical model to evaluate the effectiveness of PM2.5 emissions control during the Beijing 2008 Olympic Games. Environ. Int. 2012, 44, 100–105. [Google Scholar] [CrossRef]
  2. Huang, X.F.; He, L.Y.; Hu, M.; Canagaratna M., R.; Kroll J., H.; Ng N., L.; Zhang, Y.-H.; Lin, Y.; Xue, L.; Sun, T.-L.; et al. Characterization of submicron aerosols at a rural site in Pearl River Delta of China using an Aerodyne High-Resolution Aerosol Mass Spectrometer. Atmos. Chem. Phys. 2011, 11, 1865–1877. [Google Scholar] [CrossRef] [Green Version]
  3. Yu, X.N.; Ma, J.; An, J.L.; Yuan, L.; Zhu, B.; Liu, D.Y.; Wang, J.; Yang, Y.; Cui, H. Impacts of meteorological condition and aerosol chemical compositions on visibility impairment in Nanjing, China. J. Clean. Prod. 2016, 131, 112–120. [Google Scholar] [CrossRef]
  4. Bond, T.C.; Doherty, S.J.; Fahey, D.W.; Forster P., M.; Berntsen, T.; DeAngelo B., J.; Flanner M., G.; Ghan, S.; Kärcher, B.; Koch, D.; et al. Bounding the role of black carbon in the climate system: A scientific assessment. J. Geophys. Res. Atmos. 2013, 118, 5380–5552. [Google Scholar] [CrossRef]
  5. Mao, Y.H.; Liao, H.; Han, Y.M.; Cao, J.J. Impacts of meteorological parameters and emissions on decadal and interannual variations of black carbon in China for 1980–2010. J. Geophys. Res. Atmos. 2016, 121, 1822–1843. [Google Scholar] [CrossRef] [Green Version]
  6. Patton, A.P.; Milando, C.; Durant, J.L.; Kumar, P. Assessing the Suitability of Multiple Dispersion and Land Use Regression Models for Urban Traffic-Related Ultrafine Particles. Environ. Sci. Technol. 2017, 51, 384–392. [Google Scholar] [CrossRef] [Green Version]
  7. Kirchstetter, T.W.; Novakov, T. Controlled generation of black carbon particles from a diffusion flame and applications in evaluating black carbon measurement methods. Atmos. Environ. 2007, 41, 1874–1888. [Google Scholar] [CrossRef]
  8. Jacobson, M.Z. Strong radiative heating due to the mixing state of black carbon in atmospheric aerosols. Nature 2001, 409, 695–697. [Google Scholar] [CrossRef] [PubMed]
  9. Frazer, L. Seeing through soot. Environ. Health Perspect. 2002, 110, A471–A473. [Google Scholar] [CrossRef] [PubMed]
  10. Malm, W.C.; Sisler, J.F.; Huffman, D.; Eldred, R.A.; Cahill, T.A. Spatial and seasonal trends in particle concentration and optical extinction in the United States. J. Geophys. Res. Atmos. 1994, 99, 1347–1370. [Google Scholar] [CrossRef]
  11. Dey, S.; Tripathi, S.N.; Sing, R.P.; Holben, B.N. Seasonal variability of the aerosol parameters over Kanpur, an urban site in Indo-Gangetic basin. Adv. Space Res. 2005, 36, 778–782. [Google Scholar] [CrossRef]
  12. Vrekoussis, M.; Liakakou, E.; Kocak, M.; Kubilay, N.; Oikonomou, K.; Sciare, J.; Mihalopoulos, N. seasonal variability of optical properties of aerosols in the Eastern Mediterranean. Atmos. Environ. 2005, 39, 7083–7094. [Google Scholar] [CrossRef]
  13. Vaishya, A.; Jennings, S.G.; O’Dowd, C. Seasonal Varirtion of the Aerosol Light Scattering Coefficient in Marine Air of the Northeast Atlantic. Adv. Meteorol. 2011, 2011, S125. [Google Scholar] [CrossRef] [Green Version]
  14. Wang, Y.; Xin, J.; Li, Z.; Wang, S.; Wang, P.; Hao, W.M.; Nordgren, B.L.; Chen, H.; Wang, L.; Sun, Y. Seasonal variations in aerosol optical properties over China. J. Geophys. Res. Atmos. 2011, 116, 597–616. [Google Scholar] [CrossRef]
  15. Kupiainen, K.J.; Aamaas, B.; Savolahti, M.; Karvosenoja, N.; Paunu, V. Climate impact of Finnish air pollutants and greenhouse gases using multiple emission metrics. Atmos. Chem. Phys. 2019, 19, 7743–7757. [Google Scholar] [CrossRef] [Green Version]
  16. Kuhn, T.; Kupiainen, K.; Miinalainen, T.; Kokkola, H.; Paunu, V.; Laakso, A.; Tonttila, J.; Dingenen, R.V.; Kulovesi, K.; Karvosenoja, N.; et al. Effects of black carbon mitigation on Arctic climate. Atmos. Chem. Phys. 2020, 20, 5527–5546. [Google Scholar] [CrossRef]
  17. Hall, J.; Loboda, T. Quantifying the variability of potential black carbon transport from cropland burning in Russia driven by atmospheric blocking events. Environ. Res. Lett. 2018, 13, 055010. [Google Scholar] [CrossRef]
  18. Babu, S.S.; Satheesh, S.; Moorthy, K.K. Aerosol radiative forcing due to enhanced black carbon at an urban site in India. Geophys. Res. Lett. 2002, 9, 1880. [Google Scholar] [CrossRef]
  19. Jacobson, M.Z. Control of fossil-fuel particulate black carbon and organic matter, possibly the most effective method of slowing global warming. Geophys. Res. 2002, 7, 4410. [Google Scholar] [CrossRef] [Green Version]
  20. Zhang, C.; Zoum, Z.; Chang, Y.; Zhang, Y.; Wang, X.; Yang, X. Source assessment of atmospheric fine particulate matter in a Chinese megacity: Insights from long-term, high-time resolution chemical composition measurements from Shanghai flagship monitoring supersite. Chemosphere 2020, 251, 126598. [Google Scholar] [CrossRef]
  21. Yumashev, D.; van Hussen, K.; Gille, J.; Whiteman, G. Towards a balanced view of Arctic shipping: Estimating economic impacts of emissions from increased traffic on the Northern Sea Route. Clim. Chang. 2017, 143, 143–155. [Google Scholar] [CrossRef] [Green Version]
  22. Menon, S.; Hansen, J.; Nazarenko, L.; Luo, Y. Climate effects of black carbon aerosols in China and India. Science 2002, 297, 2250–2253. [Google Scholar] [CrossRef] [Green Version]
  23. Tripathi, S.N.; Dey, S.; Tare, V.; Satheesh, S.K. Aerosol black carbon radiative forcing at an industrial city in northern India. Geophys. Res. Lett. 2005, 32, 32. [Google Scholar] [CrossRef] [Green Version]
  24. Moorthy, K.K.; Babu, S.S. Aerosol black carbon over Bay of Bengal observed from an island location, Port Blair: Temporal features and long-range transport. J. Geophys. Res. Atmos. 2006, 111, 111. [Google Scholar] [CrossRef] [Green Version]
  25. Chen, L.; Zhang, F.; Yan, P.; Wang, X.; Sun, L.; Li, Y.; Zhang, X.; Sun, Y.; Li, Z. The large proportion of BC-containing aerosols in the urban atmosphere. Environ. Pollut. 2020, 263, 114507. [Google Scholar] [CrossRef]
  26. Chen, X.; Cao, J.; Ward, T.J.; Tian, L.; Ning, Z.; Gali, N.K.; Aquilina, N.J.; Yim, S.H.; Qu, L.; Ho, K. Characteristics and toxicological effects of commuter exposure to black carbon and metal components of fine particles (PM2.5) in Hong Kong. Sci. Total. Environ. 2020, 742, 140501. [Google Scholar] [CrossRef] [PubMed]
  27. Yezhe, L.; Ulf, O. On black carbon emission from automotive disc brakes. J. Aerosol Sci. 2020, 148, 105610. [Google Scholar]
  28. Duan, Y. Characteristics of Air Pollution by the Roadside in Shanghai. Adm. Tech. Environ. Monit. 2019, 1, 34–38. [Google Scholar]
  29. Wang, F.; Xu, J.; Duan, Y.; Huo, J.; Lin, Y.; Xiu, G. Analysis on the pollution characteristics of black carbon in Shanghai at the beginning of 2020. Environ. Sci. Technol. 2020, 43, 186–193. [Google Scholar]
  30. Huang, K.; Fu, J.S. Data Descriptor: A global gas flaring black carbon emission rate dataset from 1994 to 2012. Sci. Data 2016, 3, 160104. [Google Scholar] [CrossRef] [PubMed] [Green Version]
  31. Bond, T.C.; Streets, D.G.; Yarber, K.F.; Nelson, S.M.; Woo, J.; Klimont, Z. A technology-based global inventory of black and organic carbon emissions from combustion. J. Geophys. Res. Atmos. 2004, 109, 109. [Google Scholar] [CrossRef] [Green Version]
  32. Streets, D.G.; Gupta, S.; Waldhoff, S.T.; Wang, M.Q.; Bond, T.C.; Yiyun, B. Black carbon emissions in China. Atmos. Environ. 2001, 35, 4281–4296. [Google Scholar] [CrossRef]
  33. Chow, J.C.; Watson, J.G.; Doraiswamy, P.; Chen, L.A.; Sodeman, D.A.; Lowenthal, D.H.; Park, K.; Arnott, W.P.; Motallebi, N. Aerosol light absorption, black carbon, and elemental carbon at the Fresno Supersite, California. Atmos. Res. 2009, 93, 874–887. [Google Scholar] [CrossRef]
  34. Cai, J.; Xiu, G.L.; Zhang, D.N.; Yang, J.; Zheng, Y.; Chen, Y.X.; Wang, Z.W. Concentration levels and personal exposure characteristics of black carbon in a Shanghai subway station. Res. Environ. Sci. 2012, 25, 1328–1335. [Google Scholar]
  35. Huang, Z.S.; Xiu, G.L.; Cai, J.; Xu, W.; Wang, L. Seasonal characterization of water- soluble organic carbon and humic- like substance carbon in atmospheric PM2.5. Acta Sci. Circumst. 2013, 33, 2664–2670. [Google Scholar]
  36. Zhang, C.H.; Cheng, X.H.; Zhao, T.L.; Xu, X.D.; Wu, Y.F.; Zhang, R.J.; Cai, W.Y.; Su, H.; Wang, Y.J. Impact of meteorological conditions on high black carbon concentrations in urban area of Beijing in different seasons. Acta Sci. Circumstant. 2017, 37, 2255–2264. [Google Scholar]
  37. Xiao, X.Z.; Liu, P.F.; Geng, F.H.; Gao, W.; Zhen, C.M.; Zhao, C.S. Comparison of Black Carbon Aerosols in Urban and Suburban Areas of Shanghai. J. Appl. Meteorol. Sci. 2011, 22, 158–168. [Google Scholar]
  38. Tao, J.; Zhang, L.; Cao, J.; Zhang, R. A review of current knowledge concerning PM2.5 chemical composition, aerosol optical properties and their relationships across China. Atmos. Chem. Phys. 2017, 17, 9485–9518. [Google Scholar] [CrossRef] [Green Version]
  39. Liu, Y.; Shao, M.; Fu, L.; Lu, S.; Zeng, L.; Tang, D. Source profiles of volatile organic compounds (VOCs) measured in China: Part I. Atmos. Environ. 2008, 42, 6247–6260. [Google Scholar] [CrossRef]
  40. Ankur, K. Sources and reactivity of NMHCs and VOCs in the atmosphere: A review. J. Hazard. Mater. 2009, 166, 17–26. [Google Scholar]
  41. Wei, W.; Wang, S.; Hao, J.; Cheng, S. Projection of anthropogenic volatile organic compounds (VOCs) emissions in China for the period 2010–2020. Atmos. Environ. 2011, 45, 6863–6871. [Google Scholar] [CrossRef]
  42. Li, J.; Fu, Q.; Huo, J.; Wang, D.; Yang, W.; Bian, Q.; Duan, Y.; Zhang, Y.; Pan, J.; Lin, Y.; et al. Tethered balloon-based black carbon profiles within the lower troposphere of Shanghai in the 2013 East China smog. Atmos. Environ. 2015, 123, 327–338. [Google Scholar] [CrossRef]
  43. Solomon, S.; Qin, D.; Manning, M.; Chen, Z.; Marquis, M. Climate Change 2007: The physical science basis. Working Group I contribution to the fourth assessment report of the Intergovernmental Panel on Climate Change. Comput. Geom. 2007, 1–21. [Google Scholar]
  44. Panicker, A.S.; Park, S.H.; Lee, D.I.; Kim, D.; Jung, W.; Jang, S.; Jeong, J.; Kim, D.; Yu, J.; Jeong, H. Observations of black carbon characteristics and radiative forcing over a global atmosphere watch supersite in Korea. Atmos. Environ. 2013, 77, 98–104. [Google Scholar] [CrossRef]
  45. Li, Y.; Cao, J.J.; Zhang, X.Y.; Chen, H.Z. The Variability and Source Apportionment of Black Carbon Aerosol in Xi’an Atmosphere During the Autumn of 2003. Clim. Environ. Res. 2005, 10, 229–237. [Google Scholar]
  46. Alberto, W.D.; del Pilar, D.M.; Valeria, A.M.; Fabiana, P.S.; Cecilia, H.A.; De Los Angeles, B.M. Pattern Recognition Techniques for the Evaluation of Spatial and Temporal Variations in Water Quality. A Case Study: Suquía River Basin (Córdoba–Argentina). Water Res. 2001, 35, 2881–2894. [Google Scholar] [CrossRef]
  47. Eberhard, Z.; Hackbusch, W.; Schwarz, H.-R. Teubner Taschenbuch der Mathematik; Springer: Berlin, Germany, 2003. [Google Scholar]
  48. Caseiro, A.; Gehrke, B.; Ruecker, G.; Leimbach, D.; Kaiser, J.W. Gas flaring activity and black carbon emissions in 2017 derived from the Sentinel-3A Sea and Land Surface Temperature Radiometer. Earth Syst. Sci. 2020, 12, 2137–2155. [Google Scholar] [CrossRef]
  49. Cho, M.-H.; Park, R.J.; Yoon, J.; Choi, Y.; Jeong, J.I.; Labzovskii, L.; Fu, J.S.; Huang, K.; Jeong, S.; Kim, B. A missing component of Arctic warming: Black carbon from gas flaring. Environ. Res. Lett. 2019, 14, 094011. [Google Scholar] [CrossRef] [Green Version]
  50. Conrad, B.M.; Johnson, M.R. Field Measurements of Black Carbon Yields from Gas Flaring. Environ. Sci. Technol. 2017, 51, 1893–1900. [Google Scholar] [CrossRef]
  51. Shanghai Municipal Bureau of Ecology and Environment. Available online: https://sthj.sh.gov.cn/ (accessed on 12 August 2020).
  52. Zhan, H.D.; Lu, P.; Liu, R.K. Terminal Brief Introduction of Shanghai Chemical Industry Park. J. Mar. Technol. 2008, 1, 5–8. [Google Scholar]
  53. Qiang, J.B. Channel features of Jinshan, Fubao and Changjiang Estuary. J. China Water Transp. 2016, 16, 43–44. [Google Scholar]
  54. Li, Y.H.; Huang, C.H.; Ma, C.Y.; Ren, Z.J.; Ma, J.H. Research on the Time of Ship Inbound and Outbound. J. China Water Transp. 2020, 20, 3–7. [Google Scholar]
  55. United States Environment Protection Agency [EB/OL]. Available online: https://www.epa.gov/ (accessed on 15 May 2020).
  56. Huang, Y.Z.; Xiu, G.L.; Lu, Y.F.; Gao, S.; Li, L.; Chen, L.; Huang, Q.; Yang, Y.; Che, X.; Chen, X.; et al. Application of an emission profile-based method to trace the sources of volatile organic compounds in a chemical industrial park. J. Sci. Total. Environ. 2021, 768, 144694. [Google Scholar] [CrossRef] [PubMed]
Figure 1. Location of the observation site.
Atmosphere 12 00870 g001
Figure 2. Seasonal and monthly variations in BC in 2018. (Note: The box and whisker plot shows the range of BC concentration.; the centerline of each box is the median, the box represents the 25th through 75th percentile; the whiskers represent the most extreme value within 1.5 times the interquartile range).
Atmosphere 12 00870 g002
Figure 3. Seasonal variation in BC under different weather conditions in 2018.
Atmosphere 12 00870 g003
Figure 4. The results of analysis of BC concentration in 2018. (Note: The color of the square lattice in the heatmap represents the concentrations of BC. Darker indicates worse pollution).
Atmosphere 12 00870 g004
Figure 5. A Spearman analysis results.
Atmosphere 12 00870 g005
Figure 6. AQI (the air quality index) in December 2018. Adapted from Ref. [51]. (Data from the website of Shanghai Municipal Bureau of Ecology and Environment: https://sthj.sh.gov.cn/, accessed on 12 August 2020).
Atmosphere 12 00870 g006
Figure 7. Daily average concentration of BC, SO2, NO2, O3 and PM2.5 in December 2018.
Atmosphere 12 00870 g007
Figure 8. Day/night variation in BC in December 2018.
Atmosphere 12 00870 g008aAtmosphere 12 00870 g008b
Figure 9. Results of analysis of BC concentrations in 2018.
Atmosphere 12 00870 g009
Table 1. Correlation coefficient between BC and 36-VOCs in December 2018.
No.Compounds24-HRush Hour
1Ethane0.7770.746
2Propane0.8010.805
3n-Butane0.7320.713
4Iso-butane0.6680.639
5n-Pentane0.7520.716
6Isopentane0.6760.612
7n-Hexane0.4750.425
8n-Heptane0.3640.254
9Octane0.3710.491
102,2,4-Trimethylpentane0.1490.144
112,3,4-Trimethylpentane0.5060.383
12Ethylene0.6020.572
13Acetylene0.8520.898
14Propylene0.430.485
15cis-2-Butene————
16trans-2-Butene————
171,3-Butadiene0.0764−0.0458
18Isoprene0.1280.191
19Benzene0.4510.337
20Toluene0.460.424
21Ethylbenzene0.6660.597
22o-Xylene0.5740.493
23m-Xylene + p-Xylene0.5620.464
24Styrene0.1840.362
251,2,3-Trimethylbenzene0.7080.656
261,2,4-Trimethylbenzene0.7020.661
271,3,5-Trimethylbenzene0.6210.65
28Cumene0.3250.302
29Propylbenzene0.7010.693
30Dichloromethane0.2250.18
311,2-Dichloroethane0.3190.237
32Trichloroethylene————
33Tetrachloroethylene0.4460.369
34Chlorobenzene0.2360.217
351,2,4-Trichlorobenzene−0.01110.0268
362-Methylpentane + 2,3-Dimethylbutane0.5870.583
Values > 0.8 indicate strong correlation, 0.3–0.7 indicate weak correlation.
Publisher’s Note: MDPI stays neutral with regard to jurisdictional claims in published maps and institutional affiliations.

