Article

The Potential Ozone Impacts of Landfills

by
Eduardo P. Olaguer
Department of Environment, Great Lakes, and Energy, Lansing, MI 48909, USA
Atmosphere 2021, 12(7), 877; https://doi.org/10.3390/atmos12070877
Submission received: 30 April 2021 / Revised: 24 June 2021 / Accepted: 30 June 2021 / Published: 7 July 2021

Abstract

:
Landfill gas produces ozone precursors such as nitrogen oxides and formaldehyde when combusted in flares or stationary engines. Solid waste landfills are also the third largest anthropogenic source of methane in the United States. Methane is both a greenhouse gas and a tropospheric ozone precursor. Despite its low photochemical reactivity, methane may noticeably affect urban ozone if released in large quantities along with other organic compounds in landfill gas. A fine-scale 3D Eulerian chemical transport model was used to demonstrate that, under meteorological and background chemical conditions conducive to high ozone concentrations, typical emissions of ozone precursors from a single hypothetical landfill may result in persistent daytime additions to ozone of over 1 part per billion (ppb) by volume tens of kilometers downwind. Large leaks of landfill gas can enhance this ozone pollution by over a tenth of a ppb, and external sources of non-methane ozone precursors may further exacerbate this impact. In addition, landfill gas combustion may increase near-source exposure to toxic formaldehyde by well over half a ppb. In Southeast Michigan, the combined influence of several landfills upwind of key monitoring sites may contribute significantly to observed exceedances of the U.S. ozone standard.

1. Introduction

Solid waste landfills are the third largest anthropogenic source of methane (CH4) emissions in the United States [1]. Methane is a greenhouse gas with an atmospheric lifetime of about 9 years [2]. It is also a global ozone (O3) precursor due to its ability to alter the balance of tropospheric radicals. West and Fiore [3] suggested that a 17% decrease in world emissions of methane may result in a 1 part per billion (ppb) by volume average reduction in global tropospheric ozone.
While the U.S. Environmental Protection Agency (USEPA) does not classify methane as a Volatile Organic Compound (VOC) due to its low photochemical reactivity [4], methane may nevertheless contribute significantly to urban (as opposed to global background) ozone if released in large quantities, especially if coincident with high-density emissions of ozone precursors from mobile and stationary sources.
Large methane leaks are known to occur from underground natural gas pipelines. Emissions from natural gas distribution and end use may in fact be 2–3 times larger than predicted by existing inventory methodologies and industry reports [5], with older, corrosion-prone distribution lines leaking ~25 times more methane than more modern pipelines [6]. Phillips et al. [7] identified 3356 methane leaks in Boston from measured ambient air concentrations exceeding up to 15 times the current global background level of over 1.8 parts per million (ppm) by volume [8]. Recent studies suggest that landfills may have releases of methane to the atmosphere comparable to defective natural gas pipelines.
When estimating emissions, there are two general classes of methods, often referred to as “bottom-up” (i.e., based on emission factors and activity metrics) and “top-down” (i.e., based on ambient air measurements). “Bottom-up” estimates of methane emissions from landfills are often obtained from the USEPA’s Landfill Gas Emissions Model (LandGEM) [9], and are typically well below 1000 kg/h of CH4. The increasing availability of advanced optical methods such as cavity ring-down spectrometry (CRDS) has made it possible to make much more revealing measurements of methane emissions in real time using “top-down” analysis techniques.
The California Methane Survey [10] deployed airborne visible and infrared imaging spectrometry to measure methane point sources (i.e., emissions from infrastructure elements or localized surface features) at 30 landfills and two composting facilities. These 32 sources collectively contributed about 43% to total point source emissions of methane in California, indicating the presence of super-emitters among the surveyed facilities. The strong methane plumes at some of the landfills may have been associated with gaps in intermediate cover, delays in construction projects, and/or leaking gas capture wells. Duren et al. [11] compared airborne measurements of methane emissions at six California landfills analyzed by with bottom-up estimates reported to the USEPA. They found significant discrepancies between bottom-up and top-down estimates, especially for the super-emitters releasing over 2000 kg/h of CH4.
Not all landfills manifest as large point sources of methane. A more recent study of landfills conducted by California Polytechnic State University (CPSU) [12], based on both aerial CRDS (16 sites) and synchronous ground-based static flux chamber measurements (5 sites), found that methane emissions from small, medium, and large landfills varied from −25 to 11 kg/h, 90 to 638 kg/h, and 602 to 3275 kg/h respectively. Estimated gas collection efficiencies ranged from 23.2 to 91.4% from aerial data, 38.9 to 100% from ground data, and 24.5 to 75.9% from LandGEM. The results of the CPSU study also indicated that Non-Methane Organic Compounds (NMOCs), which include USEPA-delisted low-reactivity organics other than methane, are a significant fraction of landfill gas.
Ozone precursors are also generated when landfill gas is combusted in flares or by stationary engines used for gas-to-energy conversion. These precursors include nitrogen oxides (NOx = NO + NO2) and the hazardous air pollutant (HAP), formaldehyde (HCHO), as well as other organic species. Formaldehyde is especially important to ozone formation as a radical precursor [13]; that is, it photolyzes to yield external HOx (= OH + HO2) radicals that convert emitted NO to NO2, which is then converted to ozone by photolysis and molecular collisions. This is opposed to most VOCs, which only yield a chain of internal radicals upon reaction with already-available HOx. To use an analogy, HCHO and other radical precursors (HONO, higher aldehydes, etc.) are the “matches” that light the “flame” of ozone chain reactions involving NOx and VOCs.
Primary formaldehyde, that is HCHO directly emitted by industrial (and also natural) sources, is unfortunately under-reported or even ignored in official emission inventories, as the standard measurement technique for VOCs used in regulatory settings (flame ionization detection) does not account for HCHO. Moreover, there exists a widespread assumption that primary formaldehyde is dwarfed by secondary formaldehyde, that is, HCHO chemically produced by organic reactions in the atmosphere [13,14]. In the case of landfills, stationary engine stack tests conducted for permit applications in the State of Michigan based on extractive Fourier Transform Infrared (FTIR) spectroscopy reveal HCHO-to-CO molar ratios of the order of 10% or more. This is confirmed by engine stack test data collected by the State of New Jersey [15], which has since 2018 required more accurate measurement and reporting of primary formaldehyde from reciprocating internal combustion engines by permitted industrial facilities [16].
Note that landfill gas combustion may be especially inefficient due to the presence of organic silicon compounds (e.g., siloxanes) that form silicon dioxide when burned. Silicon dioxide, commonly known as silica, is a solid at combustion gas temperatures. Silica deposits often cause maintenance and operational problems in engines.
For flares, the HCHO-to-CO molar ratio is of the order of 5%, based on data collected by Aerodyne Research, Inc. (Billerica, MA, USA) in 2010 at the John Zink experimental facility in Oklahoma [17,18]. The combination of HCHO emissions from flares and engines, as well as other combustion sources such as duct burners, may result in many landfills exceeding the major source threshold of 10 short tons per year (tpy) of a single HAP, triggering the need for a U.S. Clean Air Act Title V permit.
Changes in landfill operation may trigger the need for another type of permit under the New Source Review (NSR) provisions of the U.S. Clean Air Act. NSR permit decisions for individual facilities in the State of Michigan consider whether the facility’s contribution to ambient ozone averaged over 8 h is likely to exceed a Significant Impact Level (SIL) of 1 ppb, among other factors. This impact is typically gauged from reported facility emissions and pre-computed ozone look-up tables for the region of interest [19].
The goal of this paper was to demonstrate that, under meteorological and background chemical conditions conducive to high ozone concentrations, a single landfill facility may persistently contribute over 1 ppb to ambient ozone above the urban background based on typical emissions of ozone precursors. This was accomplished on the basis of explicit simulation with a state-of-the-art microscale air quality model.
Note that Southeast Michigan (including metropolitan Detroit) is currently in non-attainment of the U.S. National Ambient Air Quality Standard (NAAQS) for ozone (set at 70 ppb averaged over 8 h), with recent design values (3-year average of the annual 4th highest daily maximum 8 h ozone) exceeding the NAAQS at the Oak Park, East 7 Mile, New Haven, and Port Huron monitoring stations run by the Michigan Department of Environment, Great Lakes, and Energy (EGLE). Figure 1 shows the distribution of landfills in Southeast Michigan and their spatial relationship to the monitoring network. Given that ozone exceedances in the region typically occur when the wind blows from the southwest, a plausible hypothesis is that Southeast Michigan landfills may have a combined impact on ozone design values at downwind monitors approaching or exceeding 1 ppb. If this hypothesis is true, then control of landfill emissions of methane, HCHO, and other ozone precursors is a potentially important strategy for ozone attainment in Southeast Michigan.

2. Methods

2.1. The MicroFACT Air Quality Model

The tool used in this study to demonstrate the potential ozone impacts of landfills was a fine-scale (horizontal resolution below 1 km) 3D Eulerian air quality model known as the Microscale Forward and Adjoint Chemical Transport (MicroFACT) model. The current model version was designed to facilitate weight-of-evidence arguments in an ozone attainment demonstration, a required component of a State Implementation Plan (SIP) in many U.S. non-attainment areas. This version, henceforth referred to as MicroFACT_SIP, can simulate entire urban airsheds, unlike the earlier MATLAB-encoded neighborhood-scale, near-source air quality model of Olaguer [20,21,22,23].
The MicroFACT code takes advantage of the object-oriented features of the Python language, including the ability to pass different algorithms from the same family as arguments in subroutines. For example, MicroFACT has three different advection solvers for users to choose: Piecewise Parabolic Method (PPM) [24], Bott [25], and Smolarkiewicz [26]. The numerical performance of the advection solvers was gauged by means of standard rotating cone tests. Unless otherwise stated, PPM was used for horizontal advection, while vertical advection was treated using the more economical Smolarkiewicz scheme.
The MicroFACT_SIP chemical mechanism includes 35 advected species, with 116 gas-phase photochemical reactions [27,28,29], including some night-time chemistry. In addition, heterogeneous reactions for the secondary production of nitric and nitrous acid on surfaces are included [30,31], though they were not used in this study. MicroFACT_SIP includes its own computationally efficient, semi-analytical solver based on the Euler Backward Iterative (EBI) scheme of Hertel et al. [32]. Its relative simplicity enables the straightforward evaluation of the chemical Jacobian matrix. The chemical adjoint resulting from this Jacobian enables MicroFACT to serve as an inverse model for chemical source attribution and emission source apportionment, although this feature was not used in this study.
Documentation of the MicroFACT_SIP chemical mechanism and solver is included in the Supplementary Materials, together with a performance evaluation based on comparison of 36 h box model simulation results from MicroFACT to corresponding predictions by the University of Leeds Master Chemical Mechanism (MCM) [33]. Note that the MicroFACT_SIP chemical mechanism and solver were optimized for urban settings where there is an abundance of fresh NOx from motor vehicles and industrial sources, unlike more expanded lumped species mechanisms such as CB6 and its predecessors [34,35] that are intended to simulate both urban and continental-scale ozone pollution. The limited night-time chemistry of MicroFACT_SIP was mainly to facilitate model spin-up, as the focus of simulation was the daytime evolution of atmospheric O3 and its precursors.

2.2. Model Domains and Resolution

The modeling demonstration in this study made use of two domains located in Southeast Michigan at a nominal latitude of 42.6° (for the purpose of calculating daytime photolysis rates), with the same hypothetical landfill placed near the southwest corner of each domain. The first domain represents the near-source impacts of the hypothetical facility and has a horizontal extent of 4 km × 4 km gridded at 200 m resolution. This extent is equivalent in size to the typical smallest resolvable area of a coarse-grid regional chemical transport model such as the USEPA Community Multi-scale Air Quality (CMAQ) model [36]. The second domain represents the far-field impacts of the hypothetical facility and has a horizontal extent of 30 km × 30 km gridded at 400 m resolution.
MicroFACT is designed to be paired with the Quick Industrial Complex (QUIC) urban wind model [37] driven by 3D building shape files, and either sparse wind measurements or output from coarser-grid regional meteorological models, such as the Weather Research and Forecasting (WRF) model [38]. For this conceptual study QUIC was not used, since urban morphology was ignored in both model domains, as was topography.
Note that while landfill topography is important in assessing near-source exposure to fugitive emissions of landfill gas, the ozone impacts of such emissions are more likely to be important further downwind. Moreover, combustion activities in the hypothetical landfill were assumed to take place on level ground downwind of any elevated terrain.
The two modeling grids have the same vertical extent above ground level of 1 km. The temporal evolution of the atmospheric boundary layer height was ignored so that the model top was also the top of the daytime boundary layer. In both grids, there are ten vertical layers with increasing resolution Δz toward the surface (Δz = 4.44 m at z = 0 m, Δz = 260 m at z = 834 m).
The time period of the simulation was from noon to 3 P.M. local standard time (LST). Steady meteorological conditions and constant emissions were assumed to prevail, so that an approximately steady-state ozone plume emanated from the hypothetical landfill at the end of the simulation. A time step of 20 s was used to maintain computational stability according to the Courant-Friedrichs-Lewy criterion [39].

2.3. Meteorological and Chemical Assumptions

The meteorological parameters and chemical boundary conditions assumed for this study represented 8 h averages for the nominal date of 29 June 2018 and time period from 10 A.M. to 6 P.M. LST. This was to avoid performing repeated computationally intensive runs (baseline plus sensitivity experiments) spanning roughly half a (simulated) day each, including model spin-up. Instead, the model endpoint at 3 P.M. LST approximately simulated the mid-point of the 8 h period. The simulation results should then be roughly representative of the 8 h ozone impacts of the hypothetical landfill.
A constant horizontal wind was assumed to prevail, with a wind speed of 4.45 m/s derived from the magnitude of the vector-averaged 8 h wind at the Oak Park monitor (42.463° latitude, −83.183° longitude), the location of the highest ozone design value in the Southeast Michigan non-attainment area. The wind direction, however, was arbitrarily set to the southwesterly direction (225°) to allow for maximum plume range within the model domains and to represent generally prevailing conditions during ozone exceedances in the target region (note that the vector-averaged wind direction during the actual 8 h period was 190°). While a zero vertical wind speed was assumed, the model did allow for vertical eddy diffusion, with a diffusivity profile as shown in Figure 2. The horizontal eddy diffusivity, on the other hand, was set at 50 m2/s.
Uniform surface temperature and pressure were assumed for both domains, with the thermal lapse rate equal to the moist adiabatic value of 12 K/km. Relative humidity was also held constant. MicroFACT input parameters were obtained by averaging hourly data for a 4 km horizontal resolution run of CMAQ provided by the USEPA for the 8 h period of interest on 29 June 2018 at a location in Southeast Michigan (42.537° latitude, −83.190 longitude) slightly north of Oak Park, as shown in Table 1 for meteorological parameters. Table 2 shows corresponding 8 h average surface concentrations of 35 species derived from the same CMAQ run. These were used to specify uniform upwind boundary conditions for the 35 advected species. Table 2 also shows dry deposition velocities assumed for some of the species [40,41].
The assumed boundary conditions, which also serve as uniform initial conditions, represent the upwind influence of the most industrialized portion of Southeast Michigan during a typical summer high ozone episode in a low NOx environment (away from freeways or strong point sources). The modeling domains themselves have no emissions of ozone precursors other than from the hypothetical landfill. This may underestimate the far-field ozone impacts of individual landfills. For example, large methane leaks influence the ozone production not only of co-located emissions, but also of other emissions that contribute to downwind plume concentrations, such as those from mobile sources.

2.4. Hypothetical Landfill Emissions

Table 3 summarizes emissions of ozone precursors from incomplete combustion at the hypothetical landfill. Emissions of NOx and CO were assigned based on typical values reported by permitted facilities in Southeast Michigan for combustion sources. The effective release height (including plume rise) for these emissions is 97 m. NO emissions were assumed to be 90% of total NOx emissions, while emissions of HONO were computed based on a HONO/NOx mass ratio of 0.8% [42]. Stack test data were used to assign emissions of HCHO and VOCs from engines based on corresponding CO emissions. A 15% HCHO-to-CO mass ratio (14% molar ratio) was first applied to engine emissions. Mass ratios relative to HCHO were then used to assign emissions to two additional compounds: ethene (2%) and methanol (0.5%). Flare emissions of formaldehyde were computed based on a HCHO-to-CO molar ratio of 5%, while flare emissions of other VOCs were assigned based on typical reported values and treated as propene emissions [21].
To represent large leaks of landfill gas, an emission rate of 3000 kg/h of CH4 was assumed. Accompanying emissions of NMOC were computed based on a typical reported NMOC/CH4 mass ratio of 0.44%. The NMOC emissions were then assigned to various chemical species according to Table 4 based loosely on reported Michigan data. Note that the bulk of NMOC emissions (86.9%) was assigned to paraffinic bonds (PAR).

3. Results

3.1. Model Scenarios

The ozone impacts of the hypothetical landfill are presented in the context of three model scenarios for both the near-source and far-field domains. The first of these scenarios was the Baseline simulation, in which no emissions were present within the model grids, and the ozone generated during the three-hour (12:00–15:00 LST) simulation period was solely due to the propagation of the uniform boundary conditions by a southwesterly wind of 4.45 m/s. The second scenario was the Combustion Only simulation, in which landfill combustion emissions were added to the Baseline scenario conditions according to Table 3. The third scenario was the Fugitives + Combustion scenario, in which fugitive emissions of 3000 kg/h (=28,969 tpy) of CH4 and 13.2 kg/h (=127.5 tpy) of NMOC, the latter speciated according to Table 4, were added to the Combustion Only scenario conditions.

3.2. Near-Source Simulation

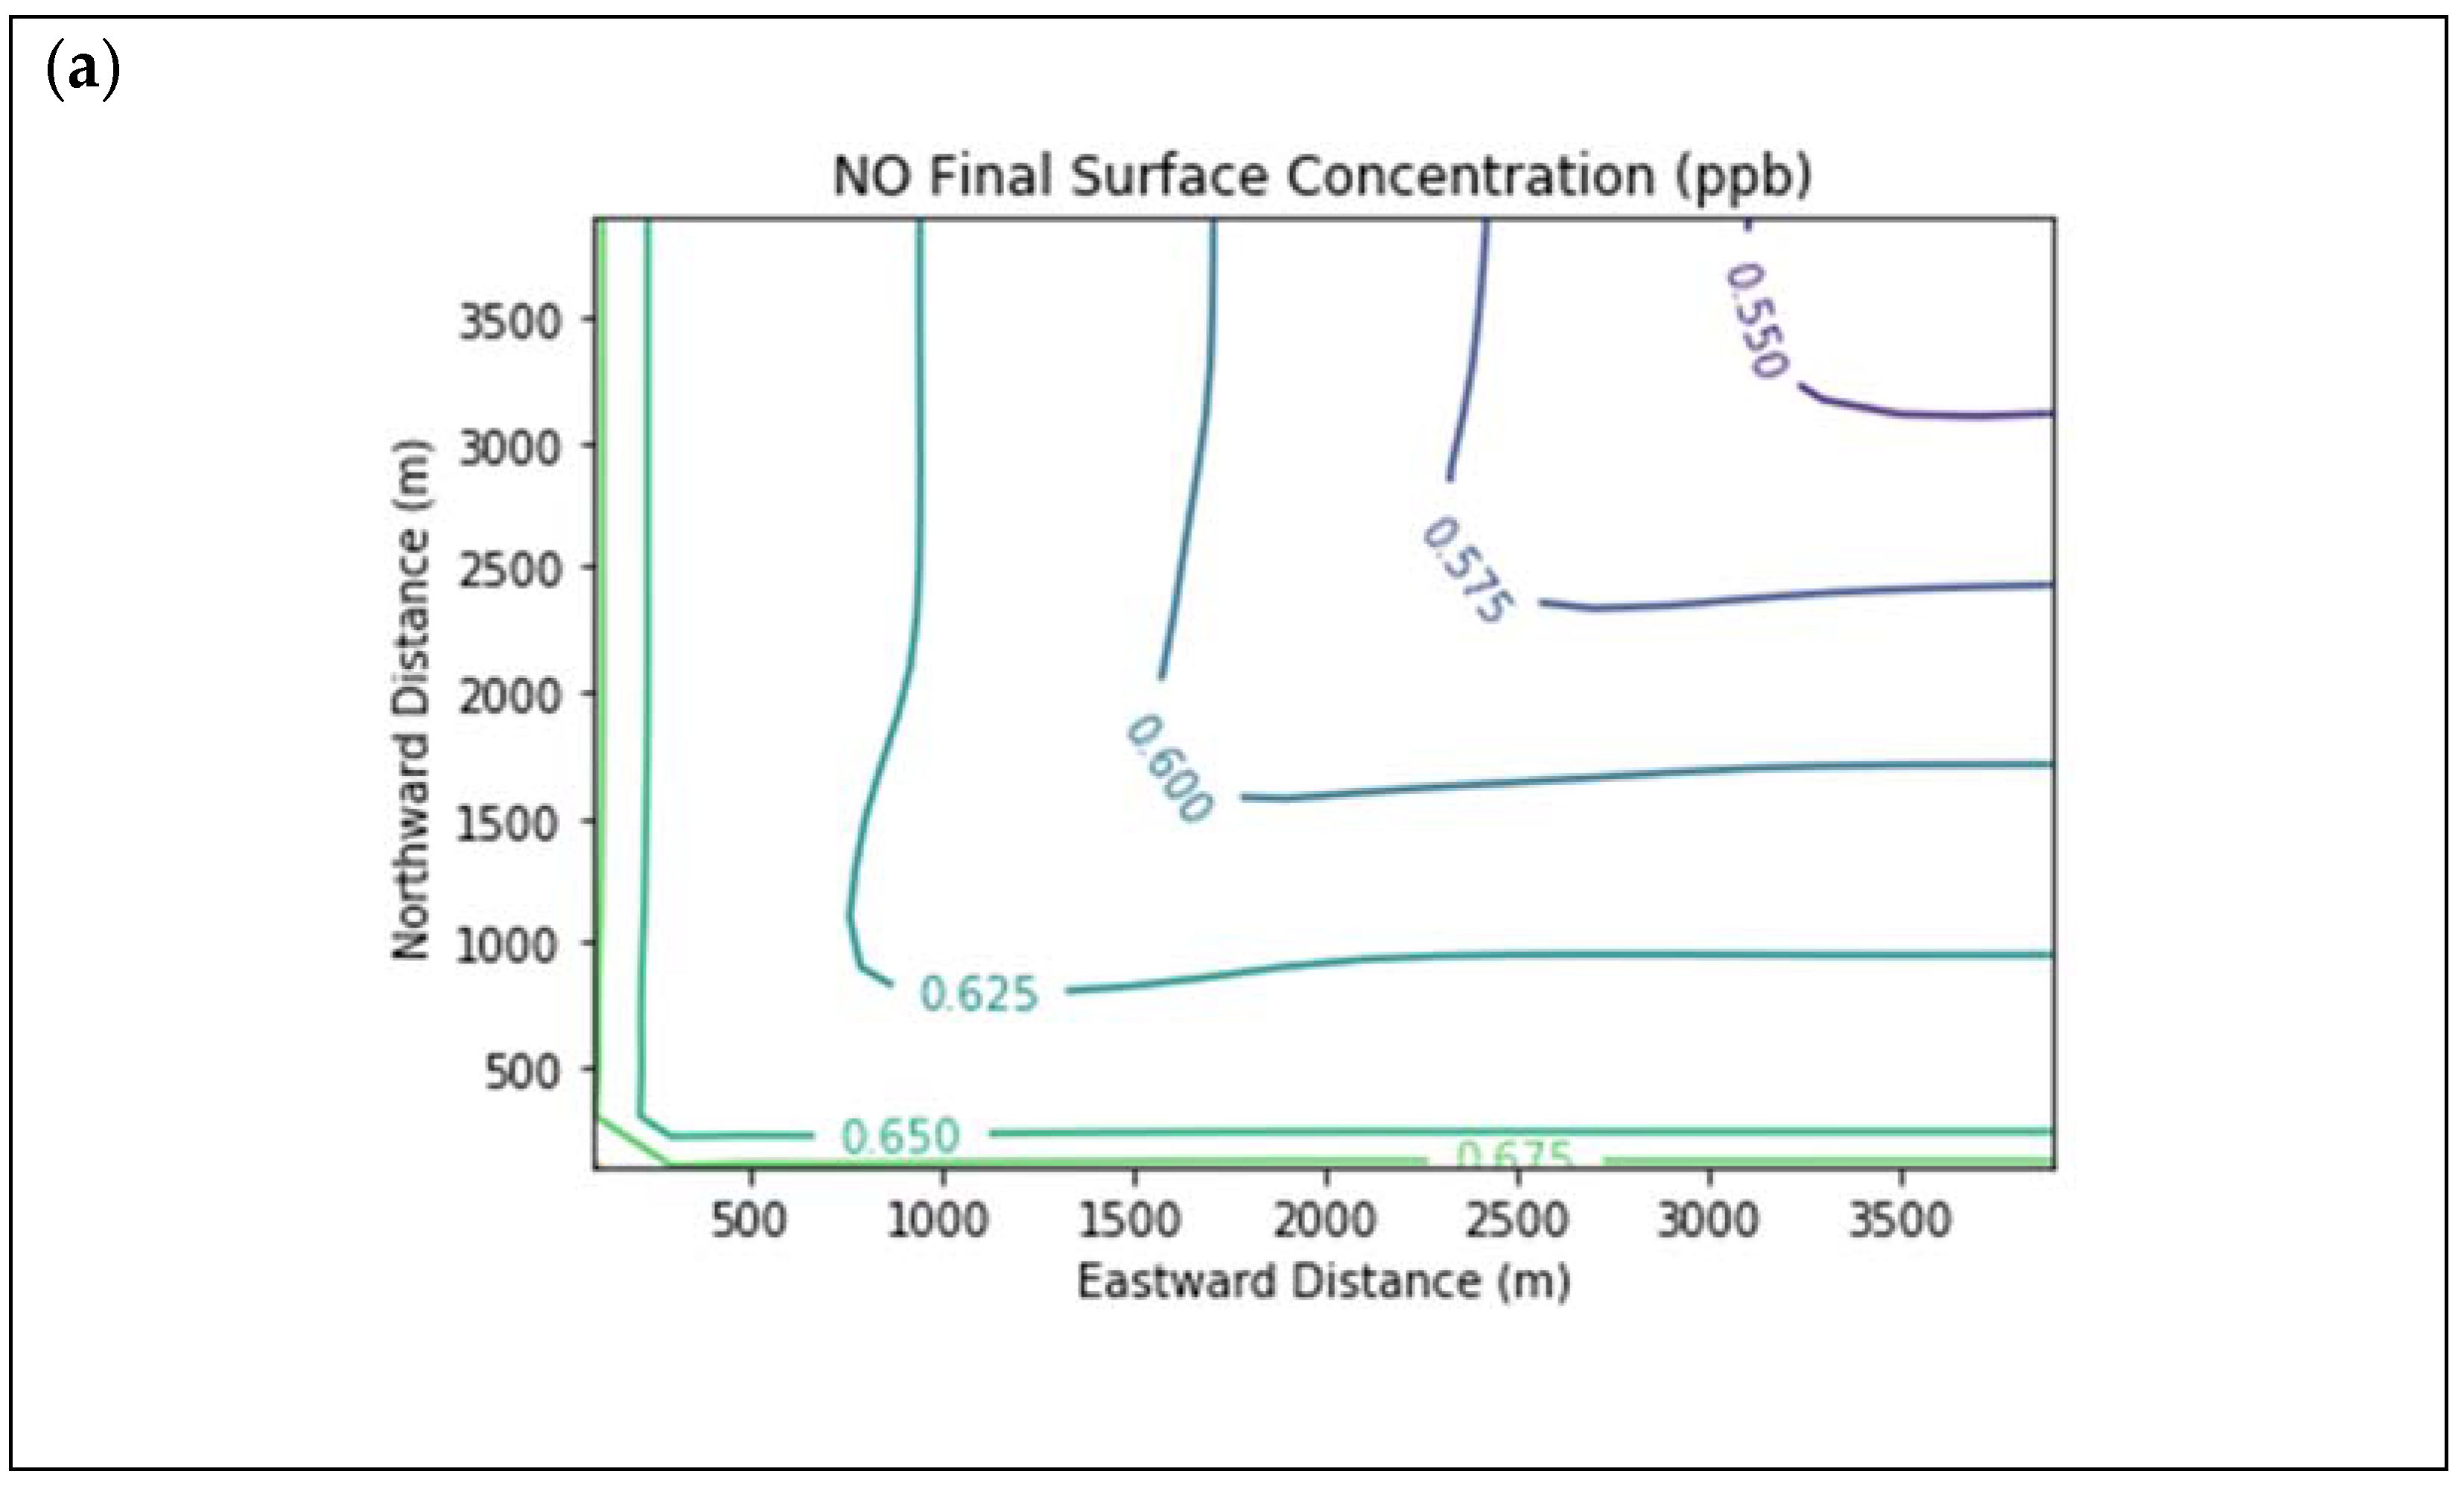
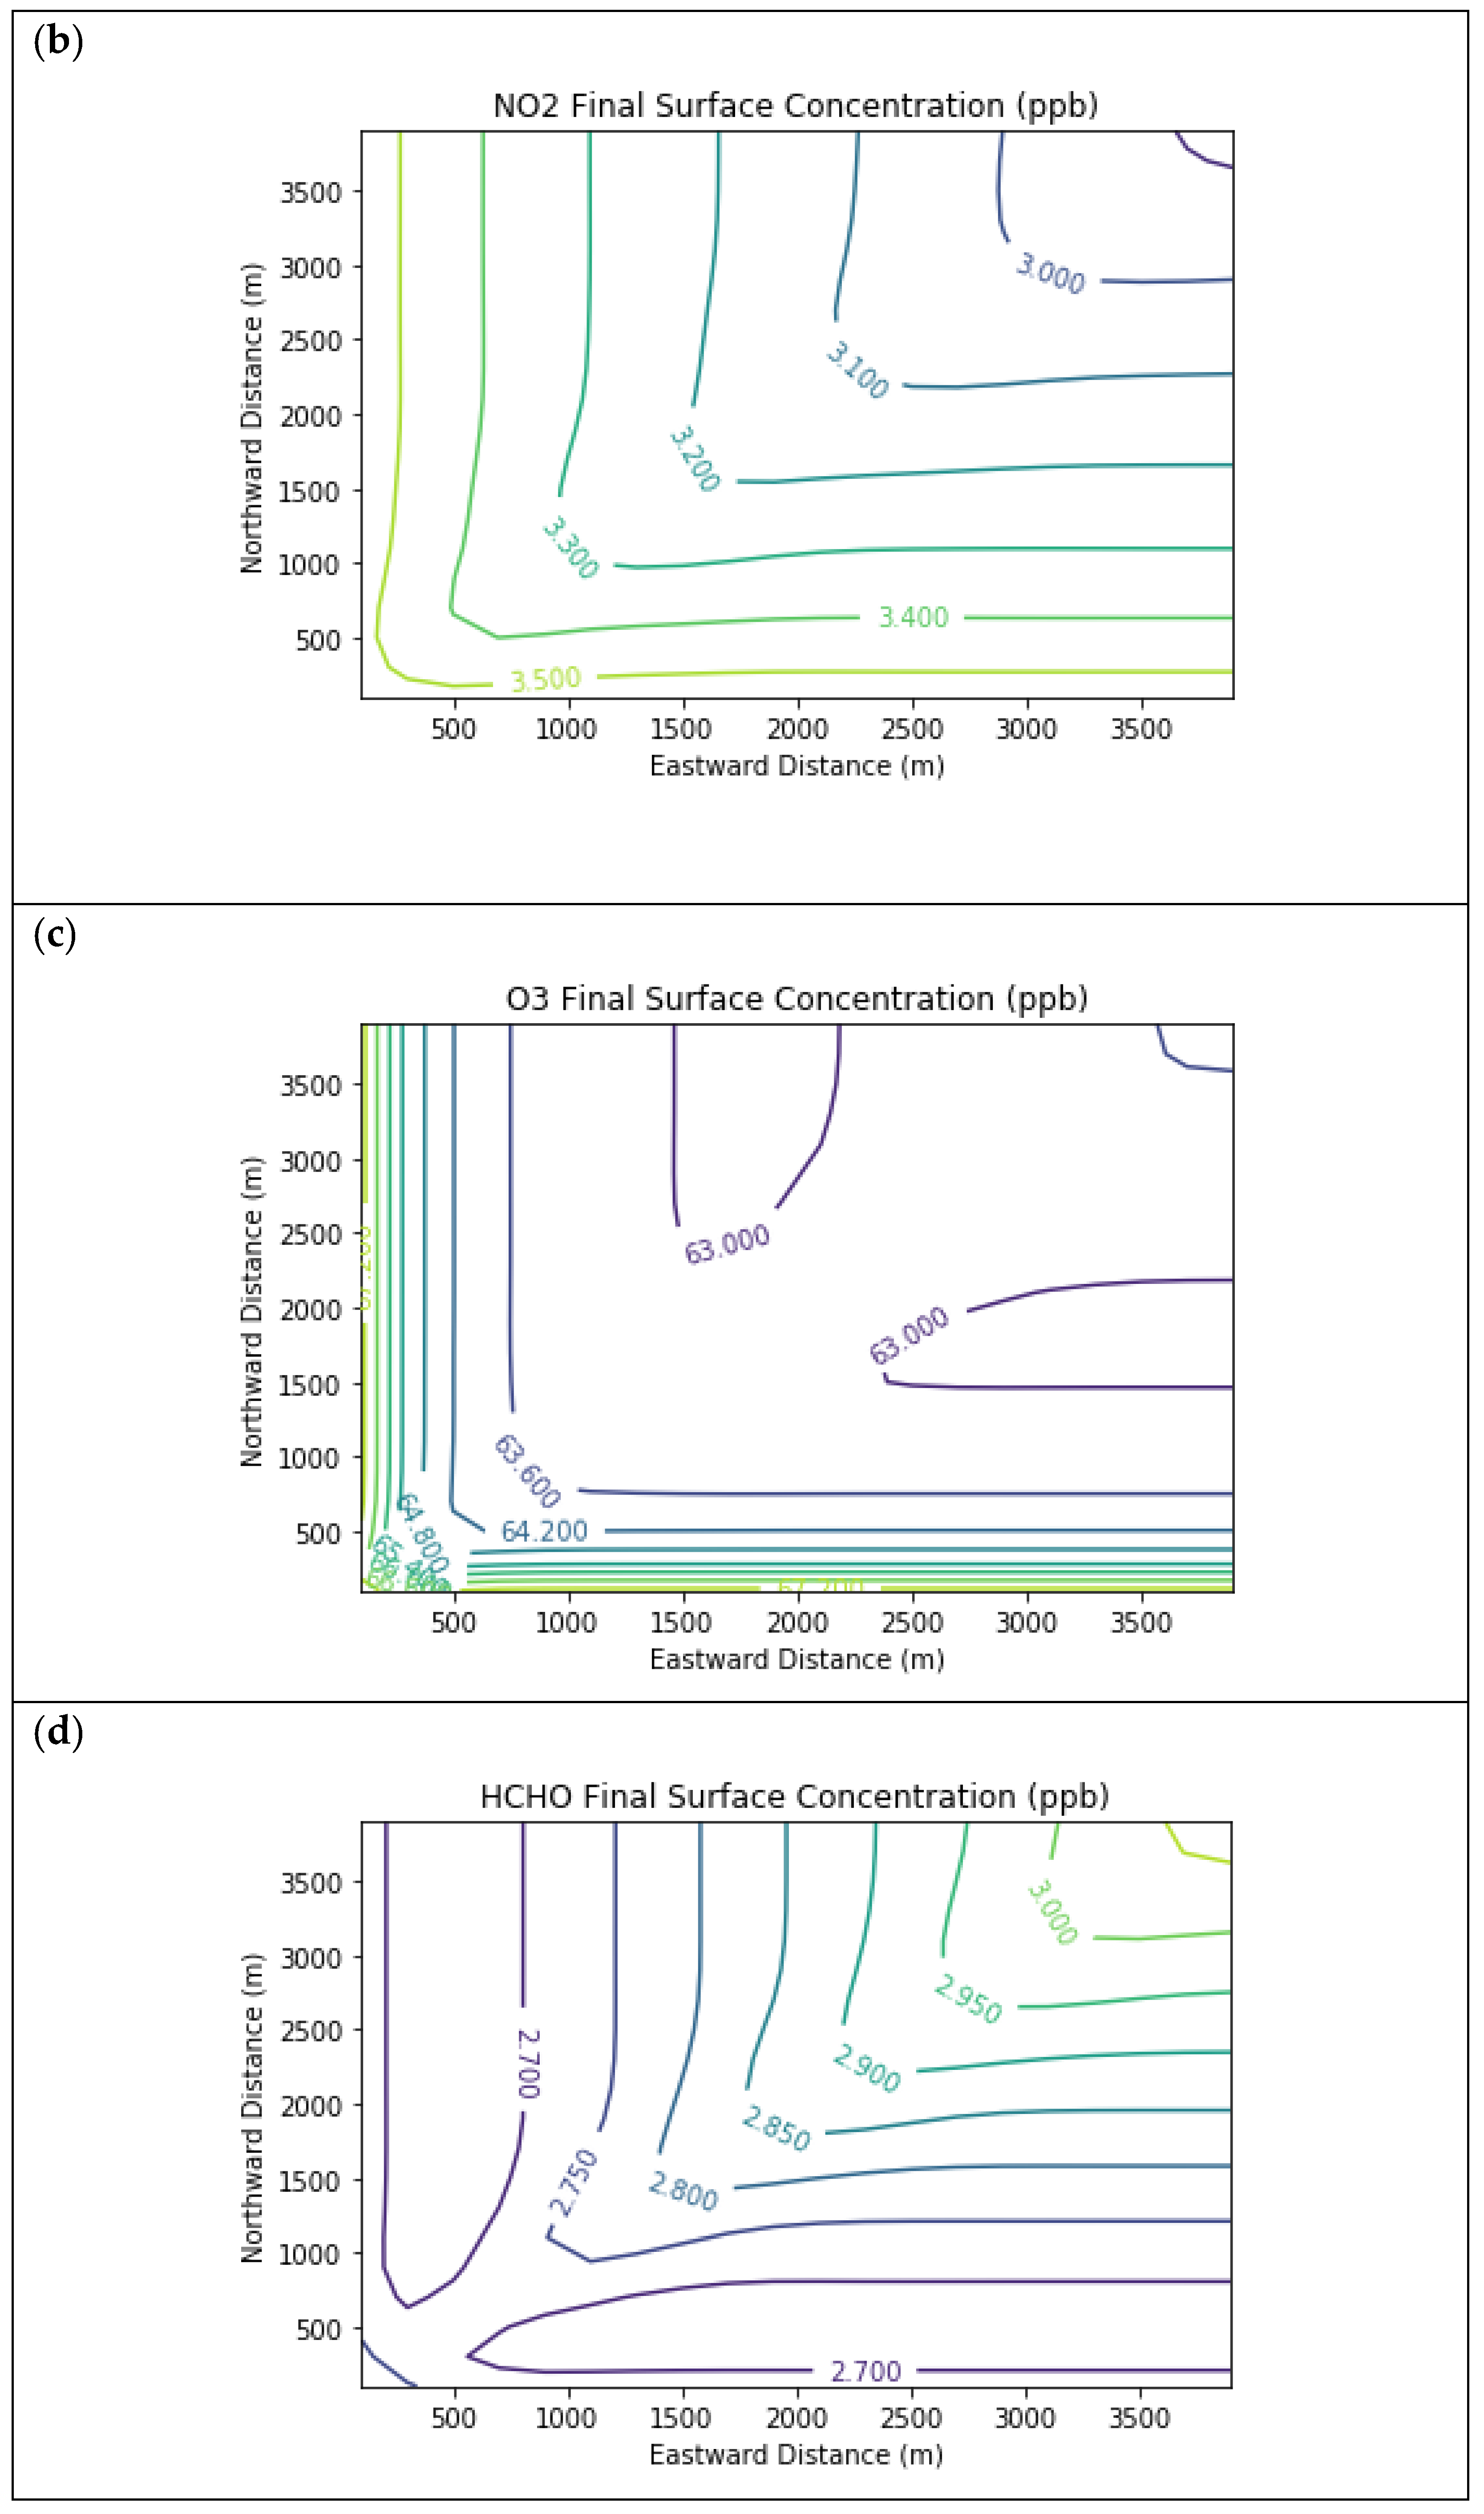
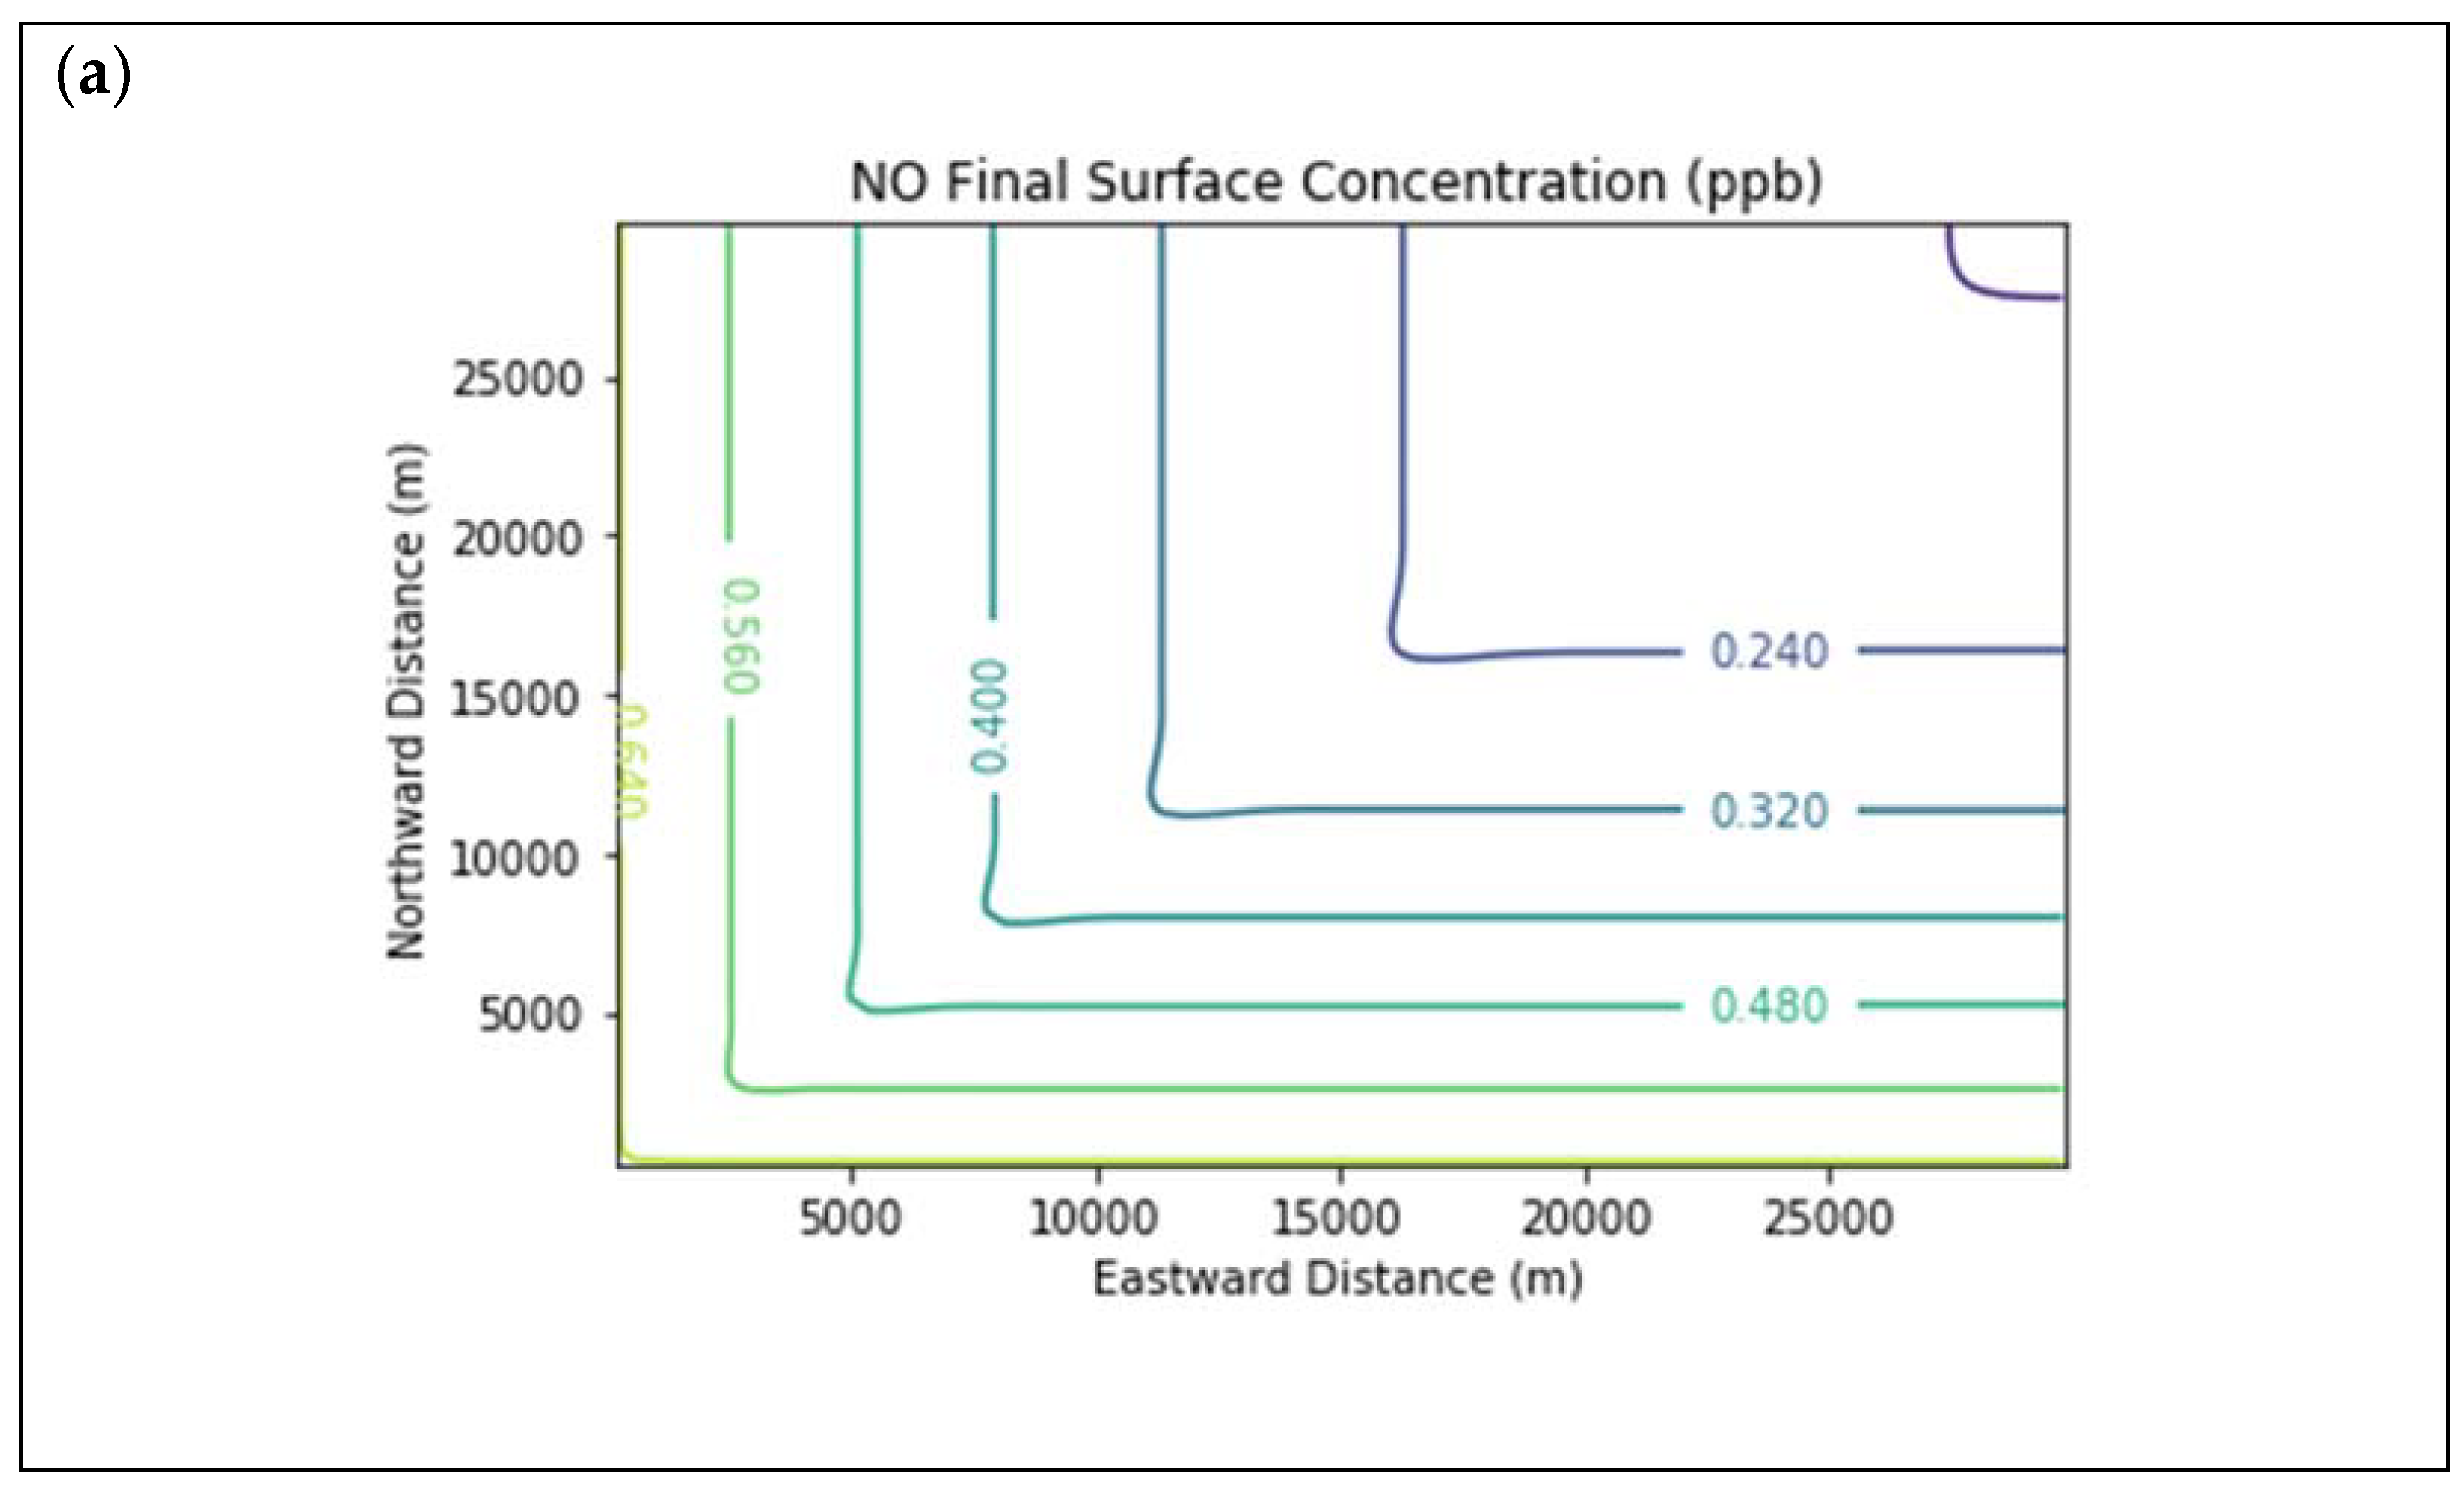
Results are first presented for the near-source simulation. Figure 3 displays surface concentration isopleths for ozone and key ozone precursors (NO, NO2, HCHO, CH4, and PAR) at the end of the three-hour simulation period for the Baseline scenario.
Note that the downwind ozone concentrations were below the inflow level of 70.3 ppb because of dry deposition within the model domain, as well as some titration of ozone by incoming NOx. Downwind HCHO was increased above the inflow concentration of 2.84 ppb due to secondary formation by decomposing incoming organic species.
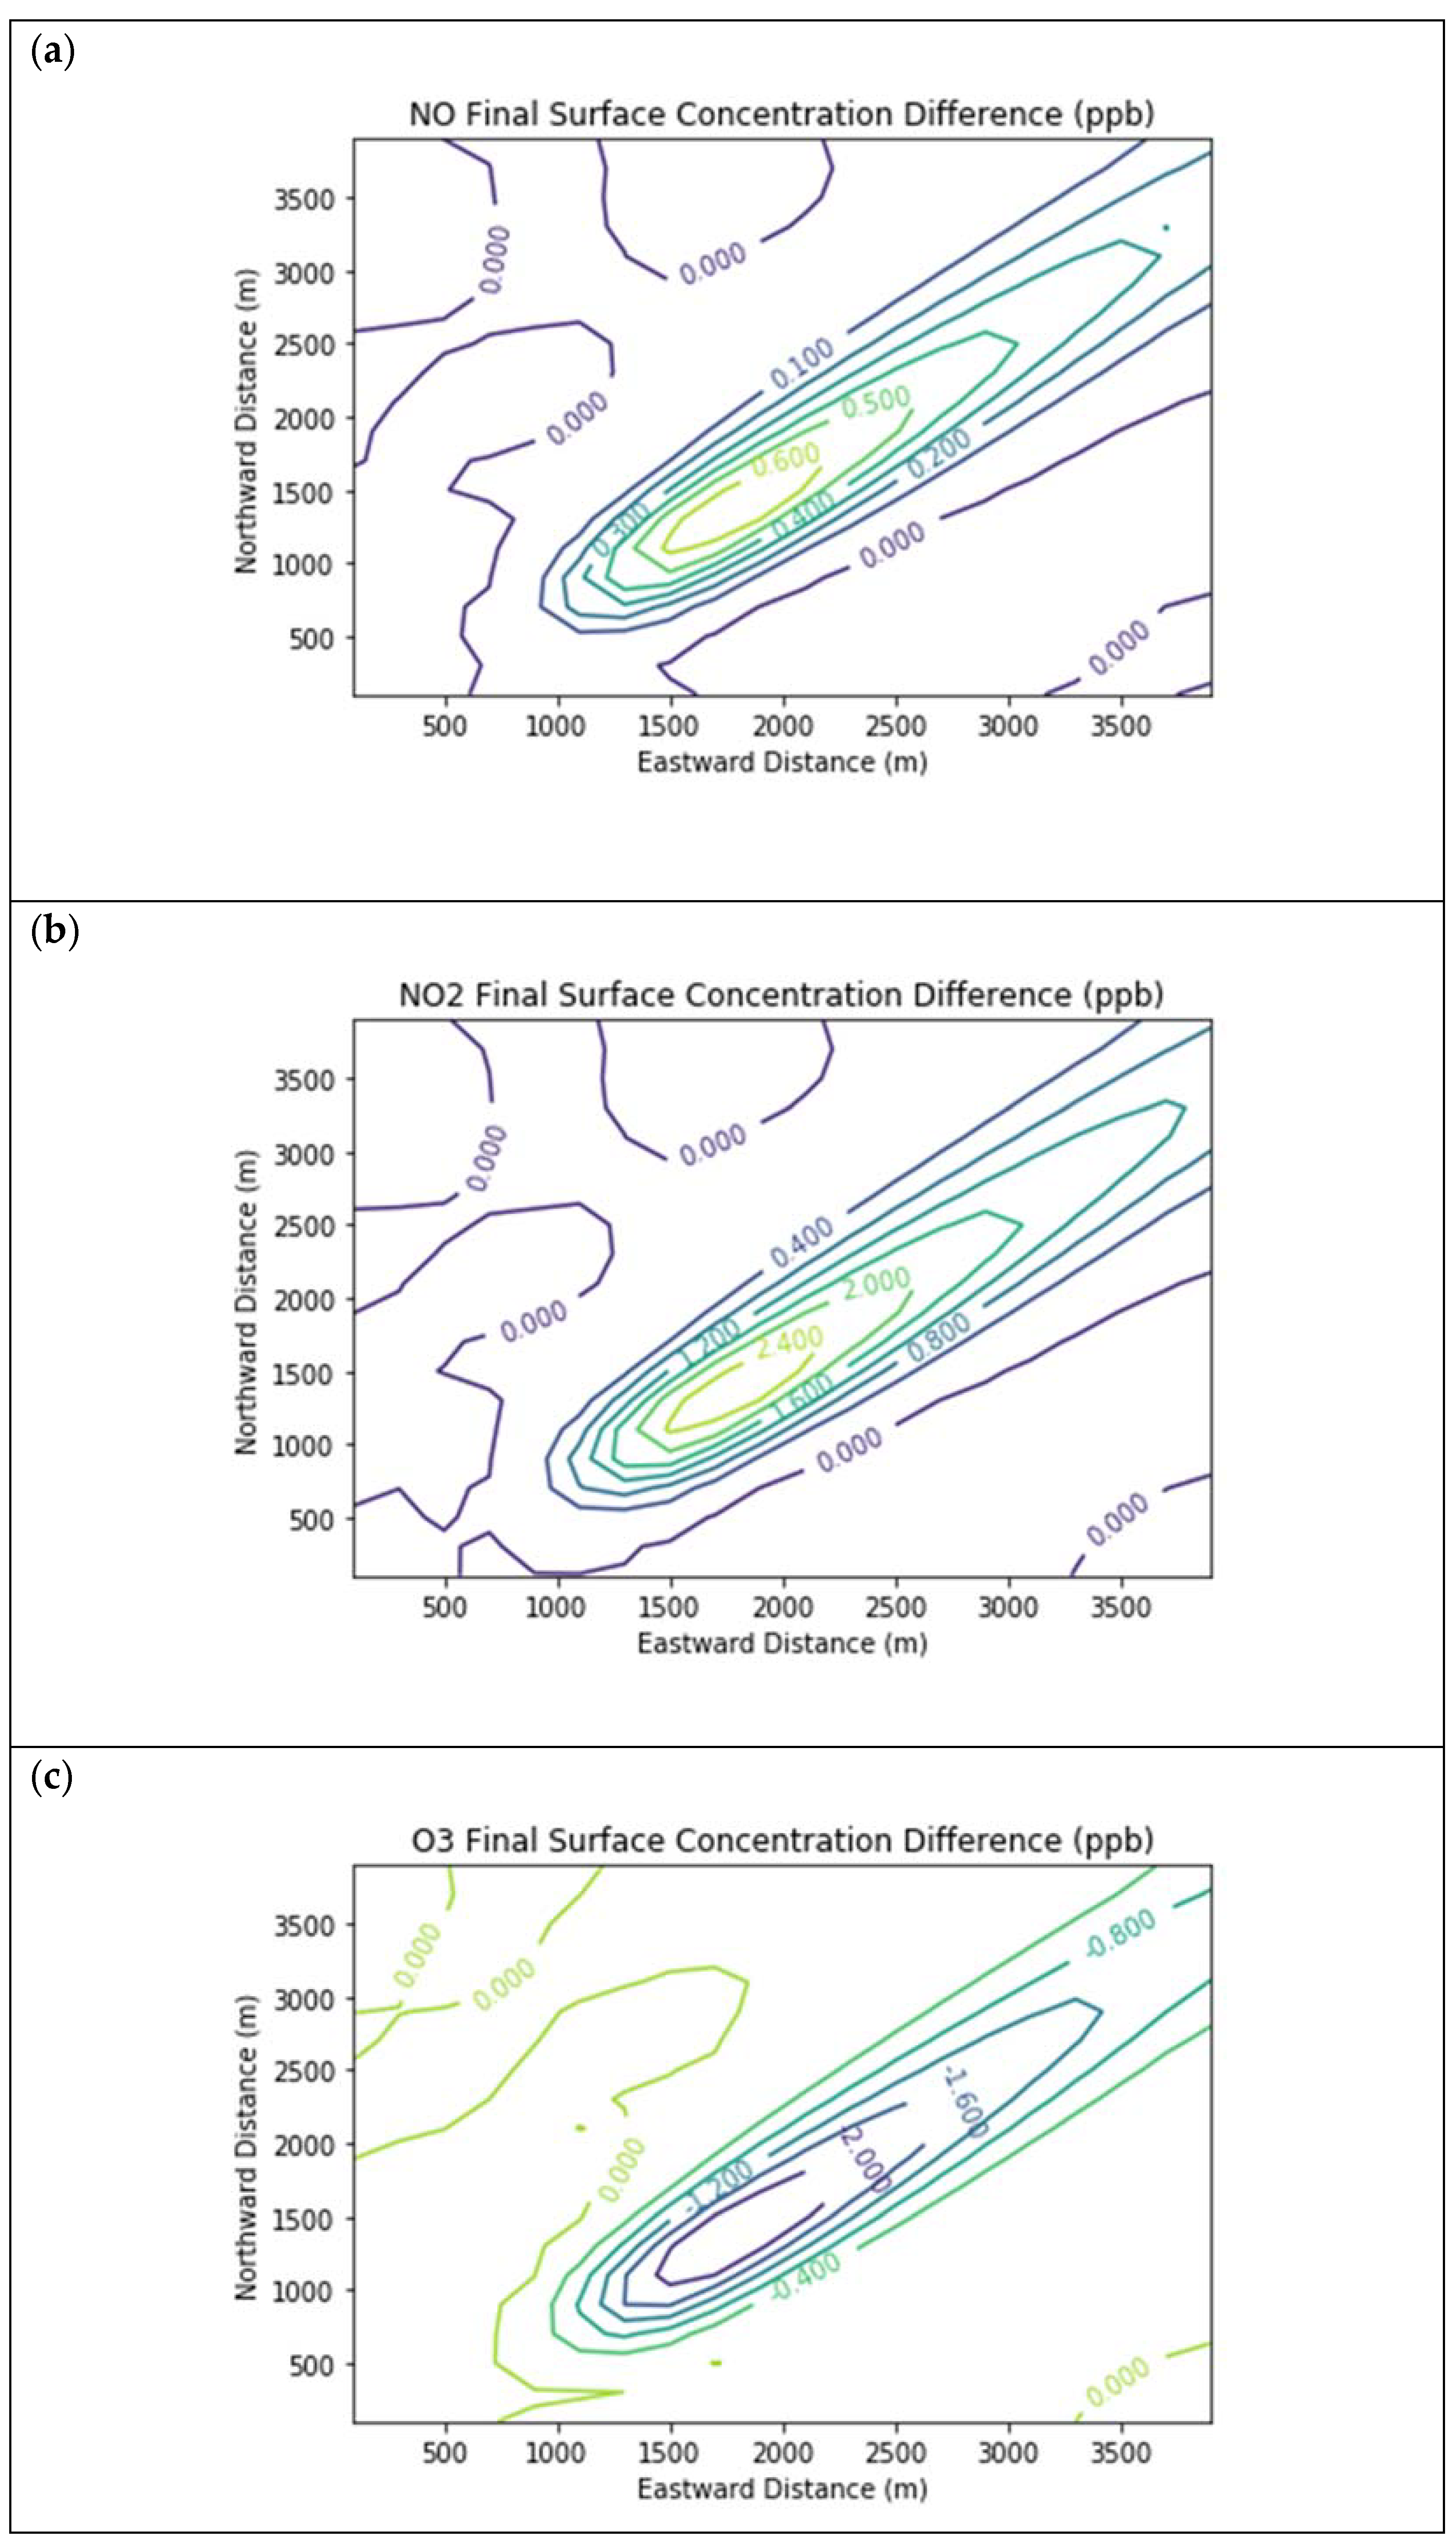
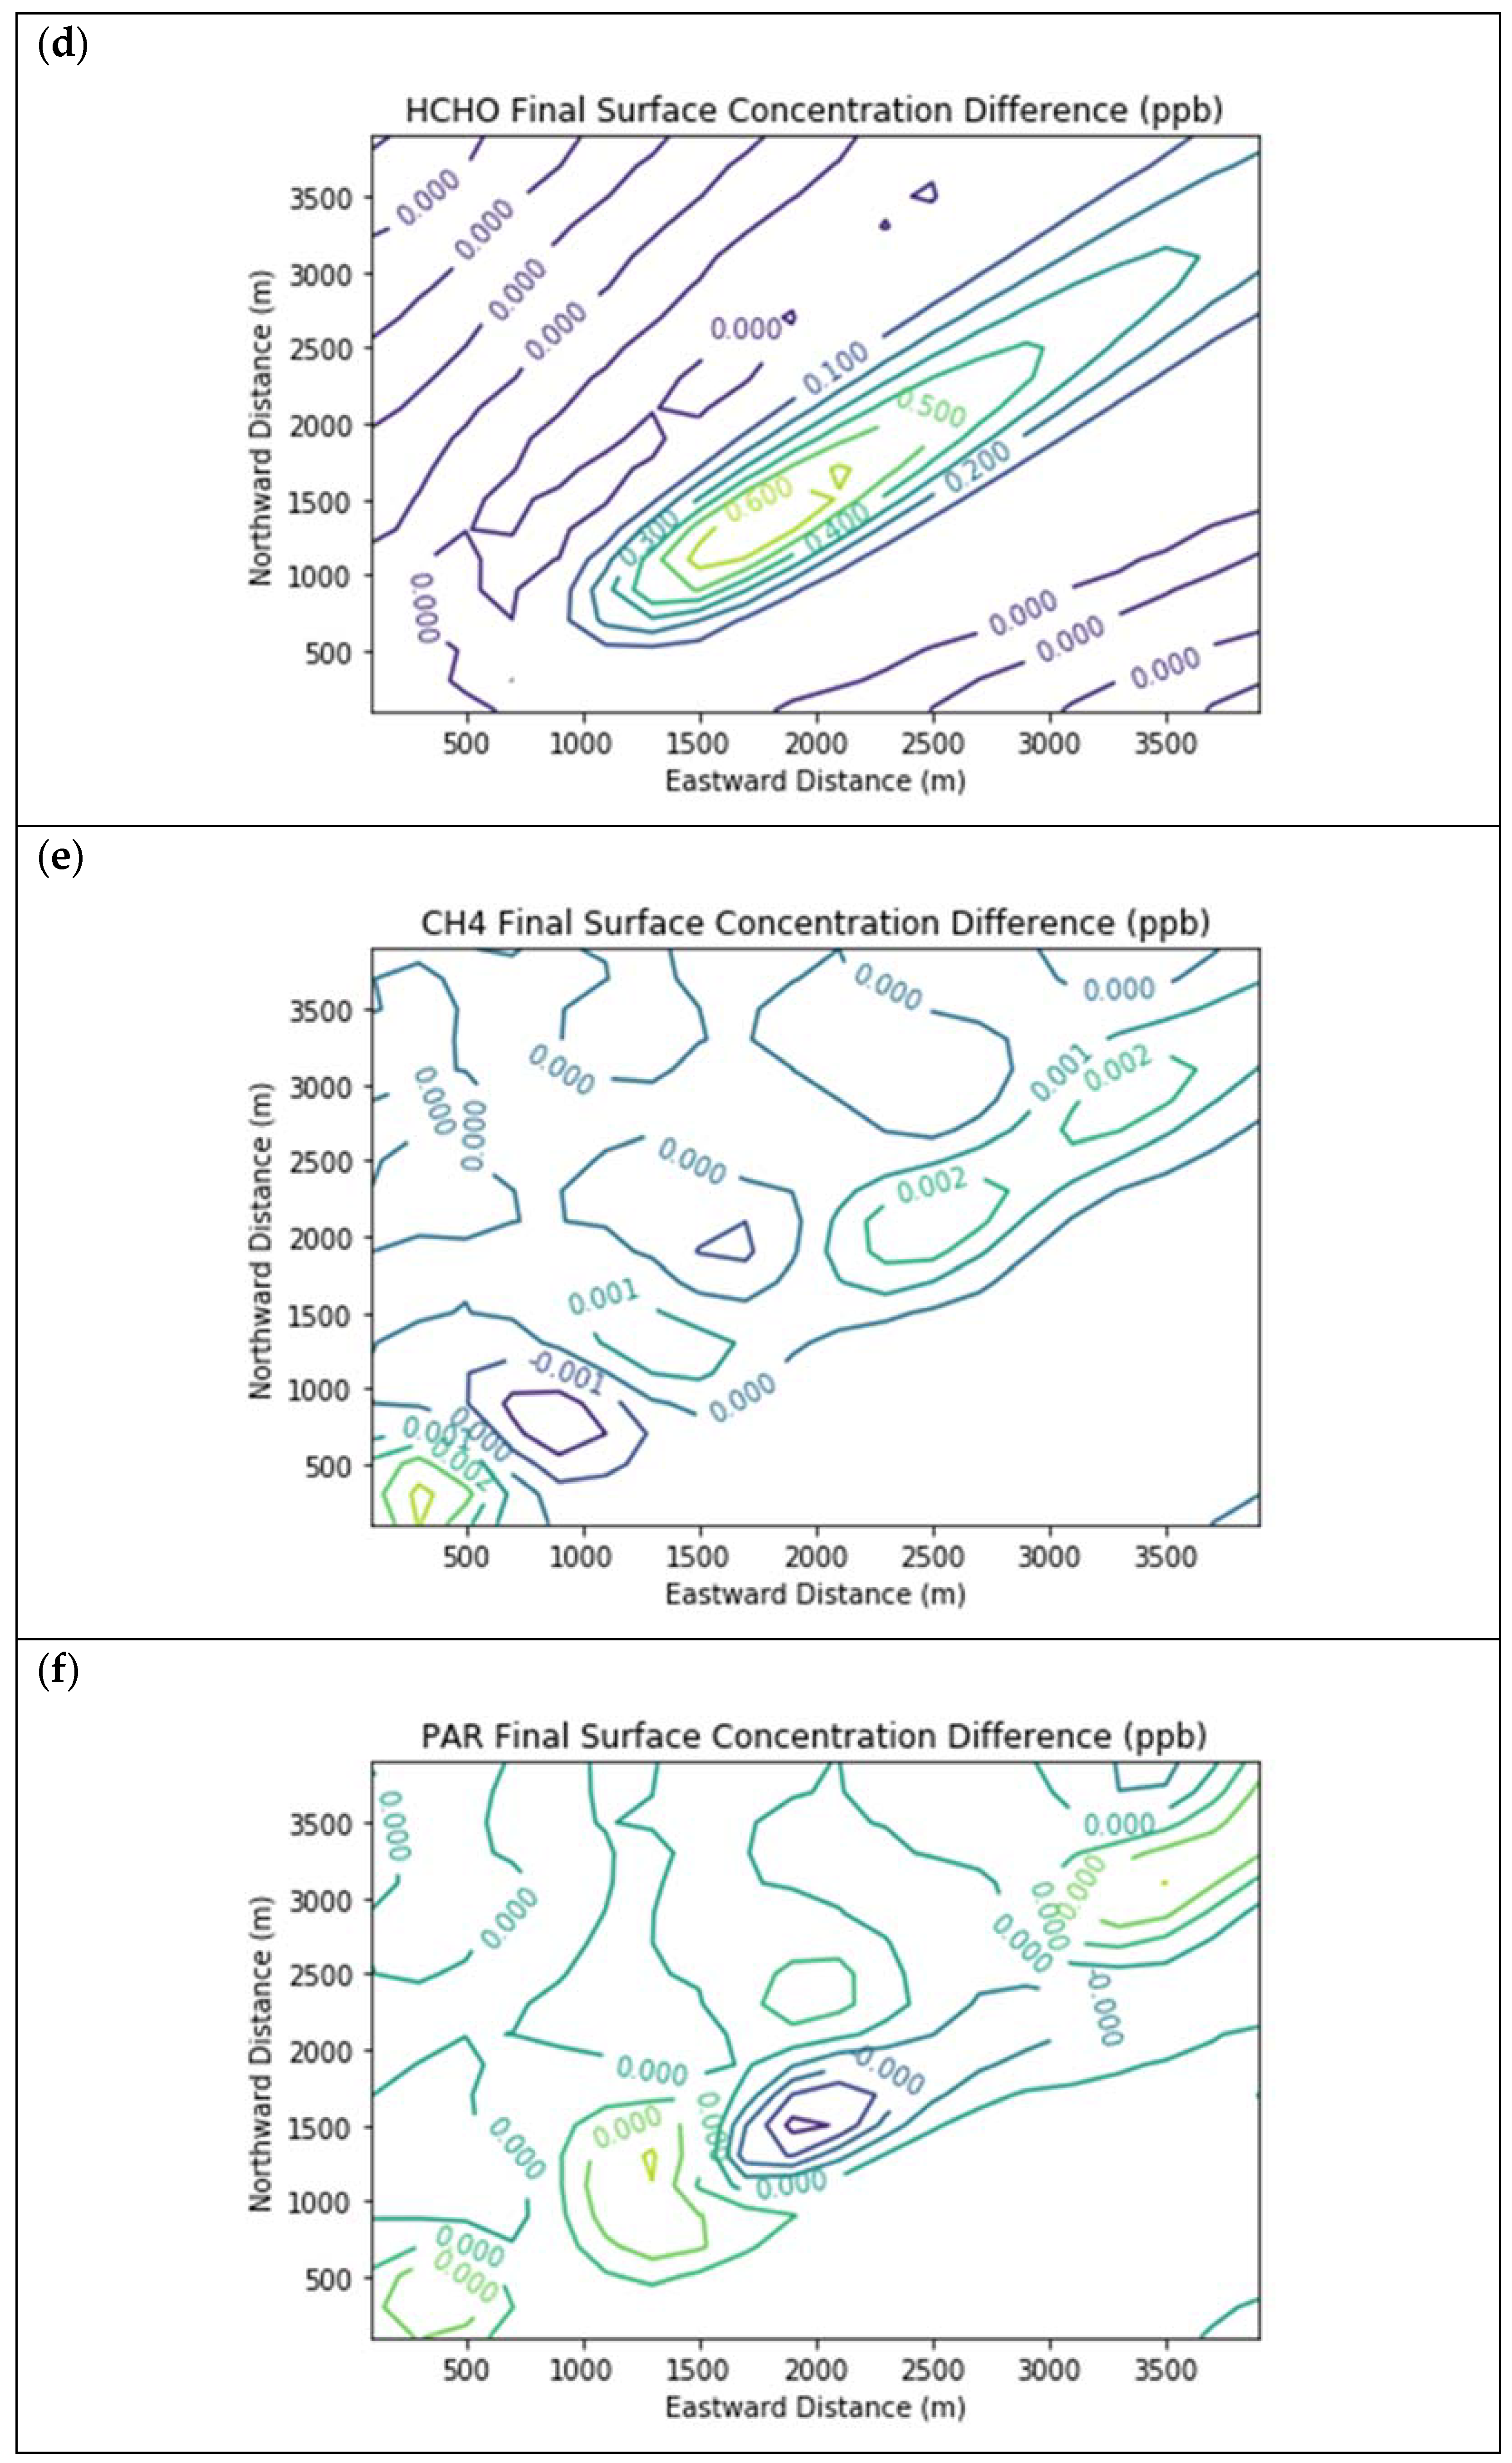
Figure 4 presents the end-of-simulation differences from the Baseline scenario due to landfill combustion sources in the Combustion Only scenario. Landfill NOx emissions increase the titration of ozone near the source, hence the negative contours in the ozone isopleths in the vicinity of the NOx enhancements. Incomplete combustion also significantly increases near-source formaldehyde exposure, with a peak enhancement of 0.68 ppb above the baseline concentration.
Figure 5 presents the end-of-simulation differences from the Combustion Only scenario due to the addition of fugitive emissions of methane and NMOC in the Fugitives + Combustion scenario. Note that the additional reactivity introduced by fugitives was not enough to overcome the effects of the combustion NOx titration of ozone near the source. The maximum enhancements of methane and PAR above background due to landfill fugitives were 22.6 ppm and 98.7 ppb respectively. The former value is comparable to urban methane concentrations in the vicinity of leaking natural gas pipelines [7] and to some CRDS measurements of ambient methane outside Michigan landfills during EGLE inspections.

3.3. Far-Field Simulation

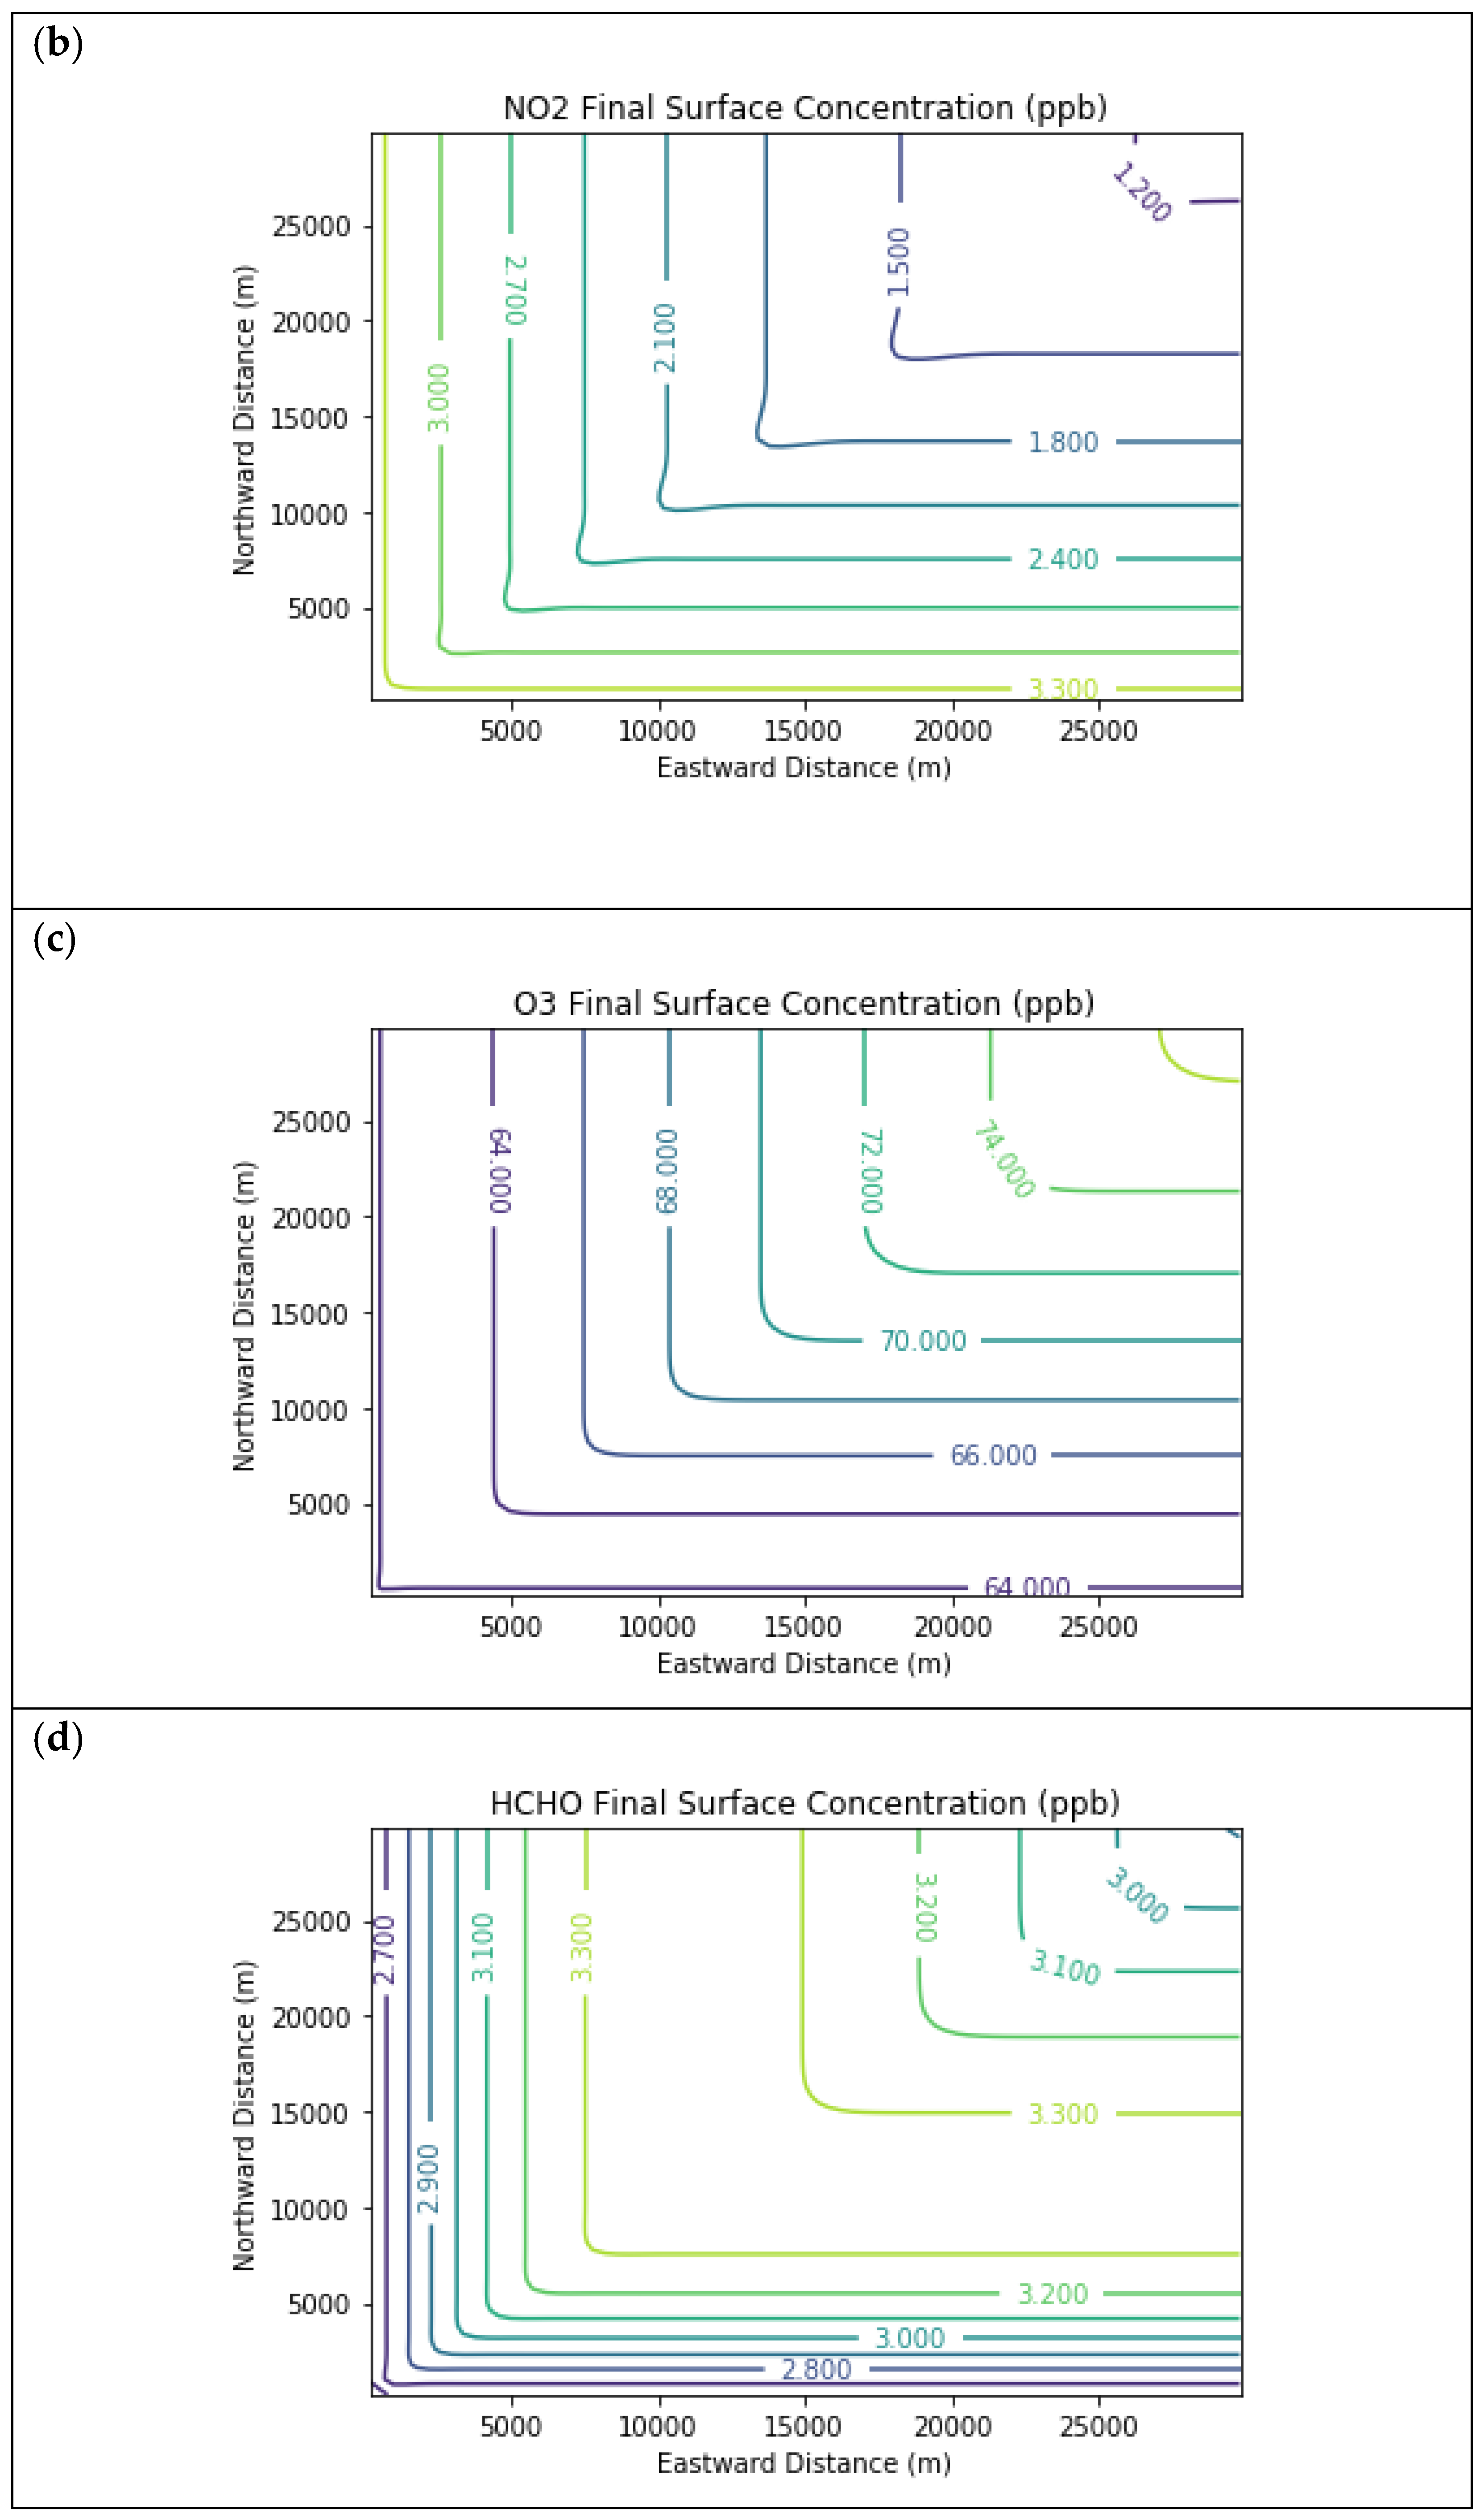
Figure 6 displays surface concentration isopleths for ozone and key precursors for the Baseline scenario, but for the larger 30 km × 30 km domain. In this scenario, the downwind edge of the far-field domain surpassed the inflow ozone concentration due to longer-range photochemical reactions, which also consumed NOx down to about a third of the boundary conditions. Meanwhile, the far-field methane concentration decayed nearly to the global background value with no interior sources in the domain. Formaldehyde peaked in the interior of the far-field domain at 3.3 ppb due to secondary formation.
Figure 7 presents the additional ozone formed due to landfill combustion emissions in the Combustion Only scenario over and above that in the Baseline scenario. Maximum ozone enhancements were over 1 ppb over a broad segment of the downwind plume.
Figure 8 and Figure 9 show the ozone and methane increments resulting from the addition of landfill fugitive emissions of ozone precursors in the Fugitives + Combustion scenario. Note that the methane increment exceeded 100 ppb all the way to the downwind edge of the far-field domain. The ozone increment exceeded 0.1 ppb beginning at about 16 km downwind of the hypothetical landfill and maximized at the domain edge.
The ozone increment of over 0.1 ppb due to landfill fugitive emissions is significant considering that it was due to a single source only. Additional ozone would result from landfill gas leaks if there were outside emissions of ozone precursors. Emissions from mobile sources, for example, would tend to counteract the NOx-limited conditions assumed in this study and attribute more importance to methane as a radical extender, as well as to formaldehyde as a radical precursor. It is therefore plausible that the ozone increment of a large leak of landfill gas in a real-life setting could be several tenths of a ppb, a significant fraction of the ozone design value reductions needed to bring Southeast Michigan into attainment of the U.S. federal ozone standard. This is in addition to the ozone increment of around 1 ppb due solely to landfill combustion activities.

4. Discussion

The boundary conditions and local emission scenarios assumed for these numerical experiments guarantee that ambient ozone will be more sensitive to emissions of NOx than to those of organic species, including methane. It is therefore not surprising that the majority of downwind ozone attributable to the hypothetical landfill in this study was due to combustion emissions, rather than fugitives.
Most landfills are located away from the urban core, that is, away from areas where there are dense traffic emissions and industrial point sources at which large combustion activities take place. The urban core is more likely to have areas that are radical-limited (“VOC-limited” in traditional parlance) rather than NOx-limited, although the progression towards cleaner motor vehicles may make this a less-frequent occurrence. Koplitz et al. [43] used the higher-order direct decoupled method (HDDM) for sensitivity analysis within the CAMx regional air quality model at 12 km horizontal resolution to examine ozone chemical sensitivity in 49 ozone non-attainment areas across the United States. They found a trend towards NOx-limitation in most areas of the country between 2007 and 2016, including Southeast Michigan. However, the coarse spatial resolution they used in their modeling study could not capture fine-scale features in emissions and/or meteorology, such as lake breeze fronts.
Land-lake breezes in the Great Lakes region were a prominent feature studied during the Border Air Quality and Meteorology Study (BAQS-MET) [44] and the 2015 Pan American Games in Toronto [45]. Using a 2.5 km horizontal resolution version of the combined Global Environmental Multi-scale (GEM) and Modeling Air Quality and Chemistry (MACH) modeling system (GEM-MACH), Stroud et al. [45] discovered that the most efficient ozone production tends to occur in the updraft region of lake breeze fronts where NOx emissions are diluted. More recent high-resolution GEM-MACH simulations indicate that inland frontal boundaries create a region of high ozone in Southeast Michigan which tends to be radical-limited rather than NOx-limited [46]. Some of the landfills shown in Figure 1 are precisely in this region. This would enhance the impact of landfill emissions of formaldehyde and unburned landfill gas on downwind ozone.
Analyses of stationary source formaldehyde emissions by the State of New Jersey in 2017 indicated that 64% of these state-wide emissions were from the combustion of landfill gas [15]. In this study, a hypothetical landfill’s combustion activities enhanced ambient formaldehyde near the source by up to 0.68 ppb. To put this enhancement in context, the 2019 maximum annual mean concentration of HCHO in Detroit measured using the DNPH cartridge technique was 3.4 μg/m3 or 2.7 ppb [47], which is similar to the background concentration assumed in this study for a single day in summer. In the autumn of 2018 through the summer of 2019, Liu et al. [48] conducted DNPH cartridge measurements of carbonyls in Taiyuan, China where the coking and steel industries have a significant presence. They found an annual mean HCHO concentration in ambient air of 7.7 μg/m3 or 6.3 ppb. Thus, even in a heavily industrialized setting, a single landfill facility may be responsible for a significant fraction of total formaldehyde exposure near the source, assuming that its combustion activities are steady on an annual basis.
As for fugitive emissions from landfills, the amount and speciation of NMOCs in landfill gas, as well as the volume and frequency of methane leaks in Southeast Michigan, are not yet fully understood. One particular class of NMOCs is Volatile Chemical Products (VCPs), which are typically solvents or other VOCs used in industrial processes as well as in everyday items, such as personal care products, general cleaners, architectural coatings, pesticides, adhesives, and printing inks. Emissions of VCPs may be significantly underestimated in official inventories [49,50], and this may include emissions from landfills. As of this writing, a major air quality field study known as the Michigan-Ontario Ozone Source Experiment (MOOSE) is being conducted in Southeast Michigan to better measure emissions of methane, formaldehyde, and VCPs from landfills and other sources using advanced real-time monitoring and remote sensing technologies [51].

5. Summary and Conclusions

Prior to this study, landfills had yet to be scrutinized in detail regarding their impacts on ambient ozone stemming from combustion activities and leaks of landfill gas, the organic emissions of which are likely underestimated. A state-of-the-art, fine-scale 3D Eulerian chemical transport model was used to demonstrate that emissions of ozone precursors from a single hypothetical landfill under NOx-limited conditions typical of areas outside the urban core may result in persistent daytime additions to ozone of over 1 ppb (the SIL used as an ozone threshold in NSR permit evaluation by the State of Michigan) tens of kilometers downwind during a high ozone episode. Large leaks of landfill gas can enhance this ozone pollution by over a tenth of a ppb, and external sources of non-methane ozone precursors may further increase this impact. In addition, landfill gas combustion may increase near-source exposure to toxic formaldehyde by well over half a ppb.
In Southeast Michigan, the combined influence of several landfills upwind of key monitoring sites may contribute significantly to observed exceedances of the U.S. ozone standard, given the southwesterly flow that often accompanies these exceedances. Control of landfill emissions of methane, formaldehyde, and other ozone precursors is thus a potentially important strategy for ozone attainment in Southeast Michigan.
To counteract the ozone impacts of landfills, enhanced control of NOx and primary formaldehyde emissions from landfill stationary engines may be required. One caveat is that control strategies that increase temperature or excess air to prevent formaldehyde generation may increase NOx emissions. Control options include lean-burn engines, afterburners, catalytic oxidizers, and pre-combustion cleanup of siloxane gases to achieve more complete combustion. Greater attention is also needed to the quantification of fugitive methane and accompanying NMOC emissions using advanced techniques, such as drone-mounted sensors. This will help better identify appropriate leak mitigation measures, examples of which are improved landfill cover and gas recovery systems.

Supplementary Materials

The following are available online at https://www.mdpi.com/article/10.3390/atmos12070877/s1, Documentation of the MicroFACT_SIP chemical mechanism. Table S1: Sample molar assignments to surrogate species. Table S2: Chemical abbreviations. Table S3: MicroFACT_SIP chemical mechanism reactions. Table S4: Daytime chemical production and loss coefficients of long-lived species. Table S5: Chemical Jacobian terms (daytime only). Table S6: Nighttime chemical production and loss coefficients of long-lived species. Table S7: Initial conditions for box model run. Table S8: Box model run parameters. Figure S1: NO concentrations predicted by MicroFACT_SIP (solid line) versus MCMv3.3.1 (dashed line) for the box model experiment. Figure S2: Same as in Figure S1, but for NO2. Figure S3: Same as in Figure S1, but for O3. Figure S4: Same as in Figure S1, but for HONO. Figure S5: Same as in Figure S1, but for HCHO. Figure S6: Same as in Figure S1, but for HNO3.

Funding

This research received no external funding.

Institutional Review Board Statement

Not applicable.

Informed Consent Statement

Not applicable.

Data Availability Statement

Acknowledgments

Shelley Jeltema of the Michigan Department of Technology, Management, and Budget produced Figure 1. Kirk Baker of the USEPA Office of Air Quality Planning and Standards provided output from the CMAQ model.

Conflicts of Interest

The author declares no conflict of interest.

References

  1. Basic Information about Landfill Gas. Available online: https://www.epa.gov/lmop/basic-information-about-landfill-gas (accessed on 24 March 2021).
  2. Stocker, T.F.; Qin, D.; Plattner, G.-K.; Tignor, M.; Allen, S.K.; Boschung, J.; Nauels, A.; Xia, Y.; Bex, V.; Midgley, P.M. Intergovernmental panel on climate change (IPCC). In Climate Change 2013: The Physical Science Basis. Contribution of Working Group I to the Fifth Assessment Report of the Intergovernmental Panel on Climate Change; Cambridge University Press: Cambridge, UK; New York, NY, USA, 2013; p. 509. [Google Scholar]
  3. West, J.J.; Fiore, A.M. Management of tropospheric ozone by reducing methane emissions. Environ. Sci. Technol. 2005, 39, 4685–4691. [Google Scholar] [CrossRef] [Green Version]
  4. U.S. Code of Federal Regulations, Title 40, Chapter I, Subchapter C, Part 51, Subpart F, Section 51.100. Available online: https:/www.ecfr.gov/cgi-bin/text-idx?SID=e0c5c3051512c0d6b780c0a78597a2d7&mc=true&node=pt40.2.51&rgn=div5#sp40.2.51.f (accessed on 2 July 2021).
  5. McKain, K.; Down, A.; Raciti, S.M.; Budney, J.; Hutyra, L.R.; Floerchinger, C.; Herndon, S.C.; Nehrkorn, T.; Zahniser, M.S.; Jackson, R.B.; et al. Methane emissions from natural gas infrastructure and use in the urban region of Boston, Massachusetts. Proc. Natl. Acad. Sci. USA 2015, 112, 1941–1946. [Google Scholar] [CrossRef] [Green Version]
  6. Von Fischer, J.C.; Cooley, D.; Chamberlain, S.; Gaylord, A.; Griebenow, C.J.; Hamburg, S.P.; Salo, J.; Schumacher, R.; Theobald, D.; Ham, J. Rapid, vehicle-based identification of location and magnitude of urban natural gas pipeline leaks. Environ. Sci. Technol. 2017, 51, 4091–4099. [Google Scholar] [CrossRef] [PubMed]
  7. Phillips, N.G.; Ackley, R.; Crosson, E.R.; Down, A.; Hutyra, L.R.; Brondfield, M.; Karr, J.D.; Zhao, K.; Jackson, R.B. Mapping urban pipeline leaks: Methane leaks across Boston. Environ. Pollut. 2013, 173, 1–4. [Google Scholar] [CrossRef] [PubMed]
  8. Schiermeier, Q. Global methane levels soar to record high. Nature 2020. [Google Scholar] [CrossRef] [PubMed]
  9. U.S. Environmental Protection Agency. Landfill Gas Emissions Model (LandGEM) Version 3.02 User’s Guide; EPA-600/R-05/047; Office of Research and Development: Washington, DC, USA, 2005.
  10. Duren, R.; Thorpe, A.; McCubbin, I. The California Methane Survey; CEC-500-2020-047; California Energy Commission: Sacramento, CA, USA, 2020. [Google Scholar]
  11. Duren, R.; Thorpe, A.; Foster, K.T.; Rafiq, T.; Hopkins, F.M.; Yadav, V.; Bue, B.; Thompson, D.R.; Conley, S.; Colombi, N.; et al. California’s methane super-emitters. Nature 2019, 575, 180–184. [Google Scholar] [CrossRef] [PubMed] [Green Version]
  12. Janson, J.L.; Yesiller, N.; Manheim, D.C. Estimation and Comparison of Methane, Nitrous Oxide, and Trace Volatile Organic Compound Emissions and Gas Collection System Efficiencies in California Landfills; California Polytechnic State University: San Luis Obispo, CA, USA, 2020. [Google Scholar]
  13. Olaguer, E.P.; Rappenglück, B.; Lefer, B.; Stutz, J.; Dibb, J.; Griffin, R.; Brune, W.H.; Shauck, M.; Buhr, M.; Jeffries, H.; et al. Deciphering the role of radical precursors during the Second Texas Air Quality Study. J. Air Waste Manag. Assoc. 2009, 59, 1258–1277. [Google Scholar] [CrossRef] [PubMed] [Green Version]
  14. Olaguer, E.P.; Kolb, C.E.; Lefer, B.; Rappenglück, B.; Zhang, R.; Pinto, J.P. Overview of the SHARP campaign: Motivation, design, and major outcomes. J. Geophys. Res. Atmos. 2014, 119, 2597–2610. [Google Scholar] [CrossRef]
  15. Ratzman, K. Formaldehyde Emissions from Landfill Gas and Natural Gas Engines; Mid-Atlantic Regional Air Management Association (MARAMA) Air Toxics Workshop: Towson, MD, USA, 2018. [Google Scholar]
  16. Cestone, R.M. Formaldehyde emissions from combustion sources and its contributions toward volatile organic compounds and hazardous air pollutants. In Proceedings of the New Jersey Water Environment Association Conference, Atlantic City, NJ, USA, 8 May 2018. [Google Scholar]
  17. Torres, V.; Allen, D.; Herndon, S. TCEQ 2010 Flare Study Report; Houston-Galveston Area Council: Houston, TX, USA, 2011. [Google Scholar]
  18. Olaguer, E.P. Atmospheric Impacts of the Oil and Gas Industry; Elsevier: Amsterdam, The Netherlands, 2017; pp. 124–126. [Google Scholar]
  19. U.S. Environmental Protection Agency. Guidance on the Development of Modeled Emission Rates for Precursors (MERPs) as a Tier 1 Demonstration Tool for Ozone and PM2.5 under the PSD Permitting Program; EPA-454/R-19-003; Office of Air Quality Planning and Standards: Research Triangle Park, NC, USA, 2019.
  20. Olaguer, E.P. Adjoint model enhanced plume reconstruction from tomographic remote sensing measurements. Atmos. Environ. 2011, 45, 6980–6986. [Google Scholar] [CrossRef]
  21. Olaguer, E.P. The potential near source ozone impacts of upstream oil and gas industry emissions. J. Air Waste Manag. Assoc. 2012, 62, 966–977. [Google Scholar] [CrossRef]
  22. Olaguer, E.P. Near source air quality impacts of large olefin flares. J. Air Waste Manag. Assoc. 2012, 62, 978–988. [Google Scholar] [CrossRef]
  23. Olaguer, E.P. Application of an adjoint neighborhood scale chemistry transport model to the attribution of primary formaldehyde at Lynchburg Ferry during TexAQS II. J. Geophys. Res. Atmos. 2013, 118, 4936–4946. [Google Scholar] [CrossRef]
  24. Colella, P.; Woodward, P.R. The piecewise parabolic method (PPM) for gas-dynamical simulations. J. Comput. Phys. 1984, 54, 174–201. [Google Scholar] [CrossRef] [Green Version]
  25. Bott, A. A positive definite advection scheme obtained by nonlinear renormalization of the advective fluxes. Mon. Weather Rev. 1989, 117, 1006–1015. [Google Scholar] [CrossRef]
  26. Smolarkiewicz, P.K. A fully multi-dimensional positive definite advection transport algorithm with small implicit diffusion. J. Comput. Phys. 1984, 54, 325–362. [Google Scholar] [CrossRef]
  27. Jet Propulsion Laboratory (JPL). Chemical Kinetics and Photochemical Data for Use in Atmospheric Studies, Evaluation Number 19; Publication 19-5; NASA JPL: Pasadena, CA, USA, 2020. [Google Scholar]
  28. Jet Propulsion Laboratory (JPL). Chemical Kinetics and Photochemical Data for Use in Atmospheric Studies, Evaluation Number 15; Publication 06-2; NASA JPL: Pasadena, CA, USA, 2006. [Google Scholar]
  29. Atkinson, R.A.; Baulch, D.L.; Cox, R.A.; Crowley, J.N.; Hampson, R.F.; Hynes, R.G.; Jenkin, M.E.; Kerr, J.A.; Rossi, M.J.; Troe, J. Evaluated Kinetic and Photochemical Data for Atmospheric Chemistry. IUPAC Subcommittee on Gas Kinetic Data Evaluation for Atmospheric Chemistry. 2010. Available online: http://iupac.pole-ether.fr (accessed on 26 March 2021).
  30. Ammann, M.; Cox, R.A.; Crowley, J.N.; Jenkin, M.E.; Mellouki, A.; Rossi, M.J.; Troe, J.; Wallington, T.J. Evaluated kinetic and photochemical data for atmospheric chemistry: Volume VI—heterogeneous reactions with liquid substrates. Atmos. Chem. Phys. 2013, 13, 8045–8228. [Google Scholar] [CrossRef] [Green Version]
  31. Fu, X.; Wang, T.; Zhang, L.; Li, Q.; Wang, Z.; Xia, M.; Yun, H.; Wang, W.; Yu, C.; Yue, D.; et al. The significant contribution of HONO to secondary pollutants during a severe winter pollution event in southern China. Atmos. Chem. Phys. 2019, 9, 1–14. [Google Scholar] [CrossRef] [Green Version]
  32. Hertel, O.; Berkowicz, R.; Christensen, J. Test of two numerical schemes for use in atmospheric transport-chemistry models. Atmos. Environ. 1993, 27A, 2591–2611. [Google Scholar] [CrossRef]
  33. Saunders, S.M.; Jenkin, M.E.; Derwent, R.G.; Pilling, M.J. Protocol for the development of the Master Chemical Mechanism, MCM v3 (Part A): Tropospheric degradation of non-aromatic volatile organic compounds. Atmos. Chem. Phys. 2003, 3, 161–180. [Google Scholar] [CrossRef] [Green Version]
  34. Yarwood, G.; Whitten, G.Z.; Jung, J.; Heo, G.; Allen, D.T. Development, Evaluation and Testing of Version 6 of the Carbon Bond Chemical Mechanism (CB6); Texas Commission on Environmental Quality: Austin, TX, USA, 2010. [Google Scholar]
  35. Yarwood, G.; Rao, S.; Yocke, M.; Whitten, G.Z. Updates to the Carbon Bond Mechanism: CB05; Environmental Protection Agency: Research Triangle Park, NC, USA, 2005. [Google Scholar]
  36. Byun, D.W.; Ching, J.K.S. Science Algorithms of the EPA Models-3 Community Multiscale Air Quality (CMAQ) Modeling System; EPA/600/R-99/030 (NTIS PB2000-100561); Environmental Protection Agency: Washington, DC, USA, 1999. [Google Scholar]
  37. Singh, B.; Hansen, B.S.; Brown, M.J.; Pardyjak, E.R. Evaluation of the QUIC-URB fast response urban wind model for a cubical building array and wide building street canyon. Environ. Fluid Mech. 2008, 8, 281–312. [Google Scholar] [CrossRef]
  38. Skamarock, W.C.; Klemp, J.B.; Dudhia, J.; Gill, D.O.; Liu, Z.; Berner, J.; Wang, W.; Powers, J.G.; Duda, M.G.; Barker, D.; et al. A Description of the Advanced Research WRF Model Version 4; NCAR/TN-556+STR; National Center for Atmospheric Research: Boulder, CO, USA, 2019. [Google Scholar] [CrossRef]
  39. Courant, R.; Friedrichs, K.; Lewy, H. Über die partiellen differenzengleichungen der mathematischen physic. Math. Ann. 1928, 100, 32–74. [Google Scholar] [CrossRef]
  40. Zhang, L.; Brook, J.R.; Vet, R. A revised parameterization for gaseous dry deposition in air-quality. Atmos. Chem. Phys. 2003, 3, 2067–2082. [Google Scholar] [CrossRef] [Green Version]
  41. Zhang, L.; Jacob, D.J.; Knipping, E.M.; Kumar, N.; Munger, J.W.; Carouge, C.C.; van Donkelaar, A.; Wang, Y.X.; Chen, D. Nitrogen deposition to the United States: Distribution, sources, and processes. Atmos. Chem. Phys. 2012, 12, 4539–4554. [Google Scholar] [CrossRef] [Green Version]
  42. Kleffmann, J.; Kurtenbach, R.; Lörzer, J.C.; Wiesen, P.; Kalthoff, N.; Vogel, N.; Vogel, B. Measured and simulated vertical profiles of nitrous acid. Part I: Field measurements. Atmos. Environ. 2003, 37, 2949–2955. [Google Scholar] [CrossRef]
  43. Koplitz, S.; Simon, H.; Henderson, B.; Liljegren, J.; Tonneson, G.; Whitehill, A.; Wells, B. Changes in ozone chemical sensitivity in the US from 2007 to 2016. 2021. manuscript in preparation. [Google Scholar]
  44. Brook, J.R.; Makar, P.A.; Sills, D.M.L.; Hayden, K.L.; McLaren, R. Exploring the nature of air quality over southwestern Ontario: Main findings from the Border Air Quality and Meteorology Study. Atmos. Chem. Phys. 2013, 13, 10461–10482. [Google Scholar] [CrossRef] [Green Version]
  45. Stroud, C.A.; Ren, S.; Zhang, J.; Moran, M.; Akingunola, A.; Makar, P.; Munoz, R.A.; Leroyer, S.; Bélair, S.; Sills, D.; et al. Chemical analysis of surface-level ozone exceedances during the 2015 Pan American Games. Atmosphere 2020, 11, 572. [Google Scholar] [CrossRef]
  46. Stroud, C.A.; (Air Quality Research Division, Environment and Climate Change Canada, Toronto, ON M3H 5T4, Canada). Personal communication, 2021.
  47. Michigan Department of Environment, Great Lakes, and Energy (EGLE). Air Quality Annual Report 2019; EGLE: Lansing, MI, USA, 2020; p. 112.
  48. Liu, Z.; Cui, Y.; He, Q.; Guo, L.; Gao, X.; Feng, Y.; Wang, Y.; Wang, X. Seasonal variations of carbonyls and their contributions to the ozone formation in urban atmosphere of Taiyuan, China. Atmosphere 2021, 12, 510. [Google Scholar] [CrossRef]
  49. McDonald, B.C.; Joost, A.; de Gouw, J.A.; Gilman, J.B.; Jathar, S.H.; Akherati, A.; Cappa, C.D.; Jimenez, J.L.; Lee-Taylor, J.; Hayes, P.L.; et al. Volatile chemical products emerging as largest petrochemical source of urban organic emissions. Science 2018, 359, 760–764. [Google Scholar] [CrossRef] [Green Version]
  50. Seltzer, K.M.; Pennington, E.; Rao, V.; Murphy, B.N.; Strum, M.; Isaacs, K.K.; Pye, H.O.T. Reactive organic carbon emissions from volatile chemical products. Atmos. Chem. Phys. 2021, 21, 5079–5100. [Google Scholar] [CrossRef]
  51. Michigan-Ontario Ozone Source Experiment (MOOSE). Available online: https://www-air.larc.nasa.gov/missions/moose/index.html (accessed on 27 May 2021).
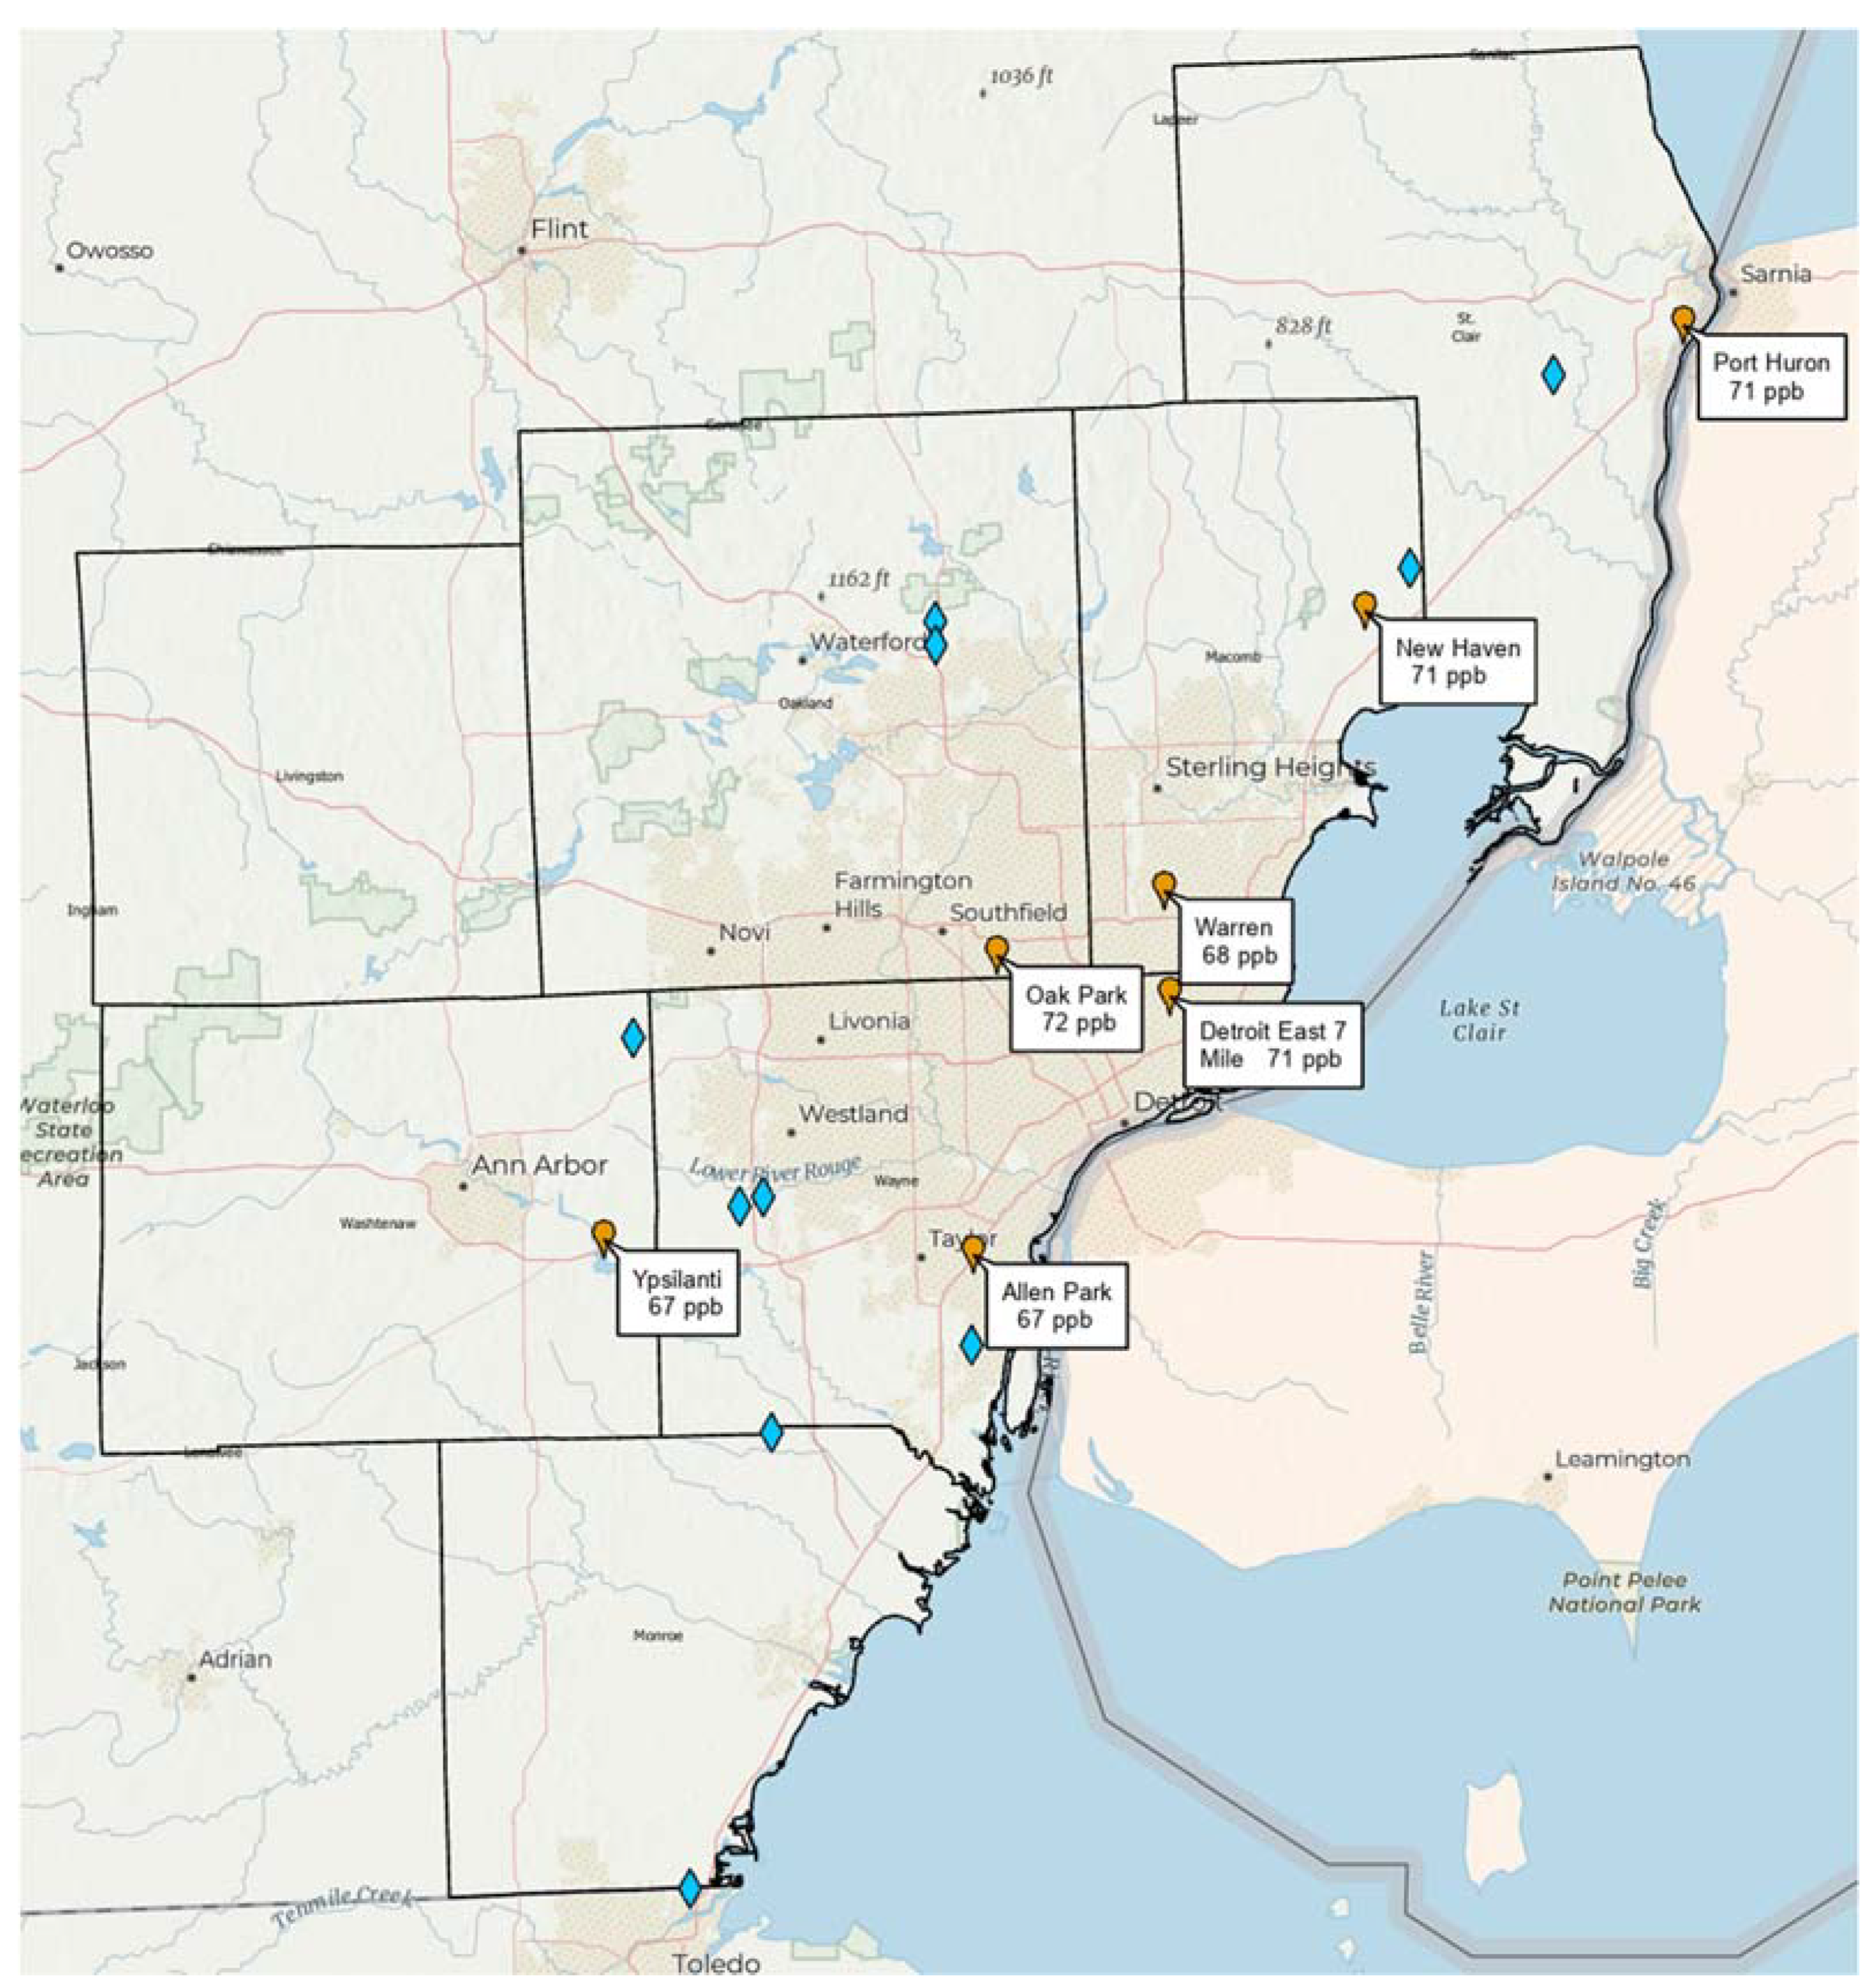
Figure 1. Locations of major solid waste landfills (blue diamonds) in the seven counties of the Southeast Michigan ozone non-attainment area relative to ozone monitoring stations (orange markers) run by the Michigan Department of Environment, Great Lakes, and Energy (EGLE). Stations are shown with corresponding 2018–2020 ozone design values.
Atmosphere 12 00877 g001
Figure 2. Profile of the vertical diffusivity used in the model simulations.
Atmosphere 12 00877 g002
Figure 3. Near Source: Baseline Scenario.Final surface concentrations of (a) NO, (b) NO2, (c) O3, (d) HCHO, (e) CH4, and (f) PAR at the end of the 3 h simulation in the Baseline scenario for the 4 km × 4 km domain.
Atmosphere 12 00877 g003aAtmosphere 12 00877 g003bAtmosphere 12 00877 g003c
Figure 4. Near Source: Combustion Only ― Baseline. Difference plots of (a) NO, (b) NO2, (c) O3, (d) HCHO, (e) CH4, and (f) PAR between the Combustion Only and Baseline scenarios at the end of the 3-h simulation for the 4 km × 4 km domain.
Atmosphere 12 00877 g004aAtmosphere 12 00877 g004b
Figure 5. Near Source: Fugitives + Combustion − Combustion Only. Difference plots of (a) NO, (b) NO2, (c) O3, (d) HCHO, (e) CH4, and (f) PAR between the Fugitives + Combustion and Combustion Only scenarios at the end of the 3-h simulation for the 4 km × 4 km domain.
Atmosphere 12 00877 g005aAtmosphere 12 00877 g005b
Figure 6. Near Source: Fugitives + Combustion − Combustion Only. Final surface concentrations of (a) NO, (b) NO2, (c) O3, (d) HCHO, (e) CH4, and (f) PAR at the end of the 3-h simulation in the Baseline scenario for the 30 km × 30 km domain.
Atmosphere 12 00877 g006aAtmosphere 12 00877 g006bAtmosphere 12 00877 g006c
Figure 7. Ozone difference plot between the Combustion Only and Baseline scenarios at the end of the 3 h simulation for the 30 km × 30 km domain.
Atmosphere 12 00877 g007
Figure 8. Ozone difference plot between the Fugitives + Combustion and Combustion Only scenarios at the end of the 3 h simulation for the 30 km × 30 km domain.
Atmosphere 12 00877 g008
Figure 9. Methane difference plot between the Fugitives + Combustion and Combustion Only scenarios at the end of the 3 h simulation for the 30 km × 30 km domain.
Atmosphere 12 00877 g009
Table 1. Meteorological parameters for an 8-h time period on 29 June 2018. Average values of the meteorological parameters over the 8-h period are bolded, along with the corresponding time span to distinguish them from hourly values.
Time (LST)Pressure (Pa)Temperature (K)Relative Humidity
10:0099,271301.740.54027
11:0099,235303.130.47248
12:0099,206304.190.43763
13:0099,174304.840.41445
14:0099,127305.050.41848
15:0099,081305.030.43777
16:0099,048304.920.46994
17:0099,027304.660.49497
10:00–18:0099,146304.200.46075
Table 2. Chemical boundary conditions derived from CMAQ 8 h average concentrations for 10:00–18:00 LST on 29 June 2018 at a location slightly north of Oak Park.
Chemical SpeciesSymbolBoundary
Condition (ppb)
Deposition
Velocity (cm/s)
Nitric OxideNO0.793
Nitrogen DioxideNO23.560.36
OzoneO370.30.42
Nitrous AcidHONO0.05761.9
FormaldehydeHCHO2.840.54
Carbon MonoxideCO260
EtheneC2H40.734
Propene 1C3H60.313
1,3-Butadiene 1C4H60.020
1-Butene 1BUT1ENE0.020
2-Butenes 2BUT2ENE0.075
Isobutene 1IBUTENE0.020
IsopreneISOP0.804
TolueneTOL0.480
XylenesXYL0.255
Organic NitratesRNO30.7010.32
Paraffinic BondPAR27.9
AcetaldehydeCH3CHO1.090.2
Methacrolein + MethylvinylketoneISPD0.5080.2
Peroxyacetyl NitratePAN0.7850.27
MethaneCH41904
MethanolMEOH2.200.7
EthanolETOH0.6970.6
Nitric AcidHNO32.492.7
TerpenesTERP0.0377
EthaneC2H61.58
Ketone BondKET5.42
GlyoxalGLY0.165
Methyl GlyoxalMGLY0.1470.2
Unsaturated Aldehyde from ARD 3OPEN0.0234
Unsaturated Ketone from ARD 3XOPN0.0165
CresolCRESOL0.01910.2
Higher AldehydeALDX0.596
Higher Peroxyacyl NitratePANX0.2900.4
NO3 + N2O5NO3X0.0006962.7
1 CMAQ species OLE (terminal olefin) assigned primarily to propene, with minor concentrations assigned to 1-butene, isobutene, and 1,3-butadiene. 2 BUT2ENE concentration derived from CMAQ species IOLE (internal olefin). 3 ARD = Aromatic Ring Decomposition.
Table 3. Combustion emissions of ozone precursors (tpy) for a hypothetical landfill.
NONO2HONOHCHOCOC2H4C3H6MEOH
100.5511.170.8922.27126.452.220.200.56
Table 4. Mass percentages of NMOC fugitive emissions for a hypothetical landfill.
PARC2H6TOLXYLETOHKET
86.97.764.540.370.360.07
Publisher’s Note: MDPI stays neutral with regard to jurisdictional claims in published maps and institutional affiliations.