Precipitation Regime Changes at Four Croatian Meteorological Stations
Abstract
:1. Introduction
2. Materials and Methods
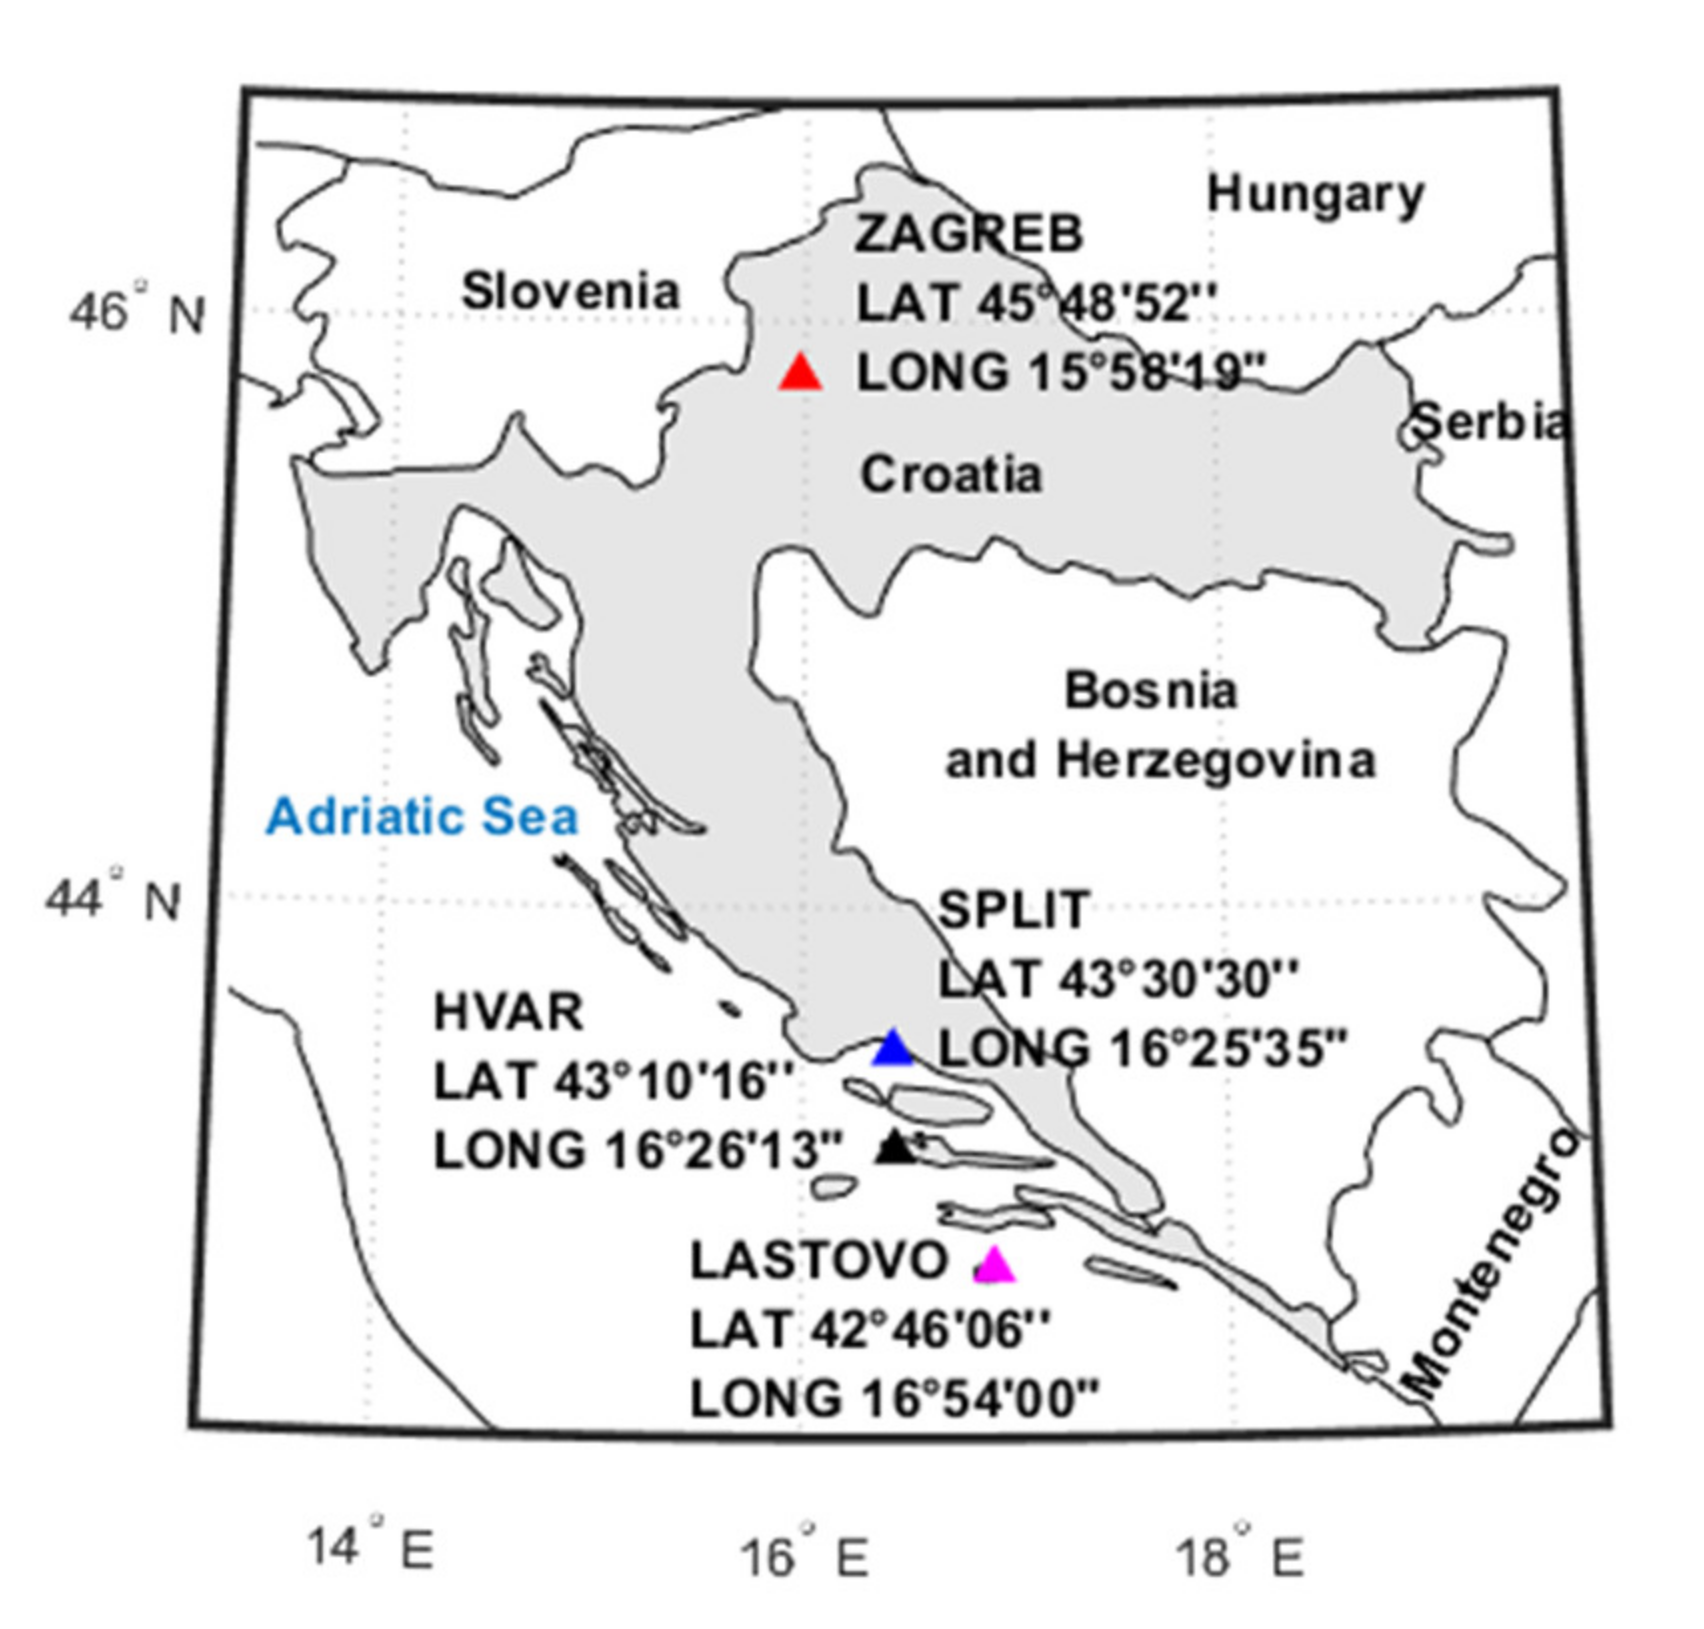
2.1. Stations and Data
2.2. Stations and Data
3. Results and Discussion
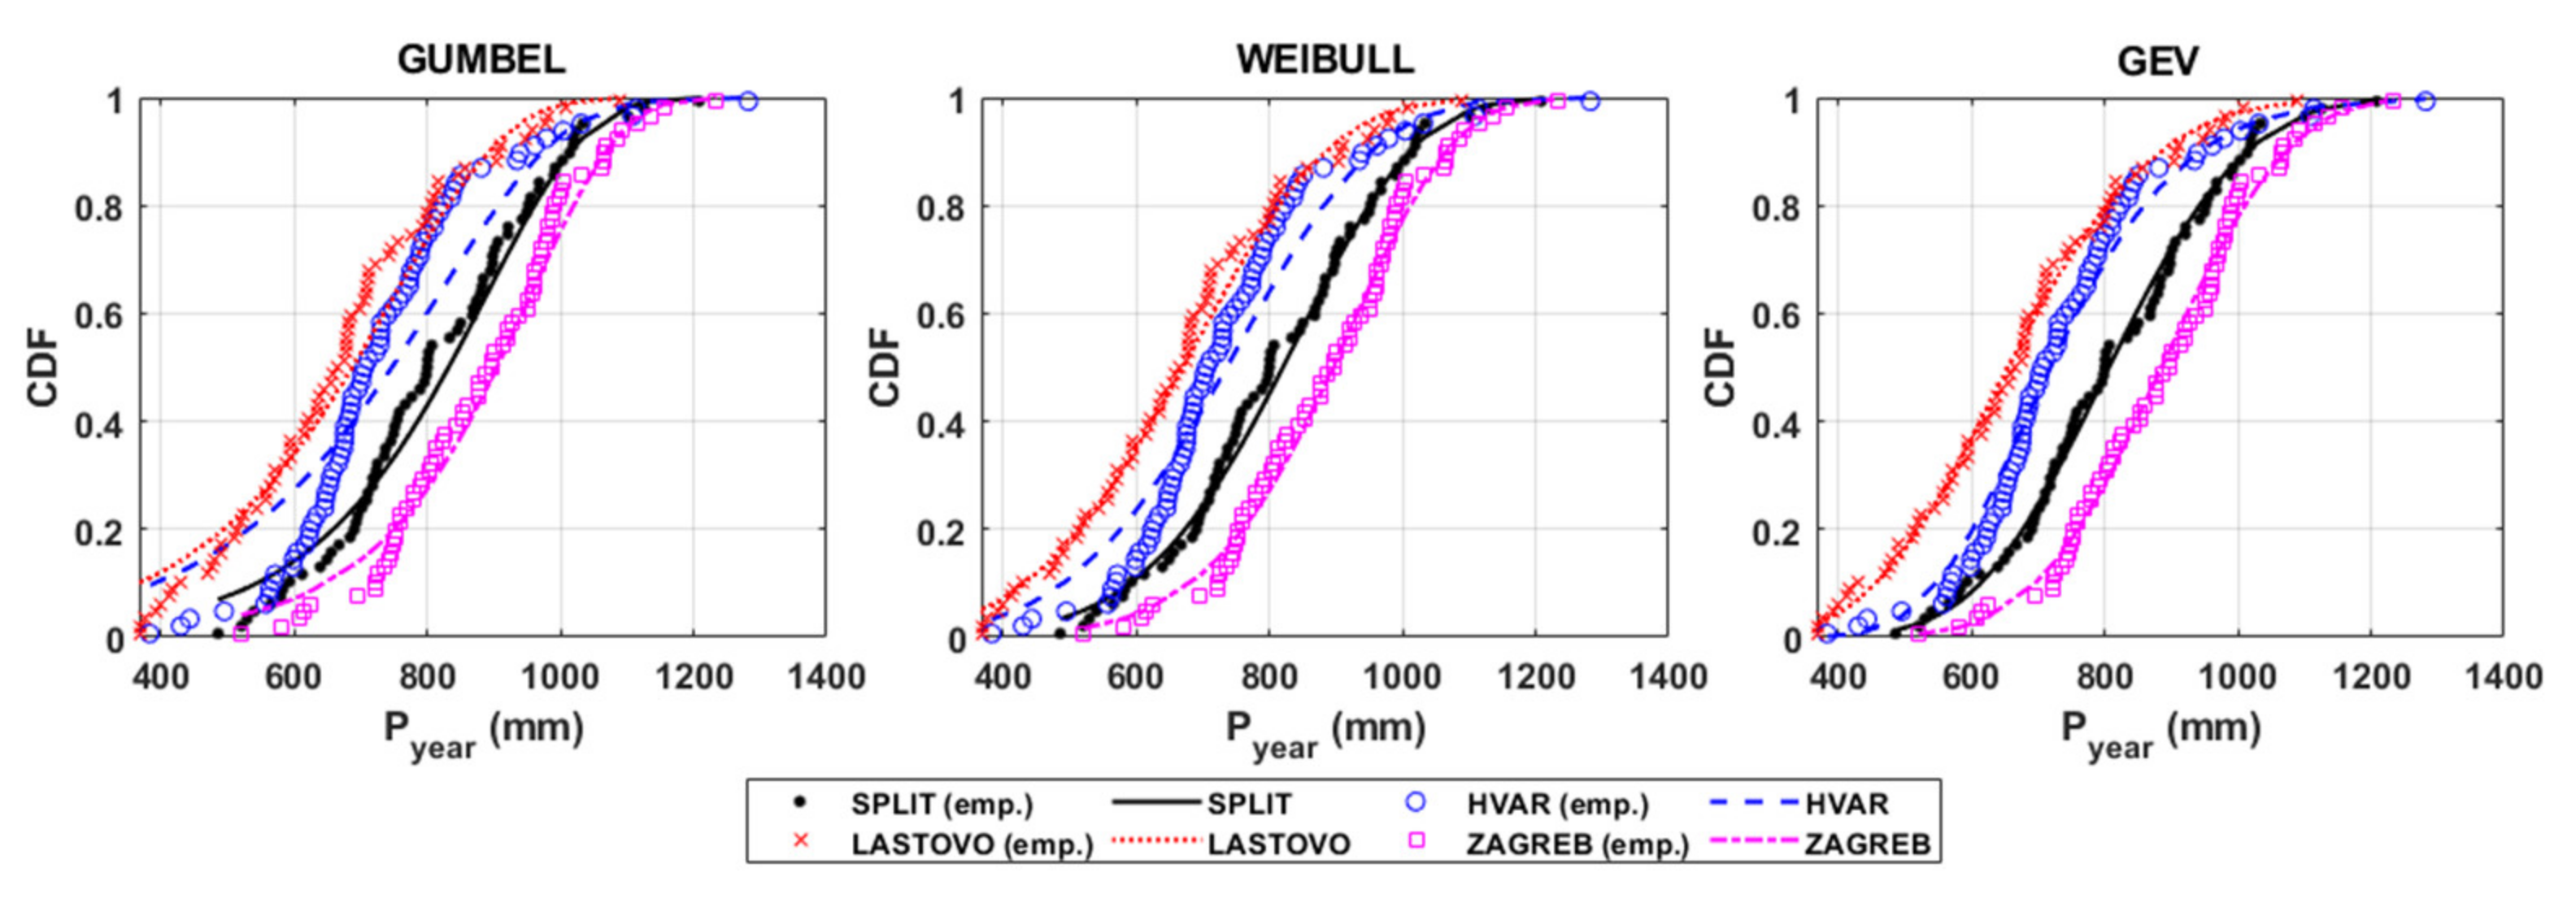
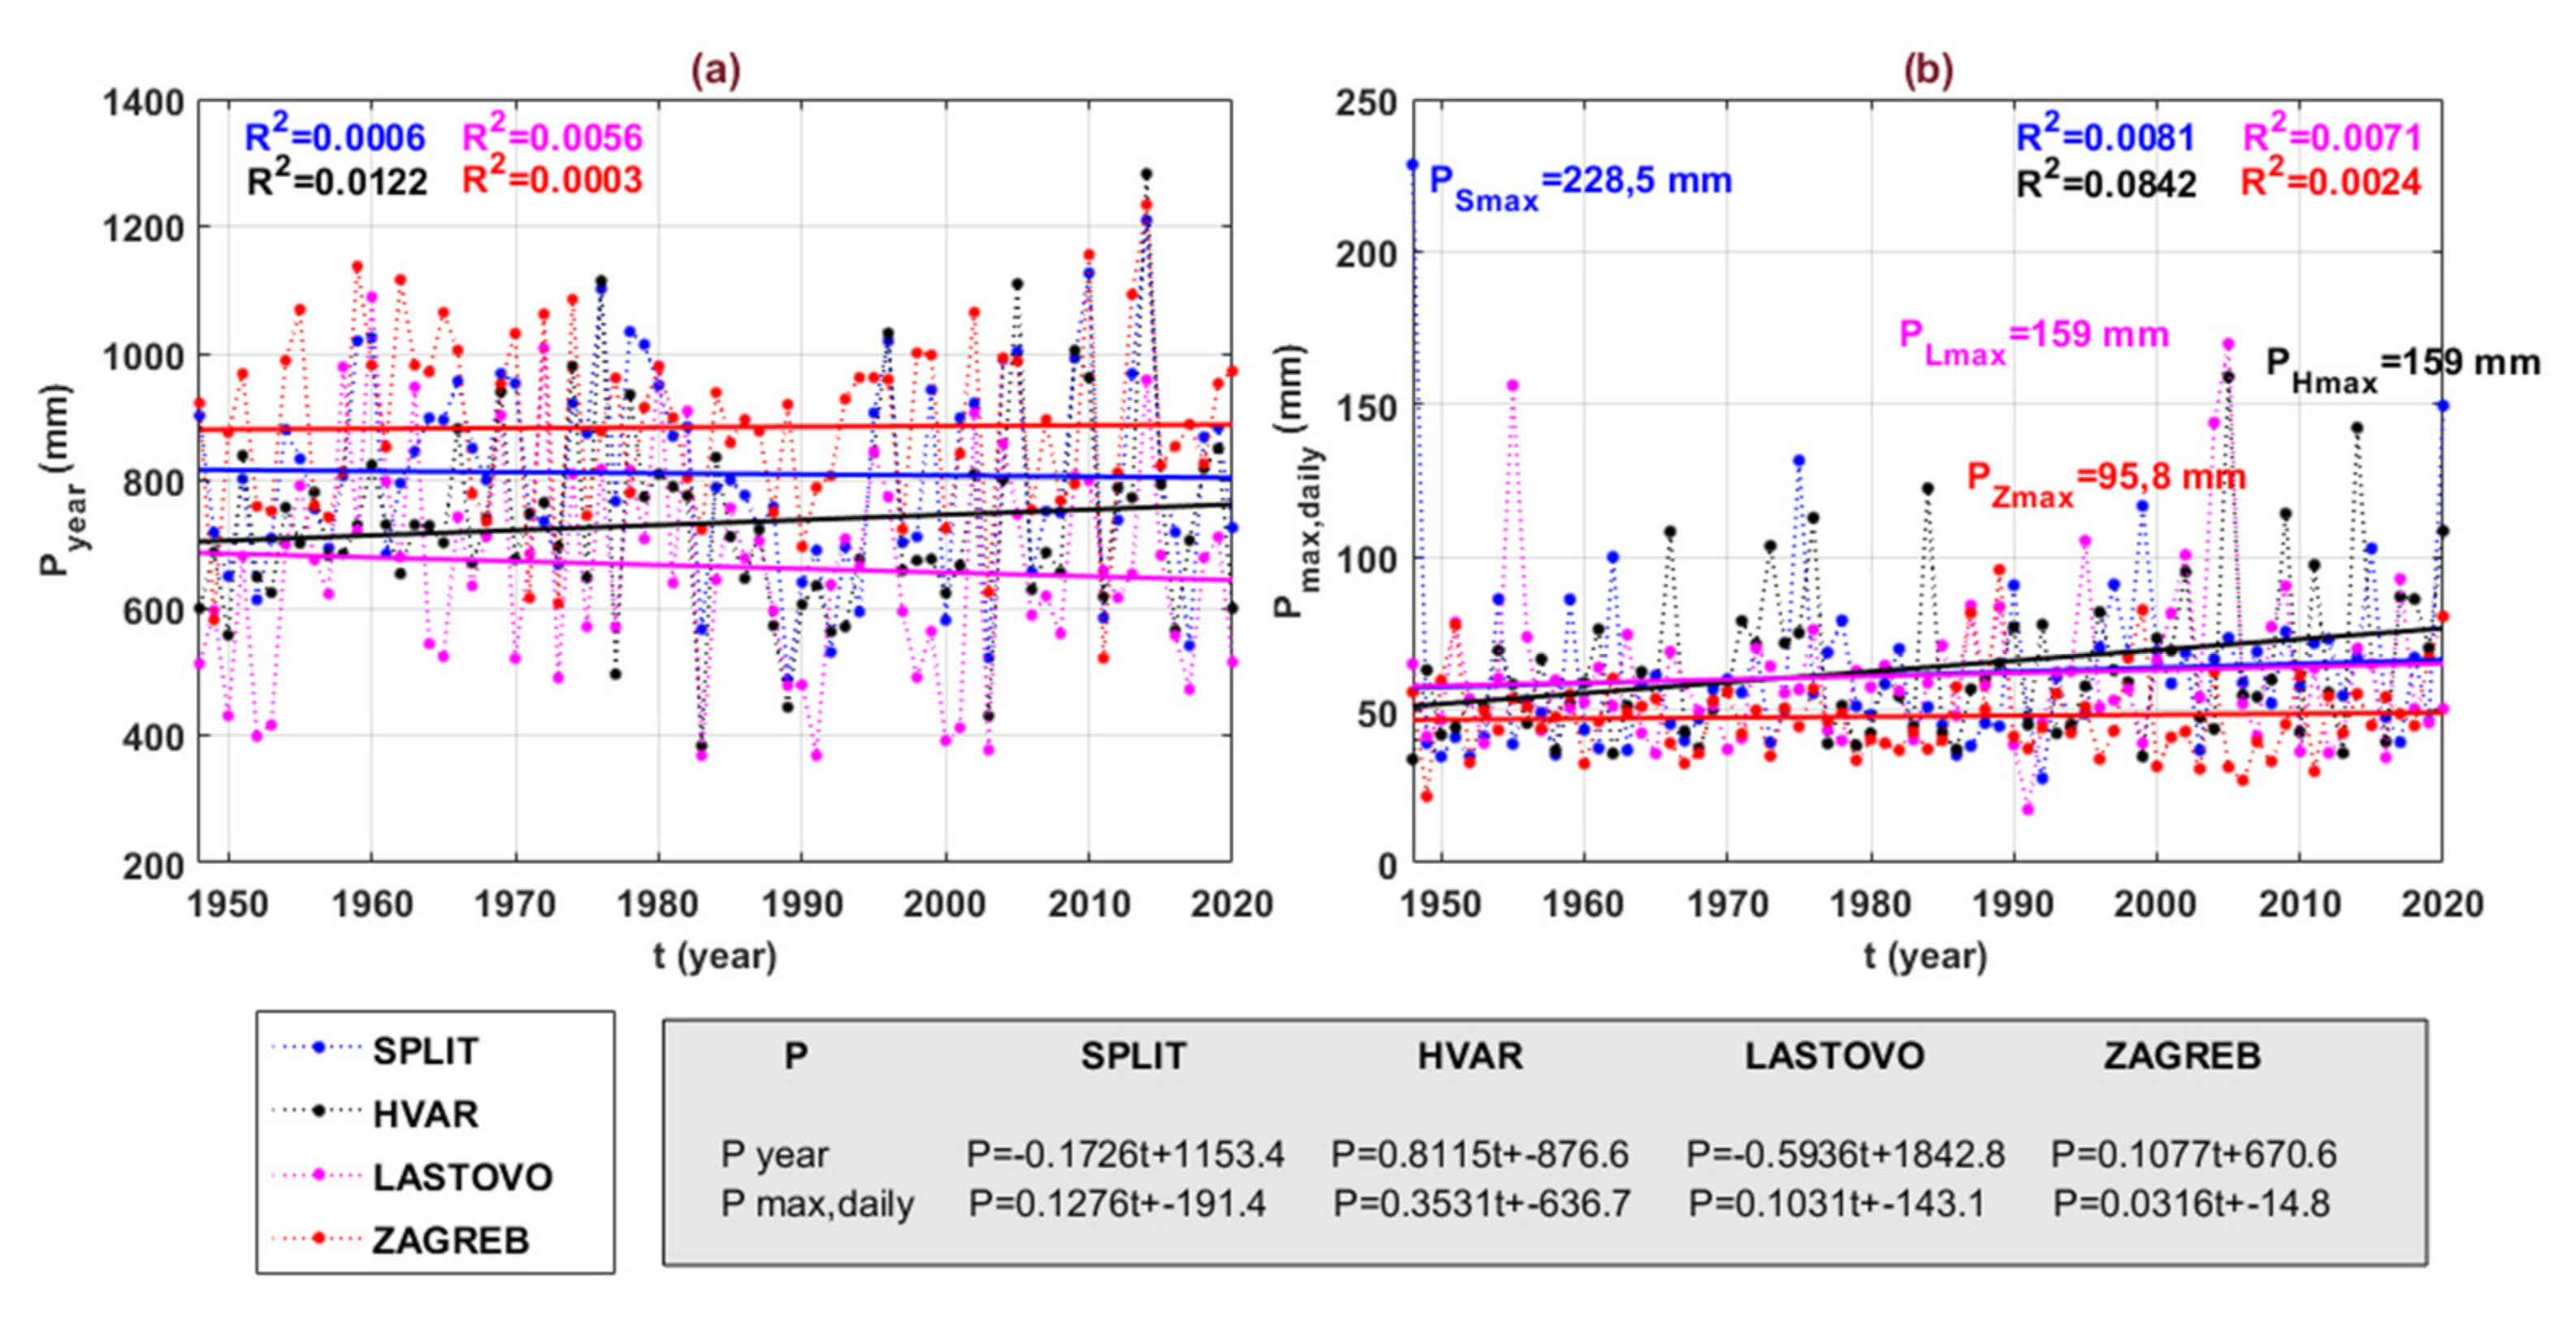
3.1. The Year as a Time Unit of Analyses
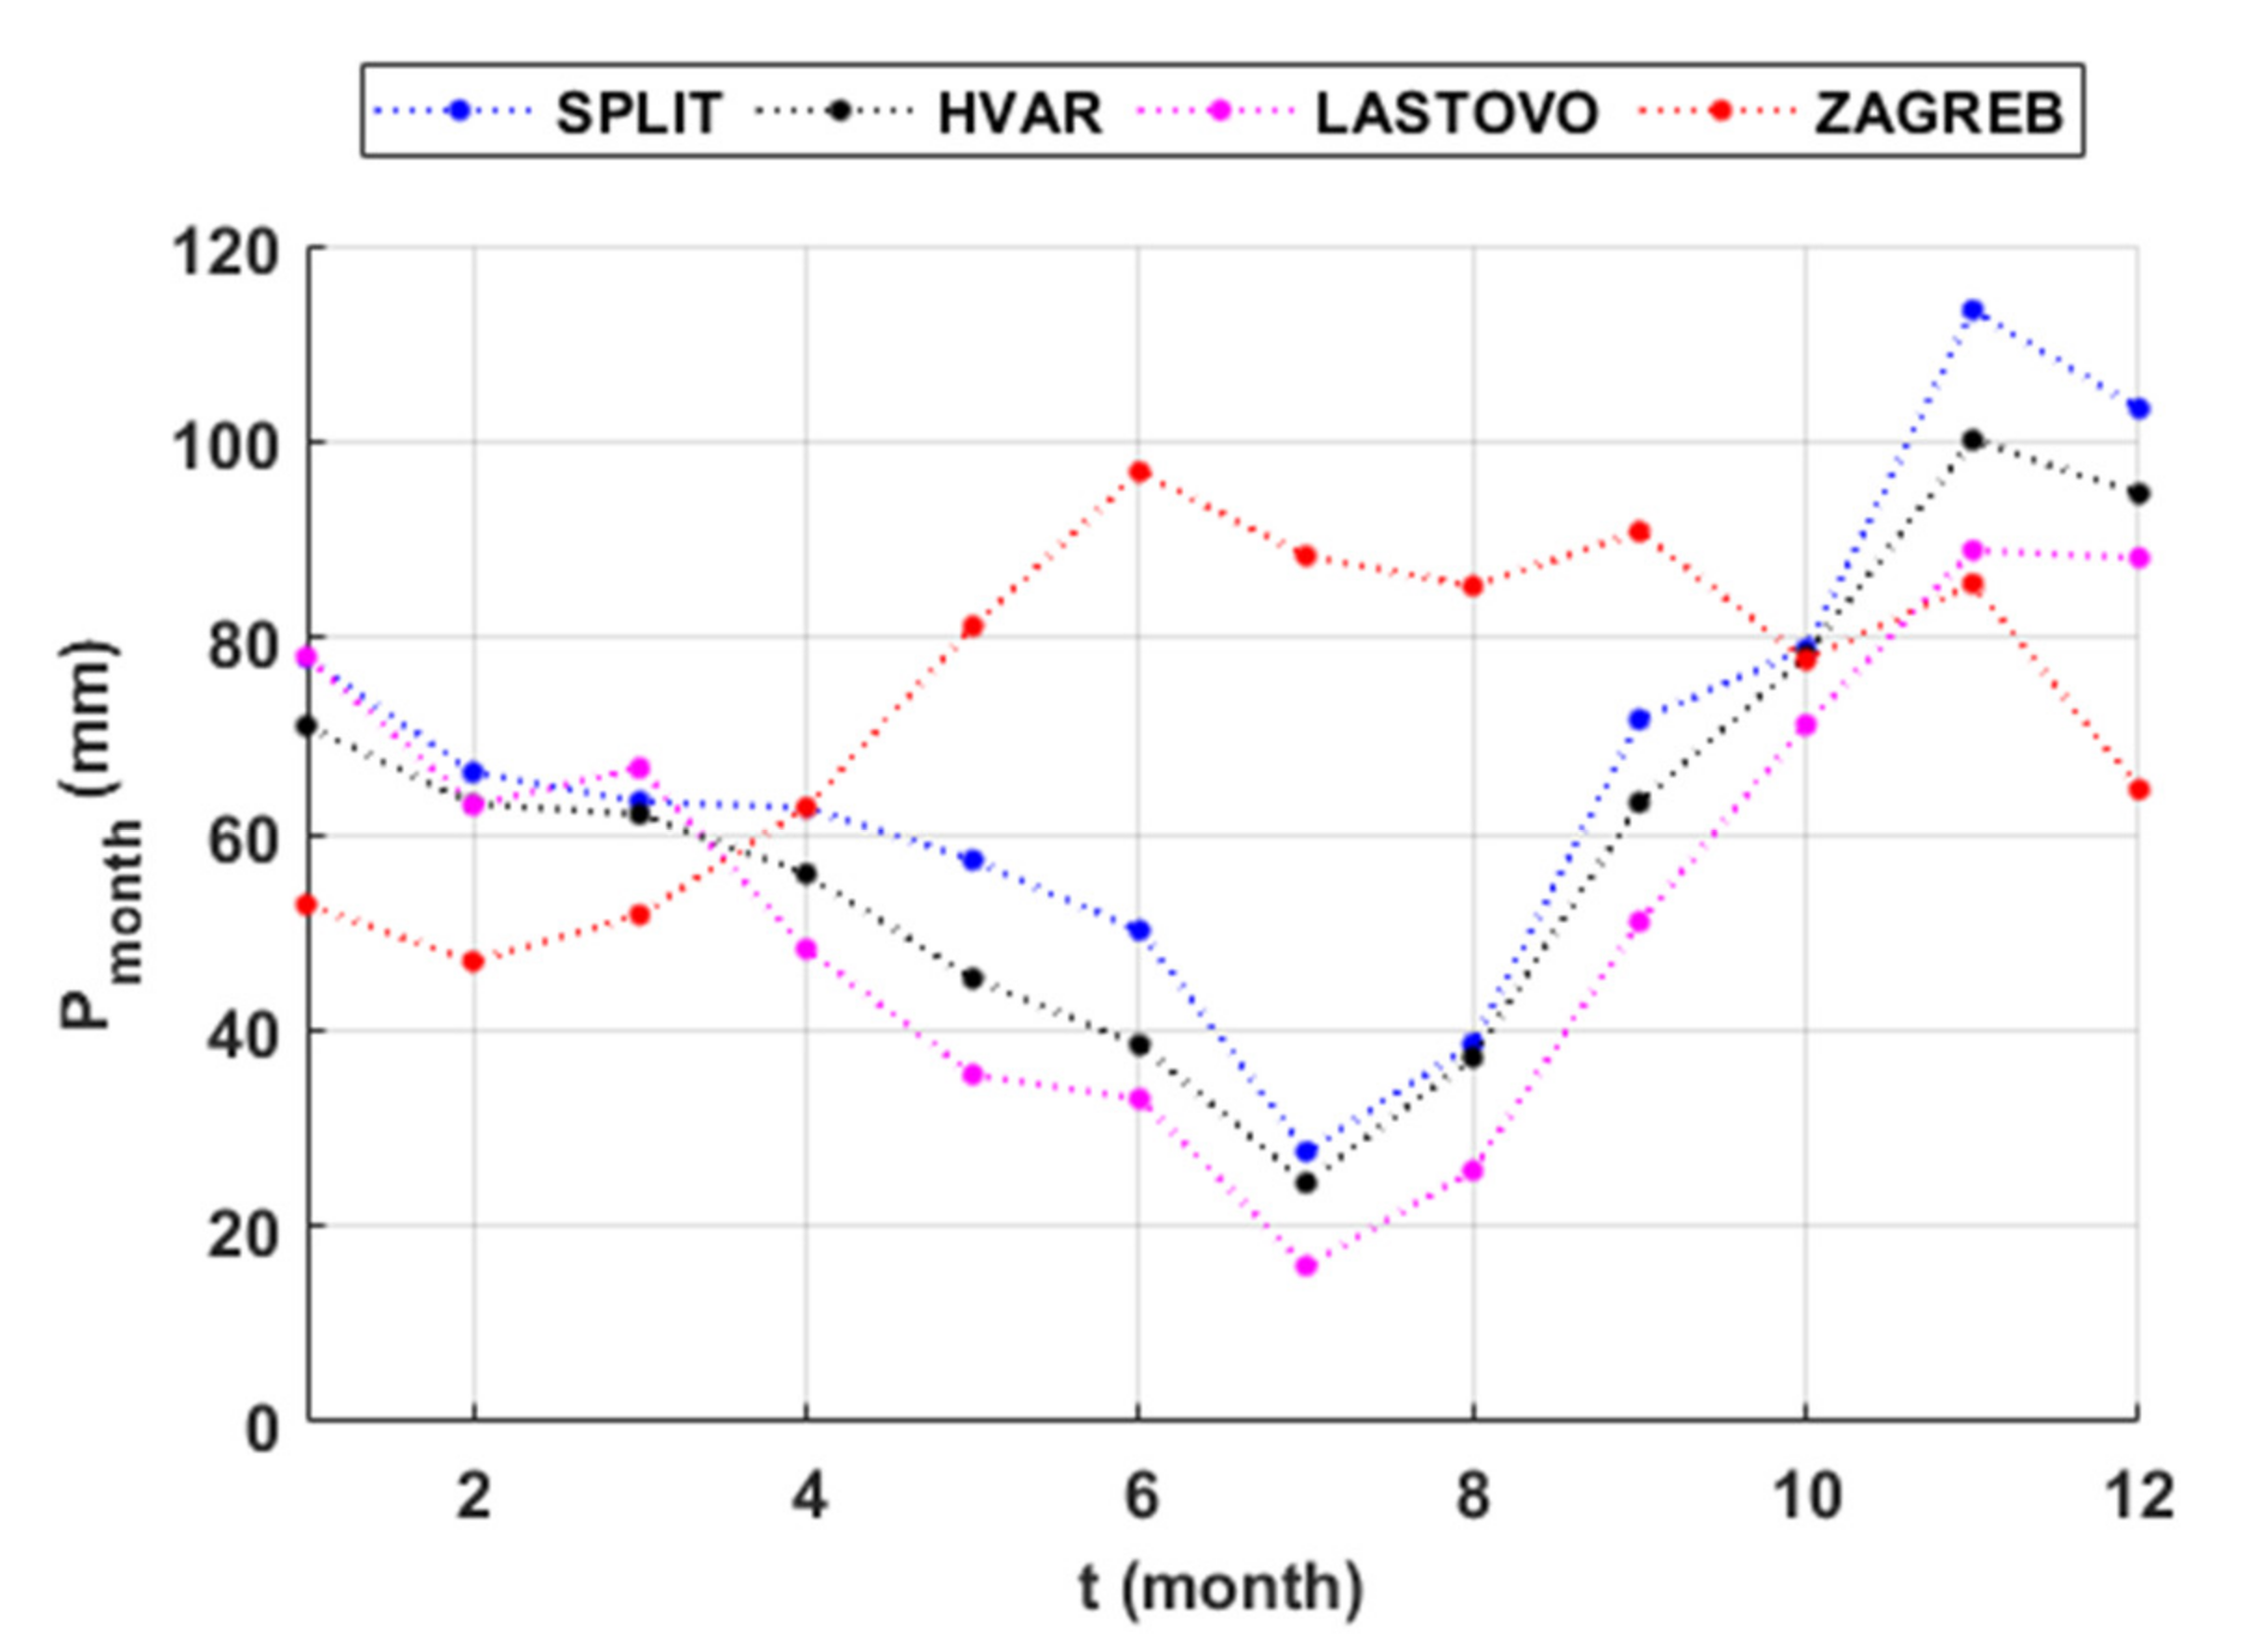
3.2. The Month as a Time Unit of Analyses
4. Conclusions
Author Contributions
Funding
Institutional Review Board Statement
Informed Consent Statement
Acknowledgments
Conflicts of Interest
References
- Casanueva, A.; Rodriguez-Puebla, C.; Frías, M.D.; Gonzalez-Reviriego, N. Variability of extreme precipitation over Europe and its relationships with teleconnection patterns. Hydrol. Earth Syst. Sci. 2014, 18, 709–725. [Google Scholar] [CrossRef] [Green Version]
- Balling, R.C.; Kiany, M.S.K.; Roy, S.S.; Khoshhal, J. Trends in Extreme Precipitation Indices in Iran: 1951–2007. Adv. Meteorol. 2016, 2016, 1–8. [Google Scholar] [CrossRef] [Green Version]
- de-Lima, M.I.P.; Santo, F.E.; Ramos, A.M.; de-Lima, J.L.M.P. 2013 Recent changes in daily precipitation and surface air temperature extremes in mainland Portugal, in the period 1941–2007. Atmos. Res. 2013, 127, 195–209. [Google Scholar] [CrossRef]
- Mathbout, S.; Lopez-Bustins, J.A.; Royé, D.; Martin-Vide, J.; Bech, J.; Rodrigo, F.S. Observed Changes in Daily Precipitation Extremes at Annual Timescale Over the Eastern Mediterranean During 1961–2012. Pure Appl. Geophys. PAGEOPH 2017, 175, 3875–3890. [Google Scholar] [CrossRef]
- Moberg, A.; Jones, P.D. Trends in indices for extremes in daily temperature and precipitation in central and western Europe, 1901–1999. Int. J. Clim. 2005, 25, 1149–1171. [Google Scholar] [CrossRef]
- Nouaceur, Z.; Murarescu, O. Rainfall Variability and Trend Analysis of Annual Rainfall in North Africa. Int. J. Atmos. Sci. 2016, 2016, 1–12. [Google Scholar] [CrossRef]
- Alpert, P.; Ben-Gai, T.; Baharad, A.; Benjamini, Y.; Yekutieli, D.; Colacino, M.; Diodato, L.; Ramis, C.; Homar, V.; Romero, R.; et al. The paradoxical increase of Mediterranean extreme daily rainfall in spite of de-crease in total values. Geophys. Res. Lett. 2002, 29, 31-1–31-4. [Google Scholar] [CrossRef] [Green Version]
- Abbasnia, M.; Toros, H. Trend analysis of weather extremes across the coastal and non-coastal areas (case study: Turkey). J. Earth Syst. Sci. 2020, 129, 1–13. [Google Scholar] [CrossRef]
- Ramos, M.C.; Martinez-Casasnovas, J.A. Trends in Precipitation Concentration and Extremes in the Mediterranean Penedès-Anoia Region, Ne Spain. Clim. Chang. 2006, 74, 457–474. [Google Scholar] [CrossRef]
- Asfaw, A.; Simane, B.; Hassen, A.; Bantider, A. Variability and time series trend analysis of rainfall and temperature in northcentral Ethiopia: A case study in Woleka subbasin. Weather. Clim. Extrem. 2018, 19, 29–41. [Google Scholar] [CrossRef]
- Hu, Q.; He, X.; LU, X.-A.; Zhang, X. Trend analysis of seasonal precipitation (1960–2013) in subregions of Hunan Prov-ince, Central South China using discrete wavelet transforms. J. Appl. Meteorol. Climatol. 2019, 58, 2159–2175. [Google Scholar] [CrossRef]
- Oikonomou, C.; Flocas, H.; Hatzaki, M.; Giannakopoulos, C. Future changes in the occurrence of extreme precipitation events in Eastern Mediterranean. Glob. NEST J. 2008, 10, 255–262. [Google Scholar]
- Hertig, E.; Seubert, S.; Paxian, A.; Vogt, G.; Paeth, H.; Jacobeit, J. Changes of total versus extreme precipitation and dry periods until the end of the twenty-first century: Statistical assessments for the Mediterranean area. Theor. Appl. Clim. 2012, 111, 1–20. [Google Scholar] [CrossRef]
- Fiorillo, F.; Petitta, M.; Preziosi, E.; Rusi, S.; Espositi, L.; Tallini, M. Long-term trend and fluctuations of karst spring dis-charge in a Mediterranean area (central-southern Italy). Environ. Earth Sci. 2015, 74, 153–172. [Google Scholar] [CrossRef]
- Trenberth, K. Changes in precipitation with climate change. Clim. Res. 2011, 47, 123–138. [Google Scholar] [CrossRef] [Green Version]
- Moustakis, Y.; Papalexiou, S.M.; Onof, C.J.; Paschalis, A. Seasonality, Intensity, and Duration of Rainfall Extremes Change in a Warmer Climate. Earth’s Future 2021, 9, 1–15. [Google Scholar] [CrossRef]
- Gajić-Čapka, M. Stationarity, trend and periodicity of precipitation at the Zagreb-Grič Observatory from 1862 to 1990. Hrvat. Meteorološki Časopis 1992, 27, 1–10. [Google Scholar]
- Bonacci, O.; Matešan, D. Analysis of precipitation appearance in time. Hydrol. Process. 1999, 13, 1683–1690. [Google Scholar] [CrossRef]
- Bonacci, O. Air temperature and precipitation analyses on a small Mediterranean island: The case of the remote island of Lastovo (Adriatic Sea, Croatia). Acta Hydrotech. 2019, 32, 135–150. [Google Scholar] [CrossRef]
- Bonacci, O.; Roje-Bonacci, T. Analiza dnevnih, mjesečnih i godišnjih oborina Zagreb Griča (1862.-2017.) za potrebe inženjerske hidrologije. Hrvat. Vode 2019, 27, 7–20. [Google Scholar]
- Bonacci, O. Increase of mean annual surface air temperature in the Western Balkans during last 30 years. Vodoprivreda 2012, 44, 75–89. [Google Scholar]
- Bonacci, O.; Patekar, M.; Pola, M.; Roje-Bonacci, T. Analyses of climate variations at four meteorological stations on re-mote islands in the Croatian part of the Adriatic Sea. Atmosphere 2020, 11, 1044. [Google Scholar] [CrossRef]
- Radić, V.; Pasarić, N.; Šinik, N. Analiza zagrebačkih klimatoloških nizova pomoću empirijski određenih prirodnih sastavnih funkcija. Geofizika 2004, 21, 15–36. [Google Scholar]
- Pandžić, K.; Likso, T. Homogeneity of average annual air temperature time series for Croatia. Int. J. Clim. 2009, 30, 1215–1225. [Google Scholar] [CrossRef]
- Pandžić, K.; Likso, T.; Curić, O.; Mesić, M.; Pejić, I.; Pasarić, Z. Drought indices for the Zagreb-Grič Observatory with an overview of drought damage in agriculture in Croatia. Theor. Appl. Clim. 2020, 142, 1–13. [Google Scholar] [CrossRef]
- Jenkinson, A.F. The frequency distribution of the annual maximum (or minimum) values of meteorological elements. Q. J. R. Meteorol. Soc. 1955, 81, 158–171. [Google Scholar] [CrossRef]
- Gajić-Čapka, M. Metode Klimatološke Analize Kratkotrajnih Oborina Velikog Intenziteta. Ph.D. Thesis, Zagreb University, Zagreb, Croatia, 2000. [Google Scholar]
- Mann, H.B. Non-parametric test of randomness against trend. Econometrica 1945, 13, 245–259. [Google Scholar] [CrossRef]
- Kendall, M.G. Rank Correlation Methods, 4th ed.; Charles Griffin: London, UK, 1975. [Google Scholar]
- Hamed, K.H.; Ramachandra, R.A. Modified Mann-Kendal trend test for autocolerrated data. J. Hydrol. 1998, 204, 182–196. [Google Scholar] [CrossRef]
- Mohsin, T.; Gough, W.A. Trend analysis of long-term temperature time series in the Greater Toronto Area (GTA). Theor. Appl. Clim. 2009, 101, 311–327. [Google Scholar] [CrossRef]
- Allen, S.M.J.; Gough, W.A.; Mohsin, T. Changes in the frequency of extreme temperature records for Toronto, Ontario, Canada. Theor. Appl. Clim. 2015, 119, 481–491. [Google Scholar] [CrossRef]
- Hori, Y.; Gough, W.A.; Butler, K.; Tsuji, L.J. Trends in the seasonal length and opening dates of a winter road in the western James Bay region, Ontario, Canada. Theor. Appl. Clim. 2016, 129, 1309–1320. [Google Scholar] [CrossRef]
- Wang, H.; Stephenson, S.R. Quantifying the impacts of climate change and land use/cover change on runoff in the lower Connecticut River Basin. Hydrol. Process. 2018, 32, 1301–1312. [Google Scholar] [CrossRef]
- Husain Shourov, M.M.; Mahmud, I. pyMannKendall: A python package for non parametric Mann Kendall family of trend tests. J. Open Source Softw. 2019, 4, 1556. [Google Scholar] [CrossRef]
- Gough, W.A. Impact of Urbanization on the Nature of Precipitation at Toronto, Ontario, Canada. J. Appl. Meteorol. Clim. 2021, 60, 425–435. [Google Scholar] [CrossRef]
- Thompson, R.; Green, D.N. Mediterranean precipitation and its relationship with sea level pressure patterns. Ann. Geophys. 2009, 47, 1617–1633. [Google Scholar] [CrossRef]
- Ben-Gai, T.; Bitan, A.; Manes, A.; Alpert, P.; Rubin, S. Spatial and Temporal Changes in Rainfall Frequency Distribution Patterns in Israel. Theor. Appl. Clim. 1998, 61, 177–190. [Google Scholar] [CrossRef]
- Deitch, M.J.; Michele, J.; Sapundjieff, M.J.; Feirer, S.T. Characterizing precipitation variability and trends in the world’s Mediterranean-Climate areas. Water 2017, 9, 259. [Google Scholar] [CrossRef] [Green Version]
- Alpert, P.; Halfon, N.; Levin, Z. Does Air Pollution Really Suppress Precipitation in Israel? J. Appl. Meteorol. Clim. 2008, 47, 933–943. [Google Scholar] [CrossRef]
- Brogli, R.; Sørland, S.L.; Kröner, N.; Schär, C. Causes of future Mediterranean precipitation decline depend on the season. Environ. Res. Lett. 2019, 14, 114017. [Google Scholar] [CrossRef]
- Yang, P.; Ren, G.; Yan, P.; Deng, J. Urbanization reduces frequency of light rain: An example from Beijing City. Theor. Appl. Clim. 2021, 145, 763–774. [Google Scholar] [CrossRef]
- Šegota, T.; Filipčić, A. Köppenova podjela klima i hrvatsko nazivlje. Geoadria 2017, 8, 17–37. [Google Scholar] [CrossRef] [Green Version]
- Köppen, W.; Geiger, R. Handbuch der Klimatologie: Das geographische System der Klimate; Verlag vod Gebrüder Borntraeger: Berlin, Germany, 1936. [Google Scholar]
- Gajić-Čapka, M. Varijabilnost prosječnog oborinskog režima šire zagrebačke regije. Rasprave 1982, 17, 23–40. [Google Scholar]
- Millington, N.; Das, S.; Simonovic, S.P. The Comparison of GEV, Log-Pearson Type 3 and Gumbel Distributions in the Upper Thames River Watershed under Global Climate Models; Department of Civil and Environmental Engineering, The University of Western Ontario: London, ON, Canada, 2011. [Google Scholar]


| Station | SPLIT | HVAR | LASTOVO | ZAGREB |
|---|---|---|---|---|
| Type of Station | AMS, MMS | AMS, MMS | AMS, MMS | AMS, MMS |
| H (m a.s.l.) | 122 | 20 | 186 | 157 |
| Latitude | 43°30′30″ | 43°10′16″ | 42°46′06″ | 45°48′52″ |
| Longitude | 16°25′35″ | 16°26′13″ | 16°54′00″ | 15°58′19″ |
| Station | SPLIT | HVAR | LASTOVO | ZAGREB | |
|---|---|---|---|---|---|
| Year | Pav | 810.8 | 733.4 | 665.0 | 884.2 |
| Pmin | 486.6 | 383.7 | 368.0 | 520.8 | |
| Pmax | 1208.9 | 1282.3 | 1088.6 | 1233.8 | |
| R = Pmax − Pmin | 722.3 | 898.6 | 720.6 | 713.0 | |
| Std | 155.2 | 155.9 | 168.0 | 144.3 | |
| CV | 19.1 | 21.3 | 25.3 | 16.3 | |
| Max. Daily | Pav | 61.7 | 63.9 | 61.4 | 47.9 |
| Pmin | 27.6 | 33.8 | 17.4 | 21.7 | |
| Pmax | 228.5 | 159 | 169.8 | 95.8 | |
| R = Pmax − Pmin | 200.9 | 125.2 | 152.4 | 74.1 | |
| Std | 30.0 | 25.8 | 25.9 | 13.8 | |
| CV | 48.6 | 40.4 | 42.2 | 28.8 |
| P (mm) | T (Year) | SPLIT | HVAR | LASTOVO | ZAGREB |
|---|---|---|---|---|---|
| Year | 50 | 1130.5 | 1104.8 | 1025.2 | 1167.2 |
| 100 | 1167.1 | 1164.6 | 1072.1 | 1194.9 | |
| 200 | 1197.8 | 1219.8 | 1112.7 | 1217.1 | |
| 500 | 1230.9 | 1286.4 | 1158.4 | 1240.1 | |
| Max. Daily | 50 | 146.2 | 154.3 | 125.6 | 82.5 |
| 100 | 176.6 | 187.5 | 141.5 | 89.4 | |
| 200 | 212.9 | 227.6 | 158.2 | 96.2 | |
| 500 | 272.1 | 293.6 | 181.4 | 104.9 |
| SPLIT | HVAR | LASTOVO | ZAGREB | |||||
|---|---|---|---|---|---|---|---|---|
| Pmax (mm) | T (year) | Pmax (mm) | T (year) | Pmax (mm) | T (year) | Pmax (mm) | T (year) | |
| Year | 1208.9 | 263 | 1282.3 | 476 | 1088.6 | 132 | 1233.8 | 385 |
| Max. Daily | 228.5 | 263 | 159.0 | 56 | 169.8 | 323 | 95.8 | 192 |
| p (M-K) | SPLIT | HVAR | LASTOVO | ZAGREB |
|---|---|---|---|---|
| N ≥ 0.0 | <0.01 | <0.01 | <0.05 | <0.01 |
| N ≥ 4.0 | >0.05 | >0.05 | >0.05 | >0.05 |
| N ≥ 10.0 | >0.05 | >0.05 | >0.05 | >0.05 |
| N ≥ 16.0 | >0.05 | >0.05 | >0.05 | >0.05 |
| N ≥ 32.0 | >0.05 | <0.05 | >0.05 | >0.05 |
| p (M-K) | SPLIT | HVAR | LASTOVO | ZAGREB | |
|---|---|---|---|---|---|
| P ≥ 4.0 mm | ΣP (mm) | >0.05 | >0.05 | >0.05 | >0.05 |
| ΣP (%) | <0.05 | >0.05 | >0.05 | <0.05 | |
| P ≥ 10.0 mm | ΣP (mm) | >0.05 | >0.05 | >0.05 | >0.05 |
| ΣP (%) | >0.05 | <0.05 | >0.05 | <0.05 | |
| P ≥ 16.0 mm | ΣP (mm) | >0.05 | >0.05 | >0.05 | >0.05 |
| ΣP (%) | >0.05 | <0.05 | >0.05 | >0.05 | |
| P ≥ 32.0 mm | ΣP (mm) | >0.05 | >0.05 | >0.05 | >0.05 |
| ΣP (%) | >0.05 | >0.05 | >0.05 | >0.05 | |
| p (M-K) | SPLIT | HVAR | LASTOVO | ZAGREB |
|---|---|---|---|---|
| January | >0.05 | >0.05 | >0.05 | >0.05 |
| February | >0.05 | >0.05 | >0.05 | >0.05 |
| March | >0.05 | >0.05 | >0.05 | >0.05 |
| April | >0.05 | >0.05 | >0.05 | >0.05 |
| May | >0.05 | >0.05 | >0.05 | >0.05 |
| June | >0.05 | >0.05 | >0.05 | >0.05 |
| July | >0.05 | >0.05 | >0.05 | >0.05 |
| August | >0.05 | >0.05 | >0.05 | >0.05 |
| September | >0.05 | >0.05 | >0.05 | >0.05 |
| October | <0.05 | >0.05 | >0.05 | <0.05 |
| November | >0.05 | >0.05 | >0.05 | >0.05 |
| December | >0.05 | >0.05 | >0.05 | >0.05 |
Publisher’s Note: MDPI stays neutral with regard to jurisdictional claims in published maps and institutional affiliations. |
© 2021 by the authors. Licensee MDPI, Basel, Switzerland. This article is an open access article distributed under the terms and conditions of the Creative Commons Attribution (CC BY) license (https://creativecommons.org/licenses/by/4.0/).
Share and Cite
Bonacci, O.; Andrić, I.; Vrsalović, A.; Bonacci, D. Precipitation Regime Changes at Four Croatian Meteorological Stations. Atmosphere 2021, 12, 885. https://doi.org/10.3390/atmos12070885
Bonacci O, Andrić I, Vrsalović A, Bonacci D. Precipitation Regime Changes at Four Croatian Meteorological Stations. Atmosphere. 2021; 12(7):885. https://doi.org/10.3390/atmos12070885
Chicago/Turabian StyleBonacci, Ognjen, Ivo Andrić, Adrijana Vrsalović, and Duje Bonacci. 2021. "Precipitation Regime Changes at Four Croatian Meteorological Stations" Atmosphere 12, no. 7: 885. https://doi.org/10.3390/atmos12070885
APA StyleBonacci, O., Andrić, I., Vrsalović, A., & Bonacci, D. (2021). Precipitation Regime Changes at Four Croatian Meteorological Stations. Atmosphere, 12(7), 885. https://doi.org/10.3390/atmos12070885


