Article

Precipitation Regime Changes at Four Croatian Meteorological Stations

1
Faculty of Civil Engineering, Architecture and Geodesy, University of Split, Matice Hrvatske 15, 21000 Split, Croatia
2
Faculty of Croatian Studies, Zagreb University, Borongajska cesta 83d, 10000 Zagreb, Croatia
*
Author to whom correspondence should be addressed.
Atmosphere 2021, 12(7), 885; https://doi.org/10.3390/atmos12070885
Submission received: 15 June 2021 / Revised: 2 July 2021 / Accepted: 6 July 2021 / Published: 7 July 2021
(This article belongs to the Section Meteorology)

Abstract

:
The article analyses the values of daily, monthly and annual precipitation measured during the period 1948–2019 at the following four stations: (1) Split, (2) Hvar, (3) Lastovo and (4) Zagreb. The first three stations are located in a Mediterranean climate, while the station in Zagreb is located in a continental climate. The aim of the performed analyses is to detect non-stationarity (trends, jumps, and seasonality) in the precipitation regime at three-time scales (day, month, and year) over the period of the last 72 years (1948–2020). Numerous previous analyses at all four stations showed statistically significant increases in air temperature, which were particularly amplified in the late 1980s by the effect of global warming. Expressed as a percentage of the total annual precipitation at all four analysed locations, the presence of an increasing trend was calculated. The analyses carried out in this work showed that there was a redistribution of precipitation during the year, a decrease in the number of days with precipitation and an intensification of precipitation in both climatic regions. Over the past 73 years, the number of days with precipitation per year has slowly decreased. The number of days with intense precipitation, P ≥ 32.0 mm, has become more frequent.

1. Introduction

In recent decades, scientific interest in the study of various aspects of the precipitation regime as a consequence of global climate change has greatly increased. It is of particular importance to identify in each region and/or location possible changes in the characteristics of extreme precipitation, changes in the redistribution of precipitation during the year, and to determine the presence of precipitation trends at different time scales from day to month and season to year [1,2,3,4,5,6,7,8,9,10,11,12,13]. Precipitation, especially extreme precipitation, affects the hydrological regime, agricultural production and the occurrence of floods, as well as almost all environmental and social aspects on the planet. On the other hand, their absence leads to droughts, with disastrous consequences. Due to the reduced precipitation and increased temperatures in Mediterranean Southern Italy, karst spring discharges have decreased by 15 to 30% since 1987 [14]. Understanding and estimating the future evolution of various precipitation characteristics is not only of scientific but also of practical interest.
A review of numerous results presented in the literature shows that various characteristics of precipitation behave very differently in different regions and even in nearby locations. The differences in the behaviour of precipitation are much more pronounced than in the behaviour of temperatures, for which there is generally an increasing trend everywhere.
From the numerous literature, only a few examples that show the different behaviour of precipitation in different regions and places are given below.
An analysis of the annual precipitation of 57 stations in Portugal during the period of 1941–2007 showed that none of the trends, increasing or decreasing, were statistically significant since they were at the 5% level [3].
Mathbout et al. [4] found that extreme and heavy precipitation events showed a globally statistically significant decrease in the Eastern Mediterranean and, in the southern parts, a significant decrease in total precipitation.
Analyses of daily precipitation data in 70 weather stations in central and Western Europe during 1961–2012 showed significant increasing precipitation trends over the 20th century, dominantly in winter for both average precipitation intensity and moderately strong events [5].
Of special interest are the conclusions published in [6]: “The IPCC climate models predict, for the Maghreb countries, lower rainfall and increased aridity. Current observations in the three countries of central Maghreb (Morocco, Algeria, and Tunisia) are not consistent with these predictions. The climate change observed during the last years is characterised by a rainfall return but with a far greater intensity”.
The torrential rainfall in Italy exceeding 128 mm/day has increased percentage-wise by a factor of 4 during 1951–1995, with strong peaks in El-Nino years. In Spain, extreme categories at both tails of the distribution (light: 0–4 mm/day and heavy/torrential: 64 mm/day and up) increased significantly. No significant trends were found in Israel and Cyprus [7].
Analyses of 71 stations across Turkey for assessment of the long-term changes in weather extremes from 1961 to 2016 revealed decreasing trends in the number of precipitation days and the volume of precipitation. A small percentage of stations experienced significant increasing trends for the average of total precipitation and very wet days, especially over the southeast coast of the Black Sea [8].
Analyses of trends in precipitation concentration and extremes in the Mediterranean Penedès-Anoia Region (Spain) indicate an increase in precipitation in winter and summer and a positive trend of concentration in autumn, with a higher number of extreme events separated by longer dry periods [9].
Trend analysis of the long-lasting precipitation time series (1901–2014) in north-central Ethiopia showed a statistically significant declining trend for annual rainfall with a rate of 15.03 mm per decade [10].
Investigation of trends of seasonal precipitation in Hunan Province (China) over the 1960–2013 period showed different behaviour in five subregions for winter and three subregions for spring, summer and autumn. Winter and summer precipitations experienced an increasing trend in all of the divisions. Winter precipitation in southeast-central and southern Hunan and summer precipitation in southwest-central Hunan especially exhibited a statistically significant tendency, while spring and autumn precipitations show a nonsignificant decreasing trend in all of the divisions [11].
Using different methods and concepts, numerous papers have estimated changes in precipitation regimes by the end of the 21st century.
Analysing the future changes in the occurrence of extreme precipitation events in the eastern Mediterranean, Oikonomou et al. [12] derived the following conclusions: “A general future tendency was found towards drier Eastern Mediterranean, with reduced rainfall intensity. Longer dry spells are expected in all seasons, except autumn, with the largest increase in the southern part of the area. Extreme wet spells will shorten everywhere during all seasons, except autumn. Precipitation intensity was found reduced for all seasons and mostly for summer in South Aegean Sea”.
Hertig et al. [13] calculated changes in total precipitation, extreme precipitation, and dry periods in the Mediterranean area until the end of the twenty-first century. Their conclusion are different from the previously mentioned paper: “The results mostly point to reductions of total and extreme precipitation over the western and central-northern Mediterranean areas in summer and autumn and to increases in winter. In contrast, over the eastern Mediterranean area widespread precipitation increases are assessed in summer and autumn, whereas reductions dominate in winter. In spring, total and extreme precipitation decreases prevail over the whole Mediterranean area. Total and extreme precipitation decreases mostly come along with increases of the maximum dry period length. Vice versa precipitation increases are commonly accompanied by a shortening of the maximum dry period length.”
Changes in the precipitation regime at different time scales are influenced by many global [15,16], regional and local factors. From the extensive literature, one can infer very different behaviours of precipitation in different locations and climates during the 20th and early 21st centuries [1,2,3,4,5,6,7,8,9,10,11,12,13,15,16,17,18,19,20,21,22,23,24,25,26,27,28,29,30,31,32,33,34,35,36,37,38,39,40,41]. The impact of urbanisation on the nature of precipitation in Toronto has been analysed by Gough [36]. Yang et al. [42], using Beijing as an example, conclude that urbanisation reduces the frequency of light rainfall. Thompson and Green [37] analysed the connection between Mediterranean precipitation and its relation to sea level pressure patterns.
The high variability of precipitations, especially in a Mediterranean climate, from year to year and within each year, makes it difficult to assess changes that could be associated with the future development of climate change [9]. The most reliable estimates of the evolution of the precipitation regime in the future are obtained by analysing their characteristics at stations that have a long and reliable series of measurements. This is exactly what has been done in this work. A data series for a period of 73 years (1948–2020), measured at four of the main meteorological stations in Croatia, were analysed. Three stations (Split, Hvar, and Lastovo) are located in the Mediterranean climate, and one (Zagreb) in the continental area (Figure 1). One of the aims of this work is to investigate the differences in the behaviour of trends and intra-annual distributions at relatively nearby stations located both in identical climatic regions and in two different climatic regions—Mediterranean and continental. These analyses should help to estimate the future behaviour of precipitation more reliably in order to find practical solutions to mitigate possible negative consequences.

2. Materials and Methods

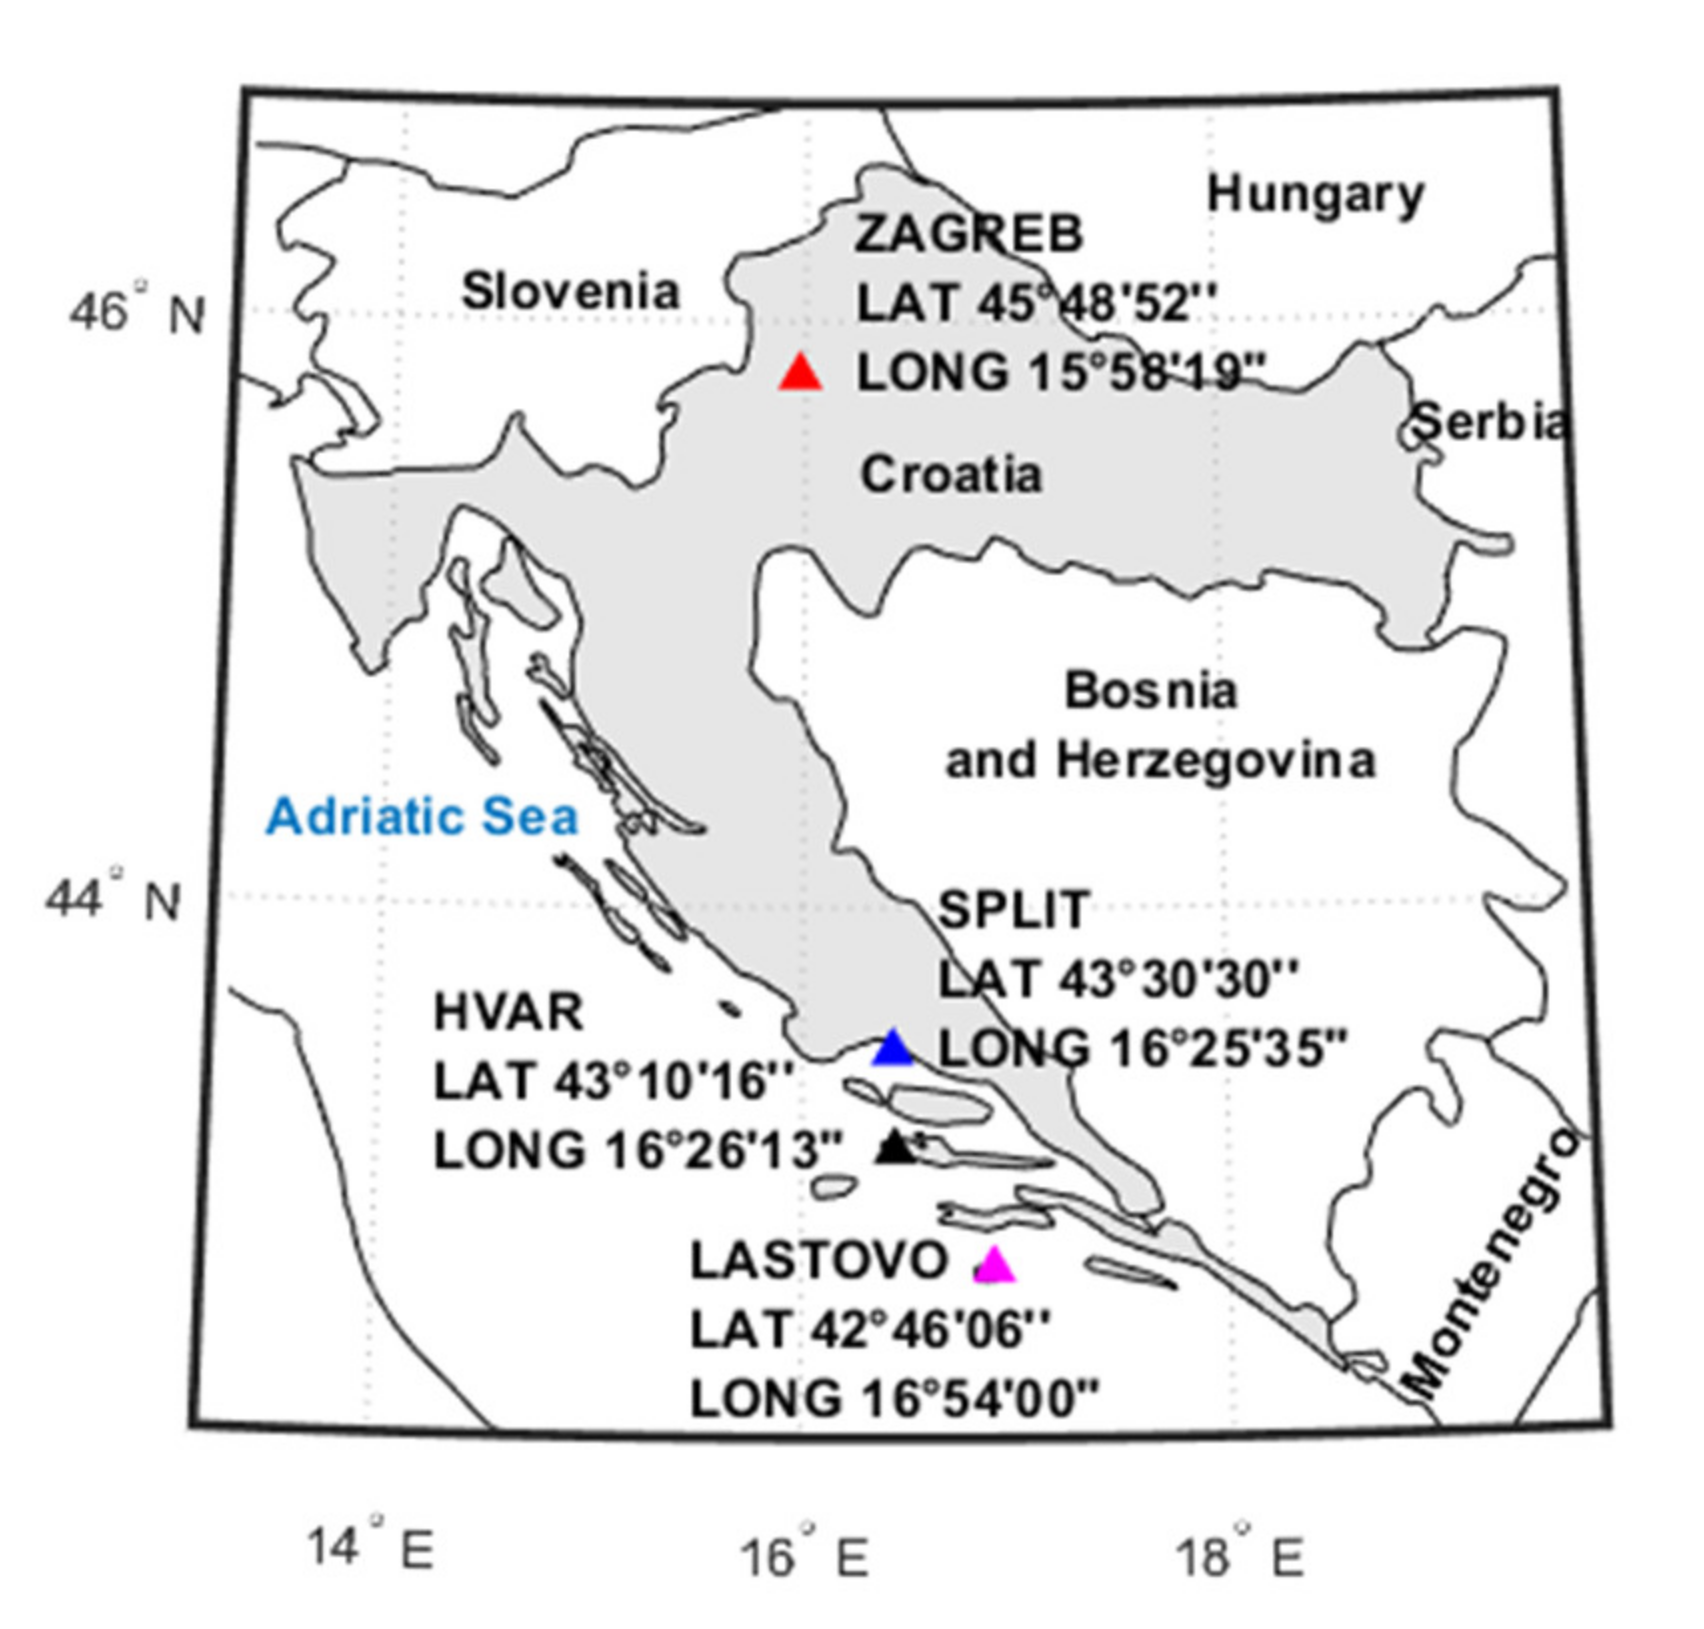
2.1. Stations and Data

The article uses data on annual, monthly and daily precipitation observed at the main meteorological stations of the State Hydrometeorological Institute (DHMZ) during a period of 73 years, from 1948 to 2020: (1) Split-Marjan (hereafter Split), (2) Hvar, (3) Lastovo, and (4) Zagreb-Grič (hereafter Zagreb). Figure 1 shows a map with the positions of these four stations, whose basic characteristics are listed in Table 1.
At the locations of the meteorological stations Split, Hvar and Lastovo, the climate is Mediterranean with hot summers [43]. According to the Köppen-Geiger [44] climate classification, it belongs to the Csa class. At the location of the main meteorological station Zagreb, the climate is moderately warm, humid and with warm summers [43]. According to the Köppen-Geiger [44] climate classification, it belongs to the Cfb class. Stations on the islands of Hvar and Lastovo are not affected by urbanisation. Stations in the cities of Split and Zagreb are located on the tops of hills and are therefore not exposed to heavy urbanisation, which is especially true for the station in Split. Thus, although they are located in rapidly developing cities, the effects of the urban heat island effect are significantly mitigated in their case.
The precipitation regime at the four stations analysed in this paper has been studied in numerous papers [17,18,19,20,45]. The general conclusion is that no statistically significant trend of increase or decrease in precipitation was observed at the stations analysed in these works. It is especially important to emphasise that regarding the precipitation of different durations (day, month, year) during the period 1862–2017 measured at the Zagreb Observatory, neither climate change nor the process of urbanisation influenced the emergence of trends [20].
As for the variations in air temperature, the situation is distinctly different. It should be emphasised that statistically significant trends in the increase of mean annual, as well as minimum and maximum annual temperatures during the twentieth century, were observed at all stations [21,22,23,24,25]. Particularly strong increases in mean annual temperatures have been observed in Split (0.043 °C per year) and Hvar (0.024 °C per year) since 1998, in Lastovo (0.039 °C per year) since 1992, and in Zagreb (0.053 °C per year) since 1988.

2.2. Stations and Data

Detailed analyses of daily, monthly and annual precipitation time series of the four stations in the 1948–2020 period were made using different statistical methods.
The probability of the occurrence of extreme minimum and maximum values were analysed using the GEV method (generalised extreme values) [26,27]. The distribution function of the random variable x, the three-parameter distribution of extreme values, is given by the expression:
F x = exp - k x - ξ α 1 k
where ξ is a location parameter, α a scale parameter and k a shape parameter. The location parameter ξ describes the displacement of the distribution in a particular direction on the horizontal axis. The scale parameter α defines where the bulk of the distribution lies and how strongly it is distributed, while the shape parameter k is a parameter derived from skewness and represents where the bulk of the data lies. It strictly affects the shape of the distribution by creating a tail distribution [46].
Given the value of the shape parameter k, the GEV includes three standard distributions of extreme values: Frechet, Weibull, and Gumbel. When k = 0, the distribution is of type I or Gumbel; when k > 0, of type II or Frechet; and in the case of k < 0, of a type III or Weibull distribution. In this paper, the statistical analysis of data and the prediction of extreme values for a specific return period was performed by determining the maximum likelihood estimates for the GEV parameters (Figure 2 and Figure 3).
Linear and nonlinear regression and correlation methods were used for the time series trend analysis.
The statistical significance of linear series trends was determined using the Mann–Kendall (M-K) test [28,29,30]. This test is now considered the most reliable procedure for assessing the statistical significance of monotonic linear and nonlinear trends (upwards and downwards) in an analysed time series. One of its major advantages is that it does not require fitting the analysed data to a distribution curve, i.e., the M-K test is nonparametric. As such, it has the widest application in the analysis of a time series of climatological parameters, especially of temperature and precipitation [31,32,33,34]. In this work, the package pyMannKendall for Python was used [35]. The null hypothesis is that there is no monotonic trend in the analysed time series. An alternative hypothesis is that the trend exists. In this work, the probability value p < 0.05 was used as the criterion for accepting the alternative hypothesis (the existence of a statistically significant linear trend).

3. Results and Discussion

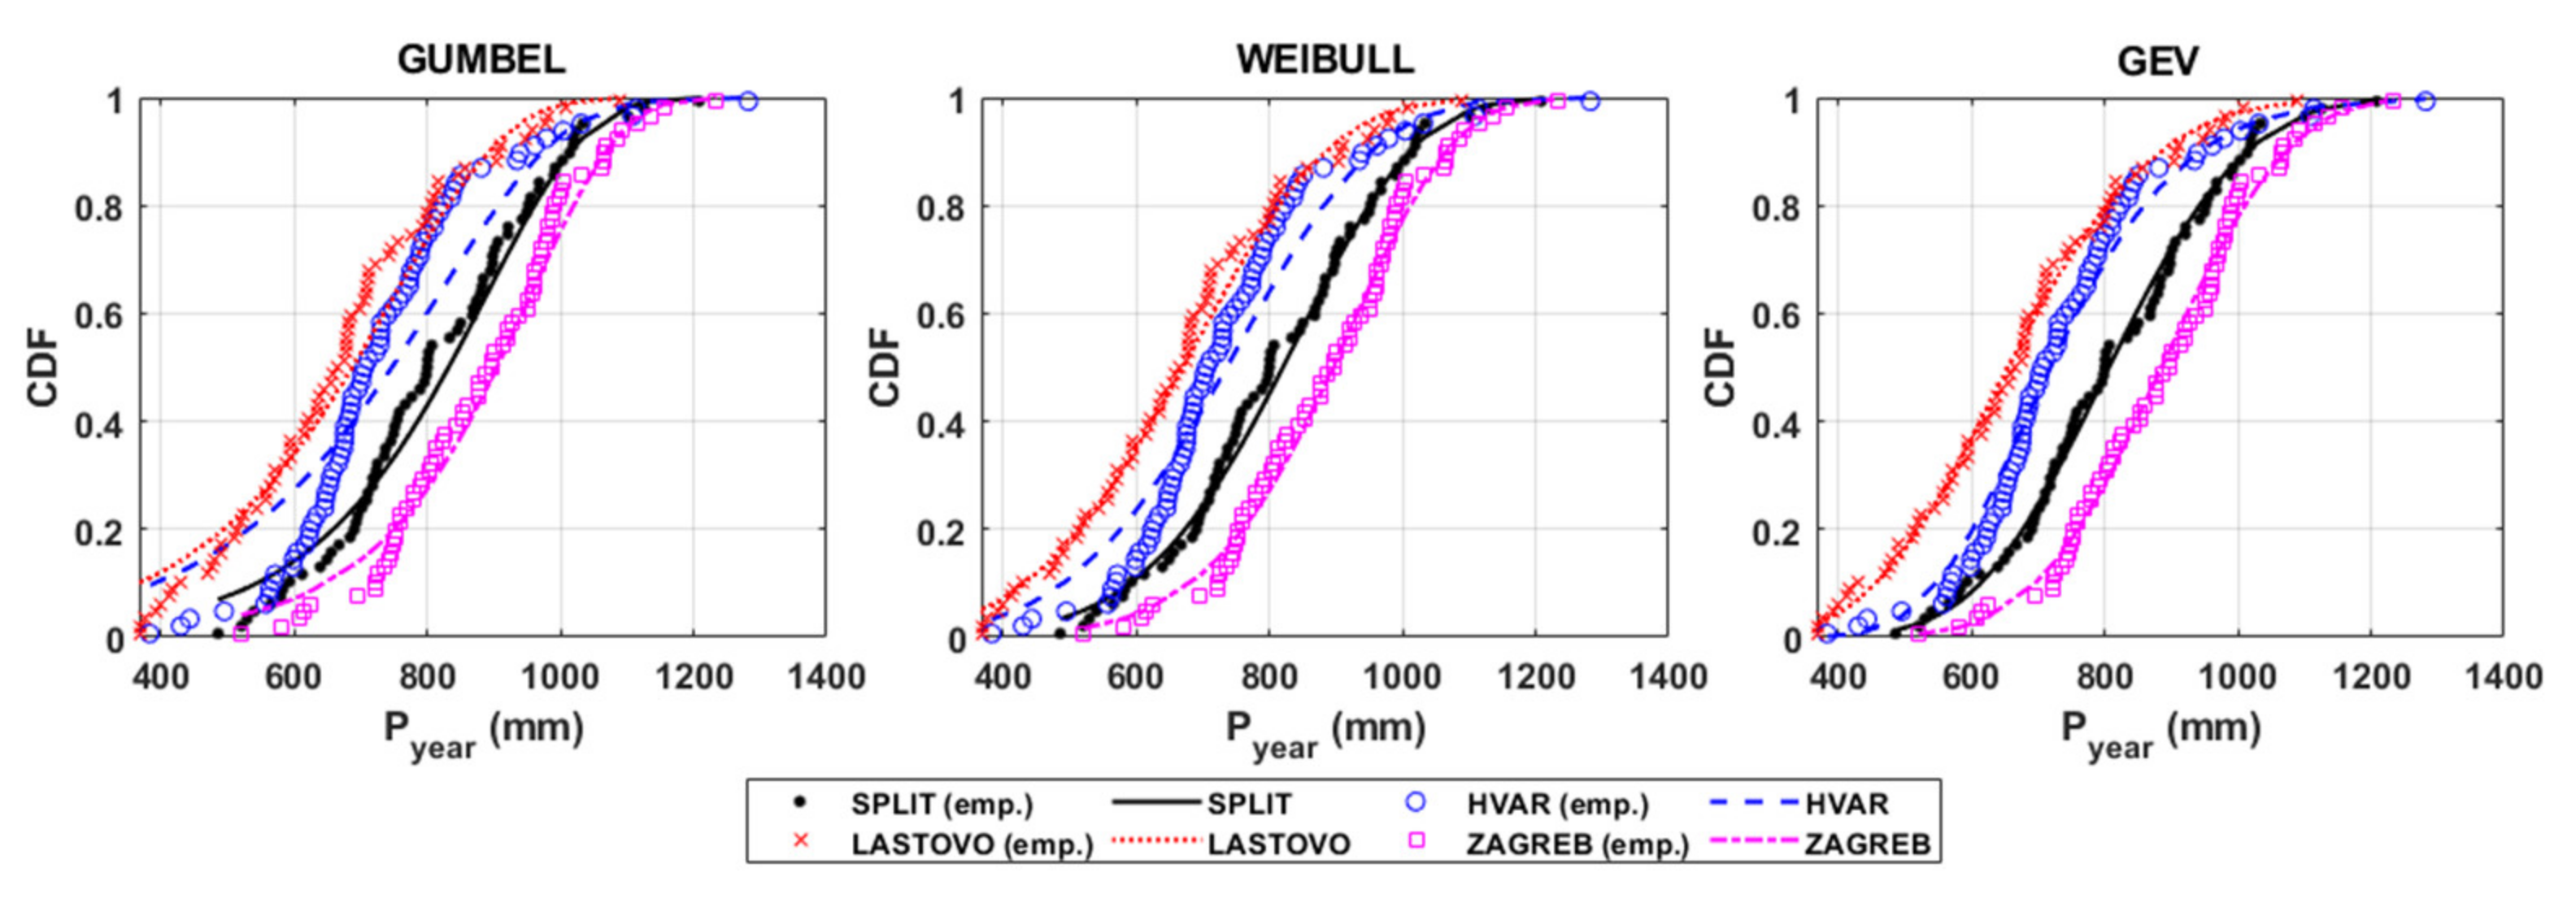
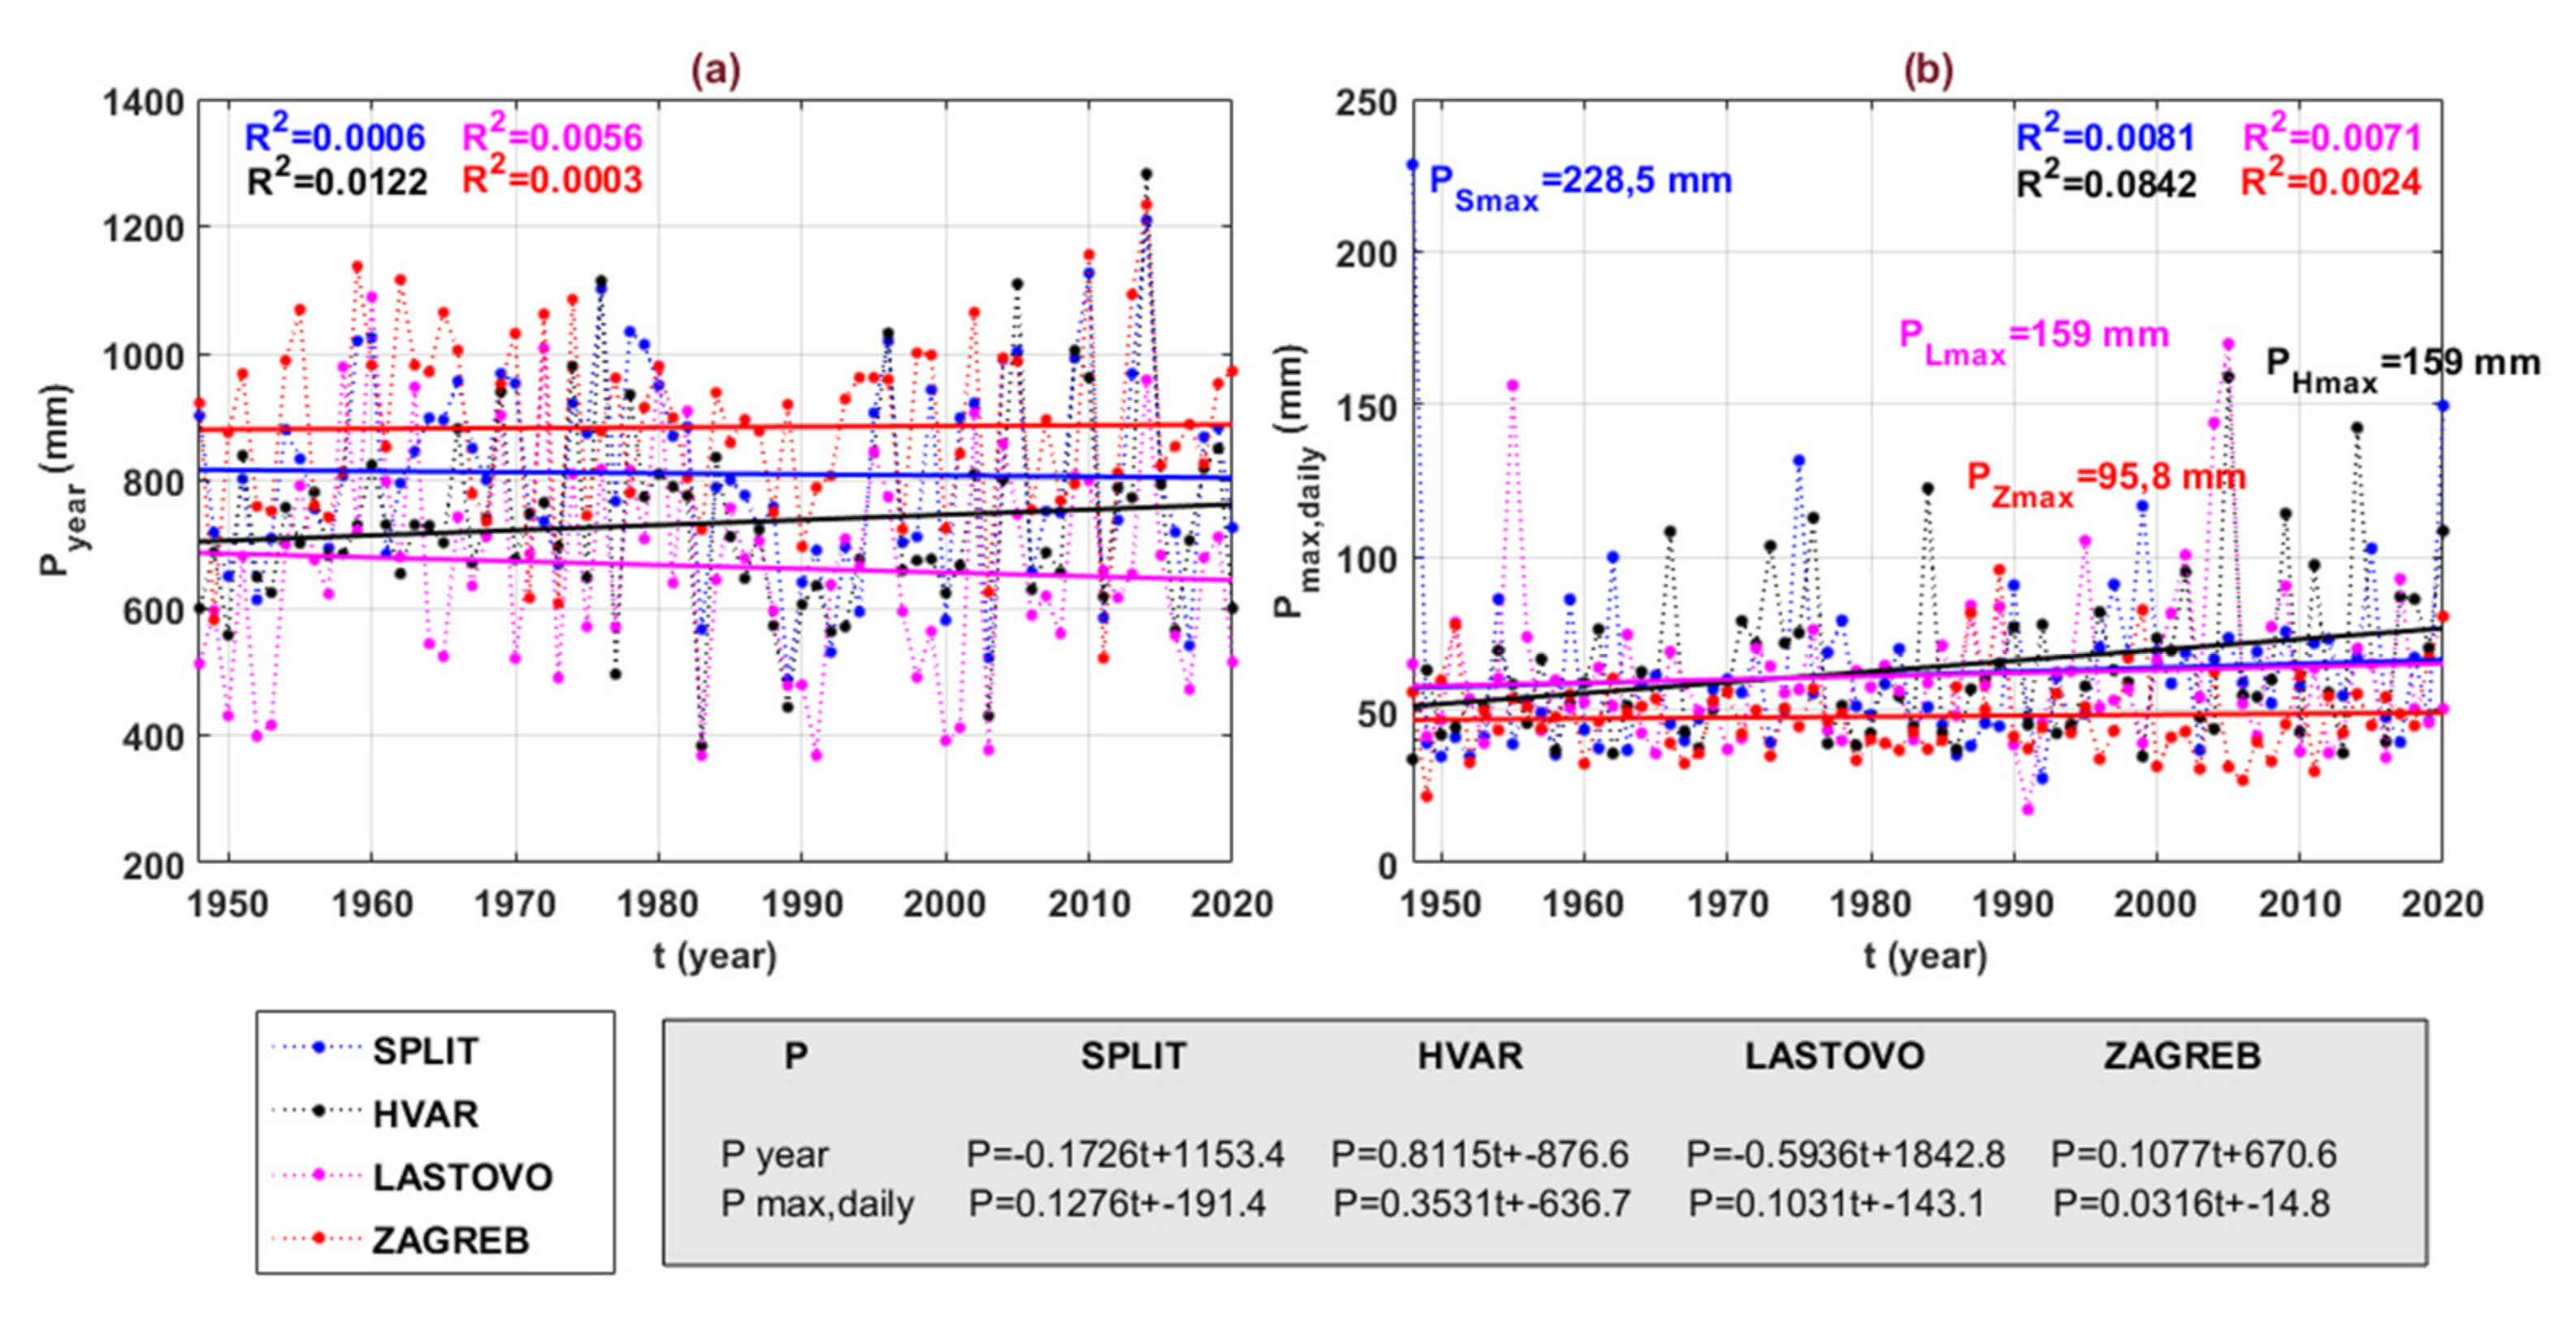
3.1. The Year as a Time Unit of Analyses

The sequences of annual precipitation measured at the four stations analyzed during the period of 1948–2020 are shown graphically in Figure 4a. The figure shows linear trends as well as the corresponding linear regression equations and the square of the linear correlation coefficients R2. At none of the stations are the trends statistically significant, although there is an upward trend at Hvar and a downward trend at the other three stations. The highest values of annual precipitation at the stations Split, Hvar and Zagreb occurred in 2014, while at Lastovo, it happened in 1960.
Table 2 shows some characteristic values of the precipitation time series observed at the four stations analysed. On average, the most precipitation falls annually in Zagreb, which is in a continental climate, and then in Split, Hvar and Lastovo. At the three stations located in the range of the Mediterranean climate, the distance from the mainland plays an important role in the amount of annual precipitation. The situation regarding the maximum daily precipitation in a year is different. In the Mediterranean climate, this precipitation is much higher than in Zagreb. The standard deviations, Std, and the coefficients of variation, CV, of the precipitation series at the stations in the Mediterranean climate are significantly higher than at the Zagreb station, indicating their much greater variability over time, although the total annual precipitation is lower.
The series of maximum daily precipitations observed in each year during the period of 1948–2020 at the four analysed stations are shown in Figure 4b. The figure shows linear trends as well as the corresponding linear regression equations and the square of the linear correlation coefficients R2. Upward trends can be observed at all four stations, although the trend is statistically significant only at Hvar. The highest values of maximum daily precipitation in the analysed period occurred at the Split station in 1948 (228.5 mm), at the Hvar (159.0 mm) and Lastovo (169.8 mm) stations in 2005, and at the Zagreb station (95.8 mm) in 1989.
Table 3 shows the values of total annual precipitation and maximum daily precipitation in a year, P (mm), calculated for return periods of 50, 100, 200 and 500, T (years) using the GEV method. In Table 4, each maximum value of annual or daily precipitation over the period of 73 years that were analysed is associated with the value of the return period calculated with the GEV method.
This paper analyses the trends in the series of the number of days of precipitation per year, N, in the following five categories: (1) P ≥ 0.0 mm, (2) P ≥ 4.0 mm, (3) P ≥ 10.0 mm, (4) P ≥ 16.0 mm, and (5) P ≥ 32.0 mm. Figure 5a shows the sequences of the number of precipitation days per year, N, with P ≥ 0.0 mm for all four stations. Importantly, a statistically significant decreasing trend is evident at all stations. It is obvious that the number of days with the occurrence of some kind of precipitation from the trace (“precipitation trace”, the unmeasurable precipitation amount in a period of observation by standard instruments; it is different than a period without precipitation) to the maximum is significantly reduced. The trend lines are plotted in the figure, and the linear regression equations are shown with the corresponding squares of the linear correlation coefficients, R2. The lowest average decrease is in Lastovo, where it was 0.1192 days per year (14.5 days in the 73 years analysed), and the highest in Zagreb, where it was 0.3848 days per year (28.1 days in the 73 years analysed).
Figure 5b shows the series of days with precipitation per year, N, with P ≥ 4.0 mm for the four analyzed stations. Decreasing trends also occur in this category at all the analysed stations, but they are not statistically significant at any station. The strongest decrease is observed on Hvar and in Zagreb, the smallest on Lastovo.
The trends in the series of days per year, N, with precipitation, P ≥ 10.0 mm, shown in Figure 5c, were not statistically significant at any of the stations analyzed. They are decreasing at the stations Split and Lastovo, but slightly increasing at Hvar and Zagreb. The trends of the number of days per year, N, with precipitation, P ≥ 16.0 mm, are decreasing only at the Lastovo station, while they are slightly increasing at the other three stations (Figure 5d). The trends of the increasing number of days per year, N, with precipitation, P ≥ 32.0 mm (Figure 5e) in Hvar are statistically significant, while they are not statistically significant in Split and Zagreb. At the Lastovo station, the trend is decreasing.
Table 5 summarizes all M-K test results for series of days per year, N, for the five categories of precipitation greater than a given value. The general conclusion is that the number of days, N, with precipitation, P ≥ 4.0 mm, and lower decreases at all four stations. In contrast, the number of days per year, N, with precipitation, P ≥ 16.0 mm, and higher increases at all stations except Lastovo. From the previous analysis, it can be concluded that in the last 73 years there has been a slow process of decrease in the number of days with precipitation and an intensification of precipitation in both climatic regions.
The following series of sums of annual precipitation, ΣP, is greater than (1) P ≥ 4.0 mm; (2) P ≥ 10.0 mm; (3) P ≥ 16.0 mm; and (4) P ≥ 32.0 mm. Figure 6a shows four series of sums of annual precipitation, ΣP, greater than, P ≥ 4.0 mm. The figure shows linear trends and the linear regression equations with the corresponding squares of the linear correlation coefficients, R2. Linear trends at Split, Hvar and Zagreb stations are upward, while the trend at Lastovo station is downward. The trends are not statistically significant in any of the cases. Figure 6b shows the series of sums of annual precipitation ΣP, greater than, P ≥ 10.0 mm. The linear trends at Split, Hvar and Zagreb stations are upward, while the trend at Lastovo station is downward. The trends are not statistically significant in any of the cases. Figure 6c shows the series of sums of annual precipitation, ΣP, greater than, P ≥ 16.0 mm. Linear trends at Split, Hvar and Zagreb stations are upward, while the trend at Lastovo station is downward. The upward trend of the series at Hvar station is statistically significant, while for the other three stations, the trends are not statistically significant. Figure 6d shows the series of sums of annual precipitation, ΣP, greater than P ≥ 32.0. The linear trends at all four stations are upward, with none of the trends being statistically significant. This analysis also shows a redistribution of the precipitation regime and an increase in the proportion of higher intensity precipitation in the annual total.
The above conclusion was further confirmed by analysing the series of percentages of annual precipitation, ΣP%,i, and, greater than (1) P ≥ 4.0 mm, (2) P ≥ 10.0 mm, (3) P ≥ 16.0 mm, and (4) P ≥ 32.0 mm. The arithmetical expression, ΣP%,i, is:
ΣP%,i = 100 × (ΣPi/Pyear,i)
where ΣP%,i denotes the sum of precipitation in the year (mm) and is greater than some of the selected values, while Pyear,i denotes the total precipitation that falls in the year (mm).
Figure 7a shows the percentages of precipitation, ΣP%, greater than, P ≥ 4.0 mm. The figure shows linear trends and the linear regression equations with the corresponding squares of the linear correlation coefficients, R2. Trends at all stations are upward, while the trends at Split and Zagreb stations are statistically significant. Figure 7b shows the percentages of precipitation, ΣP%, greater than P ≥ 10.0 mm. Trends at all stations are upward, while the trends at Hvar and Zagreb stations are statistically significant. Figure 7c shows the percentages of precipitation, ΣP%, greater than P ≥ 16.0 mm. Trends at all stations are upward, while the trends at Hvar station are statistically significant. Figure 7d shows the percentages of precipitation, ΣP%, greater than P ≥ 32.0 mm. The linear trends at all four stations are upward, with none of the trends being statistically significant.
The overall summary of the results of the M-K tests, p, performed on the series shown in Figure 6 and Figure 7 are presented in Table 6. From this overview, it can be seen that there is a trend of increasing precipitation at higher intensities at all four analysed stations.

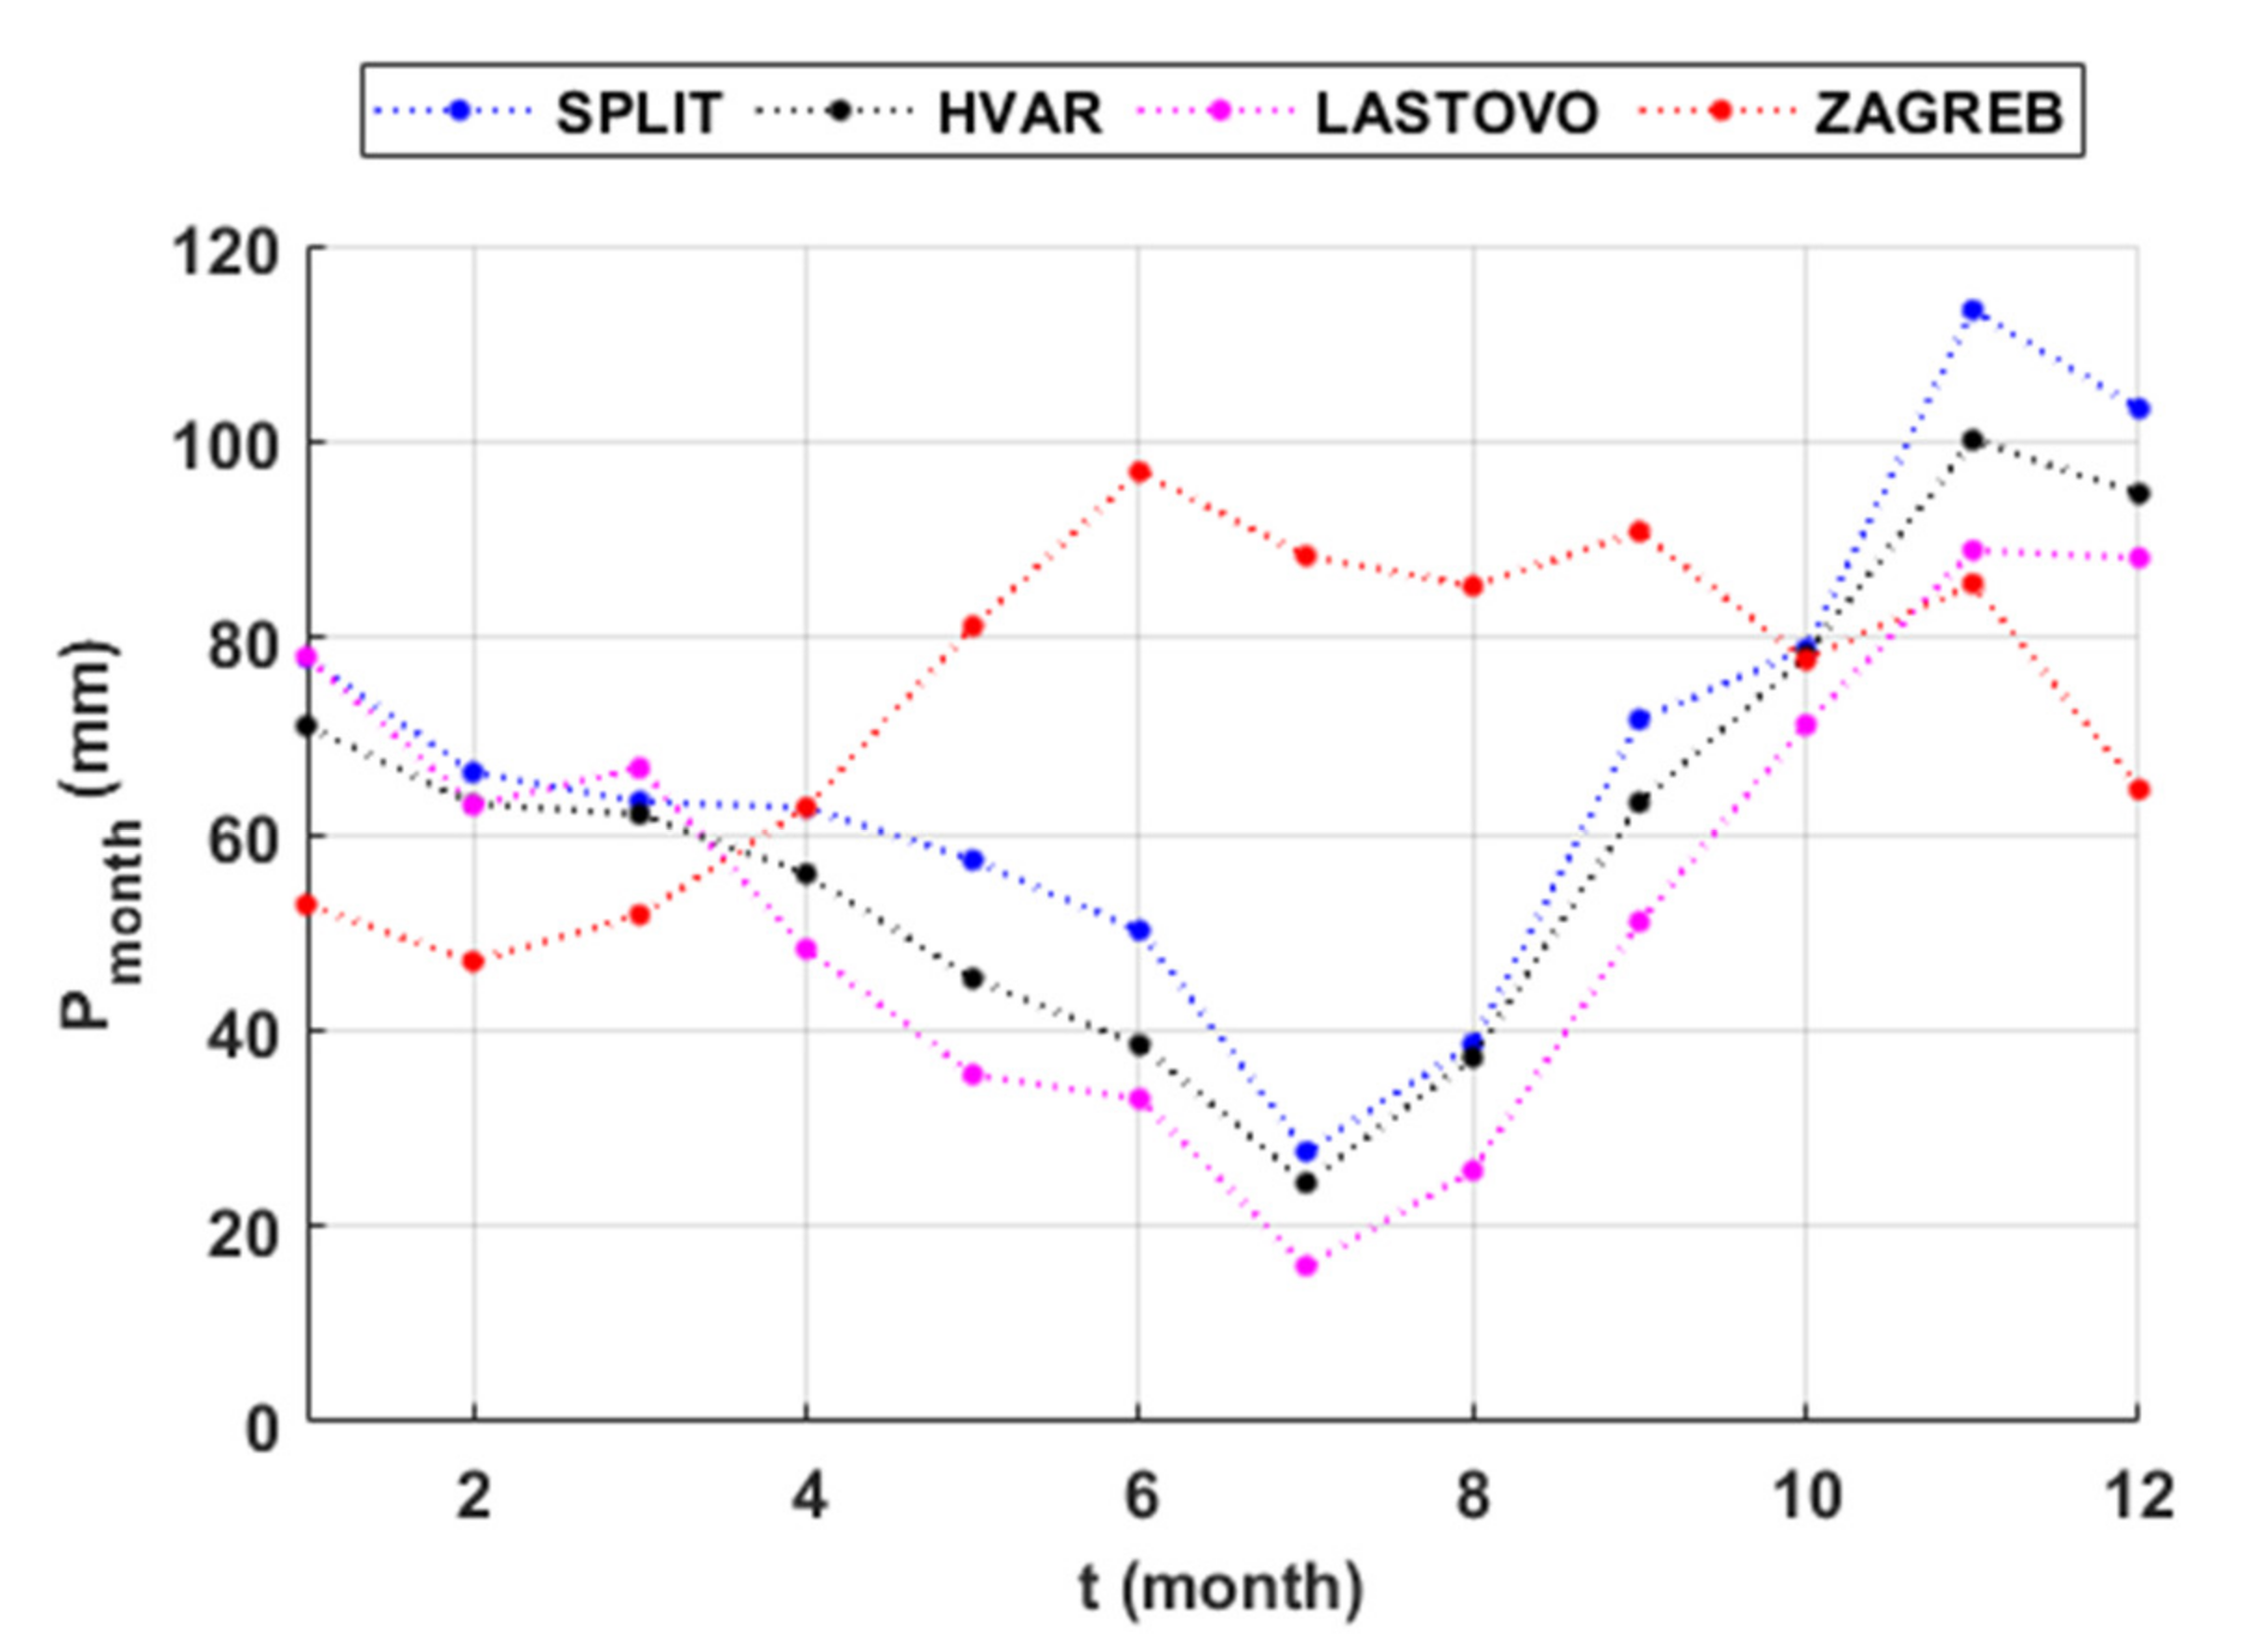
3.2. The Month as a Time Unit of Analyses

The graphical representation of the average monthly precipitation at the four analysed stations during the period of 1948–2020 shows a significant difference in precipitation regime during the year between the Mediterranean and continental climates (Figure 8). In the Mediterranean climate, minimal precipitation occurs during the warm season, and the minimum value is reached during the warmest month of the year, in July. In the continental climate in Zagreb, the minima occur during the winter period, and the lowest value is reached in February. From the point of view of agricultural production, but also of the population’s water supply, the annual rainfall in the Mediterranean climate is very unfavourable, especially because in summer in this area the water demand is much higher than in the rest of the year, both for agriculture and much more for tourism.
In an attempt to determine changes in the precipitation regime over the months of the year, precipitation trends were calculated for each month of the year over the period of 1948–2020. Table 7 lists the results of the M-K test, p. Statistically, significant growth trends occurred only in October at the Split and Zagreb stations. It can be seen that the trends of increase and/or decrease in monthly precipitation vary from station to station. It is difficult to discern any regularity from this overview.

4. Conclusions

The analyses carried out in this work showed slight tendencies in the intensification of the precipitation regime at the four analysed stations, three of which are located in a Mediterranean climate (Split, Hvar and Lastovo) and one (Zagreb) in a continental climate. This intensification is expressed in a decrease in the number of days per year with precipitation greater than the selected categories and in an increase in precipitation greater than 16.0 mm.
Change in spatiotemporal precipitation properties due to the ongoing climate change can be identified on different scales and different resolutions. Even with four different measuring points, analysis on registered precipitation patterns can help to understand the significance of ramifications caused by global climate change on to hydrological regime.
In addition to global warming and belonging to different climatic zones, the four analysed stations were significantly influenced by the fact that Lastovo, for example, is located on a small island in the open Adriatic Sea. Hvar is also located on a small island, although much closer to the mainland, while Split is located on the mainland and in a relatively large city. Zagreb station is located on a hill in the centre of the big city. The influences of the sea and urbanisation have certainly contributed to different changes in precipitation at different time scales over the 73 years analysed. However, the similarities in the trends cannot be overlooked.
The Mediterranean area is recognised as a hot spot for climate change [6]. Changes in the precipitation regime in the Mediterranean are a very exciting and important topic in numerous papers [4,6,9,12,13,14,37,38,39,40,41]. The authors hope that this work will contribute to the solution of the extremely complex and very important topic of changes in the precipitation regime, especially in the Mediterranean region.

Author Contributions

Conceptualization, investigation, and writing of the original draft, O.B.; data curation and validation, review and editing, I.A.; supervision, editing, and validation, investigation, visualisation, and data curation, A.V.; statistical calculations and review, D.B. All authors have read and agreed to the published version of the manuscript.

Funding

This research was supported through project KK.05.1.1.02.0024 “VODIME-Waters of Imotski region”, a project financed by the Croatian Government and the European Union through the European Structural Fund—within the call “Strengthening the applied research for climate change adaptation measures” KK.05.1.1.02. This research was partially supported through project KK.01.1.1.02.0027, a project co-financed by the Croatian Government and the European Union through the European Regional Development Fund—the 572 Competitiveness and Cohesion Operational Programme, contract number: KK.01.1.1.02.0027.

Institutional Review Board Statement

Not applicable.

Informed Consent Statement

Not applicable.

Acknowledgments

The data used in this study was provided courtesy of the Croatian Meteorological and Hydrological Service, for which we thank them.

Conflicts of Interest

The authors declare no conflict of interest.

References

  1. Casanueva, A.; Rodriguez-Puebla, C.; Frías, M.D.; Gonzalez-Reviriego, N. Variability of extreme precipitation over Europe and its relationships with teleconnection patterns. Hydrol. Earth Syst. Sci. 2014, 18, 709–725. [Google Scholar] [CrossRef] [Green Version]
  2. Balling, R.C.; Kiany, M.S.K.; Roy, S.S.; Khoshhal, J. Trends in Extreme Precipitation Indices in Iran: 1951–2007. Adv. Meteorol. 2016, 2016, 1–8. [Google Scholar] [CrossRef] [Green Version]
  3. de-Lima, M.I.P.; Santo, F.E.; Ramos, A.M.; de-Lima, J.L.M.P. 2013 Recent changes in daily precipitation and surface air temperature extremes in mainland Portugal, in the period 1941–2007. Atmos. Res. 2013, 127, 195–209. [Google Scholar] [CrossRef]
  4. Mathbout, S.; Lopez-Bustins, J.A.; Royé, D.; Martin-Vide, J.; Bech, J.; Rodrigo, F.S. Observed Changes in Daily Precipitation Extremes at Annual Timescale Over the Eastern Mediterranean During 1961–2012. Pure Appl. Geophys. PAGEOPH 2017, 175, 3875–3890. [Google Scholar] [CrossRef]
  5. Moberg, A.; Jones, P.D. Trends in indices for extremes in daily temperature and precipitation in central and western Europe, 1901–1999. Int. J. Clim. 2005, 25, 1149–1171. [Google Scholar] [CrossRef]
  6. Nouaceur, Z.; Murarescu, O. Rainfall Variability and Trend Analysis of Annual Rainfall in North Africa. Int. J. Atmos. Sci. 2016, 2016, 1–12. [Google Scholar] [CrossRef]
  7. Alpert, P.; Ben-Gai, T.; Baharad, A.; Benjamini, Y.; Yekutieli, D.; Colacino, M.; Diodato, L.; Ramis, C.; Homar, V.; Romero, R.; et al. The paradoxical increase of Mediterranean extreme daily rainfall in spite of de-crease in total values. Geophys. Res. Lett. 2002, 29, 31-1–31-4. [Google Scholar] [CrossRef] [Green Version]
  8. Abbasnia, M.; Toros, H. Trend analysis of weather extremes across the coastal and non-coastal areas (case study: Turkey). J. Earth Syst. Sci. 2020, 129, 1–13. [Google Scholar] [CrossRef]
  9. Ramos, M.C.; Martinez-Casasnovas, J.A. Trends in Precipitation Concentration and Extremes in the Mediterranean Penedès-Anoia Region, Ne Spain. Clim. Chang. 2006, 74, 457–474. [Google Scholar] [CrossRef]
  10. Asfaw, A.; Simane, B.; Hassen, A.; Bantider, A. Variability and time series trend analysis of rainfall and temperature in northcentral Ethiopia: A case study in Woleka subbasin. Weather. Clim. Extrem. 2018, 19, 29–41. [Google Scholar] [CrossRef]
  11. Hu, Q.; He, X.; LU, X.-A.; Zhang, X. Trend analysis of seasonal precipitation (1960–2013) in subregions of Hunan Prov-ince, Central South China using discrete wavelet transforms. J. Appl. Meteorol. Climatol. 2019, 58, 2159–2175. [Google Scholar] [CrossRef]
  12. Oikonomou, C.; Flocas, H.; Hatzaki, M.; Giannakopoulos, C. Future changes in the occurrence of extreme precipitation events in Eastern Mediterranean. Glob. NEST J. 2008, 10, 255–262. [Google Scholar]
  13. Hertig, E.; Seubert, S.; Paxian, A.; Vogt, G.; Paeth, H.; Jacobeit, J. Changes of total versus extreme precipitation and dry periods until the end of the twenty-first century: Statistical assessments for the Mediterranean area. Theor. Appl. Clim. 2012, 111, 1–20. [Google Scholar] [CrossRef]
  14. Fiorillo, F.; Petitta, M.; Preziosi, E.; Rusi, S.; Espositi, L.; Tallini, M. Long-term trend and fluctuations of karst spring dis-charge in a Mediterranean area (central-southern Italy). Environ. Earth Sci. 2015, 74, 153–172. [Google Scholar] [CrossRef]
  15. Trenberth, K. Changes in precipitation with climate change. Clim. Res. 2011, 47, 123–138. [Google Scholar] [CrossRef] [Green Version]
  16. Moustakis, Y.; Papalexiou, S.M.; Onof, C.J.; Paschalis, A. Seasonality, Intensity, and Duration of Rainfall Extremes Change in a Warmer Climate. Earth’s Future 2021, 9, 1–15. [Google Scholar] [CrossRef]
  17. Gajić-Čapka, M. Stationarity, trend and periodicity of precipitation at the Zagreb-Grič Observatory from 1862 to 1990. Hrvat. Meteorološki Časopis 1992, 27, 1–10. [Google Scholar]
  18. Bonacci, O.; Matešan, D. Analysis of precipitation appearance in time. Hydrol. Process. 1999, 13, 1683–1690. [Google Scholar] [CrossRef]
  19. Bonacci, O. Air temperature and precipitation analyses on a small Mediterranean island: The case of the remote island of Lastovo (Adriatic Sea, Croatia). Acta Hydrotech. 2019, 32, 135–150. [Google Scholar] [CrossRef]
  20. Bonacci, O.; Roje-Bonacci, T. Analiza dnevnih, mjesečnih i godišnjih oborina Zagreb Griča (1862.-2017.) za potrebe inženjerske hidrologije. Hrvat. Vode 2019, 27, 7–20. [Google Scholar]
  21. Bonacci, O. Increase of mean annual surface air temperature in the Western Balkans during last 30 years. Vodoprivreda 2012, 44, 75–89. [Google Scholar]
  22. Bonacci, O.; Patekar, M.; Pola, M.; Roje-Bonacci, T. Analyses of climate variations at four meteorological stations on re-mote islands in the Croatian part of the Adriatic Sea. Atmosphere 2020, 11, 1044. [Google Scholar] [CrossRef]
  23. Radić, V.; Pasarić, N.; Šinik, N. Analiza zagrebačkih klimatoloških nizova pomoću empirijski određenih prirodnih sastavnih funkcija. Geofizika 2004, 21, 15–36. [Google Scholar]
  24. Pandžić, K.; Likso, T. Homogeneity of average annual air temperature time series for Croatia. Int. J. Clim. 2009, 30, 1215–1225. [Google Scholar] [CrossRef]
  25. Pandžić, K.; Likso, T.; Curić, O.; Mesić, M.; Pejić, I.; Pasarić, Z. Drought indices for the Zagreb-Grič Observatory with an overview of drought damage in agriculture in Croatia. Theor. Appl. Clim. 2020, 142, 1–13. [Google Scholar] [CrossRef]
  26. Jenkinson, A.F. The frequency distribution of the annual maximum (or minimum) values of meteorological elements. Q. J. R. Meteorol. Soc. 1955, 81, 158–171. [Google Scholar] [CrossRef]
  27. Gajić-Čapka, M. Metode Klimatološke Analize Kratkotrajnih Oborina Velikog Intenziteta. Ph.D. Thesis, Zagreb University, Zagreb, Croatia, 2000. [Google Scholar]
  28. Mann, H.B. Non-parametric test of randomness against trend. Econometrica 1945, 13, 245–259. [Google Scholar] [CrossRef]
  29. Kendall, M.G. Rank Correlation Methods, 4th ed.; Charles Griffin: London, UK, 1975. [Google Scholar]
  30. Hamed, K.H.; Ramachandra, R.A. Modified Mann-Kendal trend test for autocolerrated data. J. Hydrol. 1998, 204, 182–196. [Google Scholar] [CrossRef]
  31. Mohsin, T.; Gough, W.A. Trend analysis of long-term temperature time series in the Greater Toronto Area (GTA). Theor. Appl. Clim. 2009, 101, 311–327. [Google Scholar] [CrossRef]
  32. Allen, S.M.J.; Gough, W.A.; Mohsin, T. Changes in the frequency of extreme temperature records for Toronto, Ontario, Canada. Theor. Appl. Clim. 2015, 119, 481–491. [Google Scholar] [CrossRef]
  33. Hori, Y.; Gough, W.A.; Butler, K.; Tsuji, L.J. Trends in the seasonal length and opening dates of a winter road in the western James Bay region, Ontario, Canada. Theor. Appl. Clim. 2016, 129, 1309–1320. [Google Scholar] [CrossRef]
  34. Wang, H.; Stephenson, S.R. Quantifying the impacts of climate change and land use/cover change on runoff in the lower Connecticut River Basin. Hydrol. Process. 2018, 32, 1301–1312. [Google Scholar] [CrossRef]
  35. Husain Shourov, M.M.; Mahmud, I. pyMannKendall: A python package for non parametric Mann Kendall family of trend tests. J. Open Source Softw. 2019, 4, 1556. [Google Scholar] [CrossRef]
  36. Gough, W.A. Impact of Urbanization on the Nature of Precipitation at Toronto, Ontario, Canada. J. Appl. Meteorol. Clim. 2021, 60, 425–435. [Google Scholar] [CrossRef]
  37. Thompson, R.; Green, D.N. Mediterranean precipitation and its relationship with sea level pressure patterns. Ann. Geophys. 2009, 47, 1617–1633. [Google Scholar] [CrossRef]
  38. Ben-Gai, T.; Bitan, A.; Manes, A.; Alpert, P.; Rubin, S. Spatial and Temporal Changes in Rainfall Frequency Distribution Patterns in Israel. Theor. Appl. Clim. 1998, 61, 177–190. [Google Scholar] [CrossRef]
  39. Deitch, M.J.; Michele, J.; Sapundjieff, M.J.; Feirer, S.T. Characterizing precipitation variability and trends in the world’s Mediterranean-Climate areas. Water 2017, 9, 259. [Google Scholar] [CrossRef] [Green Version]
  40. Alpert, P.; Halfon, N.; Levin, Z. Does Air Pollution Really Suppress Precipitation in Israel? J. Appl. Meteorol. Clim. 2008, 47, 933–943. [Google Scholar] [CrossRef]
  41. Brogli, R.; Sørland, S.L.; Kröner, N.; Schär, C. Causes of future Mediterranean precipitation decline depend on the season. Environ. Res. Lett. 2019, 14, 114017. [Google Scholar] [CrossRef]
  42. Yang, P.; Ren, G.; Yan, P.; Deng, J. Urbanization reduces frequency of light rain: An example from Beijing City. Theor. Appl. Clim. 2021, 145, 763–774. [Google Scholar] [CrossRef]
  43. Šegota, T.; Filipčić, A. Köppenova podjela klima i hrvatsko nazivlje. Geoadria 2017, 8, 17–37. [Google Scholar] [CrossRef] [Green Version]
  44. Köppen, W.; Geiger, R. Handbuch der Klimatologie: Das geographische System der Klimate; Verlag vod Gebrüder Borntraeger: Berlin, Germany, 1936. [Google Scholar]
  45. Gajić-Čapka, M. Varijabilnost prosječnog oborinskog režima šire zagrebačke regije. Rasprave 1982, 17, 23–40. [Google Scholar]
  46. Millington, N.; Das, S.; Simonovic, S.P. The Comparison of GEV, Log-Pearson Type 3 and Gumbel Distributions in the Upper Thames River Watershed under Global Climate Models; Department of Civil and Environmental Engineering, The University of Western Ontario: London, ON, Canada, 2011. [Google Scholar]
Figure 1. Study area map.
Atmosphere 12 00885 g001
Figure 2. Cumulative distribution functions of the maximum daily precipitation values for the four measuring stations, determined with Gumbel, Weibull and GEV distribution.
Atmosphere 12 00885 g002
Figure 3. Cumulative distribution functions of the annual precipitation values for the four measuring stations, determined with Gumbel, Weibull and GEV distribution.
Atmosphere 12 00885 g003
Figure 4. (a) Annual precipitation time series. (b) Maximum annual daily precipitation time series.
Atmosphere 12 00885 g004
Figure 5. Time series of the number of days in a year, N, with precipitation, P ≥ 0.0 mm (a), P ≥ 4.0 mm (b), P ≥ 10.0 mm (c), P ≥ 16.0 mm (d) and P ≥ 32.0 mm (e).
Atmosphere 12 00885 g005
Figure 6. Time series of the sum of precipitations in a year, ΣP, with precipitation, P ≥ 4.0 mm (a), P ≥ 10.0 mm (b), P ≥ 16.0 mm (c) and P ≥ 32.0 mm (d).
Atmosphere 12 00885 g006
Figure 7. Time series of the sum of the percent of precipitations in a year, ΣP%, with precipitation, P ≥ 4.0 mm (a), P ≥ 10.0 mm (b), P ≥ 16.0 mm (c) and P ≥ 32.0 mm (d).
Atmosphere 12 00885 g007
Figure 8. Graphical presentation of average monthly precipitations measured at the four analysed stations during the 1948–2020 period.
Atmosphere 12 00885 g008
Table 1. Characteristics of four investigated meteorological stations.
StationSPLITHVARLASTOVOZAGREB
Type of StationAMS, MMSAMS, MMSAMS, MMSAMS, MMS
H (m a.s.l.)12220186157
Latitude43°30′30″43°10′16″42°46′06″45°48′52″
Longitude16°25′35″16°26′13″16°54′00″15°58′19″
AMS = Automated Meteorological Stations. MMS = Main Meteorological Stations.
Table 2. Matrix of characteristic values, average, Pav (mm), minimum, Pmin, maximum, Pmax, range, R, annual and maximum annual daily time series standard deviation, Std, a coefficient of variation, CV, at four analysed stations.
StationSPLITHVARLASTOVOZAGREB
YearPav 810.8733.4665.0884.2
Pmin486.6383.7368.0520.8
Pmax1208.91282.31088.61233.8
R = Pmax − Pmin722.3898.6720.6713.0
Std155.2155.9168.0144.3
CV19.121.325.316.3
Max. DailyPav61.763.961.447.9
Pmin27.633.817.421.7
Pmax228.5159169.895.8
R = Pmax − Pmin200.9125.2152.474.1
Std30.025.825.913.8
CV48.640.442.228.8
Table 3. Matrix of precipitations, P (mm), and their return periods, T (year), calculated for the four analysed stations time series of whole annual and maximum annual daily precipitations (1948–2020) using GEV distribution.
P (mm)T (Year)SPLITHVARLASTOVOZAGREB
Year501130.51104.81025.21167.2
1001167.11164.61072.11194.9
2001197.81219.81112.71217.1
5001230.91286.41158.41240.1
Max. Daily50146.2154.3125.682.5
100176.6187.5141.589.4
200212.9227.6158.296.2
500272.1293.6181.4104.9
Table 4. Matrix of precipitations, P (mm), and their return periods, T (year), calculated for maximum annual and maximum annual daily precipitations measured at the four analysed stations in the 1948–2020 period, using GEV distribution.
SPLITHVARLASTOVOZAGREB
Pmax (mm)T
(year)
Pmax (mm)T
(year)
Pmax (mm)T
(year)
Pmax (mm)T
(year)
Year1208.92631282.34761088.61321233.8385
Max.
Daily
228.5263159.056169.832395.8192
Table 5. Matrix with the results of the probability of the Mann–Kendall test, p (M-K).
p (M-K)SPLITHVARLASTOVOZAGREB
N ≥ 0.0<0.01<0.01<0.05<0.01
N ≥ 4.0>0.05>0.05>0.05>0.05
N ≥ 10.0>0.05>0.05>0.05>0.05
N ≥ 16.0>0.05>0.05>0.05>0.05
N ≥ 32.0>0.05<0.05>0.05>0.05
Blue, bold italic numbers designate statistically significant decreasing trends; blue numbers designate statistically insignificant decreasing trends; red, bold italic numbers designate statistically significant increasing trends; red numbers designate statistically insignificant increasing trends.
Table 6. Matrix with the results of the probability of the Mann–Kendall test, p (M-K).
p (M-K) SPLITHVARLASTOVOZAGREB
P ≥ 4.0 mmΣP (mm)>0.05>0.05>0.05>0.05
ΣP (%)<0.05>0.05>0.05<0.05
P ≥ 10.0 mmΣP (mm)>0.05>0.05>0.05>0.05
ΣP (%)>0.05<0.05>0.05<0.05
P ≥ 16.0 mmΣP (mm)>0.05>0.05>0.05>0.05
ΣP (%)>0.05<0.05>0.05>0.05
P ≥ 32.0 mmΣP (mm)>0.05>0.05>0.05>0.05
ΣP (%)>0.05>0.05>0.05>0.05
Blue numbers designate statistically insignificant decreasing trends; bold italic numbers designate statistically significant increasing trends; red numbers designate statistically insignificant increasing trends.
Table 7. Matrix with the results of the probability of the Mann–Kendall test, p (M-K).
p (M-K)SPLITHVARLASTOVOZAGREB
January>0.05>0.05>0.05>0.05
February>0.05>0.05>0.05>0.05
March>0.05>0.05>0.05>0.05
April>0.05>0.05>0.05>0.05
May>0.05>0.05>0.05>0.05
June>0.05>0.05>0.05>0.05
July>0.05>0.05>0.05>0.05
August>0.05>0.05>0.05>0.05
September>0.05>0.05>0.05>0.05
October<0.05>0.05>0.05<0.05
November>0.05>0.05>0.05>0.05
December>0.05>0.05>0.05>0.05
Blue numbers designate statistically insignificant decreasing trends; bold italic numbers designate statistically significant increasing trends; red numbers designate statistically insignificant increasing trends.
Publisher’s Note: MDPI stays neutral with regard to jurisdictional claims in published maps and institutional affiliations.

